Introduction
Thyroid carcinoma is the most common malignancy of
the head and neck, and accounts for 91.5% of all endocrine
malignancies (1). Its prevalence
increased from 4.8 to 15.0 per 100,000 between 1975 and 2014
(2). In the thyroid carcinomas,
70–80% of them are pathologically diagnosed as papillary thyroid
carcinomas (PTCs) (3). The incidence
rate of PTC has been increasing rapidly worldwide over the past
three decades (4). Although PTC has
a favorable prognosis, certain cases exhibit aggressive clinical
characteristics, including invasion, metastasis, recurrence or drug
resistance (5). However, the
clinical symptoms of early-stage PTC are usually absent or
nonspecific. Various methods are currently used for PTC diagnosis,
including sonography, CT, MRI, fine-needle aspiration and
cytological examination, though diagnostic tests require
improvement to achieve better accuracy (6). Recently, molecular biomarkers have been
considered as promising approaches for PTC diagnosis, and
understanding the molecular mechanism of this type of cancer may
also aid in determining its pathogenesis, thus improving disease
management (7).
Several molecular events and biological processes
have been identified to serve critical roles in PTC tumorigenesis,
progression and metastasis, including genetic or epigenetic
alterations, non-coding RNAs, apoptosis, autophagy and the
epithelial-to-mesenchymal transition (EMT) (8). For instance, C-X-C motif chemokine
ligand 12 contributes to the development of PTC, syndecan-4 gene
silencing leads to cell apoptosis and cadherin 6 (CDH6) has been
reported to promote PTC metastasis through autophagy suppression
(9–11). However, despite notable research
progress, the mechanisms underlying PTC tumorigenesis remain
elusive. A more detailed understanding of the gene changes,
molecular impacts, protein interactions and signaling pathways
involved in PTC may aid in the development of novel therapeutic
approaches.
In recent years, high-throughput technology,
including DNA microarray and RNA sequencing, has been used in
cancer research to monitor thousands of targets simultaneously
(12). A number of independent
studies have applied microarrays to identify gene alterations in
PTC (2,13,14),
though, to the best of our knowledge, few integrated analyses have
been conducted to screen for common gene alterations. Therefore, in
the present study, the key genes associated with PTC were screened
using bioinformatics analysis of four publicly available datasets.
In addition, in order to understand disease pathogenesis and
identify potential biomarkers, Gene Ontology (GO) and pathway
analyses were performed. Furthermore, a protein-protein interaction
(PPI) network was constructed in order to screen out central genes,
and a receiver operating characteristic (ROC) curve analysis was
performed to evaluate the predictive accuracy of differentially
expressed genes (DEGs).
Materials and methods
Dataset selection and description
In order to identify DEGs in PTC, several datasets
were analyzed in the Gene Expression Omnibus (GEO) database
(https://www.ncbi.nlm.nih.gov/geo/)
(15). GSE33630 (dataset 1)
(16) included 49 PTC and 45 healthy
tissue samples, GSE27155 (dataset 2) (17) contained 51 PTC and four healthy
samples, GSE3467 (dataset 3) (18)
contained nine PTC and nine healthy samples and GSE3678 (dataset 4)
(19) comprised of seven PTC and
matched healthy tissues. The HG-U133 Plus 2 platform (Affymetrix
Human Genome U133 Plus 2.0 Array) was used for profiling these four
datasets. The selection of these four datasets was based on the
following inclusion criteria: i) Use of the same detection
platform; ii) inclusion of both PTC and normal tissues; iii)
accessibility to the original data. The exclusion criteria were: i)
The use of different detection platforms; and ii) analysis of cell
line samples and not tissues. Therefore, the four aforementioned
datasets were ultimately enrolled to screen key genes in PTC.
Data preprocessing and differential
expression analyses
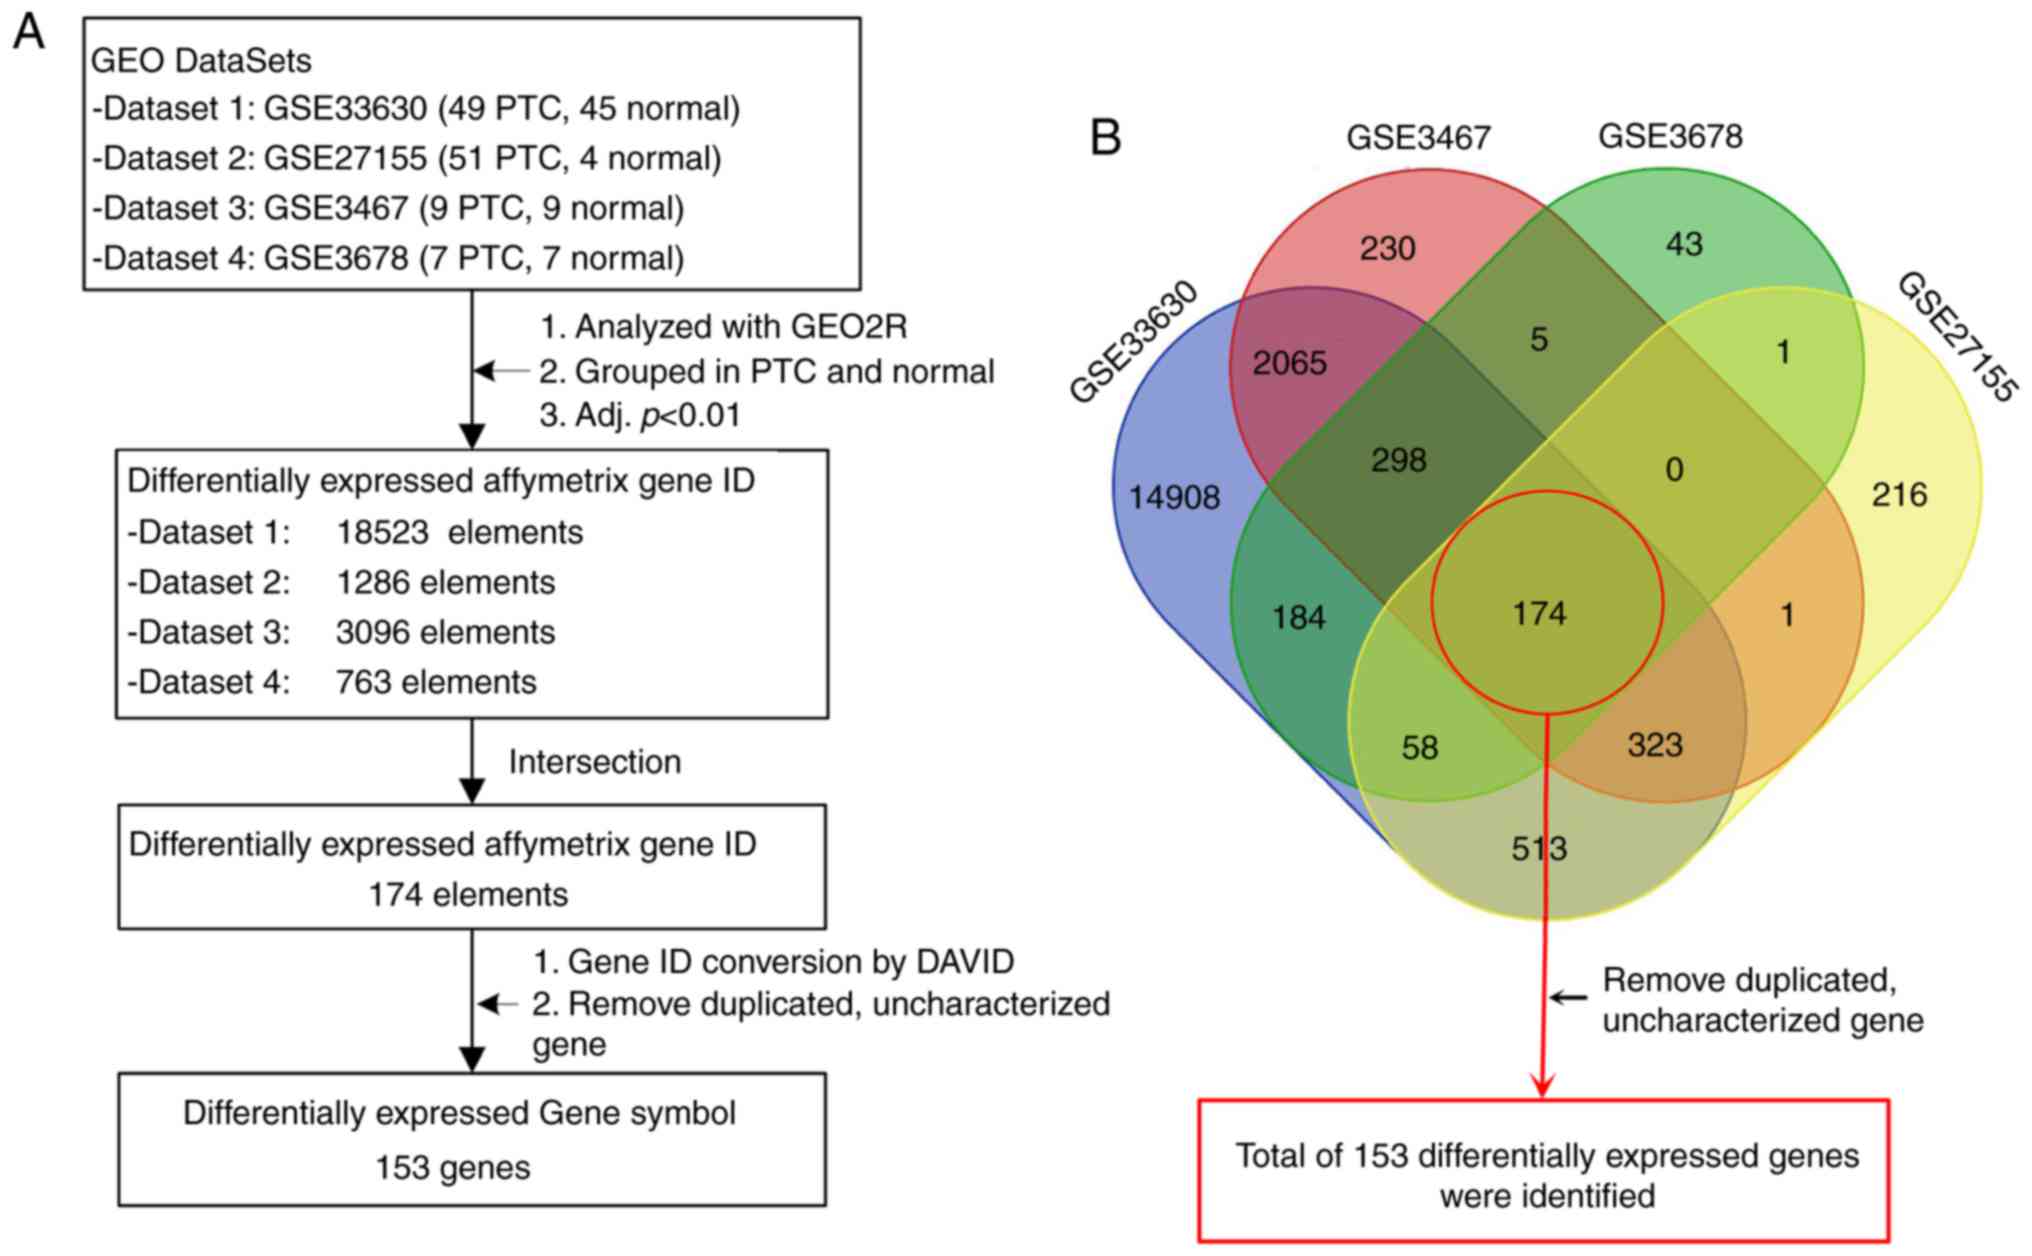
The gene screening strategy is presented in Fig. 1A. GEO2R (http://www.ncbi.nlm.nih.gov/geo/geo2r), an online
tool, was used separately for each dataset to identify genes that
were differentially expressed in PTC. After obtaining four profiles
of differentially expressed Affymetrix gene IDs, Venn diagram
production online software (https://bioinfogp.cnb.csic.es/tools/venny/index.html,
VENNY 2.1) was used to intersect DEGs. Differently colored areas
represent different datasets, and cross areas represent key genes.
Gene IDs were subsequently converted into gene symbols using the
Database for Annotation, Visualization and Integrated Discovery
(DAVID) (15). Duplicated and
uncharacterized genes were removed, and a final list of DEGs was
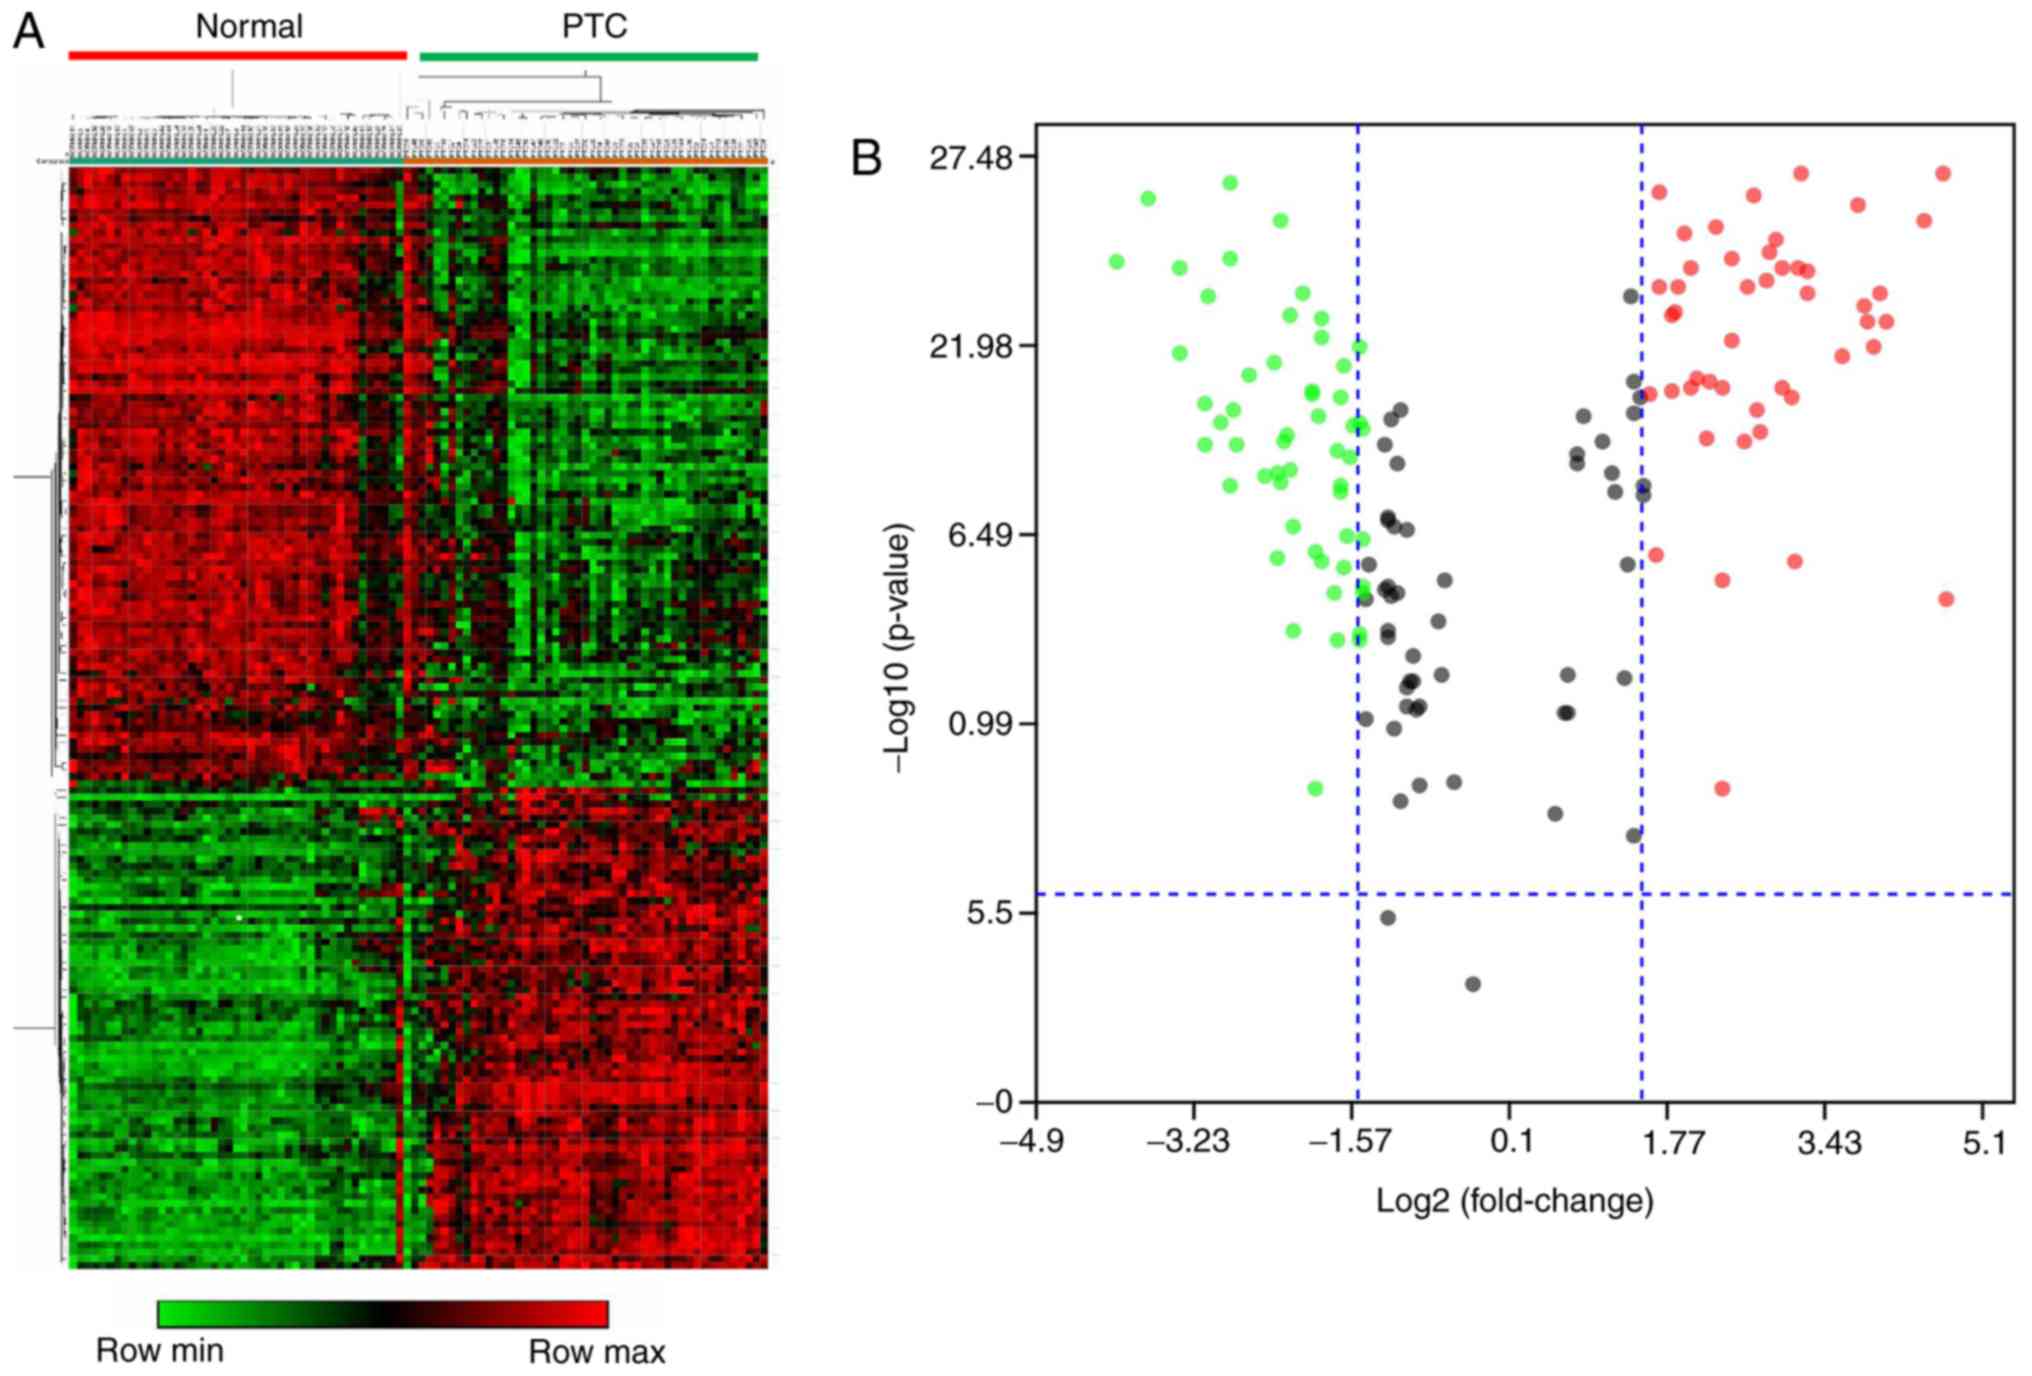
generated. Since dataset 1 was identified to have a larger sample
size of both PTC and healthy tissues, heat maps and volcano plots
were further established from the gene expression profiles of this
dataset in order to visualize DEGs using Morpheus (https://software.broadinstitute.org/morpheus, version
1.0) and Main software (BOA Bioinformatics, version 8.1). P<0.01
and log2 (fold-change) ≥1.5 were determined as significance cut-off
levels.
GO and pathway enrichment
analyses
In order to identify biological and functional
attributes of DEGs, GO and Kyoto Encyclopedia of Genes and Genomes
(KEGG) pathway enrichment analyses were performed using DAVID
(https://david.ncifcrf.gov/) to explore
comprehensive high-throughput gene functional annotation. P<0.05
was considered to indicate a statistically significant
difference.
Integrated analysis of GO and pathway
enrichment
ClueGO (version 2.5.4), a Cytoscape (http://www.cytoscape.org/) plug-in (version 3.7.1),
was used to improve the biological interpretation of DEGs. ClueGO
integrates GO terms and KEGG/Reactome pathways to generate a
functional organized GO/pathway term network, which is then
intuitively represented. The analysis parameters were set as
follows: i) Right-sided hypergeometric test; ii) adjusted P<0.05
with Benjamini-Hochberg correction; iii) GO levels 6–14; and iv) a
Kappa score threshold of 0.4.
PPI network construction
The Search Tool for the Retrieval of Interacting
Genes (STRING, version 10.5) database (http://string-db.org) provides both experimental and
predicted interaction information (20). A PPI network of DEGs was constructed
with STRING to further evaluate the molecular mechanism of cellular
processing. The PPI network was visualized in Cytoscape based on
the gene expression values of dataset 1.
Statistical analysis
The ROC curve was used to evaluate classifiers in
bioinformatic applications. To further assess the predictive
accuracy of the DEGs, ROC analysis was performed to discriminate
PTC from healthy tissues. ROC curves for genes with log2
(fold-change) ≥1.5 were generated using SPSS software (version
16.0; SPSS, Inc.) based on the obtained DEGs and their expression
profile data from dataset 1. The area under the ROC curve (AUC) was
calculated and used to compare the diagnostic value of these
genes.
Results
Identification of DEGs in PTC
A total of four GEO datasets were selected for gene
screening (Fig. 1). All data were
acquired from microarray analyses of both PTC and healthy control
tissues in the datasets. The screening strategy revealed a total of
153 DEGs among the four datasets, including 66 upregulated and 87
downregulated DEGs (Fig. 1; Table I).
 | Table I.DEGs. |
Table I.
DEGs.
| DEGs | Gene name |
|---|
| Upregulated
(66) | ABCC3, ADORA1,
ALDH1A3, CAMK2N1, CCND1, CDH3, CDH6, CHI3L1, CITED1, COL13A1, DDB2,
DPP4, DTX4, DUSP4, DVL1, EDEM1, ENTPD1, EPS8, ETV5, FN1, GALE,
GALNT7, GGCT, GJB3, HEY2, HMGA2, HRH1, KCNJ2, KDELR3, KLHL2, KLK10,
LAD1, LAMB3, LGALS3, LRP4, MCTP2, MET, MRC2, MSN, MVP, MYH10, NPC2,
NRCAM, P2RX5-TAX1BP3, P4HA2, PDZK1IP1, PLXNC1, PROS1, PSD3, PTPRE,
QPCT, RAB27A, RAD23B, RXRG, SCEL, SEL1L3, SERPINA1, SLC34A2,
SPINT1, TBC1D2, TENM1, TGFA, TIAM1, TNIK, TUSC3TUSC3, UBE2A |
| Downregulated
(87) | ACACB, ADAM22,
ADGRA3, ADH1B, AGTR1, AOX1, ARHGAP24, ARHGEF28, ASXL3, ATP2C2,
BCL2, CDH16, CDR2, CITED2, CLCNKA, CLMN, CRABP1, CSGALNACT1, CUX2,
CWH43, DEPTOR, DGKI, DIRAS2, DPP6, ELMO1, EML1, EPHA3, ESRRG,
FABP4, FAM234B, FCGBP, FGFR2, FHL1, GATM, GHR, GPM6A, HGD, HSBP1,
ID4, IMPA2, IPCEF1, ITPR1, KIT, KIZ, KLHL3, LIFR, LRIG1, LRP1B,
MAFB, MARC2, MATN2, MPC1, MPPED2, MROH7, MT1F, NETO2, OGDHL,
PAPSS2, PEG3, PLA2R1, PLCH1, PPARGC1A, RAP1GAP, RGS16, RYR2, SDC2,
SELENBP1, SHANK2, SLC4A4, SLITRK5, SORBS2, SPTBN1, STARD13, SYNE1,
TBC1D4, TCF7L1, TFCP2L1, TFF3, TLE1, TMPRSS3, TNS3, TPO, TTC30A,
WASF3, WFS1, WWOX, ZMAT4 |
Validation and visualization of DEGs
in microarray data
Using Morpheus software, the microarray data of
dataset 1 were used in order to confirm the reliability and
accuracy of DEGs in PTC. As presented in the cluster heat map of
Fig. 2A, 153 DEGs demonstrated a
distinct difference between PTC and healthy groups. The volcano
plot (Fig. 2B) generated using Main
software further verified that the majority of these DEGs had a
log2 value (fold-change) >1.5 and P<0.05. These identified
DEGs were used for the functional and pathway enrichment
analyses.
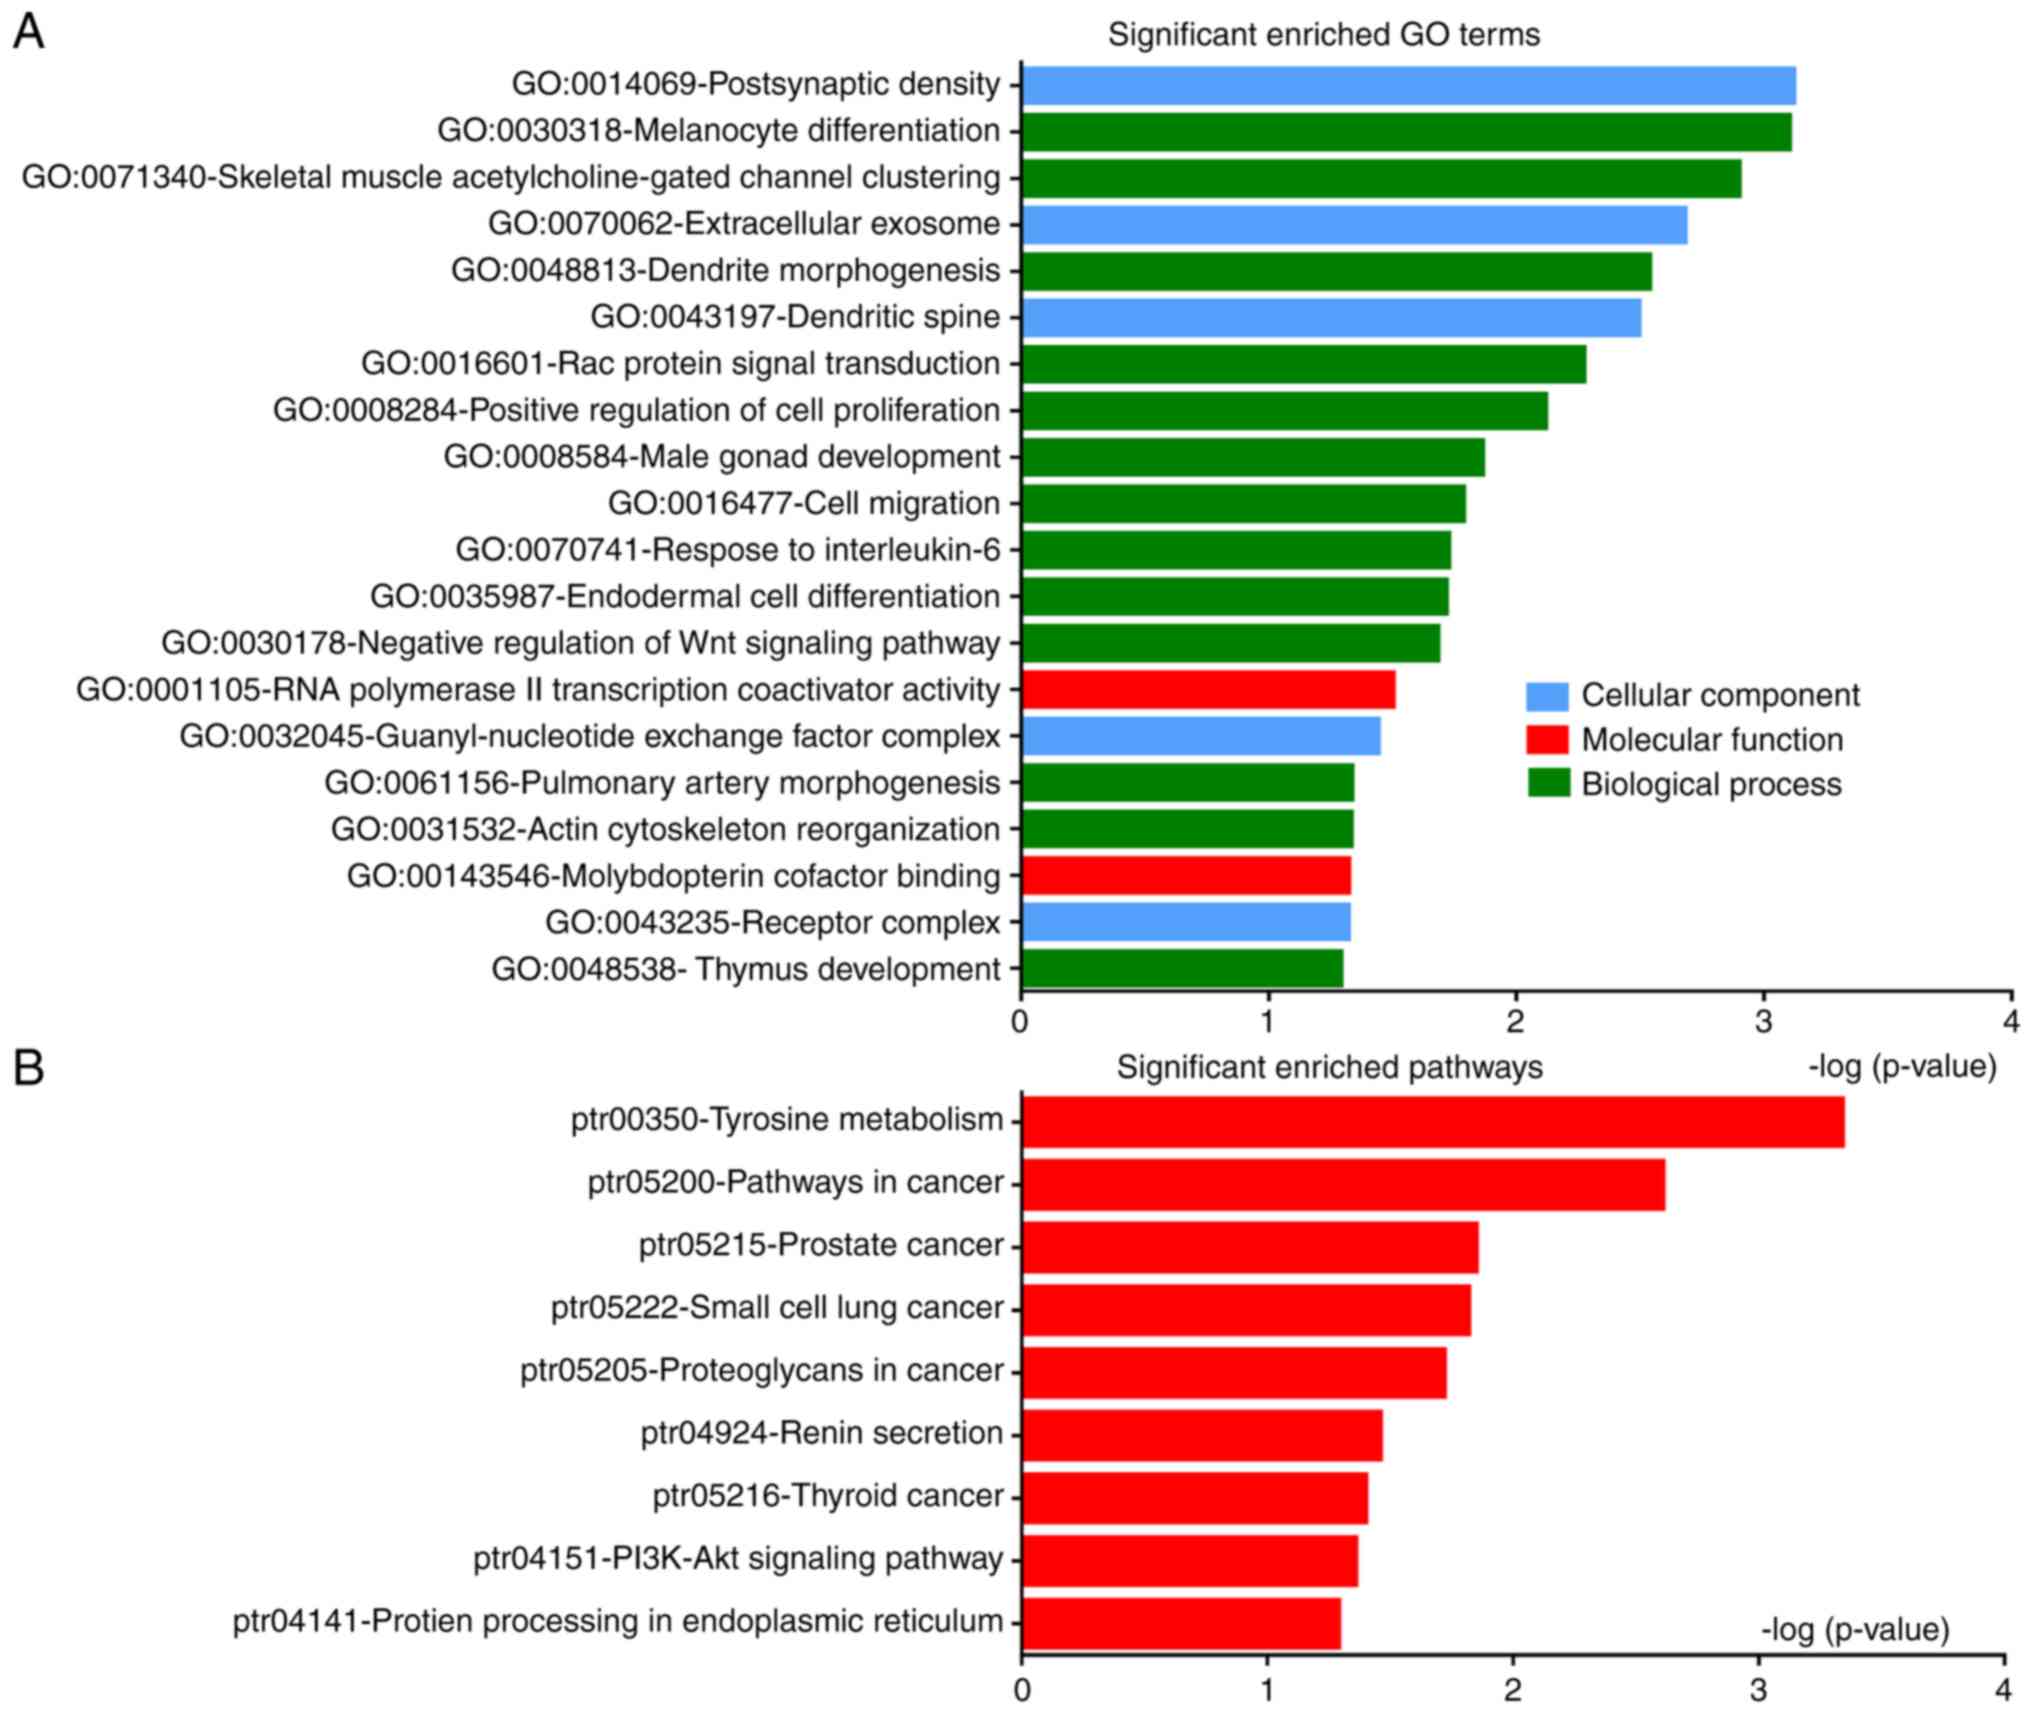
GO analysis
DEGs were classified into the three functional
groups of GO analysis: Biological processes, molecular function and
cellular component (Fig. 3A;
Table II). GO analysis showed that
DEGs were primarily enriched in ‘postsynaptic density’, ‘melanocyte
differentiation’, ‘dendrite morphogenesis’ and ‘positive regulation
of cell proliferation’ and ‘cell migration’; ‘RNA polymerase II
transcription coactivator activity’ and ‘molybdopterin cofactor
binding’ were significantly enriched in molecular function; and in
the cellular component group, DEGs were mainly enriched in
‘extracellular exosomes’, ‘dendritic spine’ and ‘receptor
complex’.
| Table II.GΟ enrichment analysis differentially
expressed genes in papillary thyroid carcinoma. |
Table II.
GΟ enrichment analysis differentially
expressed genes in papillary thyroid carcinoma.
| Category | Term | Description | Count | P-value |
|---|
| Molecular
function | GO:0001105 | Rna polymerase II
transcription coactivator activity | 3 |
3.06×10⁻² |
|
| GO:0043546 | Molybdopterin
cofactor binding | 2 |
4.65×10⁻² |
| Cellular
component | GO:0070062 | Extracellular
exosome | 34 |
2.03×10⁻³ |
|
| GO:0043197 | Dendritic
spine | 4 |
3.12×10⁻³ |
|
| GO:0032045 | Guanyl-nucleotide
exchange factor complex | 2 |
3.52×10⁻² |
|
| GO:0043235 | Receptor
complex | 4 |
4.66×10⁻² |
|
| GO:0014069 | Postsynaptic
density | 5 |
7.41×10⁻⁴ |
| Biological
process | GO:0030318 | Melanocyte
differentiation | 4 |
7.71×10⁻⁴ |
|
| GO:0071340 | Skeletal muscle
acetylcholine-gated channel clustering | 3 |
1.23×10⁻³ |
|
| GO:0048813 | Dendrite
morphogenesis | 4 |
2.82×10⁻³ |
|
| GO:0016601 | Rac protein signal
transduction | 3 |
5.21×10⁻³ |
|
| GO:0008284 | Positive regulation
of cell proliferation | 8 |
7.44×10⁻³ |
|
| GO:0008584 | Male gonad
development | 4 |
1.34×10⁻² |
|
| GO:0016477 | Cell migration | 5 |
1.59×10⁻² |
|
| GO:0070741 | Response to
interleukin−6 | 2 |
1.83×10⁻² |
|
| GO:0035987 | Endodermal cell
differentiation | 3 |
1.87×10⁻² |
|
| GO:0030178 | Negative regulation
of wnt signaling pathway | 3 |
2.02×10⁻² |
|
| GO:0061156 | Pulmonary artery
morphogenesis | 2 |
4.51×10⁻² |
|
| GO:0031532 | Actin cytoskeleton
reorganization | 3 |
4.53×10⁻² |
|
| GO:0048538 | Thymus
development | 3 |
4.98×10⁻² |
Pathway enrichment analysis
Signaling pathway enrichment analysis of DEGs was
conducted using DAVID. DEGs were found to be significantly enriched
in nine classical pathways, including the phosphoinositide 3-kinase
(PI3K)-AKT signaling pathway, and pathways associated with thyroid,
prostate and small cell lung cancer (Fig. 3B; Table
III). Signaling pathway analysis confirmed that DEGs were
mainly involved in cancer-related pathways.
| Table III.Pathway enrichment analysis
differentially expressed genes in papillary thyroid carcinoma. |
Table III.
Pathway enrichment analysis
differentially expressed genes in papillary thyroid carcinoma.
| Pathway term | Description | Count | P-value | Genes |
|---|
| ptr00350 | Tyrosine
metabolism | 5 |
4.51×10⁻⁴ | ALDH1A3, AOX1, HGD,
ADH1B, TPO |
| ptr05200 | Pathways in
cancer | 12 |
2.42×10⁻³ | FGFR2, AGTR1,
LAMB3, CCND1, BCL2, MET, RXRG, TGFA, KIT, TCF7L1, DVL1, FN1 |
| ptr05215 | Prostate
cancer | 5 |
1.37×10⁻² | FGFR2, CCND1, BCL2,
TGFA, TCF7L1 |
| ptr05222 | Small cell lung
cancer | 5 |
1.48×10⁻² | LAMB3, CCND1, BCL2,
RXRG, FN1 |
| ptr05205 | Proteoglycans in
cancer | 7 |
1.86×10⁻² | CCND1, TIAM1, MET,
MSN, SDC2, ITPR1, FN1 |
| ptr04924 | Renin
secretion | 4 |
3.36×10⁻² | AGTR1, KCNJ2,
ADORA1, ITPR1 |
| ptr05216 | Thyroid cancer | 3 |
3.89×10⁻² | CCND1, RXRG,
TCF7L1 |
| ptr04151 | PI3K-AKT signaling
pathway | 8 |
4.25×10⁻² | FGFR2, LAMB3,
CCND1, BCL2, MET, KIT, GHR, FN1 |
| ptr04141 | Protein processing
in endoplasmic reticulum | 5 |
4.98×10⁻² | RAD23B, TUSC3,
WFS1, BCL2, EDEM1 |
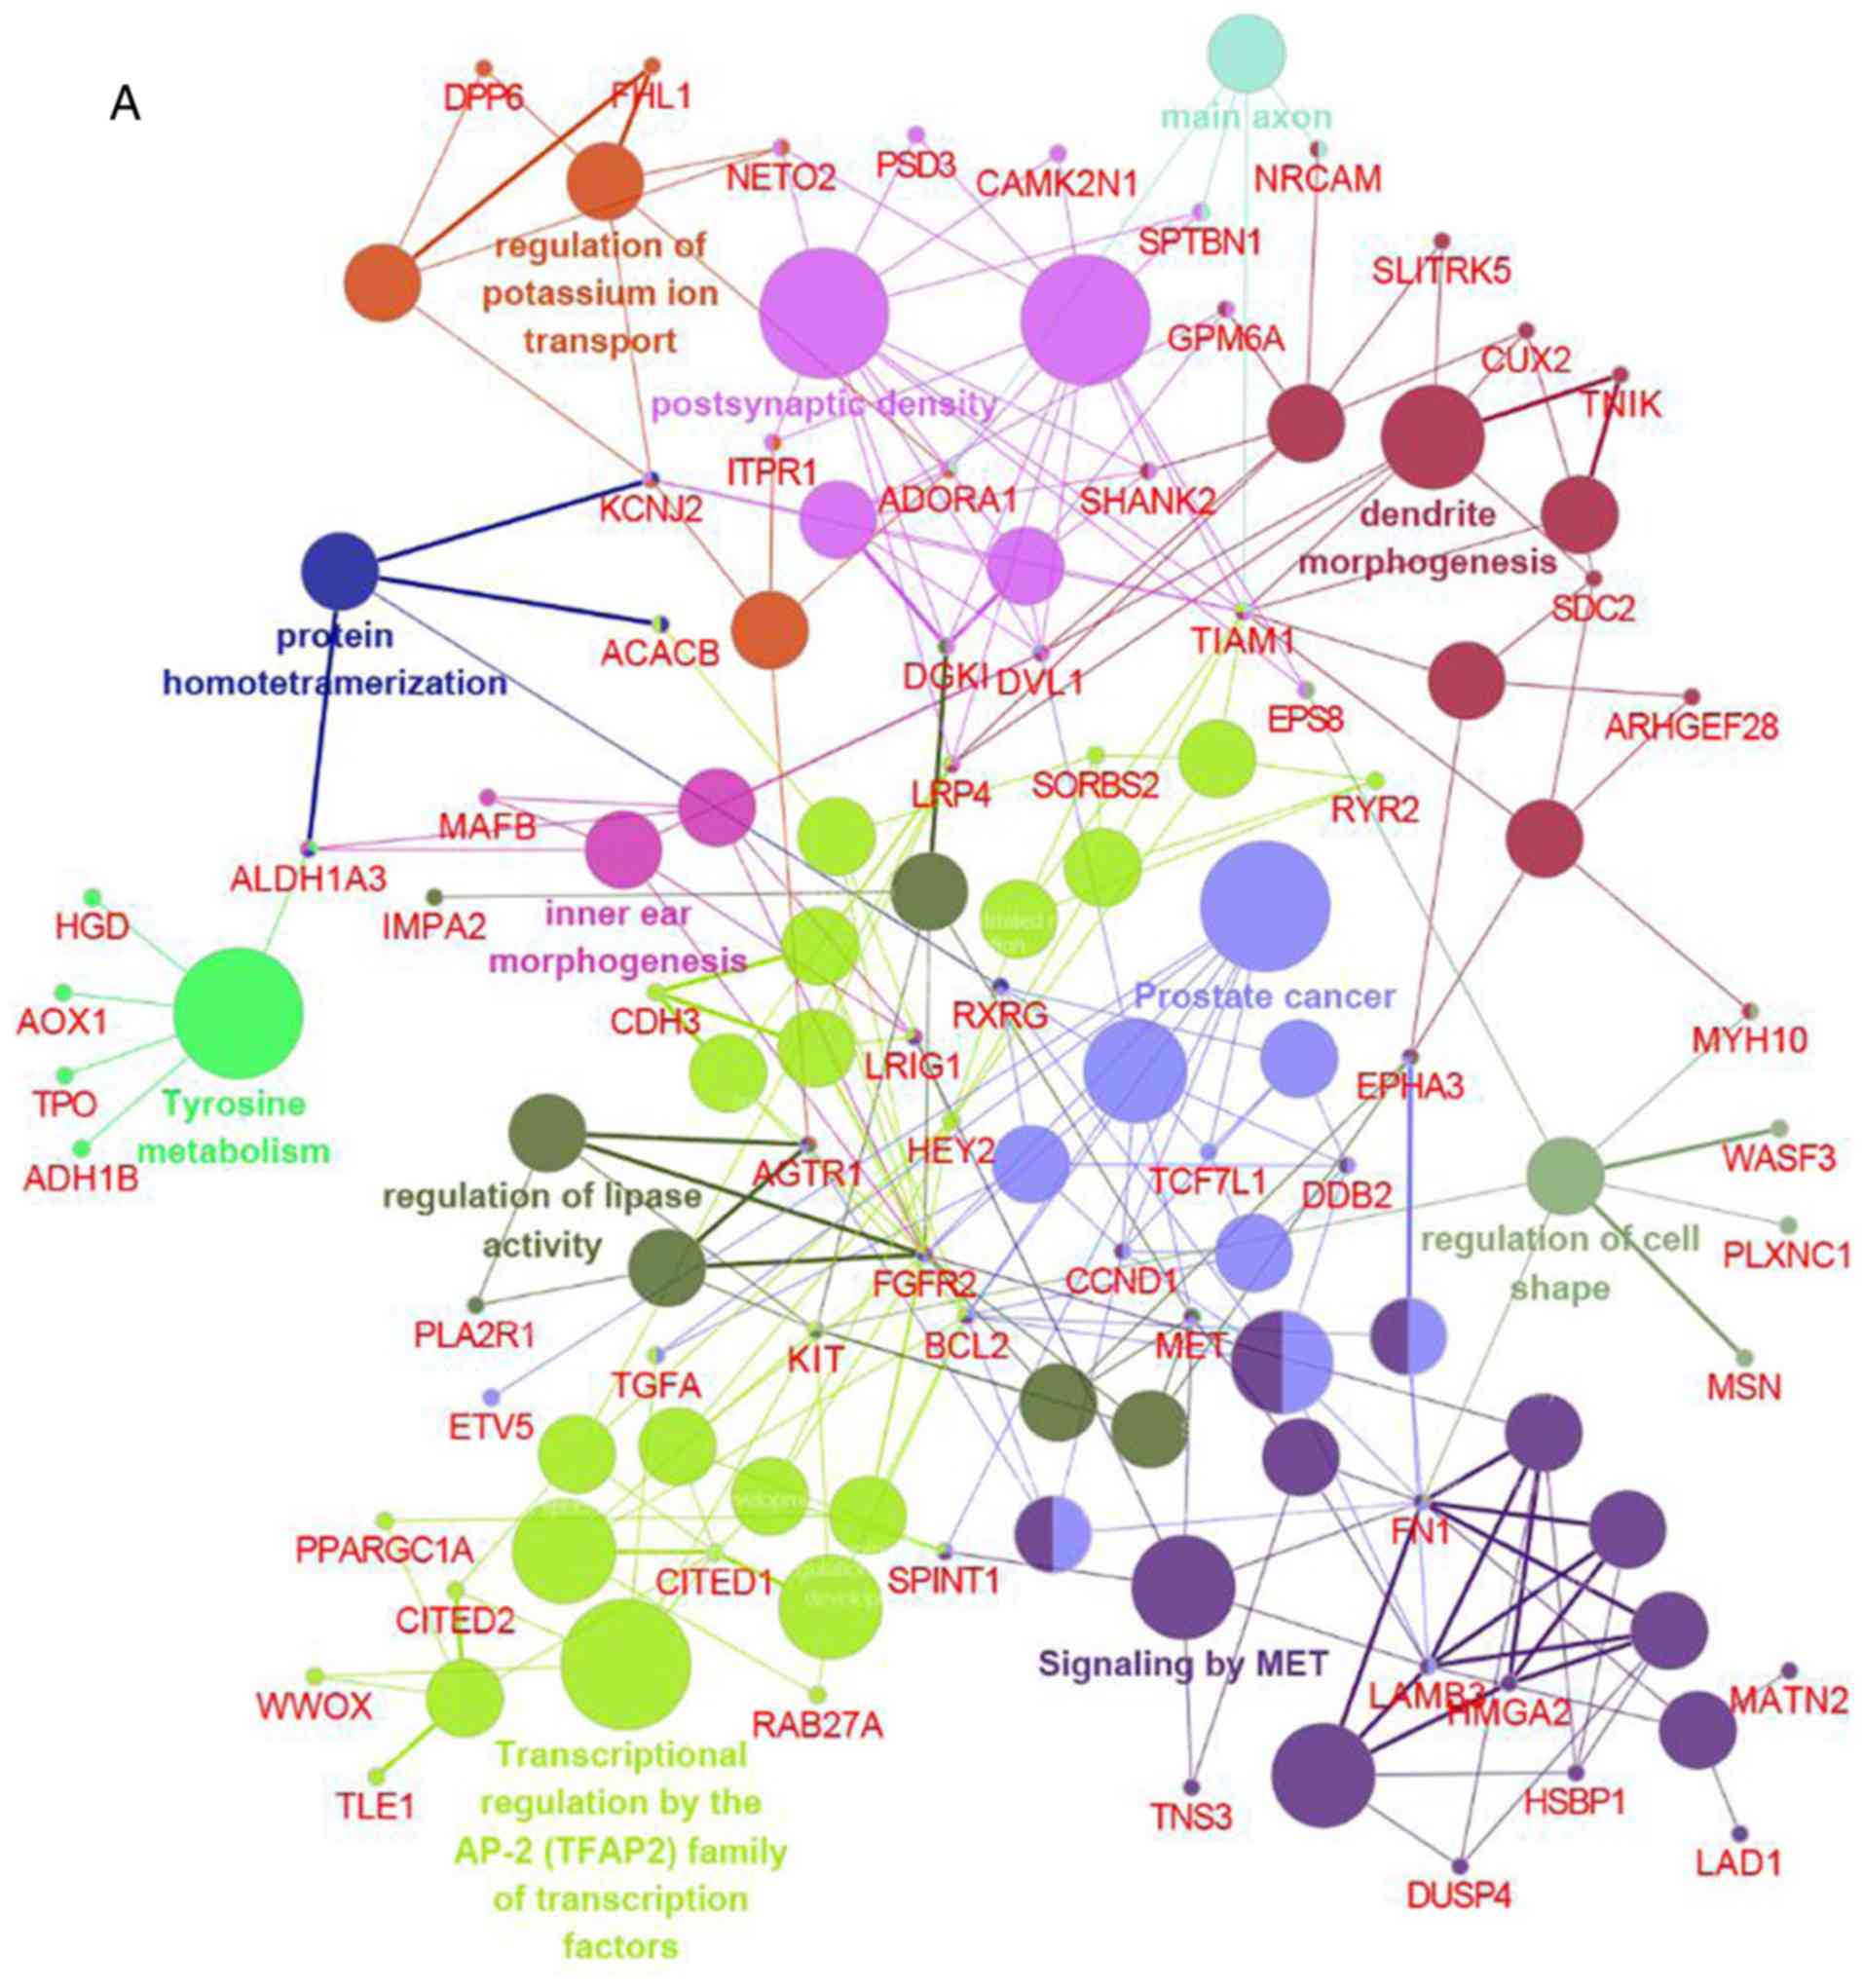
Integrated analysis of GO and pathway
enrichment
To comprehensively investigate the biological
processes associated with DEGs, integrated analysis of GO and
pathway enrichment was conducted using Cytoscape. DEGs were found
to be mainly involved in transcriptional regulation by the AP-2
(TFAP2) family of transcription factors, signaling by MET,
regulation of lipase activity, dendrite morphogenesis, and
postsynaptic density (Fig. 4),
suggesting that these processes may constitute the underlying
molecular mechanism of PTC.
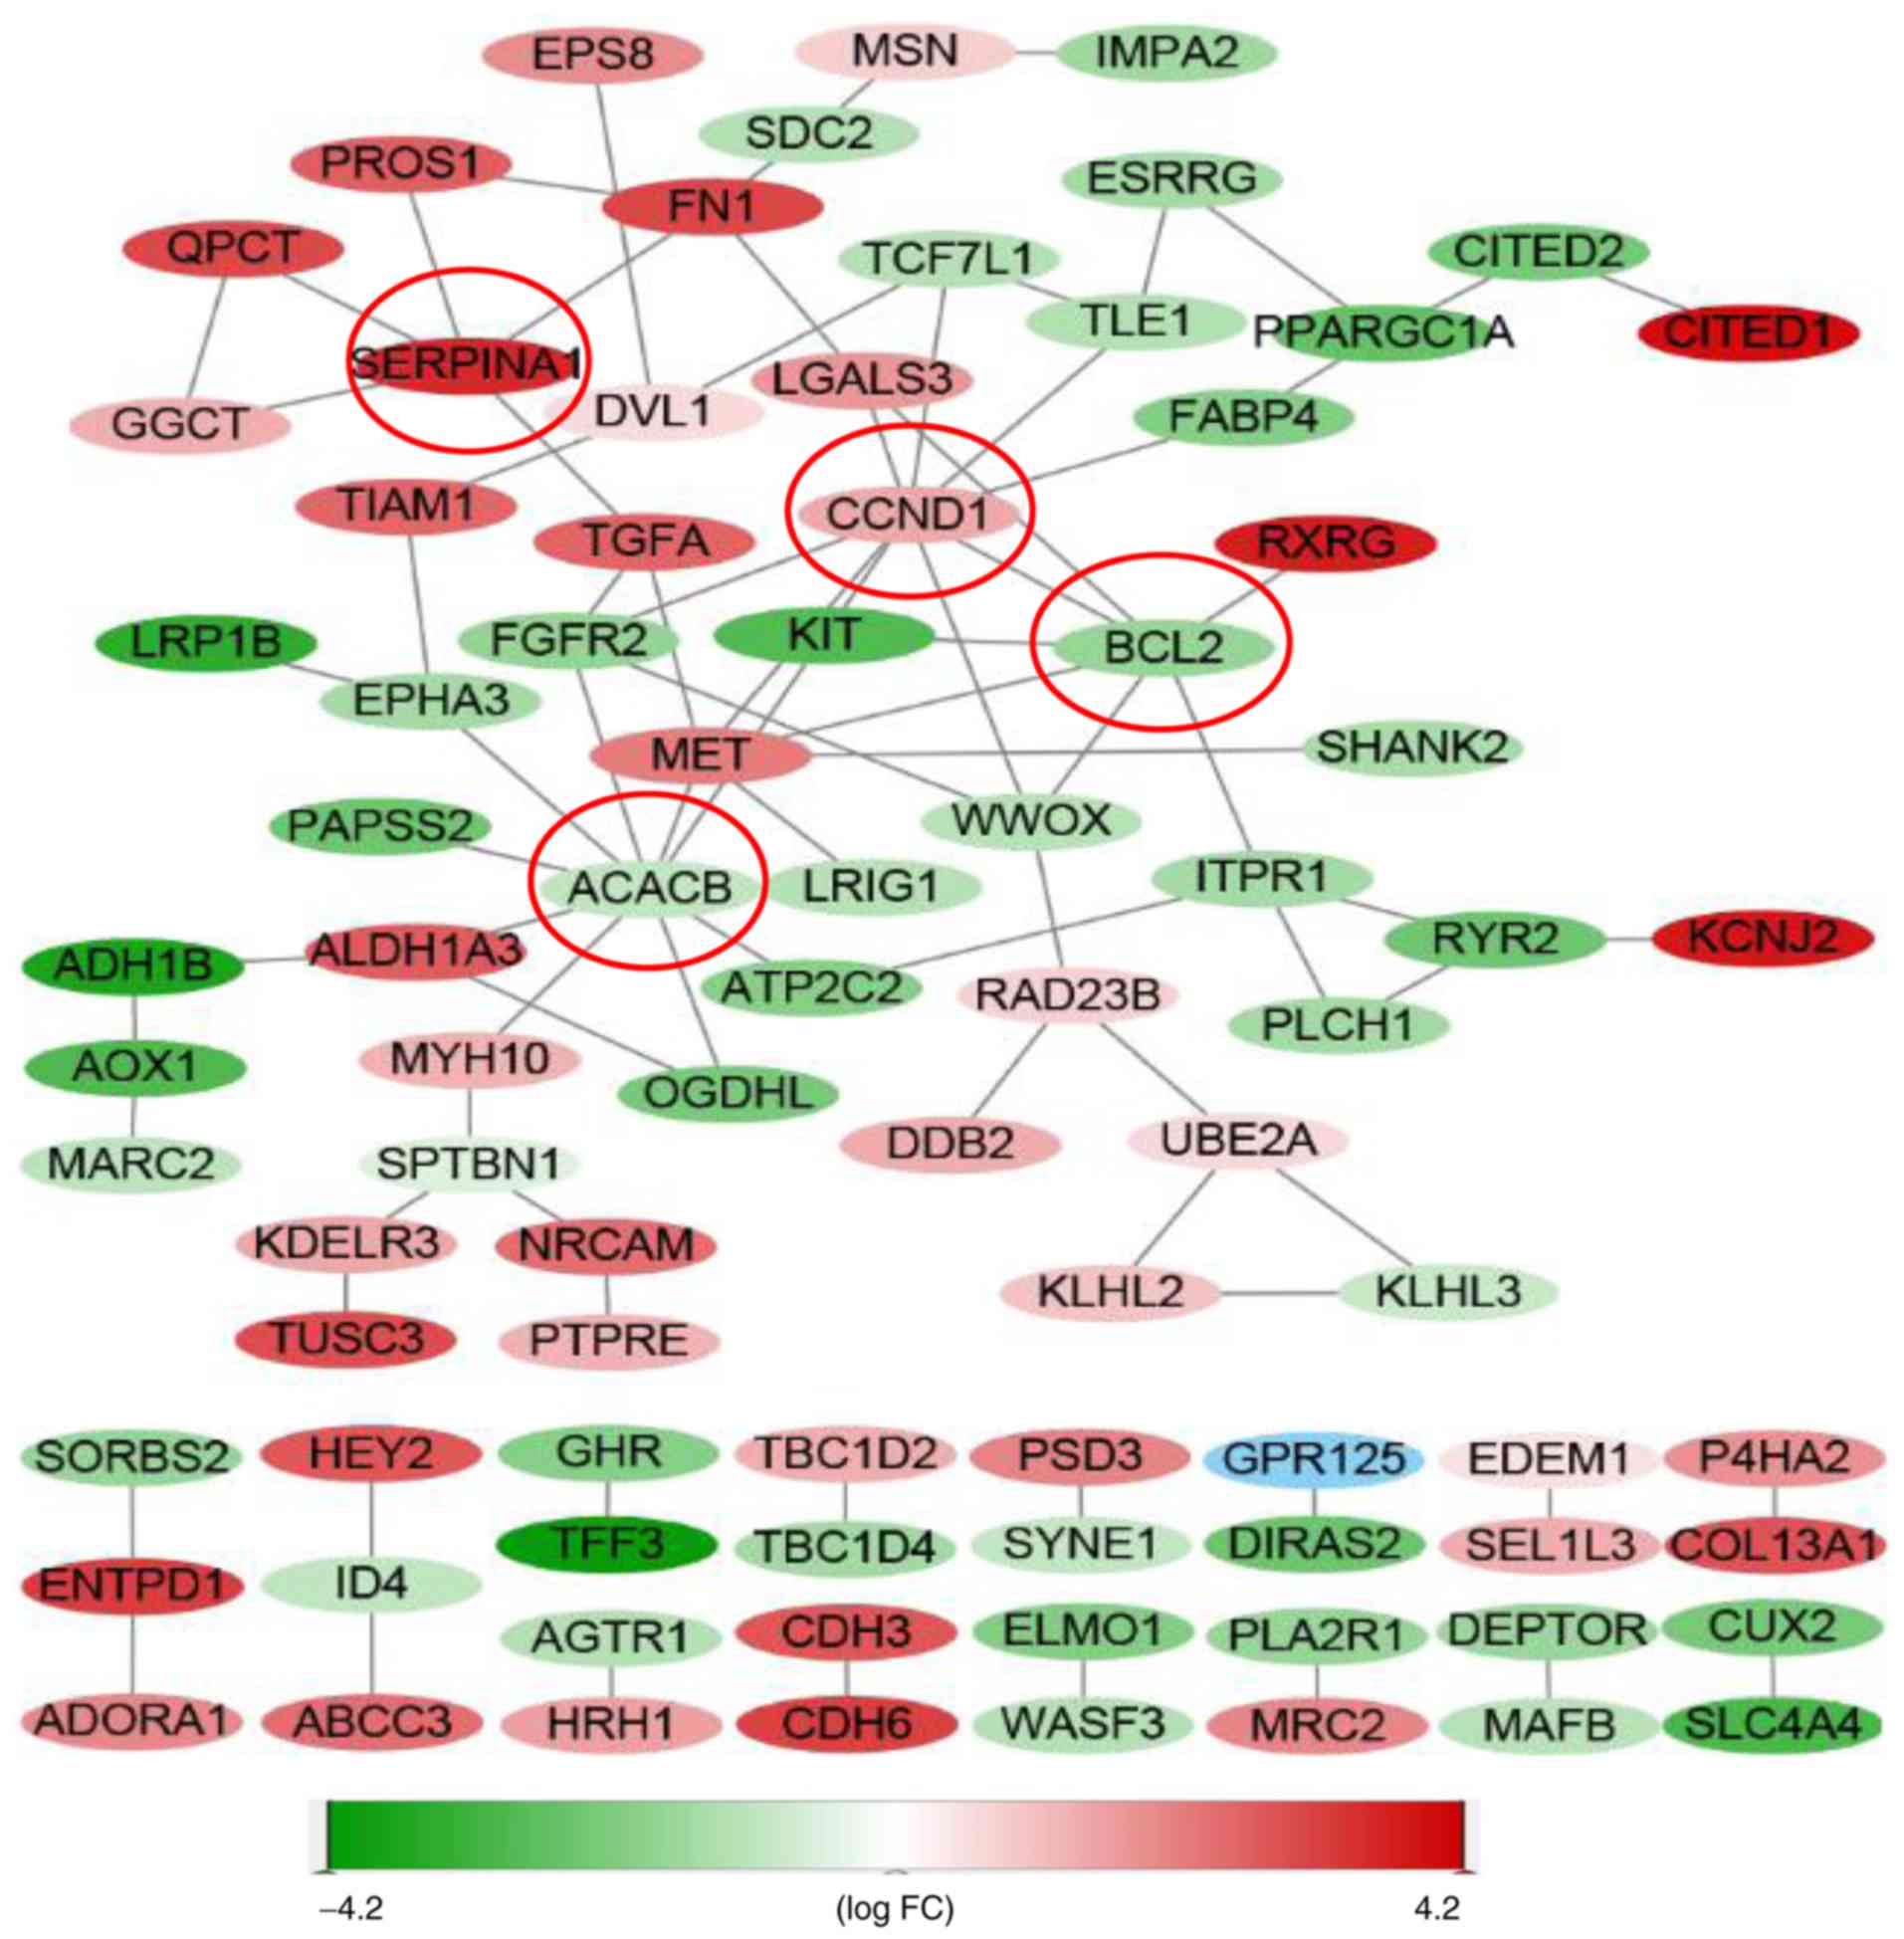
PPI network
The PPI network included 152 nodes and 87 edges,
representative of proteins and protein-protein interactions,
respectively (Fig. 5). Moreover,
acetyl-CoA carboxylase beta (ACACB) (nine edges), cyclin D1
(CCND1) (nine edges), BCL2 (seven edges) and serpin
peptidase inhibitor clade A member 1 (SERPINA1) (five edges)
were identified as central genes.
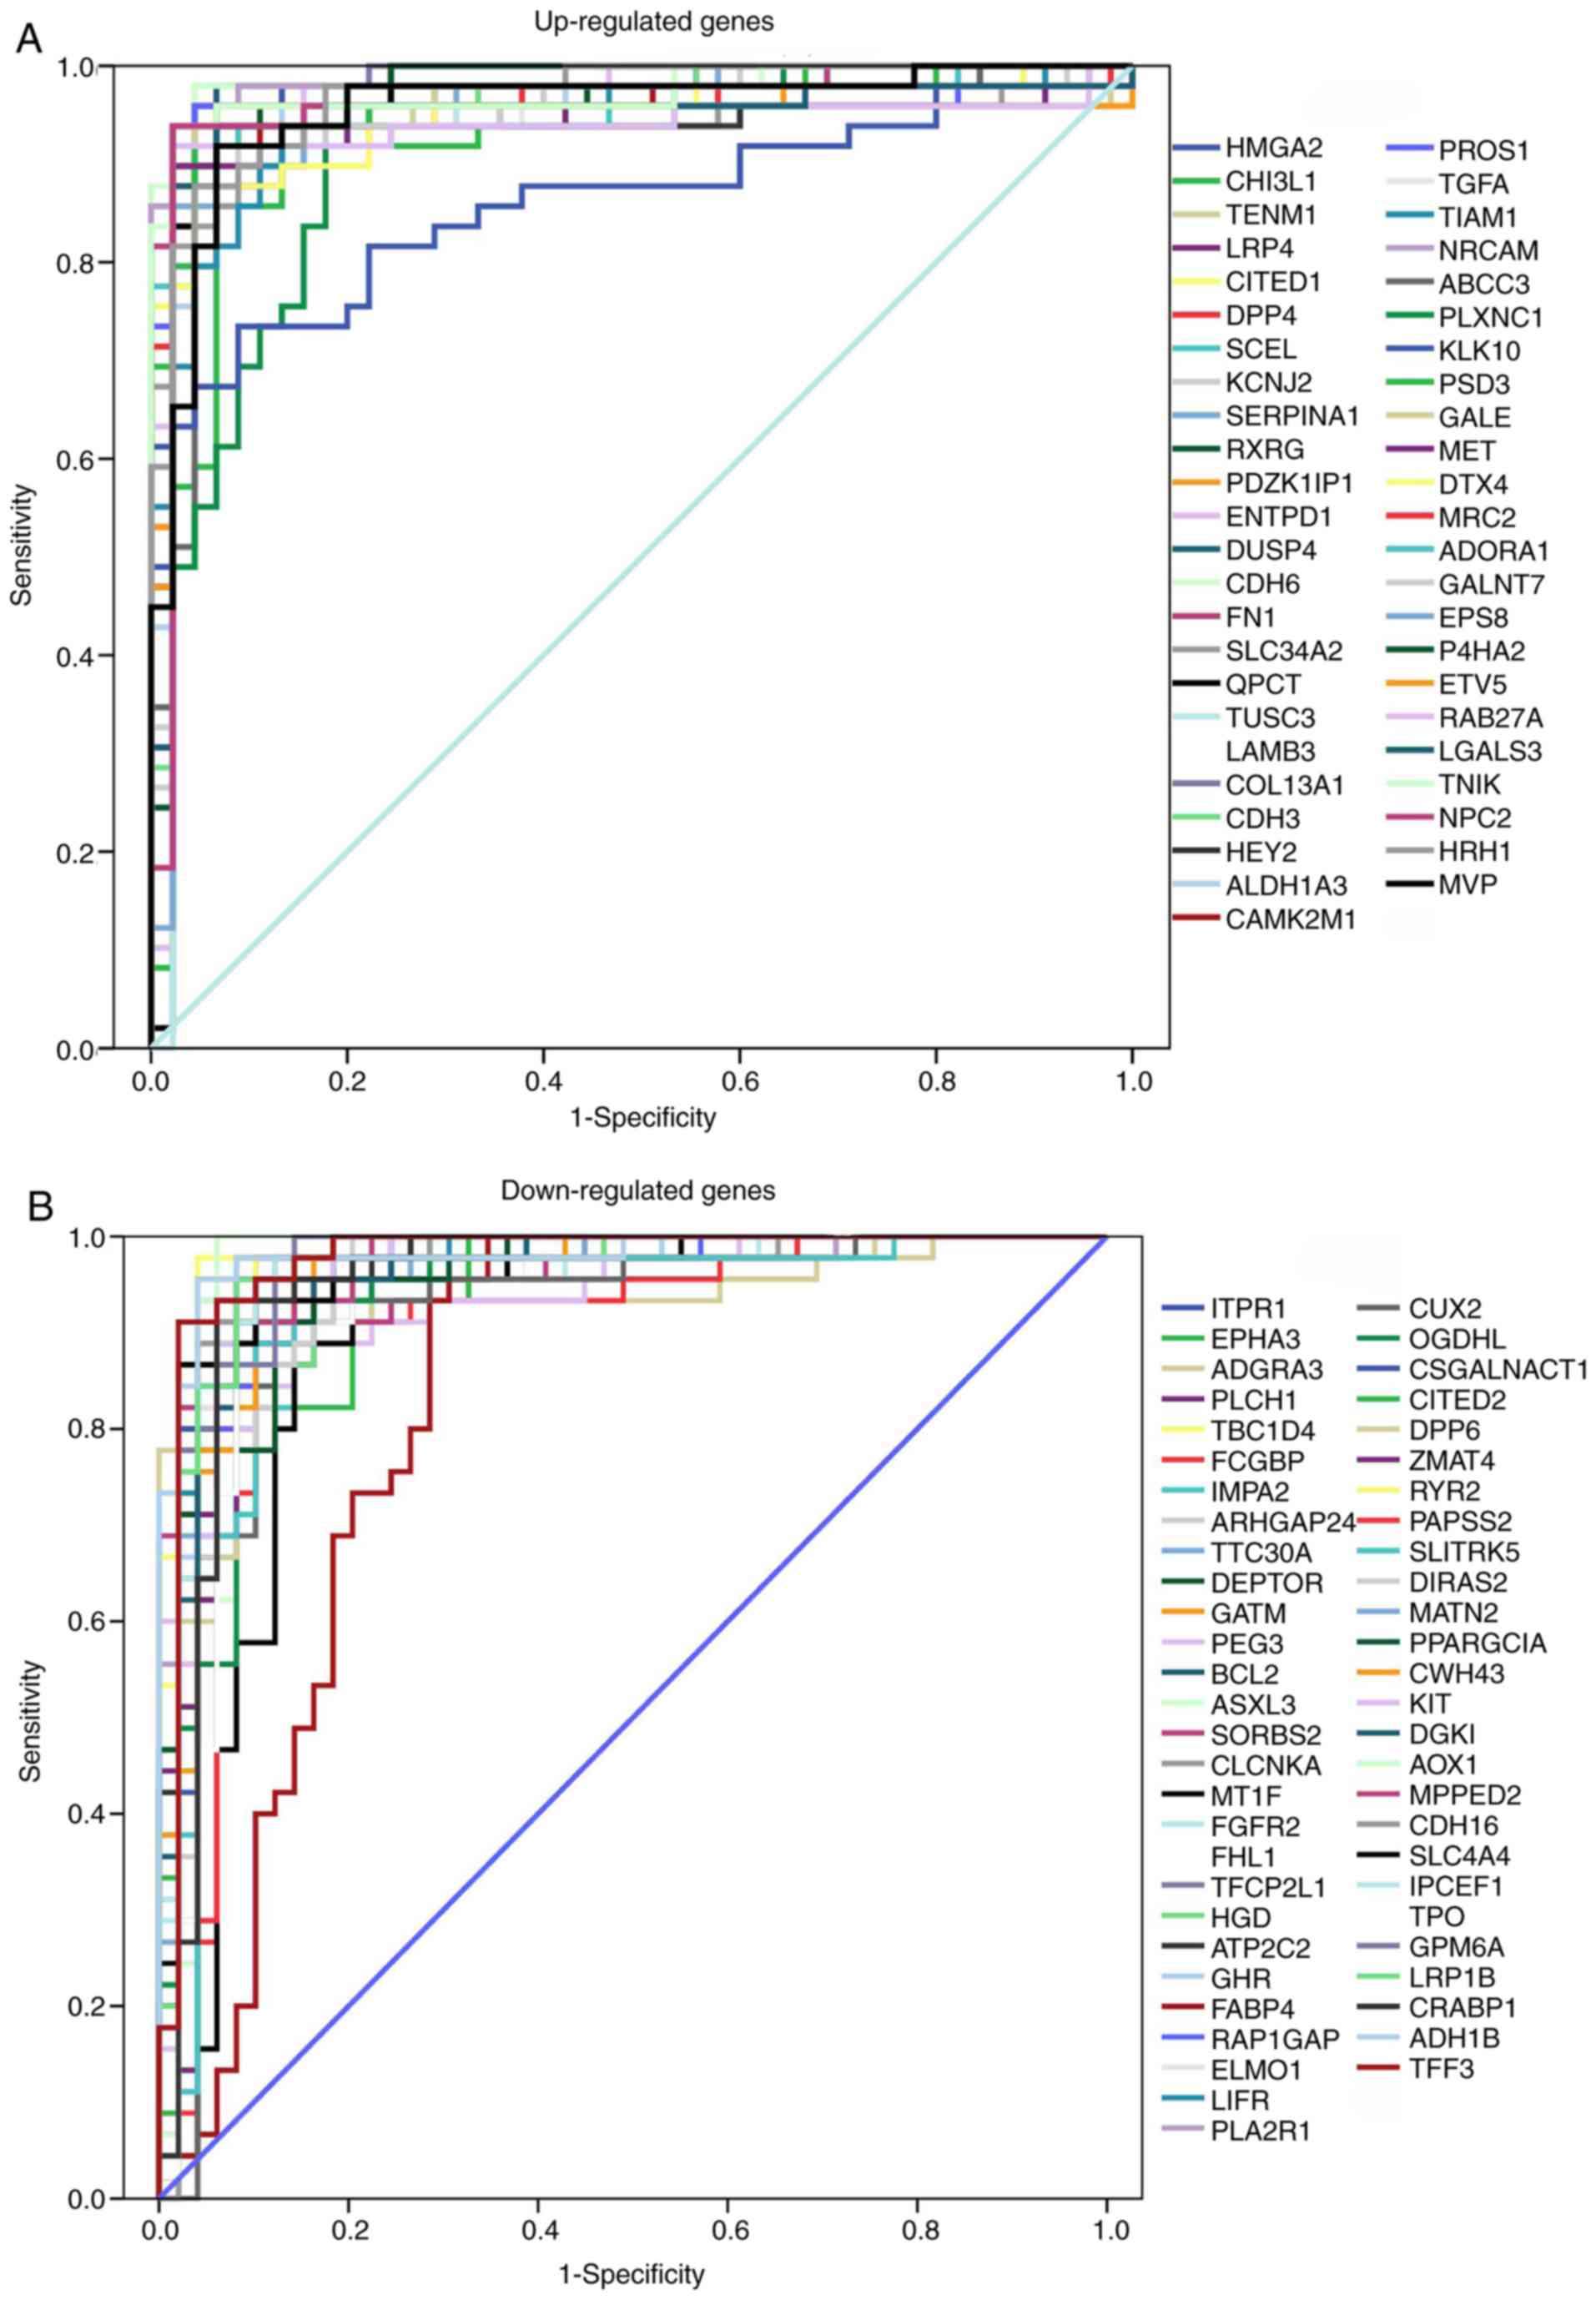
Identification of key diagnostic genes
by ROC analysis
The ROC curve was used to assess the predictive
accuracy of DEGs with log2 (fold-change) ≥1.5. AUC was calculated
and used to select the most appropriate cut-off gene expression
levels. ROC curves and AUC values are presented in Fig. 6 and Table
SI, respectively. All AUC values exceeded 0.8, while the
upregulated genes CDH6 and collagen type XIII α1 chain
(COL13A1), and downregulated genes alcohol dehydrogenase 1B
(class I), β polypeptide (ADH1B) and TBC1 domain family
member 4 (TBC1D4) had AUC values >0.98. The ROC analysis
revealed that the expression levels of these genes had excellent
predictive performance and were able to discriminate PTC from
healthy tissues.
Discussion
PTC is a type of endocrine neoplasm, in which the
incidence rate is gradually increasing in many parts of the world,
such as the USA, Italy and Australia (21). Its transition to a
well-differentiated type of tumor is considered a multifactorial
and multistage process, and certain cases exhibit aggressive
clinical characteristics (22). In
the present study, it was identified that 153 genes were
differentially expressed in four publicly available datasets,
indicating that these genes and the associated pathways may
regulate key events in PTC. Further ROC curve analysis revealed
that their expression levels had excellent predictive performance
in PTC diagnosis.
Microarray technology has been widely applied to
investigate gene expression in PTC (13,20,22),
although the common gene alterations in these studies remain poorly
understood. Previous bioinformatics analyses have revealed the
molecular mechanisms of various tumors, including hepatocellular
carcinoma, anaplastic thyroid carcinoma, cutaneous squamous cell
carcinoma and nasopharyngeal carcinoma (23–26). A
total of four datasets were selected to screen DEGs from a total of
181 samples, including 116 tumor and 65 healthy tissues. The
overlapping DEGs increased the reliability of the results.
Although PTC pathogenesis has previously been
reported to be associated with various biological processes
(27,28), the underlying molecular mechanisms
remain unclear. GO and pathway enrichment analyses of the
identified DEGs demonstrated that they were primarily associated
with the RNA polymerase II (Pol II) transcription coactivator, and
positive regulation of cell proliferation, cell migration and
extracellular exosomes. Consistent with these findings, a previous
study also reported that PTC was involved in the positive
regulation of Pol II promoter transcription (20). Additionally, PTC progression was
found to be associated with cell proliferation, invasion and
apoptosis (27,29,30).
Exosomes have been proposed as novel regulators in tumor
initiation, while overexpressed microRNAs in exosomes were reported
to alter cell proliferation in PTC (31).
In the present study, pathway enrichment analysis
revealed that the DEGs were primarily involved in the PI3K-AKT
signaling pathway and pathways associated with thyroid cancer and
cancer proteoglycans. The PI3K-AKT signaling pathway regulates a
wide range of cellular processes including survival, proliferation,
metabolism, angiogenesis and metastasis; changes in this pathway
are common in PTC (32–34). For instance, tumor protein
p53-inducible protein 3 and C-X-C chemokine receptor type 7 serve
an oncogenic role in PTC cell proliferation and metastasis by
regulating the PI3K/AKT/PTEN pathway (2,35). In
line with the present study, a previous network-based analysis also
identified key genes as being enriched in proteoglycans in PTC
(36).
The PPI network in the present study identified
CCND1, ACACB, BCL2 and SERPINA1 as central genes.
CCND1 is a gatekeeper that regulates the cell cycle
transition from the G1 to S phase and is typically
upregulated in various types of human cancer (37). Several studies on PTC have reported
that CCND1 expression is associated with aggressive
clinicopathological features, and that it can be used as a
diagnostic and predictive biomarker (38,39).
Furthermore, CCND1 is also involved in the PI3K-AKT
signaling pathway and cancer proteoglycans, highlighting its
importance in PTC initiation and progression. FN1 was
revealed to serve an important role in several pathways described
in the present study, and it was observed to be upregulated in
numerous types of cancer, including colorectal cancer, oral
squamous cell carcinoma and breast cancer (40–42).
FN1 upregulation is thought to contribute to PTC development
by regulating EMT, and it has been reported to act as a potential
biomarker for PTC treatment (5).
Gene expression has promising diagnostic potential
in a number of types of cancer, including colorectal, ovarian, and
breast cancer (43–45). In the present study, the calculated
AUC values ranged from 0.7–0.9, which is considered an excellent
discriminatory power (46), while
the AUC values for CDH6, COL13A1, ADH1B and TBC1D4
were increased. Consistent with the results of the present study,
FN1 and the protein S gene have been proven to be associated
with the diagnosis of PTC, and COL13A1 has been identified
as a diagnostic marker that is able to clearly distinguish PTC from
control samples (47,48). The combined use of gene expression
values, including TACSTD2 (tumor-associated calcium signal
transducer 2), subtilisin-like serine protease-2 and neural cell
adhesion molecule 1, has been previously reported to be an
effective diagnostic method for PTC (49). Furthermore, the thyroid peroxidase
gene combined with other genes (including TIMP3, RARB2, SERPINB5,
RASSF1, TPO and TSHR) demonstrated high diagnostic sensitivity
(91%) and specificity (81%) in differentiating PTC from healthy
thyroid tissue (50). The excellent
predictive performance of the genes demonstrated in the present
study suggests that all identified DEGs are potential biomarkers
for PTC diagnosis.
The present study had a number of limitations.
First, it lacked correlation analysis between DEGs and
clinicopathological data in the publicly available datasets.
Secondly, the DEGs were not validated using quantitative PCR in
patients with PTC. Thirdly, western blot analysis or
immunohistochemical staining was not performed to evaluate protein
expression. Therefore, further studies that focus on the biological
and molecular mechanisms of PTC are required in order to assess the
accuracy of these genes in diagnosing this type of cancer.
An integrated analysis based on four public datasets
was performed that identified 153 DEGs in PTC. Bioinformatics
analysis results revealed that these DEGs may contribute to the
pathogenesis of PTC via the PI3K-AKT signaling pathway and
cancer-associated pathways. Diagnostic analysis further verified
that expression levels of these DEGs had excellent predictive
performance, suggesting their use as potential biomarkers for PTC
diagnosis or targeted drug development.
Supplementary Material
Supporting Data
Acknowledgements
The authors would like to thank Dr Sarah Williams
(University of Oxford), for editing the original draft of this
manuscript.
Funding
The present study was funded by the National Natural
Science Foundation of China (grant no. 81702463 and 81702787) and
the Beijing Health System Top Level Technical Personnel Training
Plan (grant no. 20153079).
Availability of data and materials
The datasets used and/or analyzed during the present
study are available from the corresponding author on reasonable
request.
Authors' contributions
YG and YBY designed the study. YL, HY, PC, SH and JL
contributed to the data analysis. SG, YJ and YRY interpreted the
results from the point of basic research, while clinical
interpretation was made by JT, SW and XN. YL and SG wrote the
initial draft of the manuscript. YG, XN and YBY revised the paper.
All authors approved the final version manuscript.
Ethics approval and consent to
participate
Not applicable.
Patient consent for publication
Not applicable.
Competing interests
The authors declare that they have no competing
interests.
References
|
1
|
Siegel R, Naishadham D and Jemal A: Cancer
statistics, 2013. CA Cancer J Clin. 63:11–30. 2013. View Article : Google Scholar : PubMed/NCBI
|
|
2
|
Brennan K, Holsinger C, Dosiou C, Sunwoo
JB, Akatsu H, Haile R and Gevaert O: Development of prognostic
signatures for intermediate-risk papillary thyroid cancer. BMC
Cancer. 16:7362016. View Article : Google Scholar : PubMed/NCBI
|
|
3
|
Zhang H, Teng X and Liu Z, Zhang L and Liu
Z: Gene expression profile analyze the molecular mechanism of CXCR7
regulating papillary thyroid carcinoma growth and metastasis. J Exp
Clin Cancer Res. 34:162015. View Article : Google Scholar : PubMed/NCBI
|
|
4
|
Carling T and Udelsman R: Thyroid cancer.
Annu Rev Med. 65:125–137. 2014. View Article : Google Scholar : PubMed/NCBI
|
|
5
|
Qu T, Li YP, Li XH and Chen Y:
Identification of potential biomarkers and drugs for papillary
thyroid cancer based on gene expression profile analysis. Mol Med
Rep. 14:5041–5048. 2016. View Article : Google Scholar : PubMed/NCBI
|
|
6
|
Prasad NB, Somervell H, Tufano RP, Dackiw
AP, Marohn MR, Califano JA, Wang Y, Westra WH, Clark DP, Umbricht
CB, et al: Identification of genes differentially expressed in
benign versus malignant thyroid tumors. Clin Cancer Res.
14:3327–3337. 2008. View Article : Google Scholar : PubMed/NCBI
|
|
7
|
Liu X, He M, Hou Y, Liang B, Zhao L, Ma S,
Yu Y and Liu X: Expression profiles of microRNAs and their target
genes in papillary thyroid carcinoma. Oncol Rep. 29:1415–1420.
2013. View Article : Google Scholar : PubMed/NCBI
|
|
8
|
Hu Y, Wang H, Chen E, Xu Z, Chen B and Lu
G: Candidate microRNAs as biomarkers of thyroid carcinoma: A
systematic review, meta-analysis, and experimental validation.
Cancer Med. 5:2602–2614. 2016. View
Article : Google Scholar : PubMed/NCBI
|
|
9
|
Zhang S, Wang Y, Chen M, Sun L, Han J,
Elena VK and Qiao H: CXCL12 methylation-mediated epigenetic
regulation of gene expression in papillary thyroid carcinoma. Sci
Rep. 7:440332017. View Article : Google Scholar : PubMed/NCBI
|
|
10
|
Chen LL, Gao GX, Shen FX, Chen X, Gong XH
and Wu WJ: SDC4 gene silencing favors human papillary thyroid
carcinoma cell apoptosis and inhibits epithelial mesenchymal
transition via Wnt/β-catenin pathway. Mol Cells. 41:853–867.
2018.PubMed/NCBI
|
|
11
|
Gugnoni M, Sancisi V, Gandolfi G, Manzotti
G, Ragazzi M, Giordano D, Tamagnini I, Tigano M, Frasoldati A,
Piana S and Ciarrocchi A: Cadherin-6 promotes EMT and cancer
metastasis by restraining autophagy. Oncogene. 36:667–677. 2017.
View Article : Google Scholar : PubMed/NCBI
|
|
12
|
Reiner A, Yekutieli D and Benjamini Y:
Identifying differentially expressed genes using false discovery
rate controlling procedures. Bioinformatics. 19:368–375. 2003.
View Article : Google Scholar : PubMed/NCBI
|
|
13
|
Min XS, Huang P, Liu X, Dong C, Jiang XL,
Yuan ZT, Mao LF and Chang S: Bioinformatics analyses of significant
prognostic risk markers for thyroid papillary carcinoma. Tumour
Biol. 36:7457–7463. 2015. View Article : Google Scholar : PubMed/NCBI
|
|
14
|
Zhu W, Li C and Ai Z: Candidate agents for
papillary thyroid cancer identified by gene expression analysis.
Pathol Oncol Res. 19:597–604. 2013. View Article : Google Scholar : PubMed/NCBI
|
|
15
|
Huang Da W, Sherman BT and Lempicki RA:
Systematic and integrative analysis of large gene lists using DAVID
bioinformatics resources. Nat Protoc. 4:44–57. 2009. View Article : Google Scholar : PubMed/NCBI
|
|
16
|
Dom G, Tarabichi M, Unger K, Thomas G,
Oczko-Wojciechowska M, Bogdanova T, Jarzab B, Dumont JE, Detours V
and Maenhaut C: A gene expression signature distinguishes normal
tissues of sporadic and radiation-induced papillary thyroid
carcinomas. Br J Cancer. 107:994–1000. 2012. View Article : Google Scholar : PubMed/NCBI
|
|
17
|
Giordano TJ, Kuick R, Thomas DG, Misek DE,
Vinco M, Sanders D, Zhu Z, Ciampi R, Roh M, Shedden K, et al:
Molecular classification of papillary thyroid carcinoma: Distinct
BRAF, RAS, and RET/PTC mutation-specific gene expression profiles
discovered by DNA microarray analysis. Oncogene. 24:6646–6656.
2005. View Article : Google Scholar : PubMed/NCBI
|
|
18
|
He H, Jazdzewski K, Li W, Liyanarachchi S,
Nagy R, Volinia S, Calin GA, Liu CG, Franssila K, Suster S, et al:
The role of microRNA genes in papillary thyroid carcinoma. Proc
Natl Acad Sci USA. 102:19075–19080. 2005. View Article : Google Scholar : PubMed/NCBI
|
|
19
|
Zhu X, Yao J and Tian W: Microarray
technology to investigate genes associated with papillary thyroid
carcinoma. Mol Med Rep. 11:3729–3733. 2015. View Article : Google Scholar : PubMed/NCBI
|
|
20
|
Tu Y, Fan G, Xi H, Zeng T, Sun H, Cai X
and Kong W: Identification of candidate aberrantly methylated and
differentially expressed genes in thyroid cancer. J Cell Biochem.
11:8797–8806. 2018. View Article : Google Scholar
|
|
21
|
Lu Z, Sheng J, Zhang Y, Deng J, Li Y, Lu
A, Zhang J, Yu H, Zhang M, Xiong Z, et al: Clonality analysis of
multifocal papillary thyroid carcinoma by using genetic profiles. J
Pathol. 239:72–83. 2016. View Article : Google Scholar : PubMed/NCBI
|
|
22
|
Yu J, Mai W, Cui Y and Kong L: Key genes
and pathways predicted in papillary thyroid carcinoma based on
bioinformatics analysis. J Endocrinol Invest. 39:1285–1293. 2016.
View Article : Google Scholar : PubMed/NCBI
|
|
23
|
Shi KQ, Lin Z, Chen XJ, Song M, Wang YQ,
Cai YJ, Yang NB, Zheng MH, Dong JZ, Zhang L, et al: Hepatocellular
carcinoma associated microRNA expression signature: Integrated
bioinformatics analysis, experimental validation and clinical
significance. Oncotarget. 6:25093–25108. 2015. View Article : Google Scholar : PubMed/NCBI
|
|
24
|
Pan Z, Fang Q, Zhang Y, Li L and Huang P:
Identification of key pathways and drug repurposing for anaplastic
thyroid carcinoma by integrated bioinformatics analysis. Zhejiang
Da Xue Xue Bao Yi Xue Ban. 47:187–193. 2018.(In Chinese).
PubMed/NCBI
|
|
25
|
Wei W, Chen Y, Xu J, Zhou Y, Bai X, Yang M
and Zhu J: Identification of biomarker for cutaneous squamous cell
carcinoma using microarray data analysis. J Cancer. 9:400–406.
2018. View Article : Google Scholar : PubMed/NCBI
|
|
26
|
Chen F, Shen C, Wang X, Wang H, Liu Y, Yu
C, Lv J, He J and Wen Z: Identification of genes and pathways in
nasopharyngeal carcinoma by bioinformatics analysis. Oncotarget.
8:63738–63749. 2017.PubMed/NCBI
|
|
27
|
Yan R, Yang T, Zhai H, Zhou Z, Gao L and
Li Y: MicroRNA- 150-5p affects cell proliferation, apoptosis, and
EMT by regulation of the BRAFV600E mutation in papillary
thyroid cancer cells. J Cell Biochem. 119:8763–8772. 2018.
View Article : Google Scholar : PubMed/NCBI
|
|
28
|
Zhang H, Yang L and Liu Z, Liu C, Teng X,
Zhang L, Yin B and Liu Z: iTRAQ-coupled 2D LC/MS-MS analysis of
CXCR7-transfected papillary thyroid carcinoma cells: A new insight
into CXCR7 regulation of papillary thyroid carcinoma progression
and identification of potential biomarkers. Oncol Lett.
14:3734–3740. 2017. View Article : Google Scholar : PubMed/NCBI
|
|
29
|
Diao Y, Fu H and Wang Q: MiR-221
exacerbate cell proliferation and invasion by targeting TIMP3 in
papillary thyroid carcinoma. Am J Ther. 24:e317–e328. 2017.
View Article : Google Scholar : PubMed/NCBI
|
|
30
|
Liu Z, Zhang J, Gao J and Li Y:
MicroRNA-4728 mediated regulation of MAPK oncogenic signaling in
papillary thyroid carcinoma. Saudi J Biol Sci. 25:986–990. 2018.
View Article : Google Scholar : PubMed/NCBI
|
|
31
|
Lee JC, Zhao JT, Gundara J, Serpell J,
Bach LA and Sidhu S: Papillary thyroid cancer-derived exosomes
contain miRNA-146b and miRNA-222. J Surg Res. 196:39–48. 2015.
View Article : Google Scholar : PubMed/NCBI
|
|
32
|
Han M, Chen L and Wang Y: miR-218
overexpression suppresses tumorigenesis of papillary thyroid cancer
via inactivation of PTEN/PI3K/AKT pathway by targeting Runx2. Onco
Targets Ther. 11:6305–6316. 2018. View Article : Google Scholar : PubMed/NCBI
|
|
33
|
Zheng Z, Zhou X, Cai Y, Chen E, Zhang X,
Wang O, Wang Q and Liu H: TEKT4 promotes papillary thyroid cancer
cell proliferation, colony formation, and metastasis through
activating PI3K/Akt pathway. Endocr Pathol. 29:310–316. 2018.
View Article : Google Scholar : PubMed/NCBI
|
|
34
|
Yu ST, Zhong Q, Chen RH, Han P, Li SB,
Zhang H, Yuan L, Xia TL, Zeng MS and Huang XM: CRLF1 promotes
malignant phenotypes of papillary thyroid carcinoma by activating
the MAPK/ERK and PI3K/AKT pathways. Cell Death Dis. 9:3712018.
View Article : Google Scholar : PubMed/NCBI
|
|
35
|
Xu J, Cai J, Jin X, Yang J, Shen Q, Ding X
and Liang Y: PIG3 plays an oncogenic role in papillary thyroid
cancer by activating the PI3K/AKT/PTEN pathway. Oncol Rep.
34:1424–1430. 2015. View Article : Google Scholar : PubMed/NCBI
|
|
36
|
Zhao H and Li H: Network-based
meta-analysis in the identification of biomarkers for papillary
thyroid cancer. Gene. 661:160–168. 2018. View Article : Google Scholar : PubMed/NCBI
|
|
37
|
Alao JP: The regulation of cyclin D1
degradation: Roles in cancer development and the potential for
therapeutic invention. Mol Cancer. 6:242007. View Article : Google Scholar : PubMed/NCBI
|
|
38
|
Jeon S, Kim Y, Jeong YM, Bae JS and Jung
CK: CCND1 splice variant as a novel diagnostic and predictive
biomarker for thyroid cancer. Cancers (Basel). 10:2018. View Article : Google Scholar
|
|
39
|
Yin Y, Hong S, Yu S, Huang Y, Chen S, Liu
Y, Zhang Q, Li Y and Xiao H: MiR-195 inhibits tumor growth and
metastasis in papillary thyroid carcinoma cell lines by targeting
CCND1 and FGF2. Int J Endocrinol. 2017:61804252017. View Article : Google Scholar : PubMed/NCBI
|
|
40
|
Zhou Y, Lu L, Jiang G, Chen Z, Li J, An P,
Chen L, Du J and Wang H: Targeting CDK7 increases the stability of
Snail to promote the dissemination of colorectal cancer. Cell Death
Differ. 26:1442–1452. 2019. View Article : Google Scholar : PubMed/NCBI
|
|
41
|
Lin T, Zhang B and He H: Identification of
genes correlated with oral squamous cell carcinoma. J Cancer Res
Ther. 14:S675–S679. 2018. View Article : Google Scholar : PubMed/NCBI
|
|
42
|
Wang Y, Xu H, Zhu B, Qiu Z and Lin Z:
Systematic identification of the key candidate genes in breast
cancer stroma. Cell Mol Biol Lett. 23:442018. View Article : Google Scholar : PubMed/NCBI
|
|
43
|
Shou X, Li Y, Hu W, Ye T, Wang G, Xu F,
Sui M and Xu Y: A six-gene Assay as a new biomarker in the blood of
patients with colorectal cancer: Establishment and clinical
validation. Mol Oncol. 13:781–791. 2019. View Article : Google Scholar : PubMed/NCBI
|
|
44
|
Li L, Cai S, Liu S, Feng H and Zhang J:
Bioinformatics analysis to screen the key prognostic genes in
ovarian cancer. J Ovarian Res. 10:272017. View Article : Google Scholar : PubMed/NCBI
|
|
45
|
Jasbi P, Wang D, Cheng SL, Fei Q, Cui JY,
Liu L, Wei Y, Raftery D and Gu H: Breast cancer detection using
targeted plasma metabolomics. J Chromatogr B Analyt Technol Biomed
Life Sci. 1105:26–37. 2019. View Article : Google Scholar : PubMed/NCBI
|
|
46
|
Johann DJ Jr, McGuigan MD, Patel AR, Tomov
S, Ross S, Conrads TP, Veenstra TD, Fishman DA, Whiteley GR,
Petricoin EF III and Liotta LA: Clinical proteomics and biomarker
discovery. Ann NY Acad Sci. 1022:295–305. 2004. View Article : Google Scholar : PubMed/NCBI
|
|
47
|
Port M, Boltze C, Wang Y, Röper B, Meineke
V and Abend M: A radiation-induced gene signature distinguishes
post-Chernobyl from sporadic papillary thyroid cancers. Radiat Res.
168:639–649. 2007. View Article : Google Scholar : PubMed/NCBI
|
|
48
|
Zhang K, Liu J, Li C, Peng X, Li H and Li
Z: Identification and validation of potential target genes in
papillary thyroid cancer. Eur J Pharmacol. 843:217–225. 2019.
View Article : Google Scholar : PubMed/NCBI
|
|
49
|
Yang X, Hu Y, Shi H, Zhang C, Wang Z, Liu
X, Chen H, Zhang L and Cui D: The diagnostic value of TROP-2, SLP-2
and CD56 expression in papillary thyroid carcinoma. Eur Arch
Otorhinolaryngol. 275:2127–2134. 2018. View Article : Google Scholar : PubMed/NCBI
|
|
50
|
Stephen JK, Chen KM, Merritt J, Chitale D,
Divine G and Worsham MJ: Methylation markers differentiate thyroid
cancer from benign nodules. J Endocrinol Invest. 41:163–170. 2018.
View Article : Google Scholar : PubMed/NCBI
|