Introduction
Lung cancer is a significant global health problem,
with an estimated total of 228,150 new cases and 142,670 deaths in
the United States in 2019 (1). Lung
cancer is the leading cause of cancer-related death worldwide
(2). Non-small cell lung cancer
(NSCLC) and small cell lung cancer are the two major histological
categories of lung cancer. Patients with NSCLC occasionally present
with malignant pleural effusion (MPE) or pericardial effusion
(MPCE) at the initial diagnosis (3)
and these patients are classified as being in the M1 stage
according to the 7th edition of the American Joint Committee on
Cancer (AJCC) tumor-node-metastasis (TNM) staging system (4). The median survival time of these
patients with the same stage can differ from 3 months to 1 year
(5). Determining the accurate
outcome for specific patients remains a challenge.
There are several published studies on the survival
prediction of patients with MPE and MPCE (6–8), most of
which are dependent on biomarker concentrations in the effusions.
However, to the best of our knowledge, a survival model
specifically describing the prognosis of patients with MPE or MPCE
with different demographic and clinicopathological characteristics
is not available. Predicted survival information from a nomogram
may assist patients and physicians in making appropriate decisions
with regards to management.
The aim of the present study was to construct a
survival model capable of predicting prognosis of patients with
stage IV NSCLC with MPE or MPCE at initial diagnosis, using the
data in the Surveillance, Epidemiology, and End Results (SEER)
database and to establish a nomogram to illustrate the association
between the prognostic factors and overall survival (OS).
Patients and methods
Study population
The present study was approved by The Ethics
Committee of Fuyang People's Hospital. Permission was obtained from
the Surveillance, Epidemiology and End Results (SEER) Program to
access the SEER research data files (reference no. 16924-Nov2017).
Informed consent was obtained from each patient in the validation
dataset. However, consent in the SEER training cohort was waived
considering the anonymous, observational, registry-based and
publicly available nature of the data. Patient data on individuals
was not reported.
The patient cohort data for the training dataset
were obtained from the SEER Program (seer.cancer.gov) SEER*Stat Database. Initial patient
selection was performed by specifying the site recode as ‘Lung and
Bronchus’. Patients with MPE or MPCE at initial diagnosis who were
diagnosed between January 2010 and December 2015 were included for
further study by selecting ‘CS Mets at DX’ with codes 15–18, 20–21,
32, 42 and 52. The codes were defined as follows: 15, malignant
pleural effusion, ipsilateral or same lung; 16, malignant pleural
effusion, contralateral or other lung; 17, malignant pleural
effusion, ipsilateral and contralateral lungs; 18, malignant
pleural effusion, unknown if ipsilateral or contralateral lung; 20,
malignant pericardial effusion; 21, malignant pericardial effusion
plus contralateral or bilateral pleural effusion; 32, distant lymph
nodes plus pleural or pericardial effusion; 42, distant metastasis
plus extension to contralateral lung; and 52, distant metastasis
plus distant lymph nodes plus pleural or pericardial effusion. The
exclusion criteria were as follows: i) Status of MPE or MPCE was
unknown at initial diagnosis; ii) missing or incomplete information
regarding race, stage, grade, histology, primary site or
laterality; and iii) death certificate only or autopsy only cases
in the SEER database. A total of 10,268 patients from the SEER
database were included, comprising 5,827 (56.7%) men and 4441
(43.3%) women. The median age at diagnosis in the training dataset
was 70 years (age range, 21–86 years).
The independent external validation dataset
consisted of patients with NSCLC with MPE or MPCE at initial
diagnosis between January 2013 and January 2018 who were
hospitalized at three institutions in China (Fuyang People's
Hospital, Fuyang Second People's Hospital and Affiliated Fuyang
Hospital of Anhui Medical University; all Fuyang, China). Patient
data, including survival time, age, race, sex, grade, histology,
laterality, stage, physical status, LDH levels in effusion,
neutrophil-to-lymphocyte ratio and status of MPE or MPCE at initial
diagnosis, were collected to validate the nomogram and to compare
with previous predictive model (7).
Patients were followed-up every 2 weeks and the observations for
this dataset were censored on January 1st, 2019. Patients with
missing values for the above variables were excluded. In the
validation dataset, 169 patients (54.2%) were men, and 143 patients
(45.8%) were women. The median age at diagnosis in the external
validation dataset was 72 years (age range, 25–87 years).
Statistical analysis
Age, race, sex, grade, histology, laterality, AJCC
7th edition TNM stage and status of MPE or MPCE at initial
diagnosis were included from the SEER database as the factors in
the training cohort. Using this cohort, several multivariate
regression models were built, including parametric models and
semiparametric models. The performance of the models was compared
using the Akaike information criteria (AIC), where the lowest AIC
value suggested the best predictive performance. This method has
been reported in previous studies on the construction and
evaluation of survival models (9,10). The
concordance index (C-index) was calculated to evaluate the
discriminatory ability of the survival model. A calibration curve
was created to show the difference between the predicted and actual
survival rate, and data represented the means ± standard error of
the mean. A nomogram was created based on the survival prediction
model with the lowest AIC. Internal validation was performed using
bootstrap resampling, while external validation was performed using
an independent cohort. The size of the external validation
population was calculated using Vergouwe's method (11). To determine the discrimination
ability of the nomogram, the total scores from the nomogram for
each patient in the training and validation datasets were
calculated. The patients were then divided into four prognosis
groups according to the quartiles of the predicted survival of the
training dataset, which were regarded as cutoffs for both the
training and validation cohorts. Kaplan-Meier survival curves were
constructed for certain TNM categories (M1a and M1b) and all
categories in both datasets with the above cutoffs, and the
log-rank test was applied for each category. To assess the
usefulness of the nomogram and the LENT (pleural fluid lactate
dehydrogenase, Eastern Cooperative Oncology Group performance
status, neutrophil to lymphocyte ratio and tumor type) scoring
system (7), receiver operating
characteristic (ROC) curves for 3-, 6-, 9- and 12-month survival
rates were calculated, and the areas under the curves (AUCs) were
also calculated and compared. ROC curves were compared using the
DeLong method (12). Statistical
analyses were formed using R (version 3.5.2; The R Foundation),
MedCalc software (version 11.4; MedCalc Software bvba) and SPSS
software (version 25.0; IBM Corp.)
Results
Patient characteristics
A total of 10,268 patients from the SEER database
were included in the final population for the survival analysis. Of
these, 7,562 patients (73.6%) had adenocarcinomas and 2,706
patients (26.4%) had other histological subtypes, such as large
cell carcinomas or squamous cell carcinomas. A total of 5,635
patients (54.9%) exhibited right laterality, 4,075 patients (39.7%)
exhibited left laterality and 558 patients (5.4%) had bilateral
lesions. This SEER cohort was used as the training dataset. The
independent external validation dataset consisted of 312 patients,
of whom 266 patients (85.3%) had adenocarcinomas, and 46 patients
(14.7%) had other histological types. A total of 175 patients
(56.1%) exhibited right primary site laterality, 110 patients
(35.2%) exhibited left primary site laterality and 27 patients
(8.7%) exhibited bilateral lesion of the primary site. The
demographic and clinicopathological characteristics of both cohorts
are listed in Table I.
 | Table I.Demographic and clinicopathological
characteristics of the training cohort and validation cohort. |
Table I.
Demographic and clinicopathological
characteristics of the training cohort and validation cohort.
| A, Training cohort,
n=10268 |
|---|
|
|---|
| Clinicopathological
characteristics | Number of patients
(%) | Median OS, months
(CI) |
|---|
| Sex |
|
|
| Male | 5,827 (56.7) | 6 (5.76–6.24) |
|
Female | 4,441 (43.3) | 8 (7.67–8.33) |
| Age at diagnosis,
years |
|
|
| ≤70 | 5,171 (50.4) | 9 (8.68–9.32) |
|
>70 | 5,097 (49.6) | 5 (4.79–5.21) |
| Race |
|
|
| American
Indian/Alaska Native | 43 (0.4) | 5 (1.85–8.15) |
| Asian or
Pacific Islander | 881 (8.6) | 12 (11.12–12.88) |
|
Black | 1,472 (14.3) | 7 (6.42–7.58) |
|
White | 7,872 (76.7) | 7 (6.80–7.20) |
| Primary site |
|
|
| Main
bronchus | 635 (6.2) | 5 (4.38–5.62) |
| Upper
lobe | 4,228 (41.2) | 7 (6.69–7.31) |
| Middle
lobe | 381 (3.7) | 8 (7.04–8.96) |
| Lower
lobe | 2,500 (24.3) | 8 (7.60–8.40) |
|
Overlapping lesion | 156 (1.5) | 5 (3.72–6.28) |
| Lung,
NOS | 2,368 (23.1) | 6 (5.62–6.38) |
| Histology |
|
|
| Large
cell carcinoma | 246 (2.4) | 4 (3.21–4.78) |
|
Adenocarcinoma | 7,562 (73.6) | 7 (6.77–7.23) |
| Squamous
cell carcinoma | 2,460 (24) | 6 (5.65–6.35) |
| Grade |
|
|
| I | 219 (2.1) | 10
(8.22–11.79) |
| II | 1,221 (11.9) | 8 (7.35–8.66) |
|
III | 2,211 (21.5) | 7 (6.59–7.41) |
| IV | 95 (0.9) | 4 (2.57–5.43) |
|
Unknown | 6,522 (63.5) | 7 (6.76–7.24) |
| Laterality |
|
|
|
Right | 5,635 (54.9) | 7 (6.74–7.26) |
|
Left | 4,075 (39.7) | 7 (6.69–7.31) |
|
Bilateral | 558 (5.4) | 6 (5.26–6.74) |
| T stage |
|
|
| T0 | 111 (1.1) | 8 (6.21–9.80) |
| T1 | 495 (4.8) | 10
(8.91–11.09) |
| T2 | 2,522 (24.6) | 8 (7.56–8.44) |
| T3 | 2,430 (23.7) | 7 (6.56–7.44) |
| T4 | 3,083 (30) | 6 (5.69–6.32) |
| Tx | 1,627 (15.8) | 6 (5.53–6.48) |
| N stage |
|
|
| N0 | 2,174 (21.2) | 9 (8.52–9.48) |
| N1 | 550 (5.4) | 8 (7.03–8.97) |
| N2 | 4,571 (44.5) | 6 (5.75–6.25) |
| N3 | 2,167 (21.1) | 7 (6.60–7.40) |
| Nx | 806 (7.8) | 5 (4.44–5.56) |
| M stage |
|
|
|
M1a | 4,611 (44.9) | 10
(9.65–10.35) |
|
M1b | 5,657 (55.1) | 5 (4.79–5.21) |
| Effusions at
diagnosis |
|
|
| MPE,
Ipsilateral | 3,028 (29.5) | 10
(9.57–10.43) |
| MPE,
Contralateral | 145 (1.4) | 10
(8.31–11.69) |
| MPE,
Bilateral | 524 (5.1) | 8
(7.12–8.88) |
| MPE,
unknown | 342 (3.3) | 8
(7.05–8.95) |
|
MPCE | 366 (3.6) | 10
(8.98–11.02) |
| MPCE +
MPE | 206 (2.0) | 8
(6.75–9.25) |
| DLN +
MPE or MPCE | 336 (3.3) | 9
(8.00–10.00) |
| DM +
MPE or MPCE | 4,329 (42.1) | 5
(4.78–5.22) |
| DM +
DLN + MPE or MPCE | 992 (9.7) | 5
(4.54–5.46) |
|
| B, Validation
set, n=312 |
|
|
Clinicopathological
characteristics | Number of
patients (%) | Median OS,
months (CI) |
|
| Sex |
|
|
|
Male | 169 (54.2) | 11
(9.54–12.46) |
|
Female | 143 (45.8) | 12
(10.27–13.73) |
| Age at diagnosis,
years |
|
|
|
≤70 | 140 (44.9) | 14
(12.23–15.77) |
|
>70 | 172 (55.1) | 9 (7.37–10.64) |
| Race |
|
|
|
American Indian/Alaska
Native | NA | NA |
| Asian
or Pacific Islander | 312 (100) | 12
(11.04–12.96) |
|
Black | NA | NA |
|
White | NA | NA |
| Primary site |
|
|
| Main
bronchus | 13 (4.2) | 9 (2.64–15.36) |
| Upper
lobe | 119 (38.1) | 13
(11.86–14.14) |
| Middle
lobe | 11 (3.5) | 12
(4.72–19.28) |
| Lower
lobe | 69 (22.1) | 12
(9.73–14.27) |
|
Overlapping lesion | 7 (2.2) | 4 (1.43–6.57) |
| Lung,
NOS | 93 (29.8) | 9 (6.38–11.62) |
| Histology |
|
|
| Large
cell carcinoma | 5 (1.6) | 2 (0.00–4.15) |
|
Adenocarcinoma | 266 (85.3) | 12
(10.83–13.17) |
|
Squamous cell carcinoma | 41 (13.1) | 9 (6.44–11.56) |
| Grade |
|
|
| I | 219 (70.2) | 11
(9.56–12.45) |
| II | 4 (1.3) | 21 (NA) |
|
III | 41 (13.1) | 13
(11.93–14.07) |
| IV | 48 (15.4) | 13
(9.53–16.47) |
|
Unknown | NA | NA |
| Laterality |
|
|
|
Right | 175 (56.1) | 12
(10.95–13.05) |
|
Left | 110 (35.2) | 12
(9.55–14.45) |
|
Bilateral | 27 (8.7) | 11
(5.33–16.68) |
| T stage |
|
|
| T0 | 5 (1.6) | NA |
| T1 | 10 (3.2) | 25
(0.84–49.17) |
| T2 | 67 (21.5) | 14
(10.99–17.01) |
| T3 | 67 (21.5) | 13
(10.16–15.84) |
| T4 | 93 (29.8) | 11
(8.03–13.97) |
| Tx | 70 (22.4) | 9 (6.77–11.23) |
| N stage |
|
|
| N0 | 52 (16.7) | 12
(9.53–14.47) |
| N1 | 15 (4.8) | 14
(10.77–17.23) |
| N2 | 138 (44.2) | 11
(9.68–12.32) |
| N3 | 64 (20.5) | 12
(10.5–13.50) |
| Nx | 43 (13.8) | 9 (6.78–11.22) |
| M stage |
|
|
|
M1a | 142 (45.5) | 13
(11.56–14.44) |
|
M1b | 170 (54.5) | 10
(8.08–11.92) |
| Effusions at
diagnosis |
|
|
| MPE,
Ipsilateral | 100 (32.0) | 14
(11.93–16.07) |
| MPE,
Contralateral | 2 (0.6) | 12 (NA) |
| MPE,
Bilateral | 8 (2.6) | 8 (2.46–13.54) |
| MPE,
unknown | 15 (4.8) | 9 (7.28–10.73) |
|
MPCE | 9 (2.9) | 14
(12.61–15.39) |
| MPCE +
MPE | 8 (2.6) | 9 (3.39–14.62) |
| DLN +
MPE or MPCE | 10 (3.2) | 12
(9.22–14.79) |
| DM +
MPE or MPCE | 118 (37.8) | 10
(7.96–12.05) |
| DM +
DLN + MPE or MPCE | 42 (13.5) | 8 (5.67–10.33) |
OS of the training and validation
cohorts
The median survival time of the training cohort was
7 months [95% confidence interval (CI), 6.8–7.2 months]. The 3-,
6-, 9- and 12-month survival rates of the training cohort were
71.0, 52.4, 38.5 and 28.3%, respectively. The median survival time
of the validation cohort was 12.0 months (95% CI, 11.0–13.0
months). The 3-, 6-, 9- and 12-month survival rates of the
validation cohort were 85.2, 72.6, 59.4 and 44.5%, respectively
(data not shown).
Development of the survival model
Parametric models and semiparametric models were
built using the SEER training cohort. The lognormal model had an
AIC of 48483.84, which was the lowest value among the Cox
proportional hazard (133573.7), Weibull (49645.39), Gaussian
(53229.58), exponential (50999.93), logistic (53440.71) and
loglogistic (48902.85) models. The nomogram was developed based on
the lognormal model (Fig. 1). For
example, the effusion factor consisted of ipsilateral MPE,
contralateral MPE, MPCE, effusion with distant lymph node(s) (DLN),
effusion with distant metastases (DM) and effusion with both DM and
DLN metastases. Ipsilateral MPE (46.0 points) had the largest point
value, which predicted the best survival, whereas effusion with
both DM and DLN metastasis (0 point) had the smallest point value,
which predicted the worst survival rate. The scores for each
variable in the nomogram are listed in Table II.
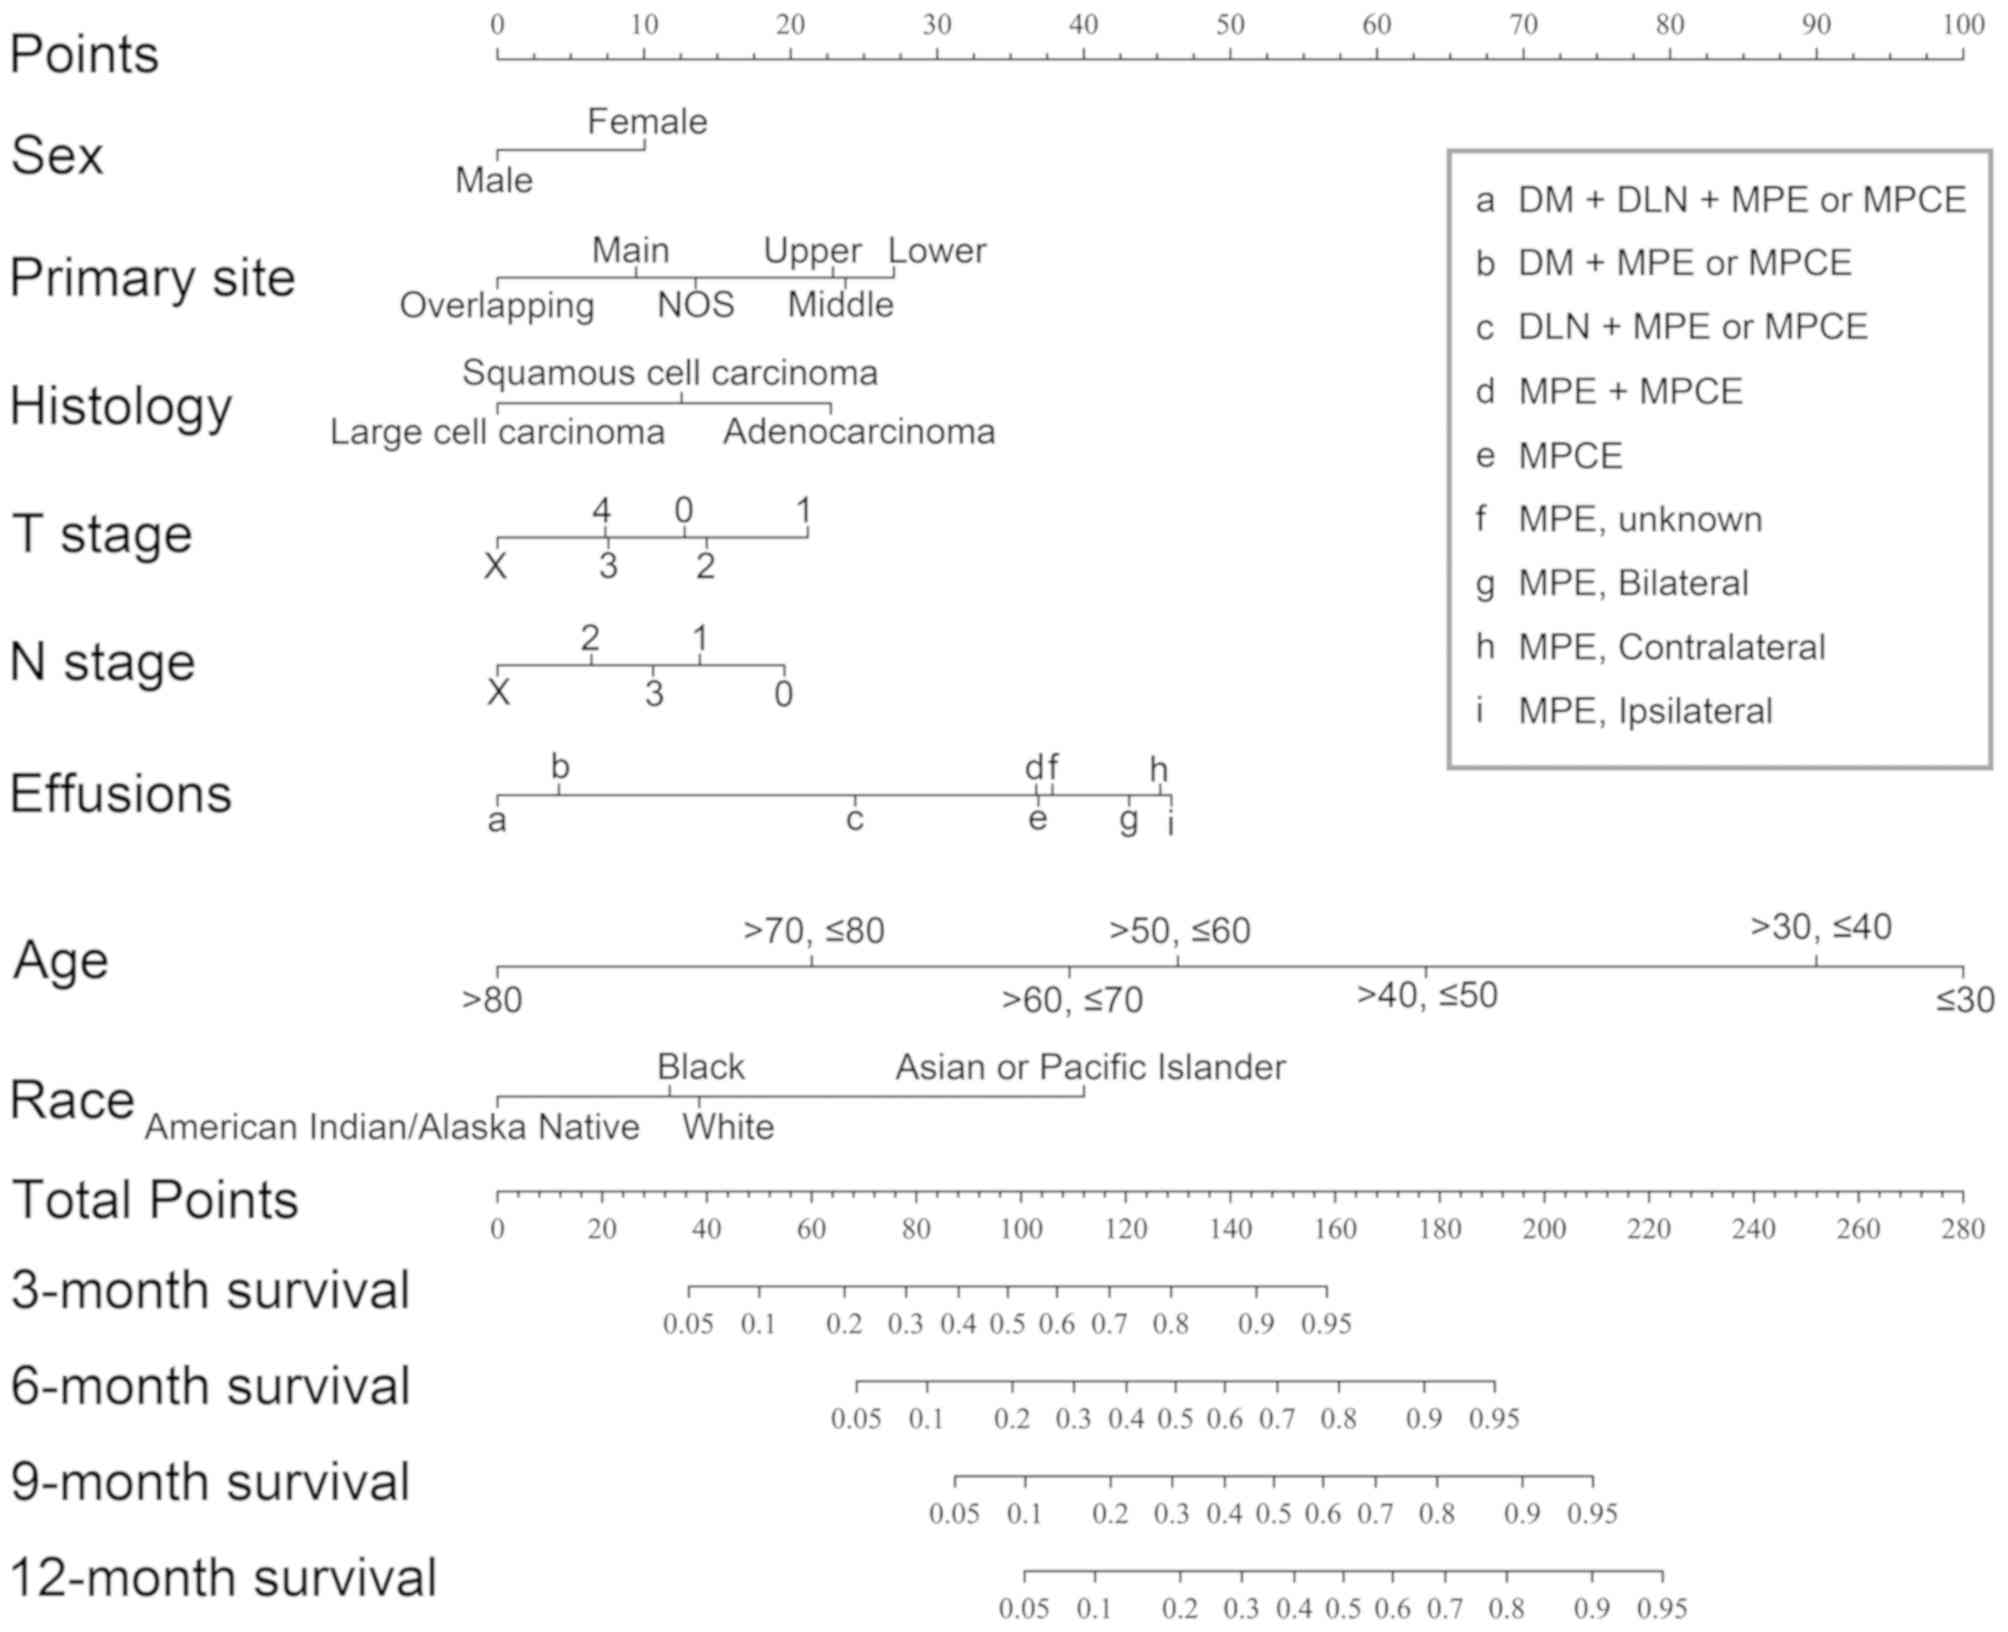 | Figure 1.Prognostic nomogram for patients with
NSCLC with MPE or MPCE. The points for each variable was added up
to obtain the total points and the final scores were used to
estimate 3-, 6-, 9- and 12-month survival. NSCLC, non-small cell
lung cancer; Overlapping, overlapping lesion of lung; Main, main
bronchus; NOS, not otherwise specified lesion of lung; Upper, upper
lobe of lung; Middle, middle lobe of lung; Lower, lower lobe of
lung; MPE, malignant pleural effusion; MPCE, malignant pericardial
effusion; DLN, distant lymph node(s); DM, distant metastasis. |
| Table II.Points assignment for each
variable. |
Table II.
Points assignment for each
variable.
| Variables | Points |
|---|
| Sex |
|
|
Male | 0 |
|
Female | 10.0 |
| Age at diagnosis,
years |
|
|
≤30 | 100.0 |
| >30,
≤40 | 90.0 |
| >40,
≤50 | 63.3 |
| >50,
≤60 | 46.4 |
| >60,
≤70 | 39.0 |
| >70,
≤80 | 21.4 |
|
>80 | 0 |
| Primary site |
|
| Main
bronchus | 9.5 |
| Upper
lobe | 22.9 |
| Middle
lobe | 23.7 |
| Lower
lobe | 27.1 |
|
Overlapping lesion | 0 |
| Lung,
NOS | 13.5 |
| Histology |
|
| Large
cell carcinoma | 0 |
|
Adenocarcinoma | 22.7 |
|
Squamous cell carcinoma | 12.6 |
| T stage |
|
| T0 | 12.8 |
| T1 | 21.2 |
| T2 | 14.3 |
| T3 | 7.6 |
| T4 | 7.4 |
| Tx | 0 |
| N stage |
|
| N0 | 19.6 |
| N1 | 13.8 |
| N2 | 6.4 |
| N3 | 10.6 |
| Nx | 0 |
| Effusions at
diagnosis |
|
| MPE,
Ipsilateral | 46.0 |
| MPE,
Contralateral | 45.2 |
| MPE,
Bilateral | 36.9 |
| MPE,
unknown | 43.1 |
|
MPCE | 37.9 |
| MPCE +
MPE | 24.4 |
| DLN +
MPE or MPCE | 36.8 |
| DM +
MPE or MPCE | 4.2 |
| DM +
DLN + MPE or MPCE | 0 |
| Race |
|
|
American Indian/Alaska
Native | 0 |
| Asian
or Pacific Islander | 40.0 |
|
Black | 11.7 |
|
White | 13.8 |
Validation and calibration of the
survival model
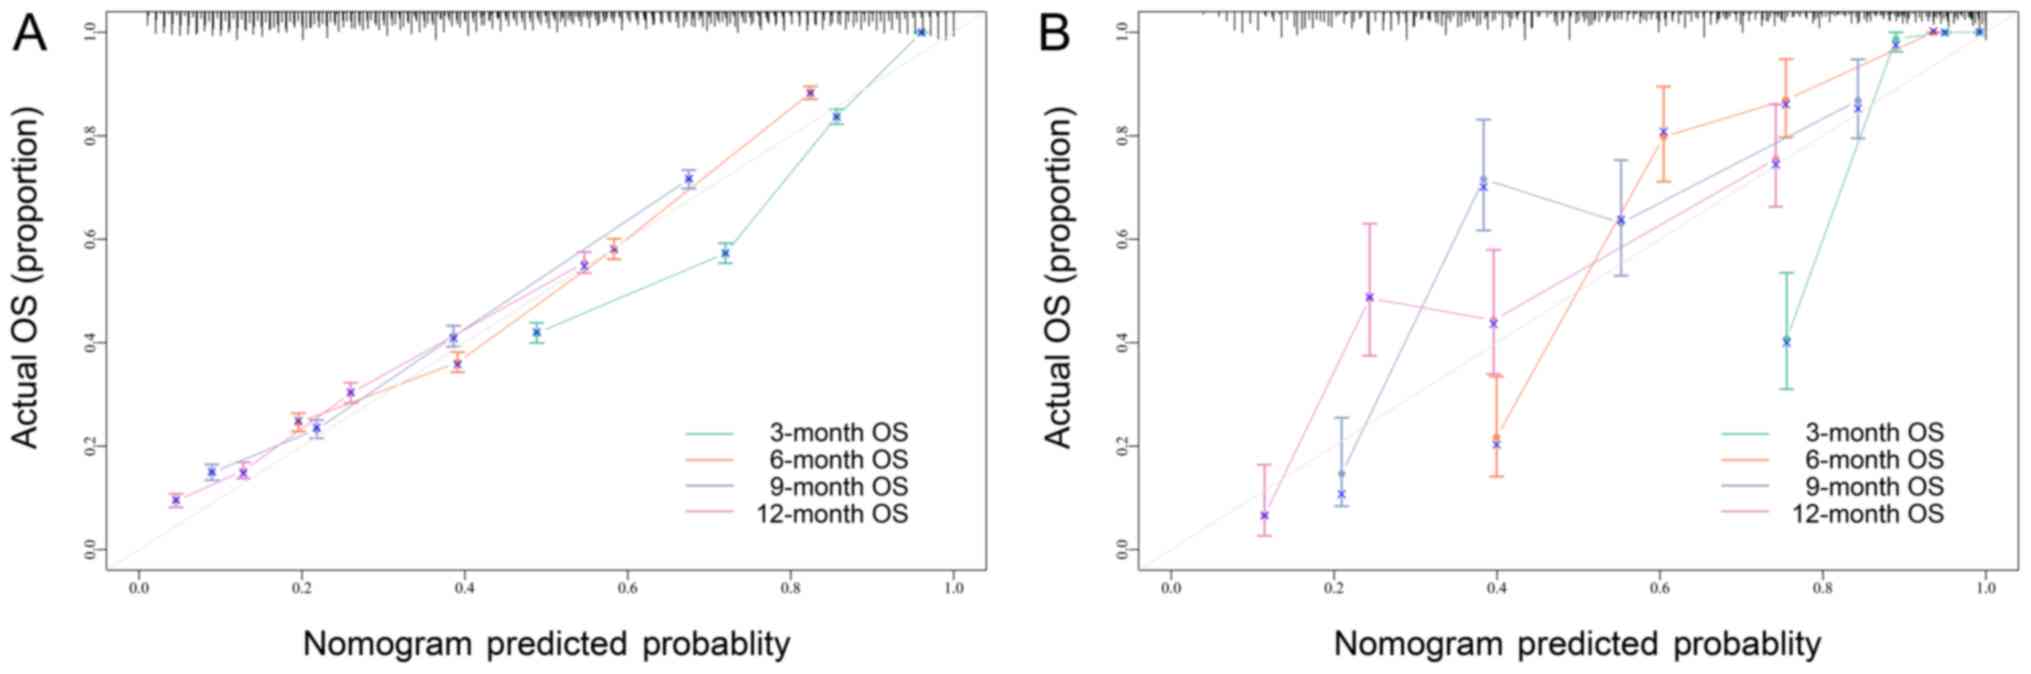
The C-index of the survival model was 0.736 in the
training cohort and 0.772 in the validation cohort. Calibration
curves were drawn using the internal bootstrap method (A) and with
an independent external dataset (B) in Fig. 2. These curves showed an acceptable
fit between the actual and nomogram-predicted probability of
OS.
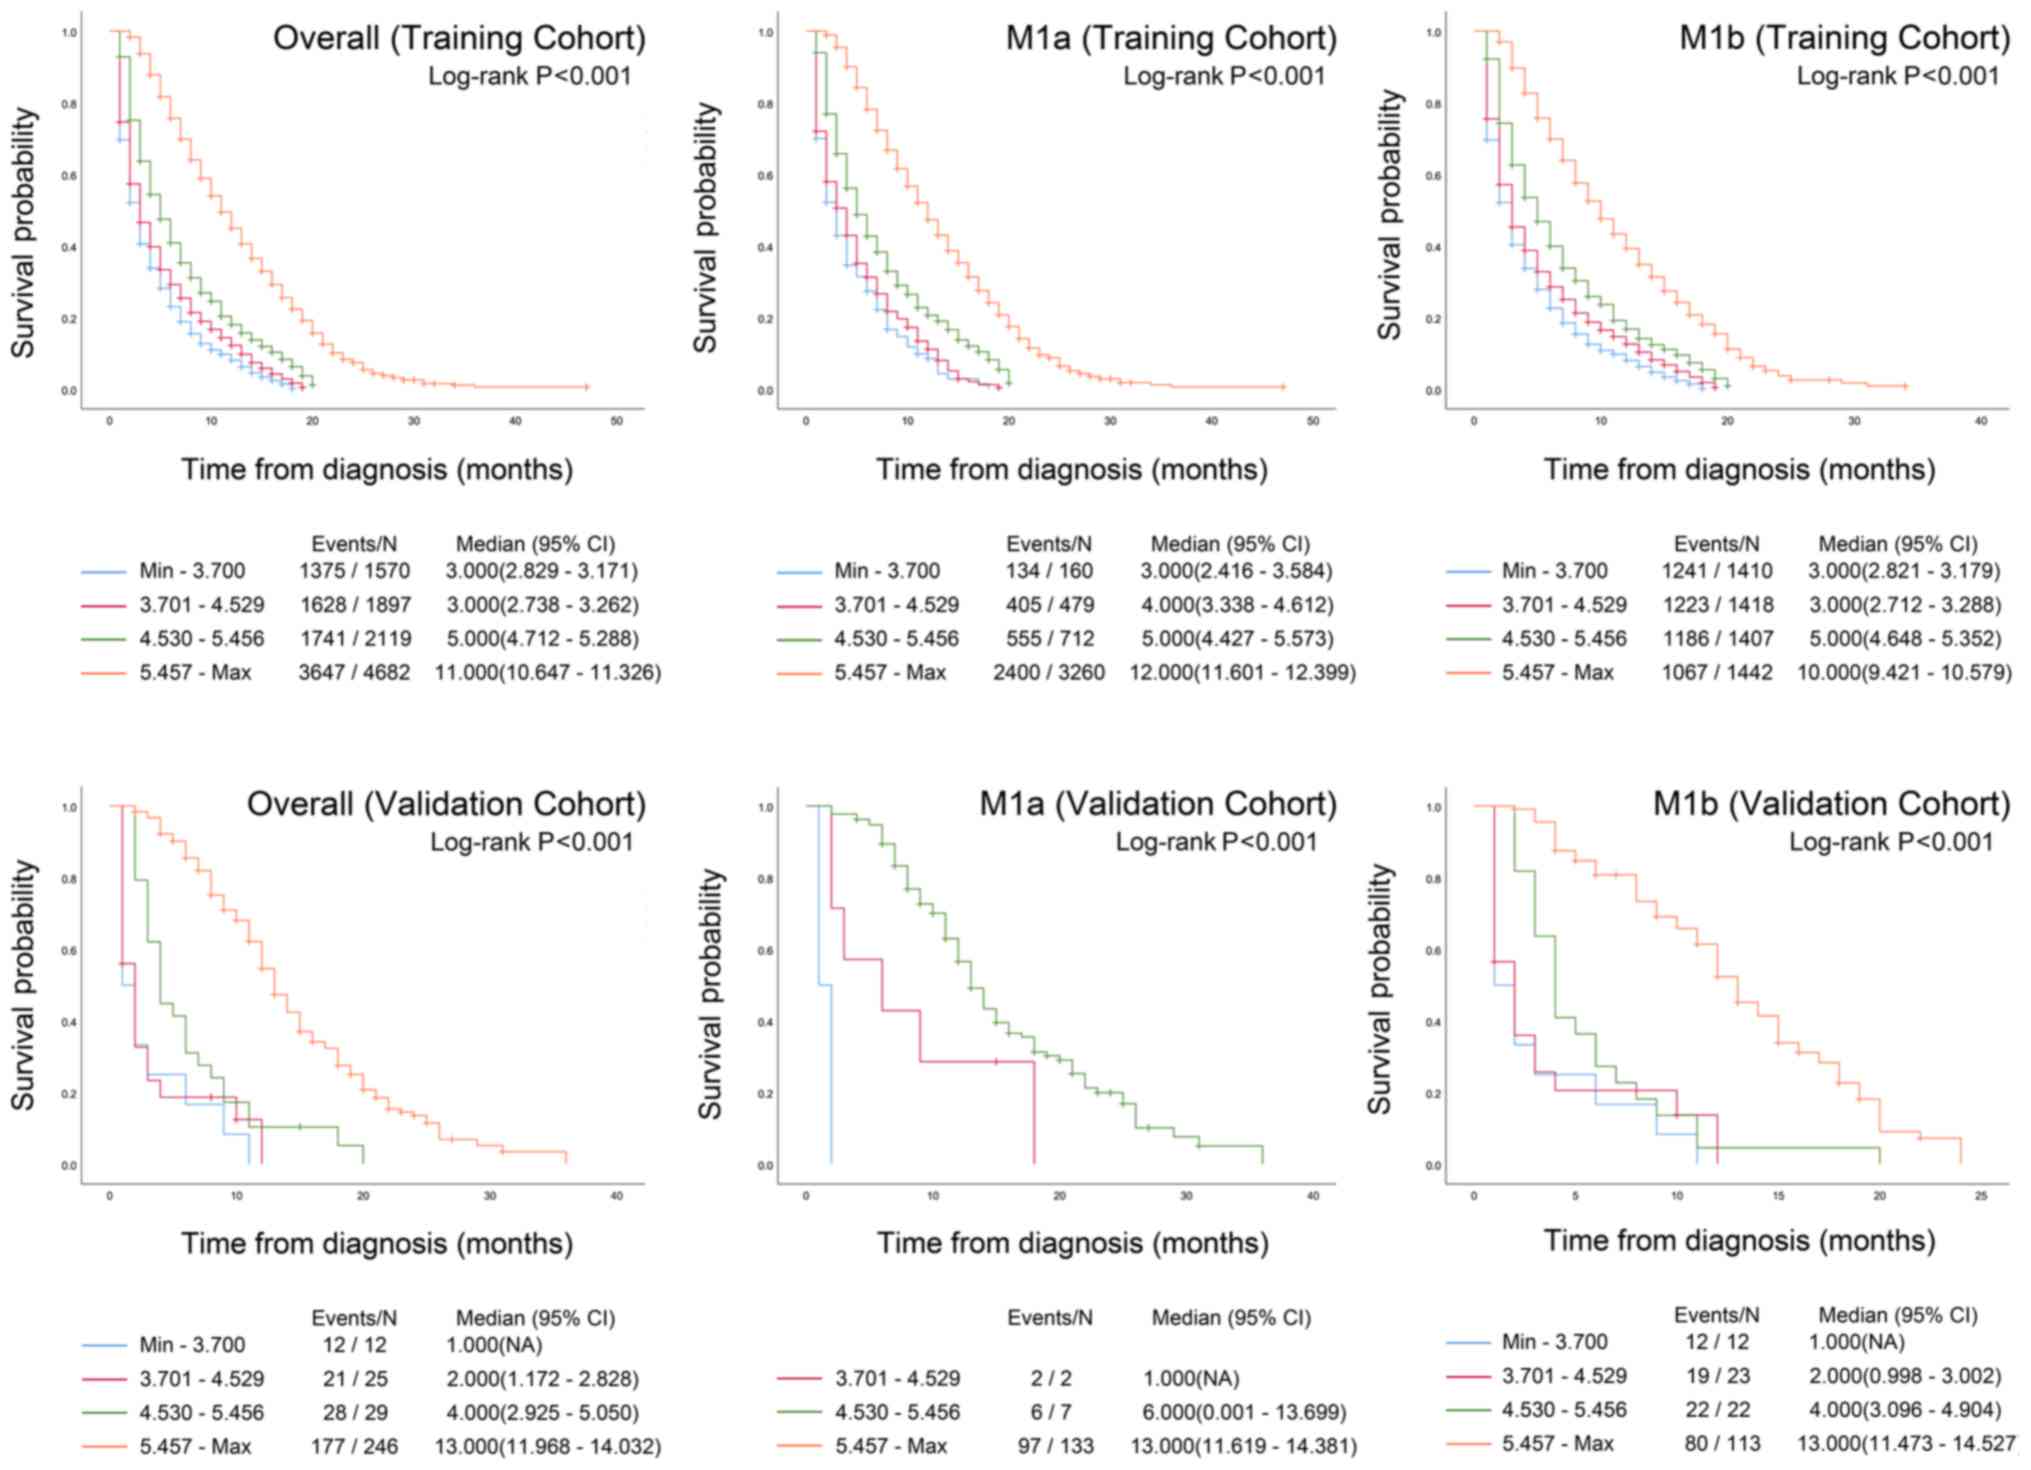
Risk group stratification
The total points of the present nomogram for each
patient in the training and validation cohorts were calculated.
Patients in both cohorts were divided into four prognostic groups
according to the quartiles of the predicted survival of the
training cohort. Kaplan-Meier survival curves were constructed for
all patients and for patients with certain M stages (M1a and M1b)
in both the training and validation datasets. Significant
differences in the 4 prognostic groups were observed for the M1a
stage, M1b stage and overall dataset in both cohorts (all
P<0.001; Fig. 3).
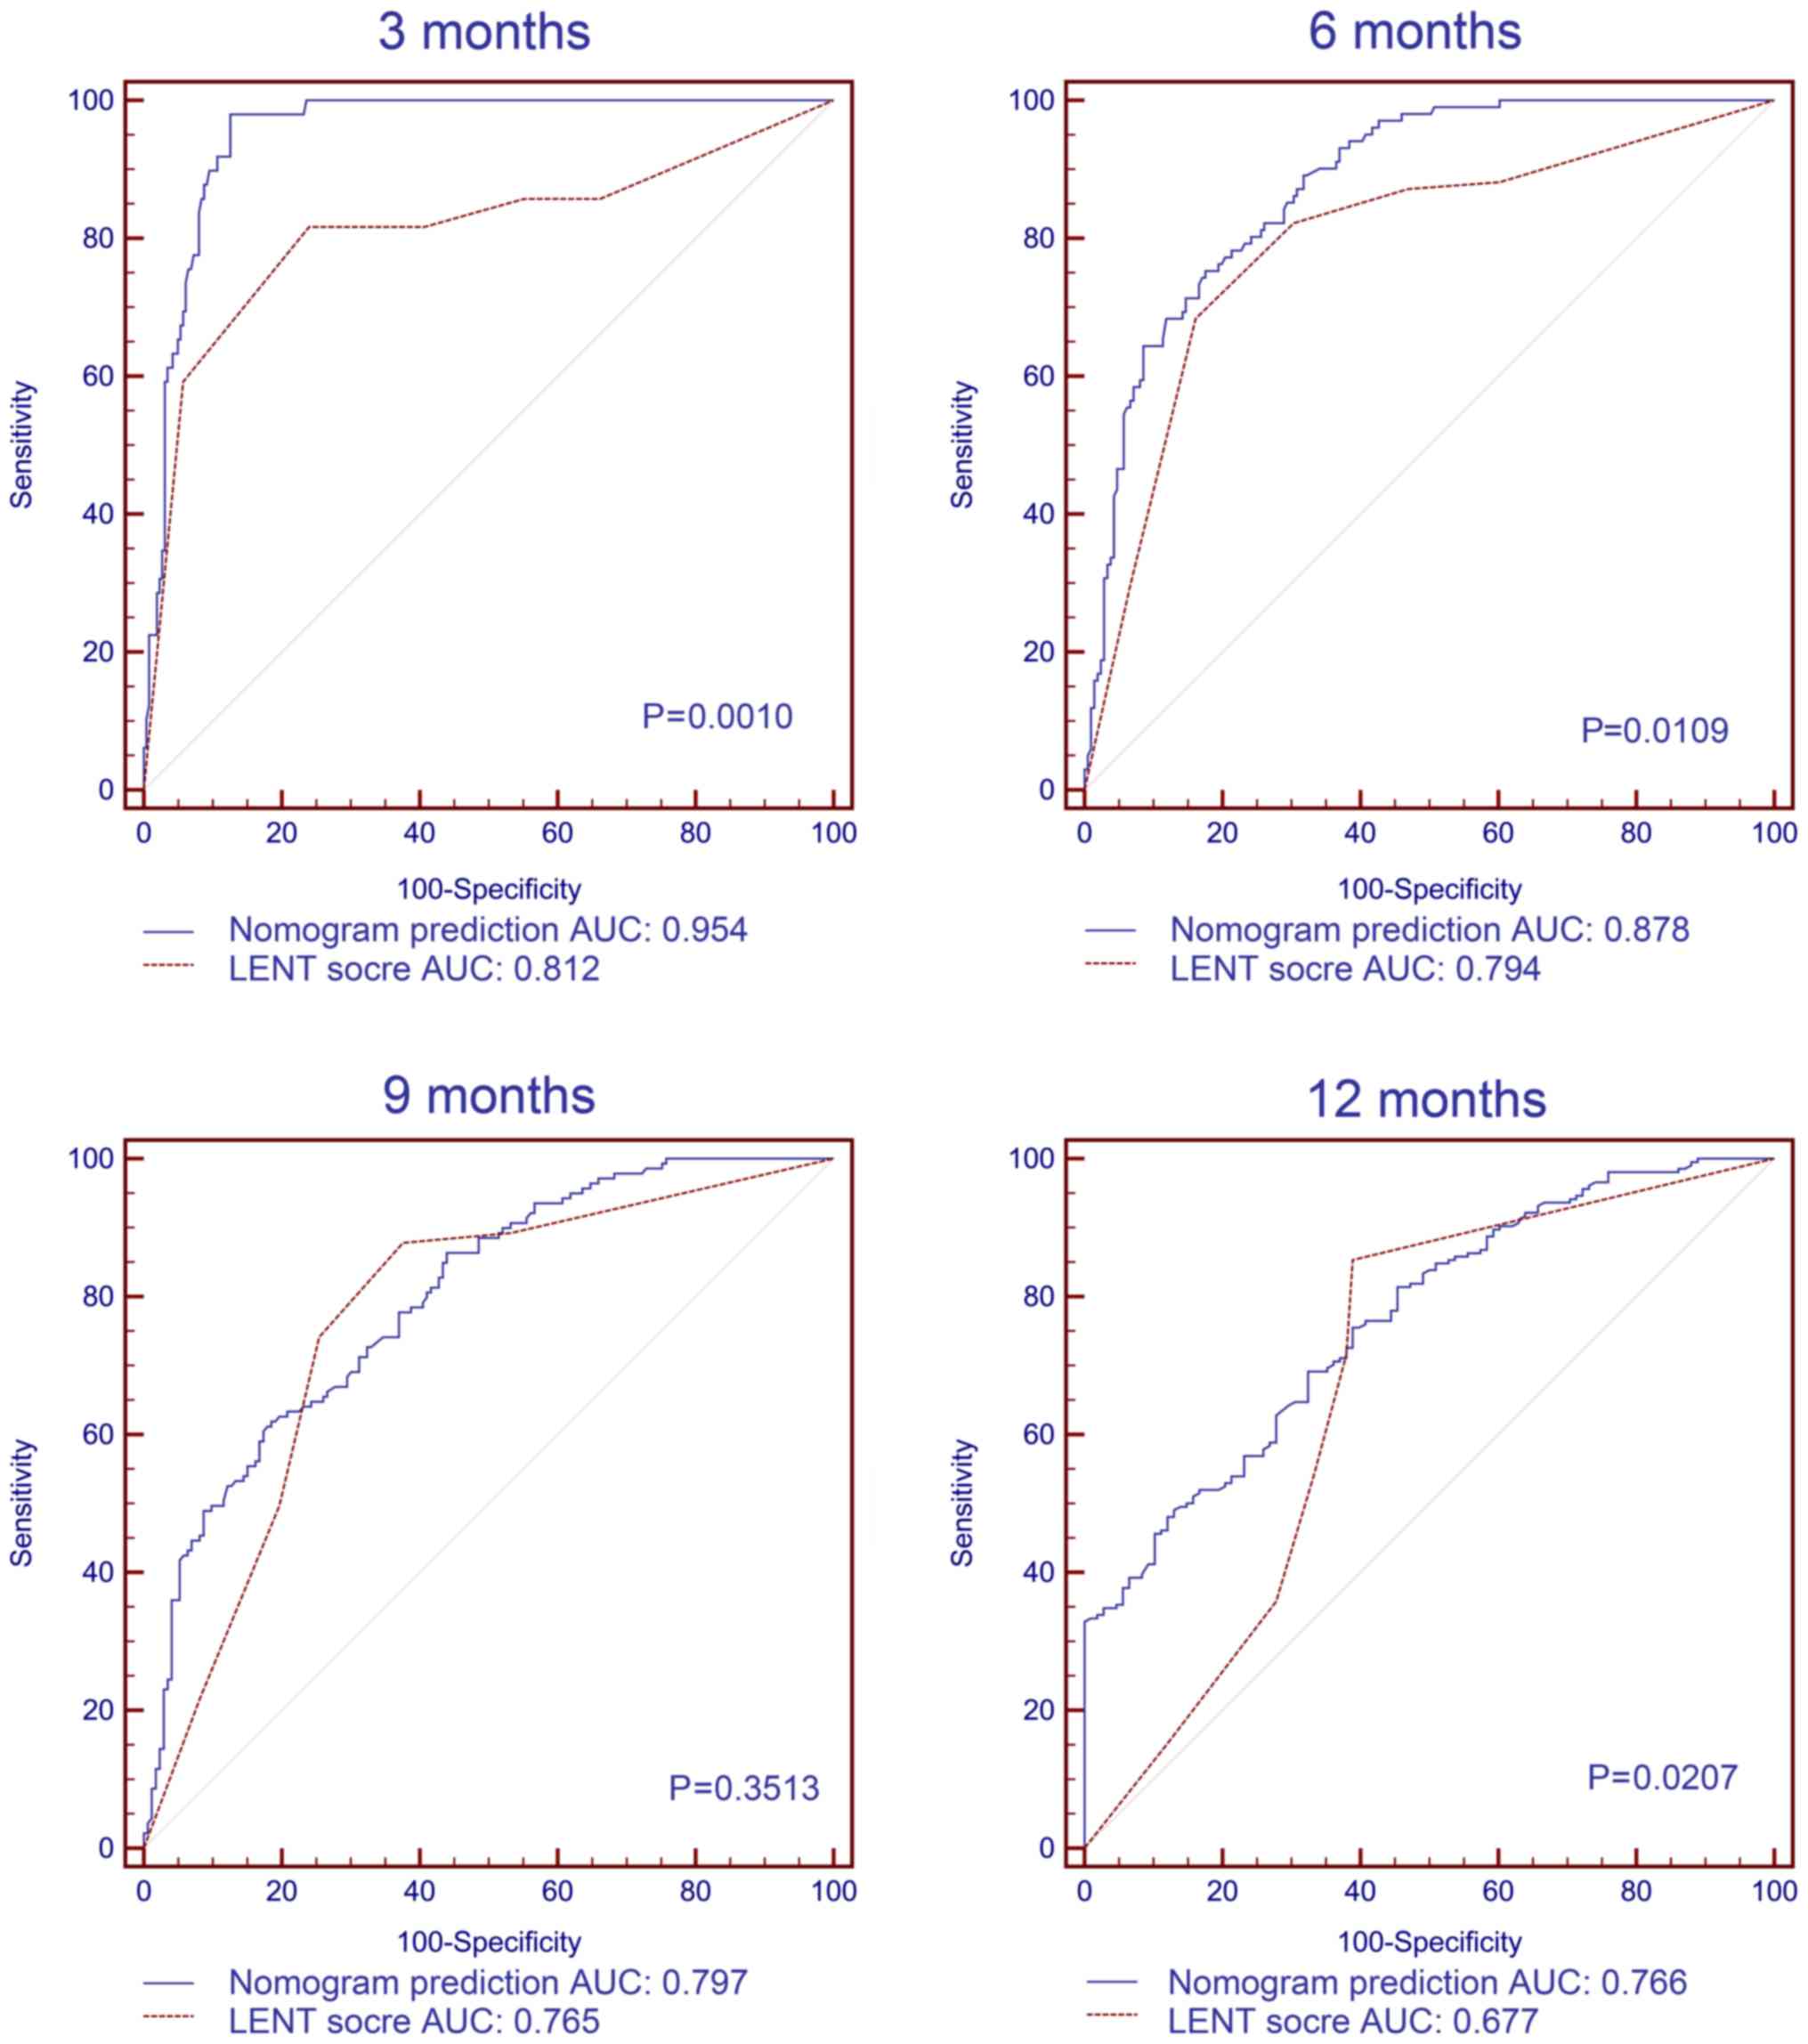
Comparison of the nomogram with the
LENT score in patients with pleural effusion
A total of 303 patients (97.1%) in the validation
dataset had pleural effusion. The median score from the LENT system
for the validation dataset patients with pleural effusion was 5
(inter-quartile range 3–7). ROC curves were generated to compare
the 3-, 6-, 9- and 12-month survival predictions of the LENT
scoring system and the present nomogram for the patients with
pleural effusion in the validation dataset. The AUC values of the
present nomogram were significantly higher compared with the LENT
scoring system for predicting 3-, 6- and 12-month survival (all
P<0.05; Fig. 4). The exception
was the prediction of 9-month survival, for which the AUC values
for the LENT score and the nomogram were 0.765 (95% CI,
0.714–0.811) and 0.797 (95% CI, 0.748–0.840), respectively
(P=0.3513).
Discussion
MPE or MPCE is observed in >15% of patients at
initial diagnosis of NSCLC (3,13).
Prediction of survival is important for the stratification and
management of patients because it can help physicians select
appropriate therapies and identify patients who require palliative
care (14). The TNM staging system
allows for stratification of patients into two (M1a and M1b, AJCC
7th edition) or three (M1a, M1b and M1c, AJCC 8th edition) groups
(15); however, risk group
stratification showed that the present nomogram has an acceptable
discrimination ability, even within a specific M stage.
Several predictive models for survival in MPE or
MPCE have been published; however, a number of these are based on
biomarker concentrations in the serum and/or in the effusion
(6,7,16). In
addition to the difficulty in accessing a sufficient effusion
sample in patients with a poor physical status or a low effusion
volume, the biomarker concentration in a sample can vary due to
different measurement techniques (17). The application of diuretics can also
influence the concentration of biomarkers (18), which may limit the usability,
accuracy and repeatability of those models.
A recently published study evaluated the performance
of the widely used LENT scoring system with an Asian lung
adenocarcinoma cohort, and reported that the LENT score
underestimated the OS in this distinct group (3). This result could be due to the high
prevalence of epidermal growth factor receptor (EGFR) mutations in
these patients (19), and these
patients may benefit from tyrosine kinase inhibitor therapy, which
leads to prolonged OS (20). The
nomogram developed in the present study showed that female patients
(10.0 points) with adenocarcinoma (22.7 points) and Asian or
Pacific Islander ethnicity (40.0 points) had the highest points for
each variable, suggesting that patients with these characteristics
had longer predicted survival. This may be due to the fact that
patients with these characteristics have a high EGFR mutation
incidence, and that EGFR mutations predict benefit from treatment
(21,22).
Nomograms have been shown to provide more accurate
and individualized survival predictions (23). In the present study, the nomogram was
accurate for the training and validation cohorts. Nomograms are
also a useful tool for visualizing prognostic factors (24), and the present nomogram revealed
different prognoses among each of the factors. Tumor grade is an
important independent prognostic marker; however, in the
construction of the present prognostic model, it was found that
including the tumor grade did not significantly improve the
efficiency of the model (data not shown). A possible explanation
for this is that the tumor grade may be interrelated with other
factors in the present model and that these factors may be highly
efficient. Another explanation may be that the present model
focused on a specific subgroup, namely patients with stage IV
NSCLC. Metastatic tumor cells may be more aggressive due to their
heterogeneity, which makes the grade of primary tumor less useful
for prognostic predictions (25). In
the present nomogram, the value of the N component is not arranged
regularly from small to large, as the definition of regional lymph
nodes in the NSCLC TNM stage system is by lymph node location
rather than by the number of positive lymph nodes, which may
suggest that patients with MPE and MPCE metastases in specific
lymph node locations may have a less favorable prognosis.
The AUCs of the ROC curves for the LENT scoring
system in the present validation cohort were quite similar to those
in the report of the LENT study (7).
The AUCs were reported to be 0.7571 for 3 months and 0.8094 for 6
months in the LENT scoring system for the UK cohort 2 (7), and in the present study the AUCs were
0.812 for 3 months and 0.794 for 6 months. The ROC curves showed
that the present nomogram, based on demographic and
clinicopathological characteristics, may provide a similar 9-month
survival prediction as that generated by the LENT scoring system
and better predictions for 3-, 6- and 12-month survival. Therefore,
the present nomogram may be an additional option for physicians to
predict survival of patients with NSCLC with MPE or MPCE at the
initial diagnosis.
The median survival of the validation cohort was
longer than that of the training cohort and this may be due to
differences in the races of the patients included in each cohort.
However, the present nomogram still provided a good prediction of
outcomes for the patients in the validation cohort, as the point
values were 13.8 for white patients and 40.0 for Asian patients in
the race factor of the predictive model. This observation suggested
that the present nomogram remained robust in a homogeneous Asian
population and thus indicated that the nomogram may be preferably
used for Asian patients. Nevertheless, further studies that
validate this nomogram in a cohort with races are still
required.
As the SEER database contains retrospective data and
uses a collaborative stage data collection system that records only
coding data to protect the identities of cancer patients (26), it is difficult to precisely convert
the patient data recorded with the AJCC 7th edition of TNM staging
to the AJCC 8th edition. The nomogram of the present study is
depicted with the AJCC 7th edition. However, the difference between
the 7th and 8th editions is that the specific Tumor component is
small and these differences are well known to specialists; however,
no change was made to the Node component. Therefore, any
inconsistencies caused by the differences in editions of the
staging system when using the present nomogram should be
minimal.
The present study had several limitations. Firstly,
some of the clinicopathological variables and molecular markers,
such as physical status (27,28),
EGFR mutation and PD-L1 status, which may influence the survival of
patients with lung cancer (22,29), are
not included in the SEER database; however, these biomarkers are
more predictive than prognostic, which may limit their use in a
prognosis prediction model (30).
Secondly, the time of disease progression was not available in the
SEER database, thus it was not possible to construct predictive
models of progression-free survival. Additionally, the nomogram
developed in the present study performed better for cases near the
median; whereas for discrete cases the predictive performance was
poor, which is a common limitation of predictive models (31). MPCE was included in the present study
as the SEER database used a ‘CS Mets at DX’ item to describe MPE or
MPCE. Each patient was categorized into a specific group, such as
‘DLN + MPE or MPCE’, ‘DM + MPE or MPCE’, MPE, and ‘MPE + MPCE’.
Thus, it was difficult to determine whether a patient in the ‘DLN +
MPE or MPCE’ group had MPE or MPCE, and excluding this group may
have led to a bias in the predicted model. Finally, although the
present nomogram was built based on a large population and was
calibrated by both internal bootstrap resampling and an external
cohort, the external cohort was collected from one district, which
may lead to potential bias in validation and calibration, including
the limited diversity of patient characteristics. A large external
validation cohort is required to confirm the nomogram.
In conclusion, nomograms may provide a precise and
easily understandable illustration of survival for healthcare
providers of patients with lung cancer with MPE or MPCE at the
initial diagnosis. In the present study, a nomogram was constructed
for predicting the survival of patients with NSCLC with MPE or MPCE
at initial diagnosis based on the SEER database. The nomogram
developed in the present study may improve prognostic prediction
and disease management for patients with lung cancer.
Acknowledgements
Not applicable.
Funding
No funding was received.
Availability of data and materials
The datasets used and/or analyzed during the current
study are available from the corresponding author on reasonable
request.
Authors' contributions
TT and WH designed the study and analyzed the data.
PZ, CS and JZ participated in data acquisition. FZ participated in
data interpretation. All authors read and approved the final
manuscript.
Ethical approval and consent to
participate
The present study was approved by The Ethics
Committee of Fuyang People's Hospital (Fuyang, China). Permission
was obtained from the Surveillance, Epidemiology, and End Results
(SEER) Program to access the SEER research data files (reference
no. 16924-Nov2017). Informed consent was obtained from each patient
in the validation dataset. However, consent in the SEER training
cohort was waived by The Ethics Committee of Fuyang People's
Hospital (Fuyang, China) considering the anonymous, observational,
registry-based, and publicly available nature.
Patient consent for publication
Not applicable.
Competing interests
The authors declare that they have no competing
interests.
References
|
1
|
Siegel RL, Miller KD and Jemal A: Cancer
statistics, 2019. CA Cancer J Clin. 69:7–34. 2019. View Article : Google Scholar : PubMed/NCBI
|
|
2
|
Bray F, Ferlay J, Soerjomataram I, Siegel
RL, Torre LA and Jemal A: Global cancer statistics 2018: GLOBOCAN
estimates of incidence and mortality worldwide for 36 cancers in
185 countries. CA Cancer J Clin. 68:394–424. 2018. View Article : Google Scholar : PubMed/NCBI
|
|
3
|
Abisheganaden J, Verma A, Dagaonkar RS and
Light RW: An observational study evaluating the performance of LENT
score in the selected population of malignant pleural effusion from
lung adenocarcinoma in Singapore. Respiration. 96:308–313. 2018.
View Article : Google Scholar : PubMed/NCBI
|
|
4
|
Ou SH and Zell JA: Validation study of the
proposed IASLC staging revisions of the T4 and M non-small cell
lung cancer descriptors using data from 23,583 patients in the
California cancer registry. J Thorac Oncol. 3:216–227. 2008.
View Article : Google Scholar : PubMed/NCBI
|
|
5
|
Roberts ME, Neville E, Berrisford RG,
Antunes G and Ali NJ; BTS Pleural Disease Guideline Group, :
Management of a malignant pleural effusion: British thoracic
society pleural disease guideline 2010. Thorax. 65 (Suppl
2):ii32–ii40. 2010. View Article : Google Scholar : PubMed/NCBI
|
|
6
|
Psallidas I, Kanellakis NI, Gerry S,
Thézénas ML, Charles PD, Samsonova A, Schiller HB, Fischer R,
Asciak R, Hallifax RJ, et al: Development and validation of
response markers to predict survival and pleurodesis success in
patients with malignant pleural effusion (PROMISE): A multicohort
analysis. Lancet Oncol. 19:930–939. 2018. View Article : Google Scholar : PubMed/NCBI
|
|
7
|
Clive AO, Kahan BC, Hooper CE, Bhatnagar
R, Morley AJ, Zahan-Evans N, Bintcliffe OJ, Boshuizen RC, Fysh ET,
Tobin CL, et al: Predicting survival in malignant pleural effusion:
Development and validation of the LENT prognostic score. Thorax.
69:1098–1104. 2014. View Article : Google Scholar : PubMed/NCBI
|
|
8
|
Bildirici U, Celikyurt U, Acar E, Bulut O,
Sahin T, Kozdag G and Ural D: The value of serum tumour markers in
the prediction of aetiology and follow up of patients with
pericardial effusion. Cardiovasc J Afr. 23:143–146. 2012.
View Article : Google Scholar : PubMed/NCBI
|
|
9
|
Wang SJ, Lemieux A, Kalpathy-Cramer J, Ord
CB, Walker GV, Fuller CD, Kim JS and Thomas CR Jr: Nomogram for
predicting the benefit of adjuvant chemoradiotherapy for resected
gallbladder cancer. J Clin Oncol. 29:4627–4632. 2011. View Article : Google Scholar : PubMed/NCBI
|
|
10
|
Eil R, Diggs BS, Wang SJ, Dolan JP, Hunter
JG and Thomas CR: Nomogram for predicting the benefit of
neoadjuvant chemoradiotherapy for patients with esophageal cancer:
A SEER-Medicare analysis. Cancer. 120:492–498. 2014. View Article : Google Scholar : PubMed/NCBI
|
|
11
|
Vergouwe Y, Steyerberg EW, Eijkemans MJ
and Habbema JD: Substantial effective sample sizes were required
for external validation studies of predictive logistic regression
models. J Clin Epidemiol. 58:475–483. 2005. View Article : Google Scholar : PubMed/NCBI
|
|
12
|
DeLong ER, DeLong DM and Clarke-Pearson
DL: Comparing the areas under two or more correlated receiver
operating characteristic curves: A nonparametric approach.
Biometrics. 44:837–845. 1988. View
Article : Google Scholar : PubMed/NCBI
|
|
13
|
Porcel JM, Gasol A, Bielsa S, Civit C,
Light RW and Salud A: Clinical features and survival of lung cancer
patients with pleural effusions. Respirology. 20:654–659. 2015.
View Article : Google Scholar : PubMed/NCBI
|
|
14
|
Mbeutcha A, Mathieu R, Rouprêt M, Gust KM,
Briganti A, Karakiewicz PI and Shariat SF: Predictive models and
prognostic factors for upper tract urothelial carcinoma: A
comprehensive review of the literature. Transl Androl Urol.
5:720–734. 2016. View Article : Google Scholar : PubMed/NCBI
|
|
15
|
Yang L, Wang S, Zhou Y, Lai S, Xiao G,
Gazdar A and Xie Y: Evaluation of the 7th and 8th editions of the
AJCC/UICC TNM staging systems for lung cancer in a large North
American cohort. Oncotarget. 8:66784–66795. 2017.PubMed/NCBI
|
|
16
|
Tian T, Li J, Hu W, Sun C and Zhou J:
Thymidine kinase 1 concentration in pleural effusion is a
diagnostic marker and survival predictor for malignant pleural
effusion. J Clin Lab Anal. 33:e229012019. View Article : Google Scholar : PubMed/NCBI
|
|
17
|
Psallidas I, Kalomenidis I, Porcel JM,
Robinson BW and Stathopoulos GT: Malignant pleural effusion: From
bench to bedside. Eur Respir Rev. 25:189–198. 2016. View Article : Google Scholar : PubMed/NCBI
|
|
18
|
Liu YY: Influencing factors and combined
application of chemiluminescence immunoassay for detection of tumor
markers. Clin Lab J. 1:1432019.
|
|
19
|
Ren S, Kuang P, Zheng L, Su C, Li J, Li B,
Chen X, Wang Y, KimCurran V, Liu L, et al: Analysis of driver
mutations in female non-smoker Asian patients with pulmonary
adenocarcinoma. Cell Biochem Biophys. 64:155–160. 2012. View Article : Google Scholar : PubMed/NCBI
|
|
20
|
Thatcher N, Chang A, Parikh P, Rodrigues
Pereira J, Ciuleanu T, von Pawel J, Thongprasert S, Tan EH,
Pemberton K, Archer V and Carroll K: Gefitinib plus best supportive
care in previously treated patients with refractory advanced
non-small-cell lung cancer: Results from a randomised,
placebo-controlled, multicentre study (Iressa Survival Evaluation
in Lung Cancer). Lancet. 366:1527–1537. 2005. View Article : Google Scholar : PubMed/NCBI
|
|
21
|
Midha A, Dearden S and McCormack R: EGFR
mutation incidence in non-small-cell lung cancer of adenocarcinoma
histology: A systematic review and global map by ethnicity
(mutMapII). Am J Cancer Res. 5:2892–2911. 2015.PubMed/NCBI
|
|
22
|
Zhou Q, Zhang XC, Chen ZH, Yin XL, Yang
JJ, Xu CR, Yan HH, Chen HJ, Su J, Zhong WZ, et al: Relative
abundance of EGFR mutations predicts benefit from gefitinib
treatment for advanced non-small-cell lung cancer. J Clin Oncol.
29:3316–3321. 2011. View Article : Google Scholar : PubMed/NCBI
|
|
23
|
Iasonos A, Schrag D, Raj GV and Panageas
KS: How to build and interpret a nomogram for cancer prognosis. J
Clin Oncol. 26:1364–1370. 2008. View Article : Google Scholar : PubMed/NCBI
|
|
24
|
Van Belle V and Van Calster B: Visualizing
risk prediction models. PLoS One. 10:e01326142015. View Article : Google Scholar : PubMed/NCBI
|
|
25
|
Du F: Differentiation antigen expression
and lung cancer heterogeneity. J Clin Exp Pathol. 2:200–203.
2002.
|
|
26
|
Chen VW, Ruiz BA, Hsieh MC, Wu XC, Ries LA
and Lewis DR: Analysis of stage and clinical/prognostic factors for
lung cancer from SEER registries: AJCC staging and collaborative
stage data collection system. Cancer. 120 (Suppl 23):3781–3792.
2014. View Article : Google Scholar : PubMed/NCBI
|
|
27
|
Dixit R, Agarwal KC, Gokhroo A, Patil CB,
Meena M, Shah NS and Arora P: Diagnosis and management options in
malignant pleural effusions. Lung India. 34:160–166. 2017.
View Article : Google Scholar : PubMed/NCBI
|
|
28
|
Zamboni MM, da Silva CT Jr, Baretta R,
Cunha ET and Cardoso GP: Important prognostic factors for survival
in patients with malignant pleural effusion. BMC Pulm Med.
15:292015. View Article : Google Scholar : PubMed/NCBI
|
|
29
|
Garon EB, Rizvi NA, Hui R, Leighl N,
Balmanoukian AS, Eder JP, Patnaik A, Aggarwal C, Gubens M, Horn L,
et al: Pembrolizumab for the treatment of non-small-cell lung
cancer. N Engl J Med. 372:2018–2028. 2015. View Article : Google Scholar : PubMed/NCBI
|
|
30
|
Ballman KV: Biomarker: Predictive or
prognostic? J Clin Oncol. 33:3968–3971. 2015. View Article : Google Scholar : PubMed/NCBI
|
|
31
|
Vickers AJ and Cronin AM: Everything you
always wanted to know about evaluating prediction models (but were
too afraid to ask). Urology. 76:1298–1301. 2010. View Article : Google Scholar : PubMed/NCBI
|