Introduction
Lung cancer is the leading cause of
cancer-associated mortality worldwide in 2011 (1), and ~80% of all cases of lung cancer are
non-small cell lung cancer (NSCLC) (2). However, there are currently a limited
number of effective approaches for preventing the development of
NSCLC, and improving the survival rates of those patients with the
disease (3). The standard treatment
for the majority of patients with advanced NSCLC is platinum-based
chemotherapy followed by second-line cytotoxic chemotherapy
(4). Nevertheless, the overall
survival time of patients receiving this treatment for advanced
NSCLC remains poor, with a median time of ~12 months (3).
Novel immunotherapeutic approaches have been
developed to treat NSCLC, including chimeric antigen receptor T
cells (CAR-T) and monoclonal antibodies that block immune
checkpoint molecules, such as programmed cell death 1 (PD-1) and
cytotoxic T lymphocyte antigen 4 (CTLA4) (5–9).
However, the efficiency of CAR-T treatment for solid tumors
(including NSCLC) requires improvement, and the potential drawback
of anti-CTLA4 and anti-PD1 therapy is their immune-potentiating
side effects (10–12). Therefore, the identification of novel
prognostic markers or molecular targets for the effective treatment
of NSCLS is paramount.
RNA polymerase I (pol I), a multi-subunit enzyme
consisting of >6 polypeptides, is essential for the
transcription of ribosomal RNA (rRNA) and the production of the
primary components of ribosomes (13,14). In
yeast, the majority of the pol I complex comprises the two largest
subunits, Rpa1 and Rpa2; RNA polymerase I subunit RPA2 (POLR1B) is
the human Rpa2 homologue (15,16).
Previous studies have revealed that an increase in rRNA synthesis
is associated with poor prognosis in patients with multiple types
of cancer, such as lymphoma and rhabdomyosarcoma (17–19).
These reports indicated the potential regulatory roles of POLR1B in
human cancer. However, the roles of POLR1B in lung cancer have not
yet been identified; thus, there is accumulating interest in
investigating the function of POLR1B in cancer cell proliferation.
In the present study, the functions of POLR1B in lung cancer were
investigated, and the molecular mechanisms that regulate lung
cancer cell proliferation were further elucidated.
Materials and methods
Public datasets analysis
Gene Expression Profiling Interactive Analysis
(GEPIA) is a web server for gene expression profiling and
interactive analyses in human cancer (20). It provides several key interactive
customization features, such as differential expression analysis,
patient survival analysis and similarity gene detection. The
present study analyzed the expression profile of POLR1B in
different types of human cancer using GEPIA datasets. And the
association between POLR1B and several key NSCLC regulators,
including tumor protein (TP)53, epidermal growth factor receptor
(EGFR), and the GTPases KRas (KRAS) and NRas (NRAS), was also
assessed using GEPIA datasets.
Co-expression analysis of POLR1B in NSCLC was then
performed using the cBioPortal database (21). Furthermore, GSE18842 (22) was employed to evaluate the expression
levels of POLR1B in NSCLC and normal samples. A total of 46
non-small cell lung cancer samples and 45 normal lung tissues were
included in this dataset.
Cell lines and cell culture
The human 293T cell line and lung cancer cell lines
A549, NCI-H1299, NCI-H1975 and NCI-H460 were purchased from the
Cell Bank of the Type Culture Collection. The A549 cells were
maintained in F-12K medium (Invitrogen; Thermo Fisher Scientific,
Inc.) and the NCI-H1299, NCI-H1975 and NCI-H460 cells were cultured
in RPMI-1640 medium (Gibco; Thermo Fisher Scientific, Inc.). The
human 293T cells were maintained in DMEM high glucose medium
(Gibco; Thermo Fisher Scientific, Inc.). All media were
supplemented with 10% fetal bovine serum (FBS), 100 U/ml
streptomycin and penicillin (all from Gibco; Thermo Fisher
Scientific, Inc.). The present study detected the expression levels
of POLR1B in four NSCLC cell lines. The results revealed that
POLR1B was highly expressed in all NSCLC cell lines. Despite the
expression of POLR1B in NCI-H1975 cells being higher than other
cell lines, however, the differences were not significant. A549
cell line was one of the most widely used NSCLC cell line in lung
cancer biology research and selected for further study.
Construction of lentiviruses for
POLR1B knockdown
The target DNA sequence of POLR1B
(5′-GACCATTGGGATGTTAATT-3′) was designed by Shanghai GeneChem Co.
Ltd. According to the target sequence of POLR1B, two single chain
DNA sequences (shRNA S1 and shRNA S2) were designed: shRNAS1,
5′-CCGGATGACCATTGGGATGTTAATTCTCGAGAATTAACATCCCAATGGTCTTTTTTG-3′;
and shRNA S2,
5′-AATTCAAAAAATGACCATTGGGATGTTAATTCTCGAGAATTAACATCCCAATGGTCAT-3′.
The shRNAs were annealed and ligated into the linearized GV115
lentiviral vector, and the resulting plasmid was used to transform
DH5α competent cells (Shanghai Genechem Co., Ltd., Shanghai,
China). The plasmid was extracted from the DH5α cells and verified
by restriction endonuclease digestion followed by Sanger
sequencing. Lentiviral vector DNA and packaging vectors (1 µg/ml;
pHelper 1.0 and pHelper 2.0; Shanghai Genechem Co., Ltd.) were then
transfected into 293T cells (Sangon Biotech, Co., Ltd.) using
Lipofectamine® 2000 (Invitrogen; Thermo Fisher
Scientific, Inc.). The empty vector of GV115 lentiviral vector
(Shanghai Genechem Co., Ltd.) was used as the shRNA control. After
48 h of culture, supernatants containing lentiviruses, including
shPOLR1B and shRNA control were harvested, respectively.
Purification was then performed using ultracentrifugation at 1,000
× g and 4°C for 2 min (Himac CT15RE; Hitachi) and the titer of
lentivirus was determined. A549 lung adenocarcinoma cells were
infected with the shPOLR1B lentivirus, and cells in the control
group were infected with a lentivirus carrying an empty vector.
Cells were cultured in RPMI-1640 medium with lentiviruses at a
multiplicity of infection of 10 for 24 h at 37°C. Fresh culture
medium was then used to replace the old media. Fluorescence was
measured 72 h post-infection when the achieved infection efficiency
was 80%, and the expression levels of POLR1B were analyzed using
reverse transcription-quantitative (RT-q)PCR and western blotting.
The fluorescence and infection efficiency were determined using an
inverted fluorescence microscope (magnification, ×200; IX-71;
Olympus).
Cell viability assay
The cell viability was determined using an MTT assay
(Sigma-Aldrich; Merck KGaA). Briefly, A549 cells infected with
shPOLR1B-lentivirus or the corresponding negative control were
seeded into 96-well plates (2×10³ cells/well), and
incubated at 37°C for 5 days. Following incubation, 20 µl MTT
solution (1 mg/ml) was added to each well and incubated for a
further 4 h at 37°C at each time points, including days 1, 2, 3, 4
and 5. The MTT solution was then aspirated and 100 µl DMSO
(Sigma-Aldrich; Merck KGaA) was added to dissolve the formazan
crystals. The number of viable cells was counted using an automated
microplate reader (Molecular Devices, LLC) at a wavelength of 570
nm.
Cell proliferation analysis with the
Celigo® adherent cell cytometry system
Briefly, A549 cells infected with
shPOLR1B-lentivirus or the shRNA-lentivirus control were
trypsinized in the logarithmic growth phase using trypsin (Gibco;
Thermo Fisher Scientific, Inc.), resuspended in standard medium and
seeded into 96-well plates (2×10³ cells/well). After
plating, Celigo® Image Cytometer (Nexcelom) was used to
evaluate the number of cells by scanning green fluorescence daily
for 5 days at room temperature as previously described (23).
Colony forming assays
A549 cells were cultured in F-12K complete media
(10% FBS, 1% penicillin/streptomycin) and 1×10³
cells/well were seeded into 6-well plates; the medium was replaced
every 3 days. After culturing for 10 days to form colonies, each
well was washed with 1 ml PBS and the cells were fixed with 1 ml 4%
paraformaldehyde (Beyotime Institute of Biotechnology) for 15 min
at room temperature. The cells were then washed with PBS and 500 µl
Giemsa stain (Sigma-Aldrich; Merck KGaA) was added to each well and
incubated for 15–20 min at room temperature. Excess staining
solution was washed off with PBS and the colonies were observed
with an inverted light microscope (×200 magnification; IX71;
Olympus, Tokyo, Japan) and counted using ImageJ software (version
4.0; National Institutes of Health).
Apoptosis analysis
Apoptosis analysis was performed using an
Annexin-V/FITC apoptosis detection kit (Invitrogen; Thermo Fisher
Scientific, Inc.) according to the manufacturer's protocol.
Briefly, cells were seeded into T25 flasks and cultured at 37°C for
48 h. When the cell density had reached ~80%, the cells were
collected and resuspended in ice-cold PBS, prior to fixing with
pre-cooled 75% ethanol for 30 min at 4°C. After 30 min, the cells
were centrifuged at 100 × g and washed twice with PBS. The pellets
were then resuspended in annexin-V/FITC and propidium iodide
(Invitrogen; Thermo Fisher Scientific, Inc.), and incubated at room
temperature for 15 min in the dark. The cells were washed twice
with PBS and analyzed using a FACS Calibur flow cytometer (BD
Biosciences). Cell apoptosis data was analyzed using FCS Express
software (version 3.0; DeNovo).
RNA extraction and RT-qPCR
analysis
The A549, NCI-H1299, NCI-H1975 and NCI-H460 cells
were lysed using TRIzol® reagent (Gibco; Thermo Fisher
Scientific, Inc.) and the total RNA was isolated. cDNA was
generated using a cDNA synthesis kit (Takara Biotechnology Co.,
Ltd.,) with 2 µg RNA, according to the manufacturer's instructions.
The mRNA expression levels were determined using
SYBR®Green assays and the Applied BioSystems 7300
detection system; the SYBR®Green qPCR SuperMix-UDG was
purchased from Invitrogen; Thermo Fisher Scientific, Inc. The
relative gene expression levels were calculated using the
2−ΔΔCq method (24), and
the following primers were used for qPCR: POLR1B: Forward,
5′-TCCGAATGTTGATTATGCCTCG-3′, and reverse,
5′-TGACAGCGGAATGTTCTTCCC-3′; GAPDH: Forward,
5′-TGACTTCAACAGCGACACCCA-3′, and reverse,
5′-CACCCTGTTGCTGTAGCCAAA-3′. The qPCR reaction conditions were as
follows: Initial denaturation 10 min at 95°C; denaturation 10 sec
at 95°C; annealing 20 sec at 60°C; and extension 15 sec at 72°C;
for 40 cycles.
Western blot analysis
The proteins were extracted from A549 cells using
ice-cold radioimmunoprecipitation assay lysis buffer (Beyotime
Institute of Biotechnology). The concentration of protein was
determined using a BCA kit (Thermo Fisher Scientific, Inc.). A
total of 40 µg solution was loaded per lane onto SDS-PAGE for
electrophoresis separation (10% separation gel and 5% spacer gel),
and then transferred to polyvinylidene fluoride (PVDF) membranes.
Subsequently, the membranes were blocked in 5% bovine serum albumin
(Gibco; Thermo Fisher Scientific, Inc.) at room temperature for 1 h
then probed with the primary antibodies overnight at 4°C, including
anti-POLR1B (cat. no. ab101977, 1:1,000) and anti-GAPDH (cat. no.
ab181602, 1:1,000) (both from Abcam). The next day, the membranes
were washed three times using 0.1% tris-buffered saline and Tween
20 (TBST; Sigma-Aldrich; Merck KGaA), 5 min each time, then
horseradish peroxidase (HRP)-conjugated anti-rabbit (cat. no.
IH-0011, 1:5,000; Dingguo Changsheng Biotechnology, Beijing, China)
and horseradish peroxidase (HRP)-conjugated anti-mouse antibodies
(cat. no. IH-0031, 1:5,000; Dingguo Changsheng Biotechnology) were
added and incubated for 1 h at room temperature, then washed with
0.1% TBST three times. The protein bands were visualized using an
enhanced chemiluminescence assay kit (Beyotime Institute of
Biotechnology) and the Luminescent image analyzer (GE Healthcare).
The intensity of the bands was quantified using Image Lab™ Software
(version 4.1; Bio-Rad Laboratories, Inc.).
Microarray and expression
datasets
Total RNA was extracted using TRIzol®
reagent and was quantified by the NanoDrop ND-2000 (Thermo Fisher
Scientific, Inc.). Global expression of mRNAs in 3 control A549
samples and 3 POLR1B knockdown A549 samples were examined using the
GeneChip PrimeView Human Gene Expression Array (Thermo Fisher
Scientific, Inc.). The raw data of the mRNA expression profiles
were analyzed using the limma model (11) on R/Bioconductor software version
2.15.1 (www.bioconductor.org). Background
correction, quartile data normalization and probe summarization
were applied for the original data. The limma method in
Bioconductor (http://www.bioconductor.org) was used to identify the
genes that were differentially expressed between the two groups.
Genes with an adjusted P<0.05 after FDR correction and a fold
change of >2 or <0.5 were considered as differentially
expressed genes.
Construction of protein-protein
interaction (PPI) network
The present study used the Search Tool for the
Retrieval of Interacting Genes/Proteins (STRING; version 11.0;
http://string-db.org) (25) to construct the PPI network. Cytoscape
software (version 3.70; www.cytoscape.org) is a common open-source software
tool that is useful in the visual evaluation of biomolecule
interaction networks comprising of protein, gene and other forms of
interactions (26).
Statistical analysis
All experiments were performed in triplicate.
Statistical analysis was performed by SPSS software (verison 18.0;
SPSS, Inc.). The results are presented as the mean ± standard error
of the mean. Statistical significance between the shRNA-transfected
cell groups was determined using Student's t-test. The median
expression (7.13) of POLR1B in all human cancer samples were
considered as the cut-off to classify groups into POLR1B-high and
POLR1B-low expression. A Kaplan-Meier survival curve was created
and compared with the log-rank test results. For >2 groups,
one-way analysis of variance followed by Newman-Keuls post hoc test
was used. P<0.05 was considered to indicate a statistically
significant difference.
Results
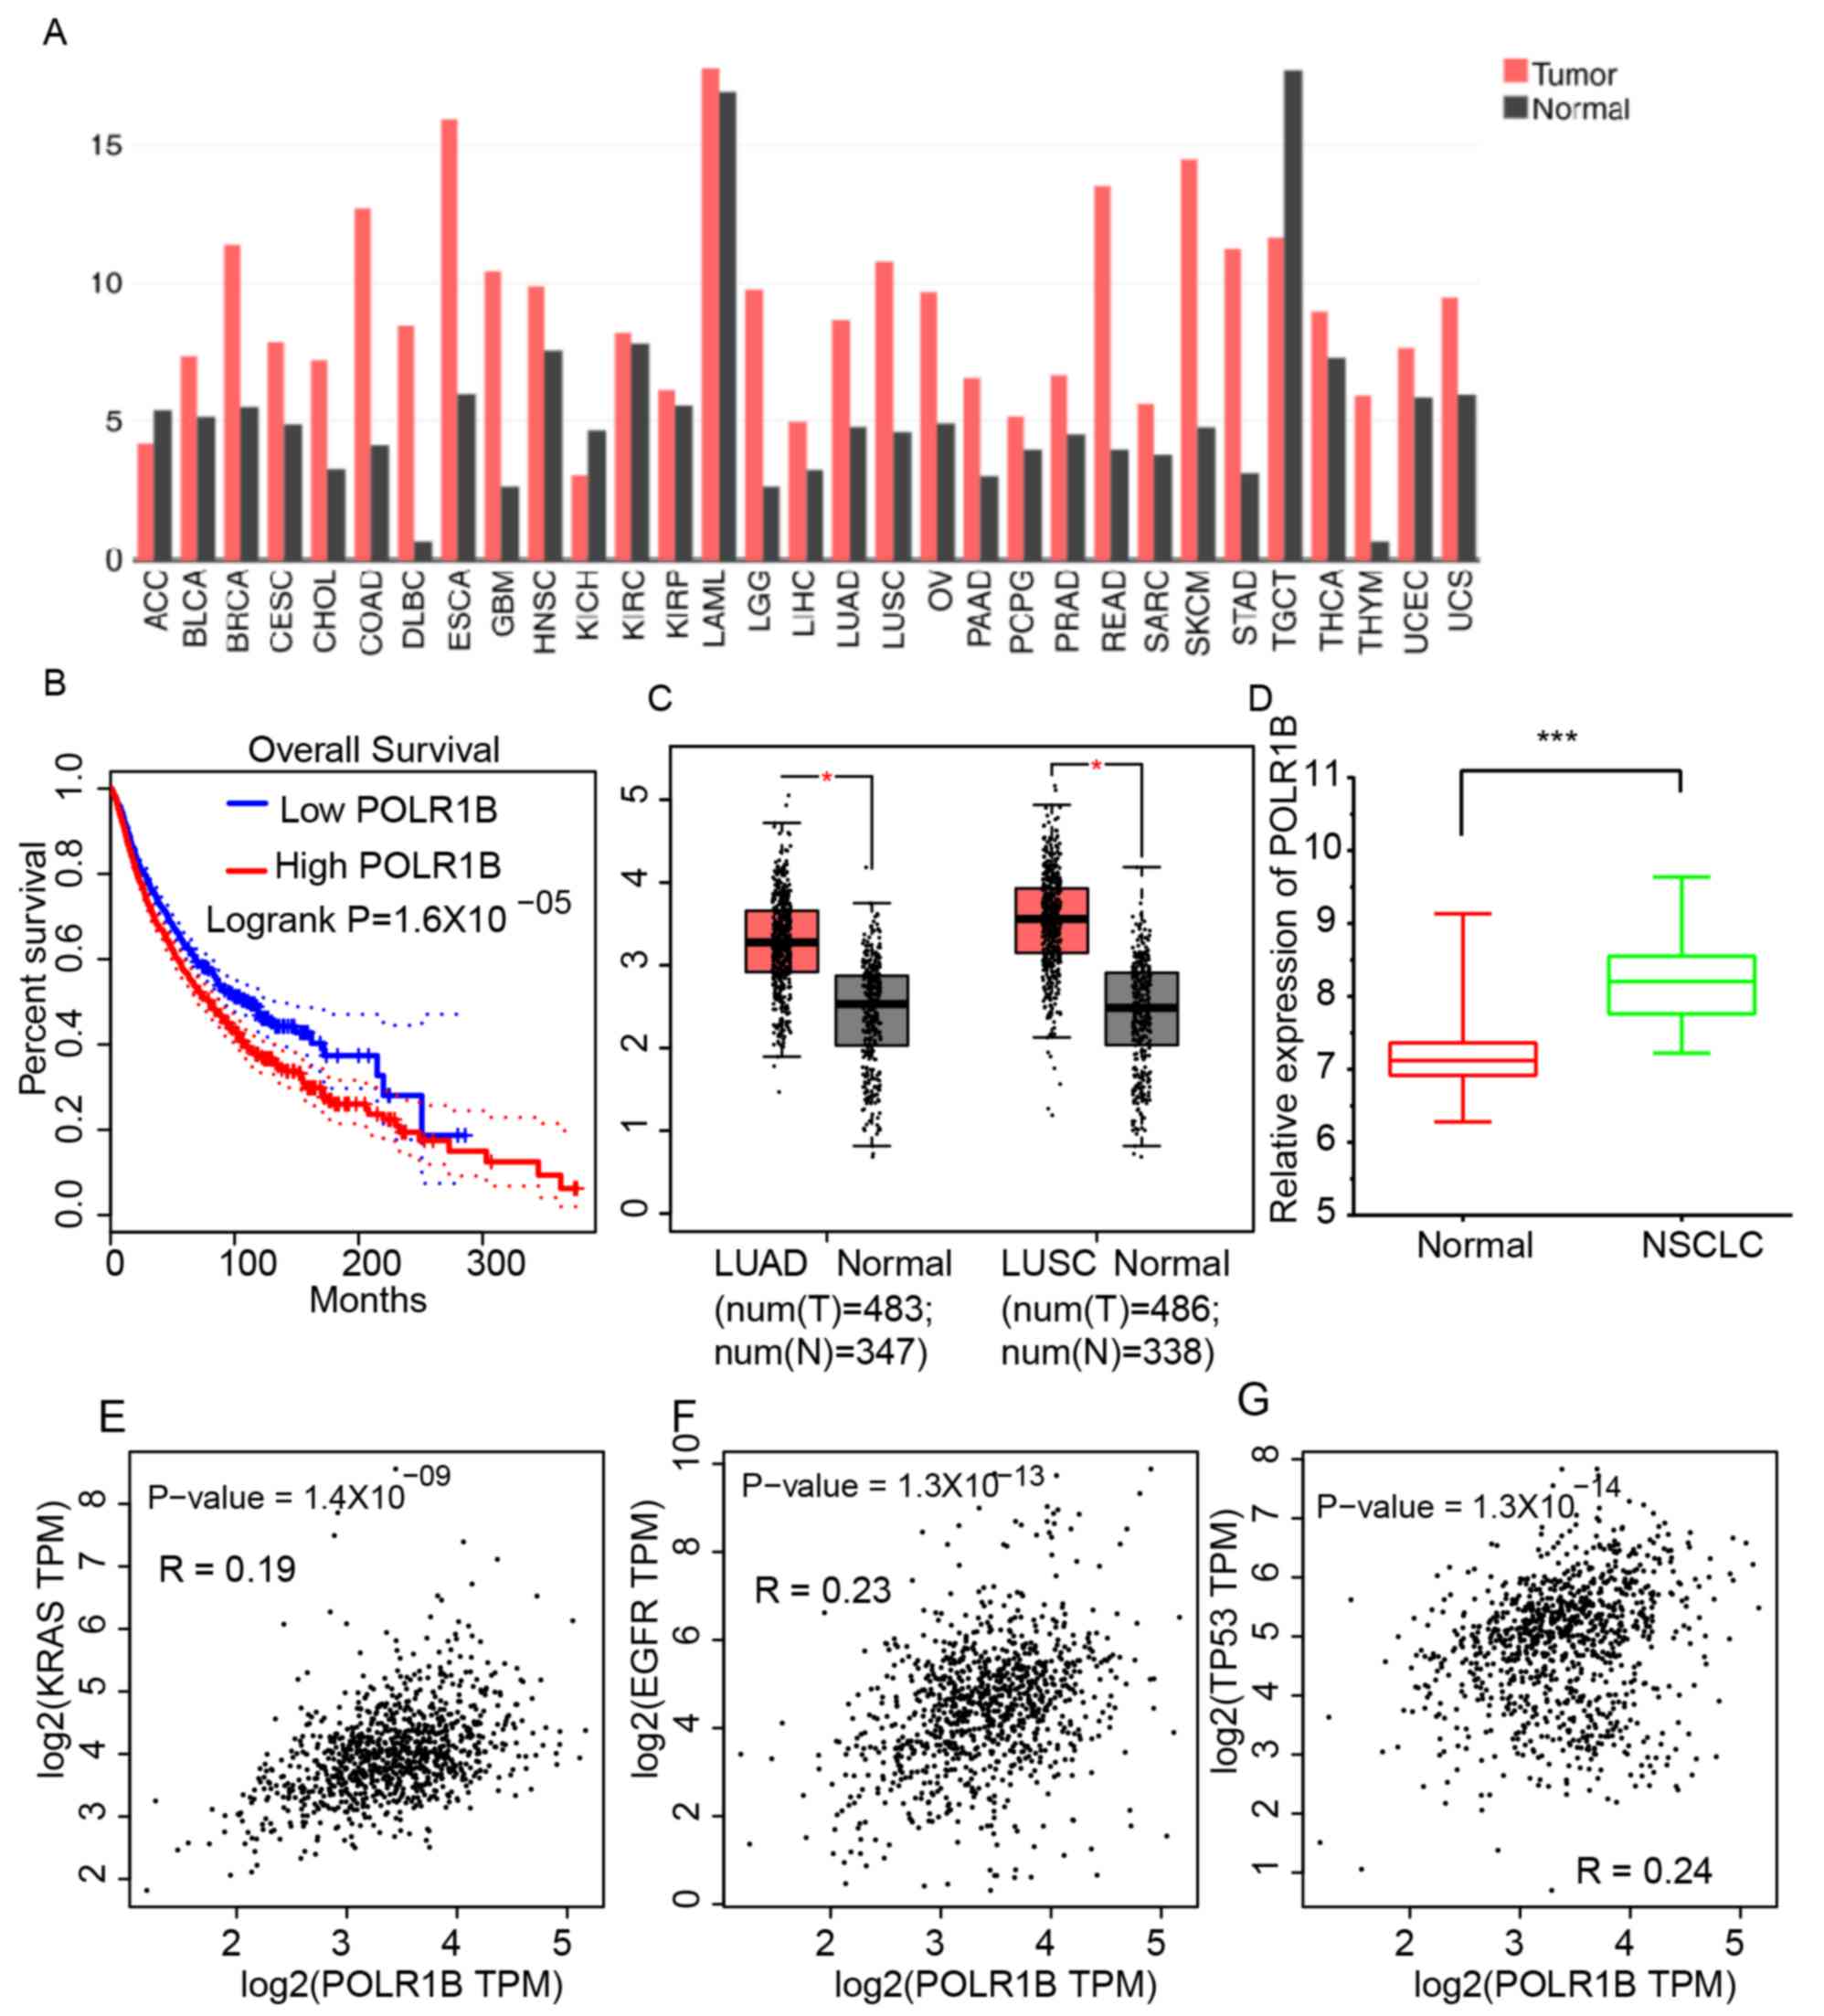
POLR1B is upregulated in human cancer,
particularly NSCLC
In order to investigate the expression profile of
POLR1B in different types of human cancer, gene expression
profiling interactive analysis (GEPIA) datasets were analyzed. As
presented in Fig. 1A, the expression
levels of POLR1B were demonstrated to be upregulated in breast
invasive carcinoma, colon adenocarcinoma, diffuse large B-cell
lymphoma, low-grade glioma, lung adenocarcinoma (LUAD), lung
squamous cell carcinoma (LUSC), ovarian cancer, pancreas
adenocarcinoma, rectum adenocarcinoma, skin cutaneous melanoma,
stomach adenocarcinoma and thymoma, compared with normal sample
tissues. The median expression of POLR1B in all human cancer
samples were considered as the cut-off to classify groups into
POLR1B-high and POLR1B-low expression. Kaplan-Meier survival
analysis revealed that a higher POLR1B expression level was
associated with significantly shorter overall survival times in
4,750 patients with various types of cancer (Fig. 1B). These results suggested that
POLR1B may act as an oncogene in human cancer.
The present study focused on the functions and
expression levels of POLR1B in NSCLC. GEPIA dataset analysis
revealed that the POLR1B expression levels in LUAD (median
expression level, 8.69) and LUSC (median expression level, 10.79)
were higher than those in normal tissue samples (LUAD median
expression level, 4.78; LUSC median expression level, 4.6)
(Fig. 1C). Furthermore, the present
study analyzed a public dataset, GSE18842, to further validate the
GEPIA analysis. The results revealed that POLR1B was also
upregulated in NSCLC samples compared with normal lung tissues
(Fig. 1D). Furthermore, the
association between POLR1B and several key NSCLC regulators,
including the GTPases KRas (KRAS), epidermal growth factor receptor
(EGFR), and tumor protein (TP)53, was also assessed (Fig. 1E-G). The results suggested that the
expression of POLR1B was positively associated with that of TP53,
EGFR, KRAS and NRAS in NSCLC samples.
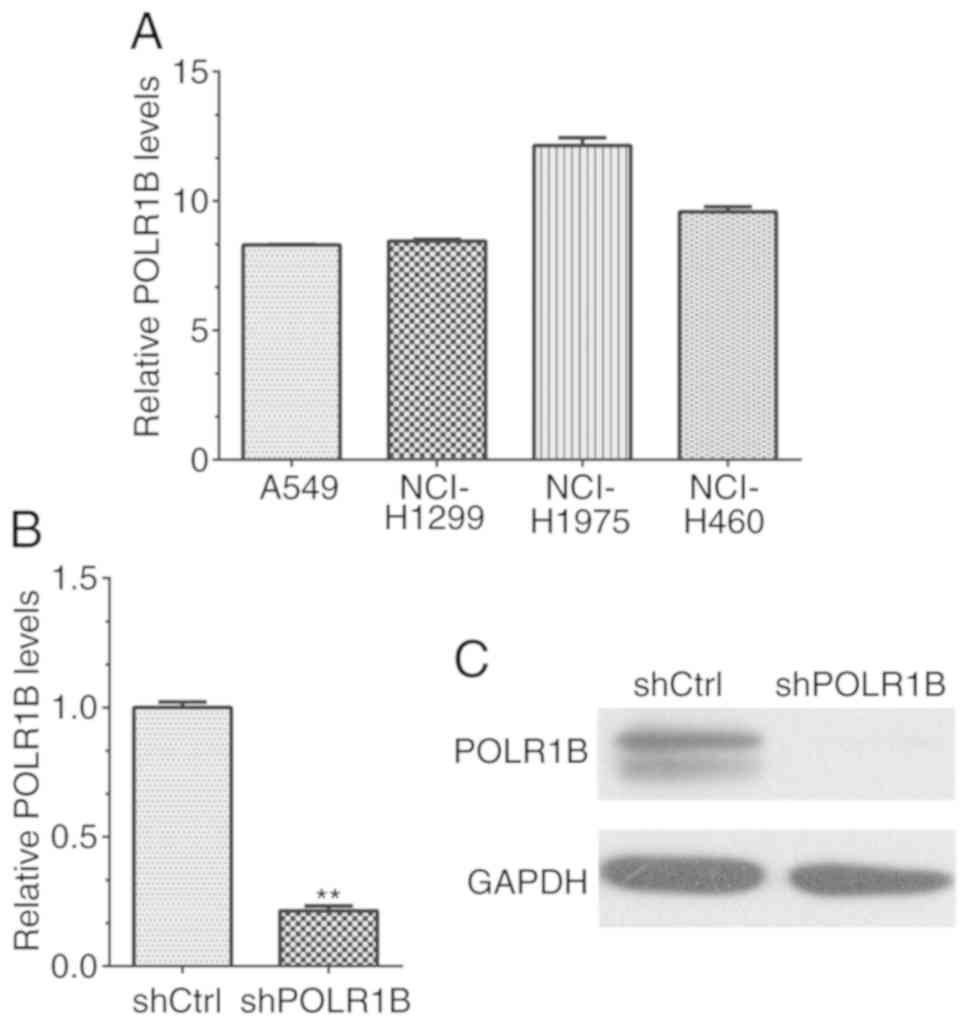
mRNA expression levels of POLR1B in
lung cancer cell lines
RT-qPCR was performed in order to evaluate the
expression levels of POLR1B in lung cancer cell lines, including
A549, NCI-H1299, NCI-H1975 and NCI-H460 cells. The results revealed
that the POLR1B mRNA expression levels in all four lung cancer cell
lines were higher than those of the GAPDH control (Fig. 2A). Therefore, the data revealed that
POLR1B was highly expressed in NSCLC cells, indicating that it may
serve an important role in the regulation of lung cancer cells.
POLR1B is effectively silenced by
lentivirus-mediated RNAi in A549 cells
Due to the high expression levels of POLR1B in lung
cancer cell lines, lentivirus-mediated RNAi was used to suppress
POLR1B expression in A549 cells to further investigate the
functions of POLR1B. The mRNA expression levels were detected via
RT-qPCR. The results revealed that the POLR1B mRNA expression
levels were markedly decreased in POLR1B shRNA-silenced A549 cells,
compared with the control group (Fig.
2B). In addition, western blotting was used to determine the
POLR1B protein expression levels in A549 cells, and also revealed a
significant decrease in these levels in POLR1B
shRNA-lentivirus-infected cells (compared with cells infected with
the negative control), reconfirming the results of mRNA detection
(Fig. 2C). Collectively, these data
revealed that the expression of POLR1B was effectively silenced in
POLR1B shRNA-lentivirus infected A549 cells.
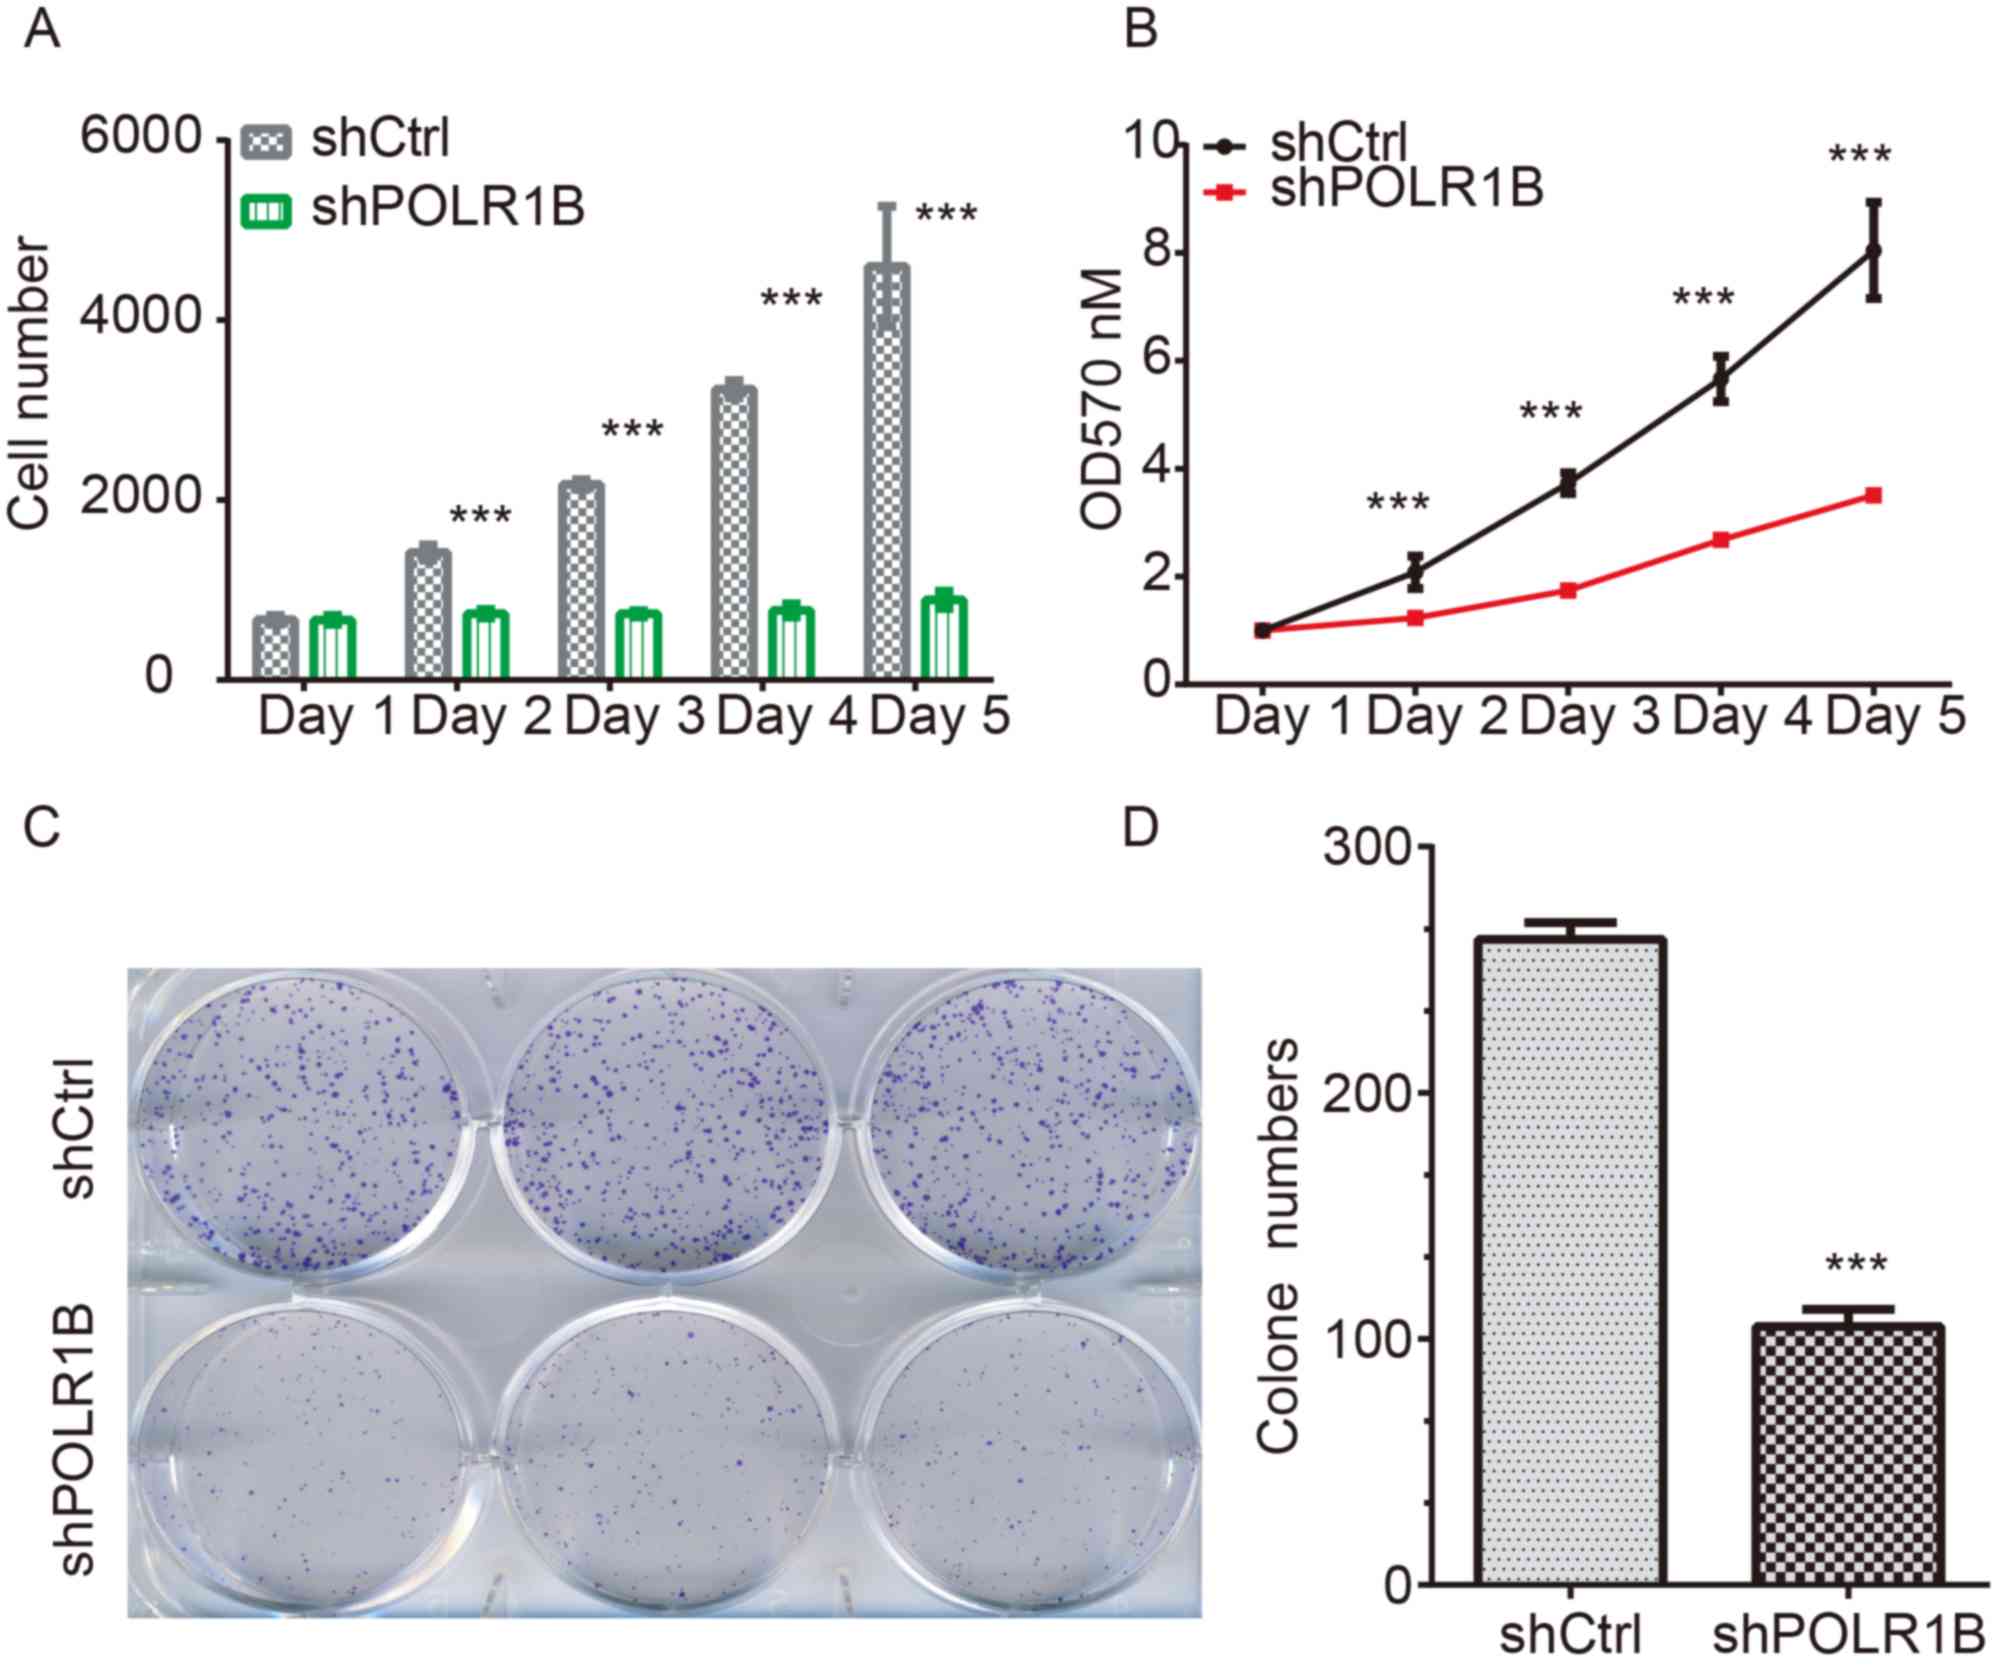
POLR1B knockdown inhibits the
proliferation of lung cancer cells
In order to investigate whether POLR1B affected the
proliferation of lung cancer cells, the Celigo® cell
counting system was used to directly visualize and enumerate the
proliferative rate of A549 cells. At the 5-day post-infection
point, the green florescence signals of the shPOLR1B-lentivirus
infected A549 cells were notably weaker than those of the control
cells (P<0.05). In addition, the calculated cell counting
results also suggested that POLR1B-silencing using an
shPOLR1B-lentivirus decreased the proliferation rate of A549 cells
(Fig. 3A).
Furthermore, an MTT assay was also used to
investigate the proliferation rates of A549 cells following
POLR1B-knockdown. According to the results, the proliferation rates
of POLR1B-silenced A549 cells at 1, 2, 3, 4 and 5 days
post-infection were markedly inhibited compared with those of the
control cells (Fig. 3B).
In addition, a colony formation assay was used to
assess the effects of POLR1B-silencing on the colony-forming
ability of A549 cells. Compared with the control cells, the number
of colonies in the POLR1B-silenced groups (as determine by Giemsa
staining) was decreased (Fig. 3C).
Quantitative analysis also revealed that the colonies of the
POLR1B-silenced group possessed significantly fewer cells than
those of the control-infected group (Fig. 3D).
In conclusion, these results demonstrated that
POLR1B-knockdown inhibited the proliferation of A549 cells,
indicating that POLR1B serves an important role in the regulation
of lung cancer cell proliferation.
POLR1B suppression induces apoptosis
in A549 cells
Based on the aforementioned findings, demonstrating
that POLR1B serves an important role in the modulation of lung
cancer cell proliferation, flow cytometry was performed to analyze
apoptosis in A549 cells following POLR1B knockdown. The results
revealed that the proportion of apoptotic cells was increased in
the POLR1B-knockdown A549 cells (Fig.
4A). Quantitative analysis also demonstrated that the
percentage of apoptotic cells infected with shPOLR1B lentivirus was
over two times that of the control cells (Fig. 4B), indicating that POLR1B depletion
induces lung cancer cell apoptosis.
Identification of POLR1B targets using
microarray co-expression analysis
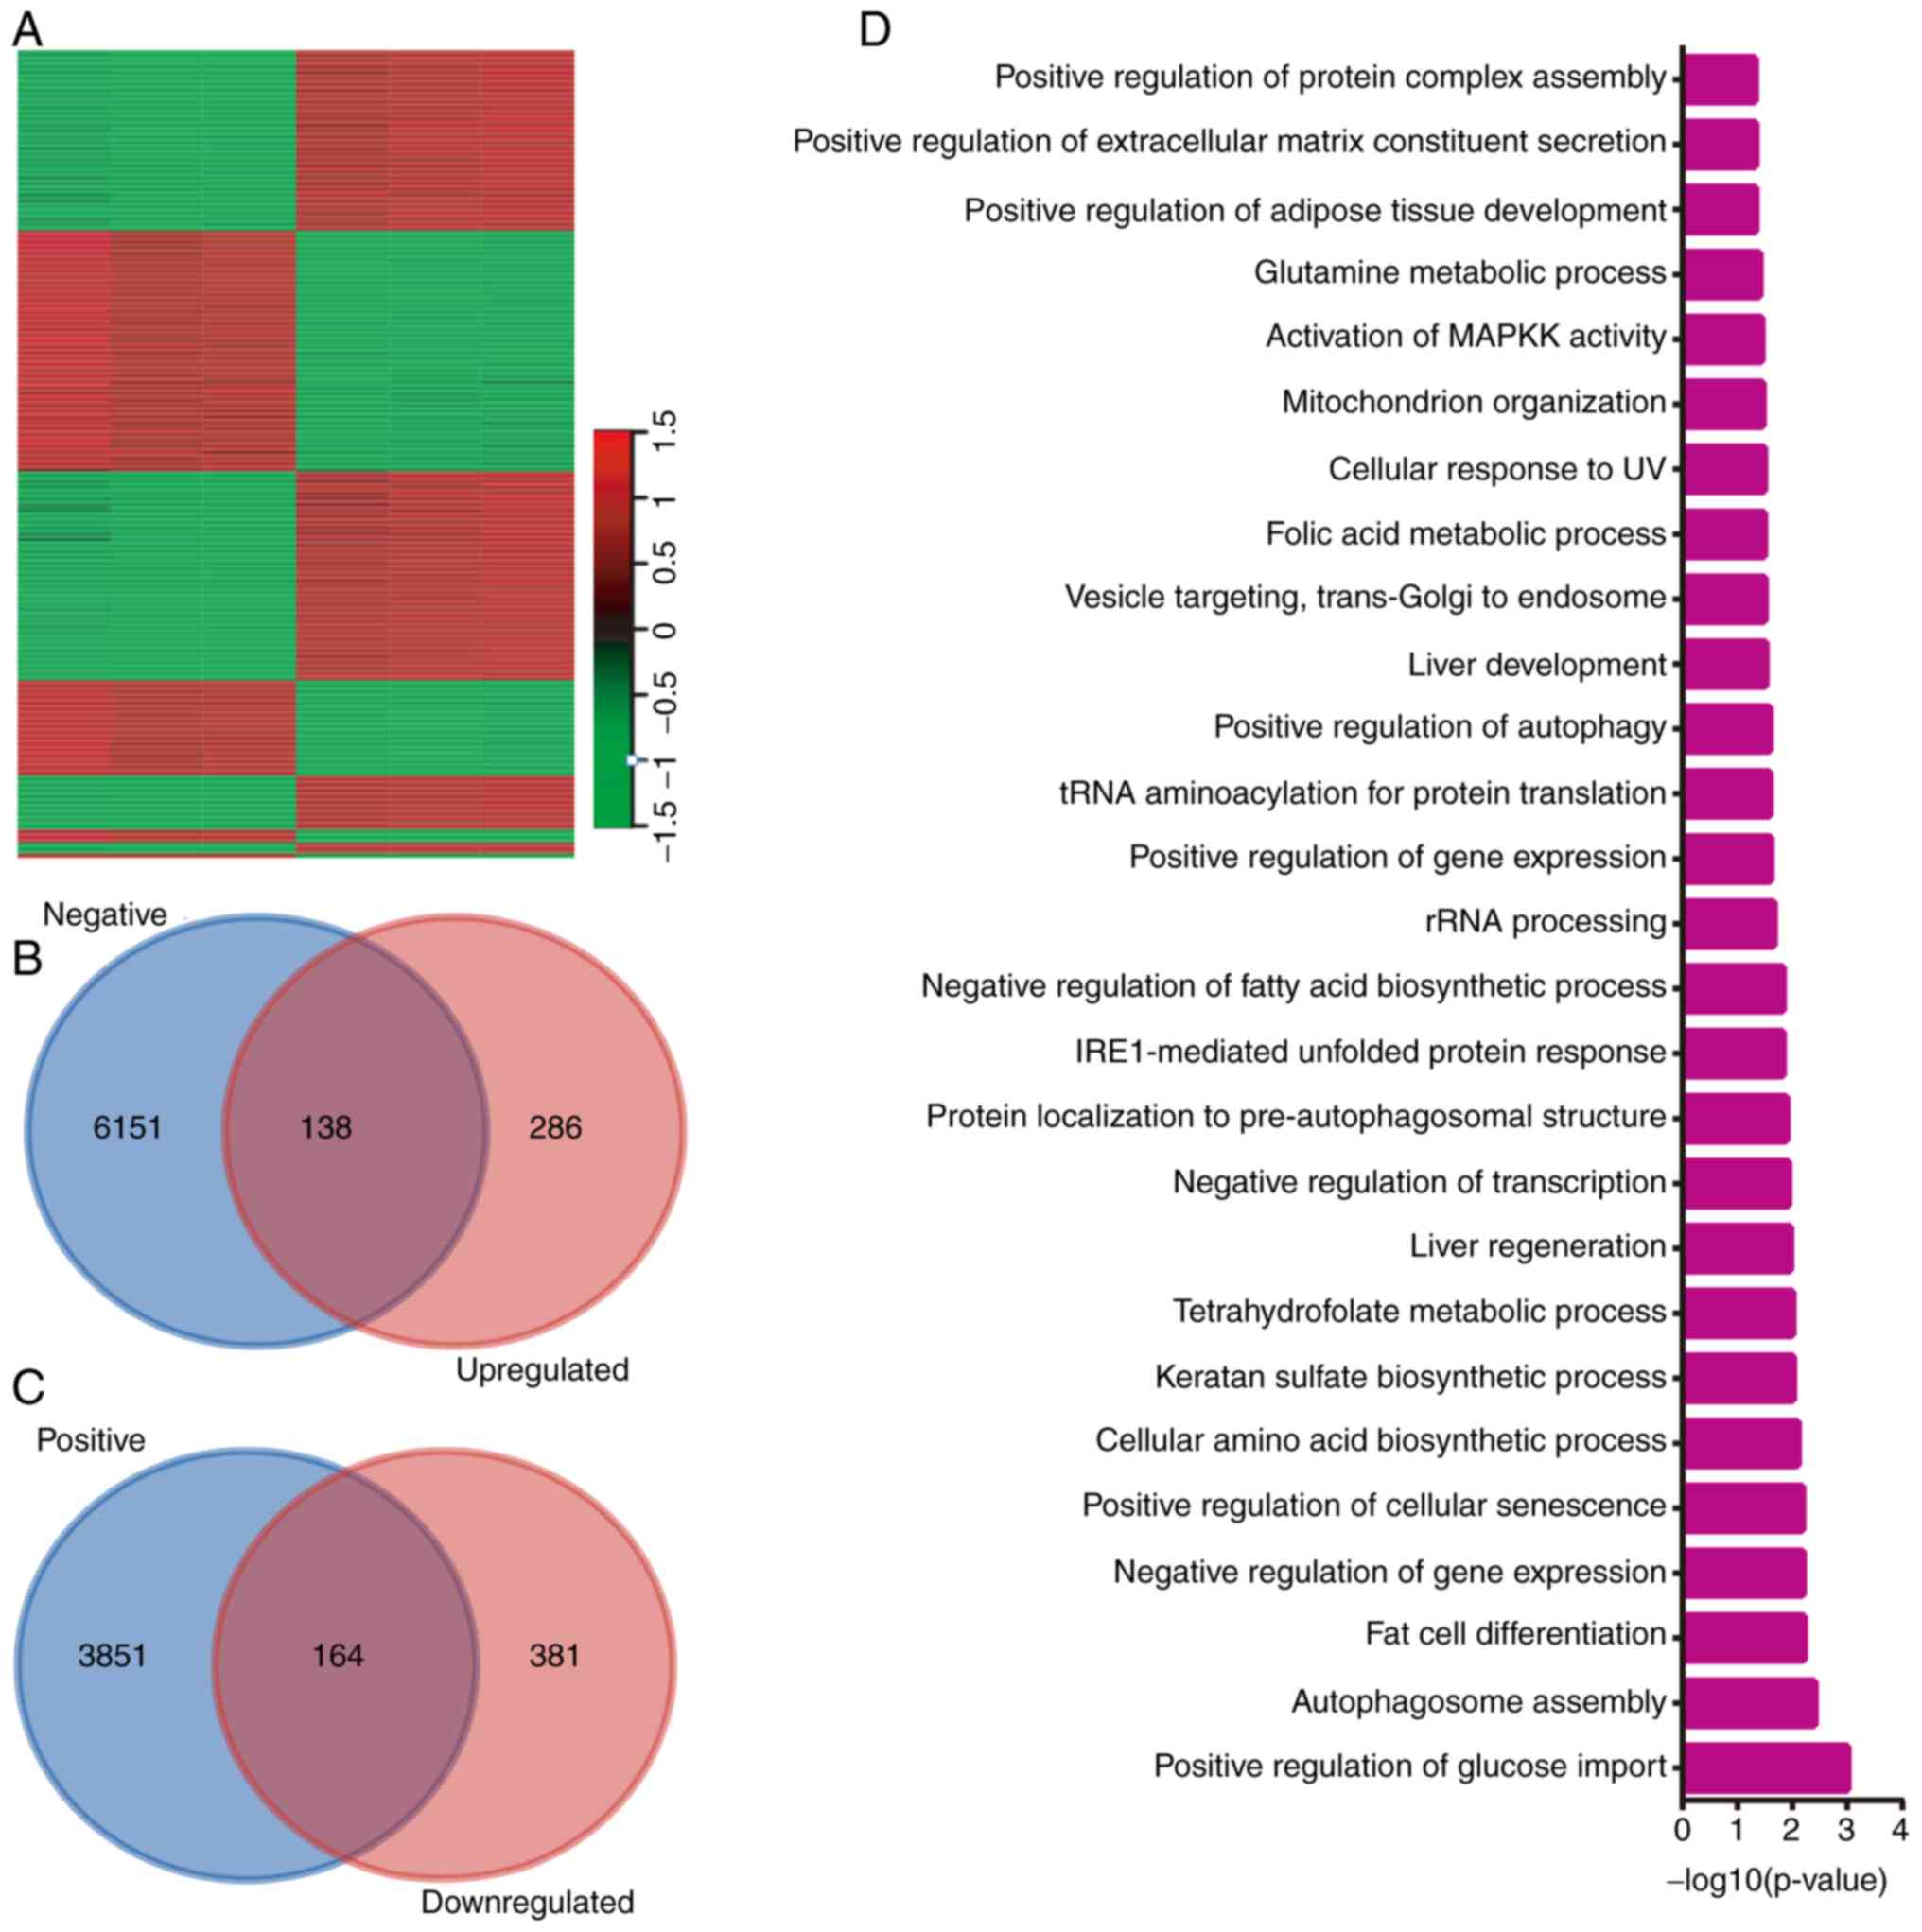
In the present study, a microarray analysis was
performed to identify the downstream targets of POLR1B. A total of
970 genes were identified as potential targets of POLR1B, including
424 genes that were upregulated, and 546 that were downregulated
following POLR1B knockdown in A549 cells (Fig. 5A). Co-expression analysis of POLR1B
in NSCLC was then performed using the cBioPortal database, and
POLR1B-target pairs with P<0.05 were considered to be reliable.
Combining the results of the microarray and co-expression analyses,
138 upregulated (Fig. 5B) and 164
downregulated (Fig. 5C) genes we
identified as potential downstream targets of POLR1B. The top 10
upregulated and downregulated genes after POLR1B knockdown in A549
cells are listed Table I.
 | Table I.Top 10 up- and downregulated genes
following POLR1B knockdown in A549 cells. |
Table I.
Top 10 up- and downregulated genes
following POLR1B knockdown in A549 cells.
| Gene | NC | NC | NC | KD | KD | KD | FC | Regulation | P-value | FDR |
|---|
| EREG | 10.08 | 10.04 | 10.11 | 6.65 | 6.72 | 6.77 | −10.30 | Down | <0.001 | 0.00 |
| STC2 | 8.76 | 8.74 | 8.77 | 5.58 | 5.71 | 5.56 | −8.83 | Down | <0.001 | 0.00 |
| RAB39B | 6.59 | 6.50 | 6.27 | 3.47 | 3.33 | 3.70 | −7.74 | Down | <0.001 | 0.00 |
| PCK2 | 8.35 | 8.50 | 8.31 | 5.87 | 5.25 | 5.66 | −6.93 | Down | <0.001 | 0.00 |
| IL11 | 7.22 | 7.29 | 6.92 | 4.23 | 4.48 | 4.48 | −6.70 | Down | <0.001 | 0.00 |
| ULBP1 | 6.29 | 6.34 | 6.25 | 3.21 | 4.11 | 3.40 | −6.57 | Down | <0.001 | 0.00 |
| TRIB3 | 10.47 | 10.47 | 10.45 | 7.73 | 7.75 | 7.82 | −6.48 | Down | <0.001 | 0.00 |
| H1F0 | 10.06 | 10.10 | 10.11 | 7.52 | 7.69 | 7.45 | −5.80 | Down | <0.001 | 0.00 |
| BCAT1 | 6.93 | 6.89 | 7.00 | 4.16 | 4.46 | 4.62 | −5.77 | Down | <0.001 | 0.00 |
| DDIT3 | 8.39 | 8.39 | 8.33 | 5.98 | 5.96 | 5.82 | −5.47 | Down | <0.001 | 0.00 |
| IFIT1 | 5.23 | 5.21 | 5.00 | 7.64 | 7.53 | 7.52 | 5.34 | Up | <0.001 | 0.00 |
| VTCN1 | 3.98 | 4.19 | 3.73 | 6.27 | 6.57 | 6.41 | 5.45 | Up | <0.001 | 0.00 |
| TPM1 | 7.48 | 7.57 | 7.43 | 10.05 | 10.17 | 10.12 | 6.15 | Up | <0.001 | 0.00 |
| GRAMD3 | 4.80 | 5.00 | 4.56 | 7.47 | 7.56 | 7.42 | 6.48 | Up | <0.001 | 0.00 |
| NANOS1 | 5.37 | 5.23 | 5.41 | 8.00 | 8.07 | 8.04 | 6.50 | Up | <0.001 | 0.00 |
| HSPA1A | 6.37 | 6.48 | 6.24 | 9.15 | 9.16 | 9.16 | 6.92 | Up | <0.001 | 0.00 |
| HSPA1B | 6.37 | 6.48 | 6.24 | 9.15 | 9.16 | 9.16 | 6.92 | Up | <0.001 | 0.00 |
| IFITM10 | 4.67 | 4.82 | 5.00 | 7.48 | 7.71 | 7.72 | 6.99 | Up | <0.001 | 0.00 |
| TPM2 | 4.66 | 4.84 | 4.29 | 7.46 | 7.56 | 7.52 | 7.56 | Up | <0.001 | 0.00 |
| RAP1A | 6.96 | 7.01 | 6.76 | 12.49 | 12.57 | 12.48 | 48.60 | Up | <0.001 | 0.00 |
The bioinformatics analysis also demonstrated that
POLR1B was involved in ‘positive regulation of glucose import’,
‘autophagosome assembly,’ ‘fat cell differentiation’, ‘negative
regulation of gene expression’, ‘positive regulation of cellular
senescence’, ‘cellular amino acid biosynthetic process’, ‘keratan
sulfate biosynthetic process’, ‘tetrahydrofolate metabolic
process’, ‘liver regeneration’ and ‘negative regulation of
transcription’ (Fig. 5D).
Identification of key POLR1B targets
in NSCLC using protein-protein interaction (PPI) network
analysis
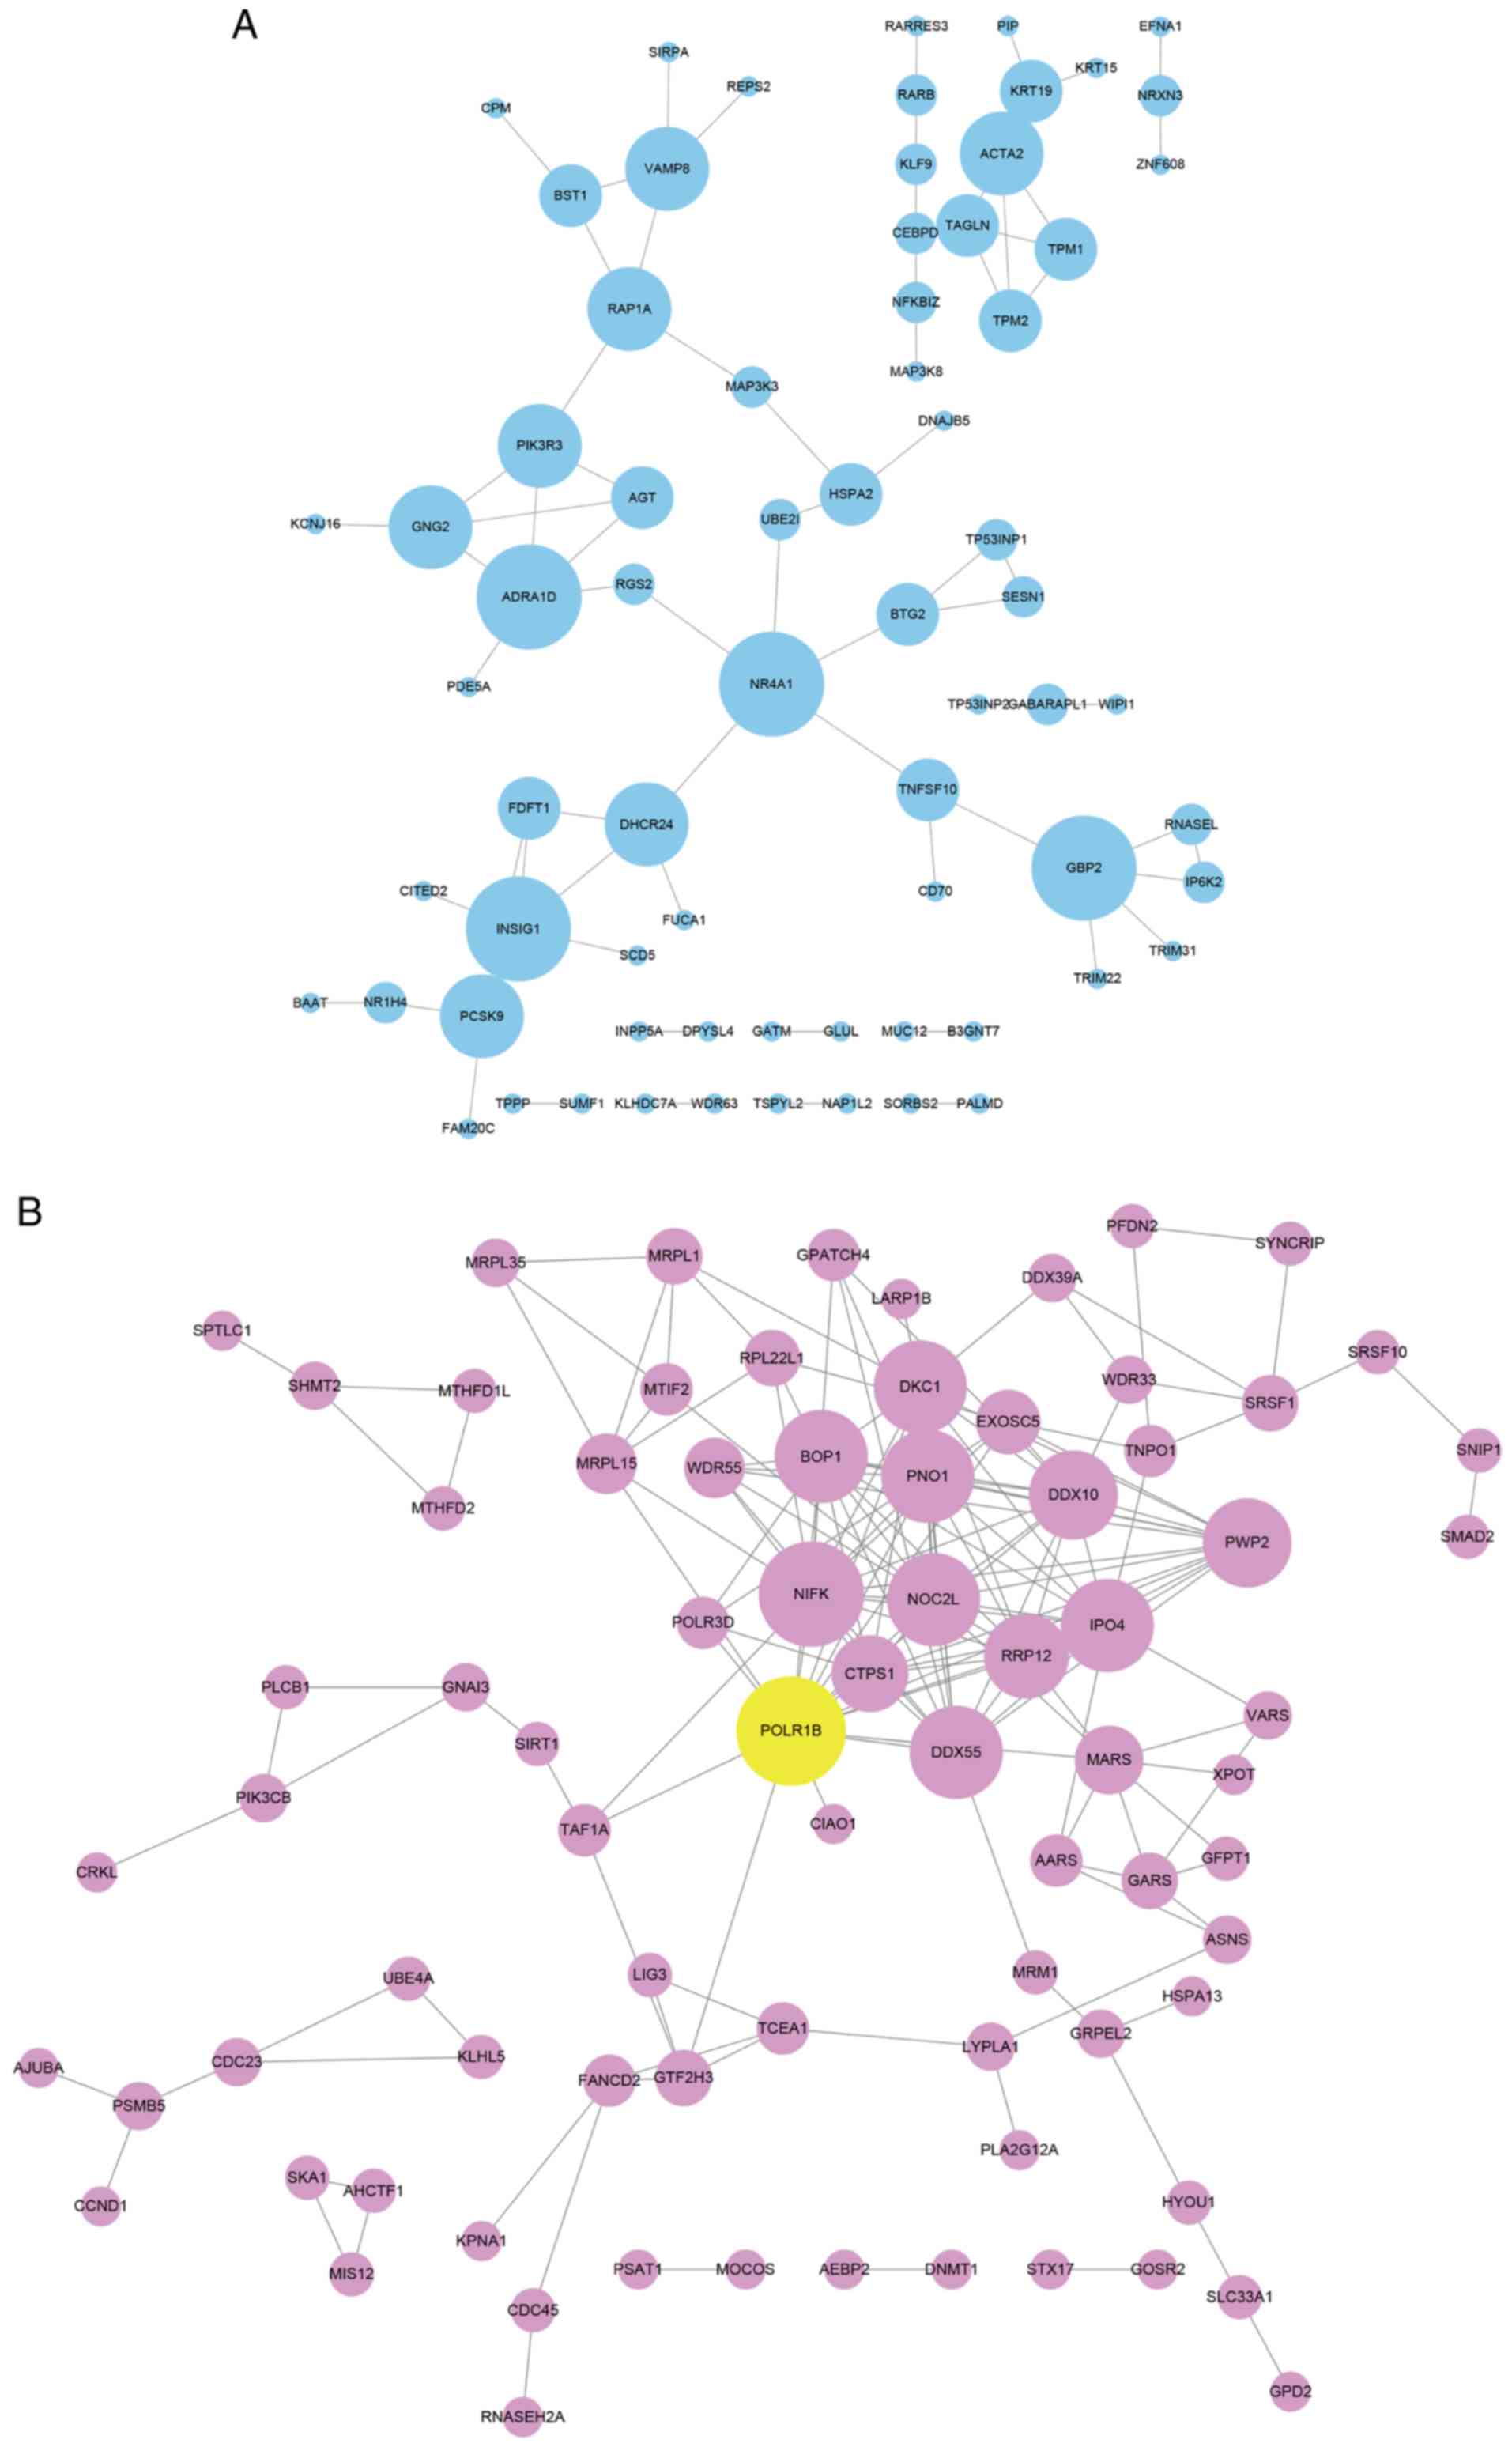
The key targets of POLR1B in NSCLC were identified
using a PPI network analysis. The search tool for the retrieval of
interacting genes/proteins (STRING) database (https://string-db.org) was used to investigate the
interactions between POLR1B targets. As presented in Fig. 6, the upregulated target-mediated PPI
network included 71 nodes and 71 edges, and the downregulated
target-mediated PPI network possessed 128 nodes and 300 edges.
Among these genes, adrenoceptor α1D (ADRA1D; degree=5) and nuclear
receptor subfamily 4 group A member 1 (NR4A1; degree=5) in the
upregulated PPI network, myc proto-oncogene protein (MYC)
(degree=5), ribosome biogenesis protein BOP1 (BOP1; degree=14),
H/ACA ribonucleoprotein complex subunit DKC1 (DKC1; degree=13),
RRP12-like protein (RRP12; degree=12), importin-4 (IPO4;
degree=11), bifunctional methylenetetrahydrofolate
dehydrogenase/cyclohydrolase, mitochondrial (MTHFD2; degree=11),
CTP synthase 1 (CTPS1; degree=9), Glycine-tRNA ligase (GARS;
degree=8), and nucleolar complex protein 2 homolog (NOC2L;
degree=7) in the downregulated network were identified to be key
regulators of NSCLC by interacting with POLR1B.
Discussion
Ribosome synthesis is one of the most complex and
energy-demanding cellular processes, and the production of rRNA,
the first event in ribosome synthesis, serves a critical role in
the complex regulation of cell proliferation (27). Enzymes involved in rRNA synthesis
include RNA polymerase I (Pol I), which transcribes ribosomal DNA
(rDNA) to generate a pre-rRNA precursor that is further processed
into 18S, 5.8S and 28S rRNA, which occurs via a number of essential
and critical nucleolytic steps (28). Previous studies have suggested that
increased Pol I-mediated rRNA synthesis in the nucleolus may be
associated with poor prognosis in patients with rhabdomyosarcoma
(19). Furthermore, POLR1B has been
identified as one of the subunits of Pol I in human cells (15). Therefore, it was hypothesized that
POLR1B may be involved in the regulation of tumor cells,
particularly in lung cancer cell proliferation in the present
study. However, the molecular functions of POLR1B in human cancer
remain unknown. To the best of our knowledge, the present study was
the first to demonstrate that POLR1B was highly expressed in
numerous lung cancer cell lines, including A549, NCI-H1299,
NCI-H1975 and NCI-H460, which suggested that POLR1B plays a
critical role in the regulation of lung cancer cells.
The essential components of Pol I include nucleolar
transcription factor 1, RNA polymerase I-specific transcription
initiation factor RRN3 (also known as TIF-1A) and one of the
largest subunits, POLR1B, which have all been reported to be highly
expressed in various types of cancer, including B-cell lymphoma
(29). In addition, small molecule
inhibitors that directly target Pol I (such as CX-5461 and CX-3543)
have been developed and implemented in further clinical trials for
the treatment of cancer (30,31).
Specifically, a previous study demonstrated that BMH-21, a compound
that promotes proteasome-dependent destruction of the large
catalytic subunit of the Pol I holocomplex (RPA194), possesses
broad anti-tumorigenic activity across the NCI60 cancer cell lines,
and suppresses tumor growth in vivo (32). Therefore, inhibiting the expression
of POLR1B may also attenuate tumor development. The present study
utilized several methods to assess cellular proliferation,
including the Celigo® cell counting method, MTT and
colony formation assays, and, to the best of our knowledge,
demonstrated for the first time that lentivirus-mediated RNAi
POLR1B-silencing inhibited the proliferation of lung cancer cells.
These data suggest that POLR1B serves an important role in the
modulation of lung cell proliferation. Furthermore, apoptosis was
detected using flow cytometry following POLR1B-silencing in the
present study, which revealed that POLR1B-knockdown induced
apoptosis in A549 cells. Therefore, the present study suggests that
suppressing POLR1B not only inhibits the proliferation of lung
cancer cells, but also results in cancer cell apoptosis, indicating
a double effect of POLR1B-depletion in cancer cells.
In order to investigate the molecular mechanisms
underlying the involvement of POLR1B in NSCLC progression,
microarray and co-expression analyses were performed. To the best
of our knowledge, the results of the present study demonstrated for
the first time that in NSCLC, POLR1B was involved in regulating
multiple biological processes, including ‘positive regulation of
glucose import’, ‘autophagosome assembly’, ‘positive regulation of
cellular senescence’ and ‘cellular amino acid biosynthetic
process.’ By constructing PPI networks, several key targets of
POLR1B were also identified, including ADRA1D, NR4A1, MYC, BOP1,
DKC1, RRP12, IPO4, MTHFD2, CTPS1, GARS and NOC2L. Previous studies
also confirmed that these genes served prominent roles in NSCLC
progression; NR4A1 was observed to be upregulated in NSCLC, and to
promote tumor growth and metastasis. In addition, MYC was reported
to be an oncogene in NSCLC, and to be involved in regulating
cellular proliferation, the cell cycle, apoptosis and the immune
response.
In conclusion, the present study identified that
POLR1B may serve an important role in the regulation of lung cancer
cell proliferation. Furthermore, POLR1B depletion was revealed to
inhibit lung cancer cell proliferation and induce apoptosis. The
suggestion that POLR1B functions as an important regulator of lung
cancer may facilitate the development of effective therapeutic
strategies for NSCLC.
Acknowledgements
Not applicable.
Funding
The present study was supported by grants from the
Jiaxing Science and Technology Program (grant no. 2017AY33007),
Zhejiang Province Medical and Health Technology Program (grant no.
2018KY800) and Jiaxing Key Discipiline of Medicine-Thoracic Surgery
supporting project (grant no. 2019-zc-09).
Availability of data and materials
The datasets used and/or analyzed during the current
study are available from the corresponding author on reasonable
request.
Authors' contributions
FY and WQ designed the study and wrote the
manuscript. FY, HL and JZ performed the experiments. XM analyzed
the data. All authors read and approved the final version of the
manuscript.
Ethics approval and consent to
participate
Not applicable.
Patient consent for publication
Not applicable.
Competing interests
The authors declare that they have no competing
interests.
Glossary
Abbreviations
Abbreviations:
|
POLR1B
|
RNA polymerase I subunit B
|
|
RNAi
|
RNA interference
|
|
NSCLC
|
non-small cell lung cancer
|
|
CTLA4
|
T lymphocyte antigen 4
|
|
PD-1
|
programmed cell death 1
|
|
FBS
|
fetal bovine serum
|
|
RT-qPCR
|
quantitative reverse transcription
polymerase chain reaction
|
References
|
1
|
Jemal A, Bray F, Center MM, Ferlay J, Ward
E and Forman D: Global cancer statistics. CA Cancer J Clin.
61:69–90. 2011. View Article : Google Scholar : PubMed/NCBI
|
|
2
|
Brahmer J, Reckamp KL, Baas P, Crinò L,
Eberhardt, et al: Nivolumab versus docetaxel in advanced
squamous-cell non-small-cell lung cancer. N Engl J Med.
373:123–135. 2015. View Article : Google Scholar : PubMed/NCBI
|
|
3
|
Rosell R, Bivona TG and Karachaliou N:
Genetics and biomarkers in personalisation of lung cancer
treatment. Lancet. 382:720–731. 2013. View Article : Google Scholar : PubMed/NCBI
|
|
4
|
Gerber DE and Schiller JH: Maintenance
chemotherapy for advanced non-small-cell lung cancer: New life for
an old idea. J Clin Oncol. 31:1009–1020. 2013. View Article : Google Scholar : PubMed/NCBI
|
|
5
|
Brudno JN and Kochenderfer JN: Chimeric
antigen receptor T-cell therapies for lymphoma. Nat Rev Clin Oncol.
15:31–46. 2018. View Article : Google Scholar : PubMed/NCBI
|
|
6
|
Anagnostou V, Smith KN, Forde PM, Niknafs
N, Bhattacharya R, White J, Zhang T, Adleff V, Phallen J, Wali N,
et al: Evolution of neoantigen landscape during immune checkpoint
blockade in non-small cell lung cancer. Cancer Discov. 7:264–276.
2017. View Article : Google Scholar : PubMed/NCBI
|
|
7
|
Rizvi NA, Hellmann MD, Snyder A, Kvistborg
P, Makarov V, Havel JJ, Lee W, et al: Cancer immunology. Mutational
landscape determines sensitivity to PD-1 blockade in non-small cell
lung cancer. Science. 348:124–128. 2015. View Article : Google Scholar : PubMed/NCBI
|
|
8
|
Garon EB, Rizvi NA, Hui R, Leighl N,
Balmanoukian AS, Eder JP, Patnaik A, Aggarwal C, Gubens M, Horn L,
et al: Pembrolizumab for the treatment of non-small-cell lung
cancer. N Engl J Med. 372:2018–2028. 2015. View Article : Google Scholar : PubMed/NCBI
|
|
9
|
Erfani N, Mehrabadi SM, Ghayumi MA,
Haghshenas MR, Mojtahedi Z, Ghaderi A and Amani D: Increase of
regulatory T cells in metastatic stage and CTLA-4 over expression
in lymphocytes of patients with non-small cell lung cancer (NSCLC).
Lung Cancer. 77:306–311. 2012. View Article : Google Scholar : PubMed/NCBI
|
|
10
|
Sharpe AH and Pauken KE: The diverse
functions of the PD1 inhibitory pathway. Nat Rev Immunol.
18:153–167. 2018. View Article : Google Scholar : PubMed/NCBI
|
|
11
|
Neelapu SS, Tummala S, Kebriaei P, Wierda
W, Gutierrez C, Locke FL, Komanduri KV, Lin Y, Jain N, Daver N, et
al: Chimeric antigen receptor T-cell therapy-assessment and
management of toxicities. Nat Rev Clin Oncol. 15:47–62. 2018.
View Article : Google Scholar : PubMed/NCBI
|
|
12
|
Ludin A and Zon LI: Cancer immunotherapy:
The dark side of PD-1 receptor inhibition. Nature. 552:41–42. 2017.
View Article : Google Scholar : PubMed/NCBI
|
|
13
|
Torreira E, Louro JA, Pazos I,
González-Polo N, Gil-Carton D, Duran AG, Tosi S, Gallego O, Calvo O
and Fernández-Tornero C: The dynamic assembly of distinct RNA
polymerase I complexes modulates rDNA transcription. Elife. 6(pii):
e208322017. View Article : Google Scholar : PubMed/NCBI
|
|
14
|
Engel C, Gubbey T, Neyer S, Sainsbury S,
Oberthuer C, Baejen C, Bernecky C and Cramer P: Structural basis of
RNA polymerase i transcription initiation. Cell. 169:120–131.e22.
2017. View Article : Google Scholar : PubMed/NCBI
|
|
15
|
Andersen JS, Lam YW, Leung AK, Ong SE,
Lyon CE, Lamond AI and Mann M: Nucleolar proteome dynamics. Nature.
433:77–83. 2005. View Article : Google Scholar : PubMed/NCBI
|
|
16
|
Seither P and Grummt I: Molecular cloning
of RPA2, the gene encoding the second largest subunit of mouse RNA
polymerase I. Genomics. 37:135–139. 1996. View Article : Google Scholar : PubMed/NCBI
|
|
17
|
Chan JC, Hannan KM, Riddell K, Ng PY, Peck
A, Lee RS, Hung S, Astle MV, Bywater M, Wall M, et al: AKT promotes
rRNA synthesis and cooperates with c-MYC to stimulate ribosome
biogenesis in cancer. Sci Signal. 4:ra562011. View Article : Google Scholar : PubMed/NCBI
|
|
18
|
Drygin D, Rice WG and Grummt I: The RNA
polymerase I transcription machinery: An emerging target for the
treatment of cancer. Annu Rev Pharmacol Toxicol. 50:131–156. 2010.
View Article : Google Scholar : PubMed/NCBI
|
|
19
|
Williamson D, Lu YJ, Fang C,
Pritchard-Jones K and Shipley J: Nascent pre-rRNA overexpression
correlates with an adverse prognosis in alveolar rhabdomyosarcoma.
Genes Chromosomes Cancer. 45:839–845. 2006. View Article : Google Scholar : PubMed/NCBI
|
|
20
|
Tang Z, Li C, Kang B, Gao G, Li C and
Zhang Z: GEPIA: A web server for cancer and normal gene expression
profiling and interactive analyses. Nucleic Acids Res. 45:W98–W102.
2017. View Article : Google Scholar : PubMed/NCBI
|
|
21
|
Cerami E, Gao J, Dogrusoz U, Gross BE,
Sumer SO, Aksoy BA, Jacobsen A, Byrne CJ, Heuer ML, Larsson E, et
al: The cBio cancer genomics portal: An open platform for exploring
multidimensional cancer genomics data. Cancer Discov. 2:401–404.
2012. View Article : Google Scholar : PubMed/NCBI
|
|
22
|
Sanchez-Palencia A, Gomez-Morales M,
Gomez-Capilla JA, Pedraza V, Boyero L, Rosell R and Fárez-Vidal ME:
Gene expression profiling reveals novel biomarkers in nonsmall cell
lung cancer. Int J Cancer. 129:355–364. 2011. View Article : Google Scholar : PubMed/NCBI
|
|
23
|
Nabzdyk CS, Chun M, Pradhan L and Logerfo
FW: High throughput RNAi assay optimization using adherent cell
cytometry. J Transl Med. 9:482011. View Article : Google Scholar : PubMed/NCBI
|
|
24
|
Livak KJ and Schmittgen TD: Analysis of
relative gene expression data using real-time quantitative PCR and
the 2(-Delta Delta C(T)) method. Methods. 25:402–408. 2001.
View Article : Google Scholar : PubMed/NCBI
|
|
25
|
Szklarczyk D, Franceschini A, Wyder S,
Forslund K, Heller D, Huerta-Cepas J, Simonovic M, Roth A, Santos
A, Tsafou KP, et al: STRING v10: Protein-protein interaction
networks, integrated over the tree of life. Nucleic Acids Res.
43((Database Issue)): D447–D452. 2015. View Article : Google Scholar : PubMed/NCBI
|
|
26
|
Su G, Morris JH, Demchak B and Bader GD:
Biological network exploration with Cytoscape 3. Curr Protoc
Bioinformatics. 47:8 13 11–24. 2014. View Article : Google Scholar
|
|
27
|
White RJ: RNA polymerases I and III,
non-coding RNAs and cancer. Trends Genet. 24:622–629. 2008.
View Article : Google Scholar : PubMed/NCBI
|
|
28
|
Cornelison R, Dobbin ZC, Katre AA, Jeong
DH, Zhang Y, Chen D, Petrova Y, Llaneza DC, Steg AD, Parsons L, et
al: Targeting RNA-polymerase I in both chemosensitive and
chemoresistant populations in epithelial ovarian cancer. Clin
Cancer Res. 23:6529–6540. 2017. View Article : Google Scholar : PubMed/NCBI
|
|
29
|
Bywater MJ, Poortinga G, Sanij E, Hein N,
Peck A, Cullinane C, Wall M, Cluse L, Drygin D, Anderes K, et al:
Inhibition of RNA polymerase I as a therapeutic strategy to promote
cancer-specific activation of p53. Cancer Cell. 22:51–65. 2012.
View Article : Google Scholar : PubMed/NCBI
|
|
30
|
Drygin D, Siddiqui-Jain A, O'Brien S,
Schwaebe M, Lin A, Bliesath J, Ho CB, Proffitt C, Trent K, Whitten
JP, et al: Anticancer activity of CX-3543: A direct inhibitor of
rRNA biogenesis. Cancer Res. 69:7653–7661. 2009. View Article : Google Scholar : PubMed/NCBI
|
|
31
|
Ruggero D: Revisiting the nucleolus: From
marker to dynamic integrator of cancer signaling. Sci Signal.
5:pe382012. View Article : Google Scholar : PubMed/NCBI
|
|
32
|
Peltonen K, Colis L, Liu H, Trivedi R,
Moubarek MS, Moore HM, Bai B, Rudek MA, Bieberich CJ and Laiho M: A
targeting modality for destruction of RNA polymerase I that
possesses anticancer activity. Cancer Cell. 25:77–90. 2014.
View Article : Google Scholar : PubMed/NCBI
|