Open Access

A three‑mRNA status risk score has greater predictive ability compared with a lncRNA‑based risk score for predicting prognosis in patients with hepatocellular carcinoma

  • Authors:
    • Wenxia Zhang
    • Qiang Fu
    • Kanyu Yao
  • View Affiliations

  • Published online on: July 24, 2020     https://doi.org/10.3892/ol.2020.11911
  • Article Number: 48
  • Copyright: © Zhang et al. This is an open access article distributed under the terms of Creative Commons Attribution License.

Metrics: Total Views: 0 (Spandidos Publications: | PMC Statistics: )
Total PDF Downloads: 0 (Spandidos Publications: | PMC Statistics: )


Abstract

Hepatocellular carcinoma (HCC) represents the fifth most common cause of cancer‑associated mortality in men, and the seventh in women, worldwide. The aim of the present study was to identify a reliable and robust RNA‑based risk score for the survival prediction of patients with hepatocellular carcinoma (HCC). Gene expression data from HCC and healthy control samples were obtained from The Cancer Genome Atlas to screen differentially expressed mRNAs and long non‑coding RNAs (lncRNAs). Univariate and multivariate Cox proportional‑hazards regression models and the LASSO algorithm for the Cox proportional‑hazards model (LASSO Cox‑PH model) were used to identify the prognostic mRNAs and lncRNAs among differentially expressed mRNAs (DEMs) and differentially expressed lncRNAs (DELs), respectively. Prognostic risk scores were generated based on the expression level or status of the prognostic lncRNAs and mRNAs, and the predictive abilities of these RNAs in TCGA and validation datasets were compared. Functional enrichment analyses were also performed. The results revealed a total of 154 downregulated and 625 upregulated mRNAs and 18 upregulated lncRNAs between tumor and control samples in TCGA dataset. A three‑mRNA and a five‑lncRNA expression signatures were identified using the LASSO Cox‑PH model. Three‑mRNA and five‑lncRNA expression and status risk scores were generated. Using likelihood ratio P‑values and area under the curve values from TCGA and the validation datasets, the three‑mRNA status risk score was more accurate compared with the other risk scores in predicting the mortality of patients with HCC. The three identified mRNAs, including hepatitis A virus cellular receptor 1, MYCN proto‑oncogene BHLH transcription factor and stratifin, were associated with the cell cycle and oocyte maturation pathways. Therefore, a three‑mRNA status risk score may be valuable and robust for risk stratification of patients with HCC. The three‑mRNA status risk score exhibited greater prognostic value compared with the lncRNA‑based risk score.

Introduction

Every year, >500,000 new cases of hepatocellular carcinoma (HCC) are diagnosed, and HCC is the fifth most prevalent cause of cancer-related mortality in men, and the seventh in women, worldwide (1,2). The poor outcome is partly caused by the clinical and molecular heterogeneity of HCC (3). Therefore, effective prognostic biomarkers are required to identify high-risk patients and guide personalized therapy.

Previous studies have demonstrated that long non-coding RNAs (lncRNAs), which are non-coding RNAs comprising >200 nucleotides, are crucial for HCC initiation and progression (4,5). A number of lncRNA signature-based models have been reported for the prognosis prediction of patients with HCC (68). In contrast with lncRNA signatures, prognostic mRNA signatures are more likely to be generated due to the large number of mRNAs. Li et al (9) have proposed a three-gene prognostic expression signature based on HCC data from The Cancer Genome Atlas (TCGA). In addition, an eight-gene signature comprising five mRNAs and three lncRNAs has been demonstrated to be efficient for predicting prognosis in patients with HCC (10). However, no currently available studies focus on the comparative analysis of mRNA and lncRNA signatures and their prognostic value for patients with HCC.

With an aim of improving the diagnosis, treatment and prevention of tumors, TCGA provides publicly available datasets for >30 types of human tumors (11). Using TCGA data, the present study aimed to identify mRNA and lncRNA signatures for HCC and explore potential mechanisms underlying HCC progression.

Materials and methods

Data source and preprocessing

A search for HCC microarray gene expression data in TCGA (https://gdc-portal.nci.nih.gov/) data portal retrieved data from 373 HCC samples and 50 healthy control samples obtained by Illumina HiSeq 2000 RNA Sequencing. Among them, clinical information was available for 366 patients with HCC, which were used in the analysis.

The E-TABM-36 dataset (12) was downloaded from the European Bioinformatics Institute (EBI) array database (https://www.ebi.ac.uk/arrayexpress/), which is based on GPL 96 [HG-U133A] Affymetrix GeneChip Human Genome HG-U133A and comprises 65 samples. Of these, 44 samples had overall survival (OS) information and were used as the validation dataset. For data preprocessing, median scale normalization and robust scale normalization approaches were used as described in the supplementary data of a previous study (13).

The HUGO Gene Nomenclature Committee (HGNC) database (http://www.genenames.org/) that contains 4,076 lncRNAs and 19,194 protein-coding genes (14) was used to identify the lncRNAs and mRNAs in TCGA and E-TABM-36 datasets.

Identification of differentially expressed lncRNAs and mRNAs

The Limma package in R (v. 3.34.7; http://bioconductor.org/packages/release/bioc/html/limma.html) was used to select differentially expressed lncRNAs (DELs) and mRNAs (DEMs) between tumor and control samples from TCGA dataset. To determine whether the gene expression difference was significant, the threshold values of false discovery rate (FDR) <0.05 and |log2fold-change (FC)|>1 were used. The pheatmap package (15) (version 1.0.8) of R was applied to perform two-way hierarchical clustering analysis based on the centered Pearson correlation algorithm for the identified DEMs and DELs.

Development of prognosis prediction models

Using the survival package in R (16) (v. 2.41–1; http://bioconductor.org/packages/survivalr/), univariate and multivariate Cox proportional hazards regression analyses were performed to identify independent prognostic lncRNAs and mRNAs associated with OS among the aforementioned DELs and DEMs. P<0.05 was considered to indicate a statistically significant difference.

Subsequently, the L1-penalized (LASSO) Cox proportional-hazards (Cox-PH) regression model was fitted to the identified OS-associated lncRNAs and mRNAs using the penalized package (17) of R (v. 0.9.50, http://cran.r-project.org/web/packages/penalized/index.html). With the optimal λ value obtained through a 1,000 cross-validation check, signatures of optimal lncRNAs and mRNAs were determined.

Prognostic models to calculate risk scores were generated based on the expression status or levels of the prognostic lncRNAs or mRNAs and their Cox-PH regression coefficients. The expression status of a lncRNA or mRNA was defined according to an optimal expression cut-off value determined using the X-Tile tool (https://medicine.yale.edu/lab/rimm/research/software.aspx) based on patient survival; patients with an RNA expression level greater than the cut-off value were assigned to the high expression group (expression status=1), whereas patients with an RNA expression level equal or lower than the cut-off value were assigned to the low expression group (expression status=0). Prognostic scoring models based on the expression status of prognostic lncRNAs or mRNAs were calculated as follows: Status Risk Score=∑βRNAn × StatusRNAn; those based on the expression levels of prognostic lncRNAs or mRNAs were calculated as follows: Expression Risk Score=∑βRNAn × ExpRNAn, where βRNAn indicates the Cox-PH coefficient of an RNA and StatusRNAn or ExpRNAn indicates the expression status or level of an RNA, respectively.

Based on the median risk score calculated using a prognostic scoring model as the cut-off value, patients in the TCGA and the E-TABM-36 datasets were classified into high- and low-risk groups.

Establishment of a nomogram

OS of different risk groups was estimated using Kaplan-Meier plots in the survival package of R (v. 2.41–1; http://bioconductor.org/packages/survivalr/) (18) and the weighted likelihood ratio test (19). The discriminative ability of different risk scores was evaluated and compared using receiver-operating characteristic (ROC) curve analyses (20) by calculating the area under the curve (AUC) using SPSS software (v. 24.0; IBM Corp.). Univariate and multivariate Cox regression analyses based on the survival package in R (v. 2.41–1; http://bioconductor.org/packages/survivalr/) (21) were performed to determine independent prognostic factors associated with OS, including clinical features as covariates. To further investigate the association between the independent prognostic factors and survival prognosis, nomograms incorporating risk score status and identified prognostic clinical factors were produced using the rms package (22) of R (v. 5.1-2; http://cran.r-project.org/web/packages/rms/index.html). Comparative analysis of actual and predicted 1- and 3-year survival probability were conducted using calibration plots (23). P<0.05 was considered indicate a statistically significant difference.

Functional annotation

TCGA dataset was divided into high- and low-risk groups by the optimal risk score, and differentially expressed genes (DEGs) between the two groups were screened using FDR <0.05 and |log2FC|>0.263 as strict threshold values. The identified DEGs were analyzed by Gene Ontology (GO) function and Kyoto Encyclopedia of Genes and Genomes (KEGG) pathway enrichment analyses using the clusterProfiler package (24) (v. 3.6.0) of R. P<0.05 was considered to indicate a statistically significant difference.

Results

DEMs and DELs between HCC and healthy control samples

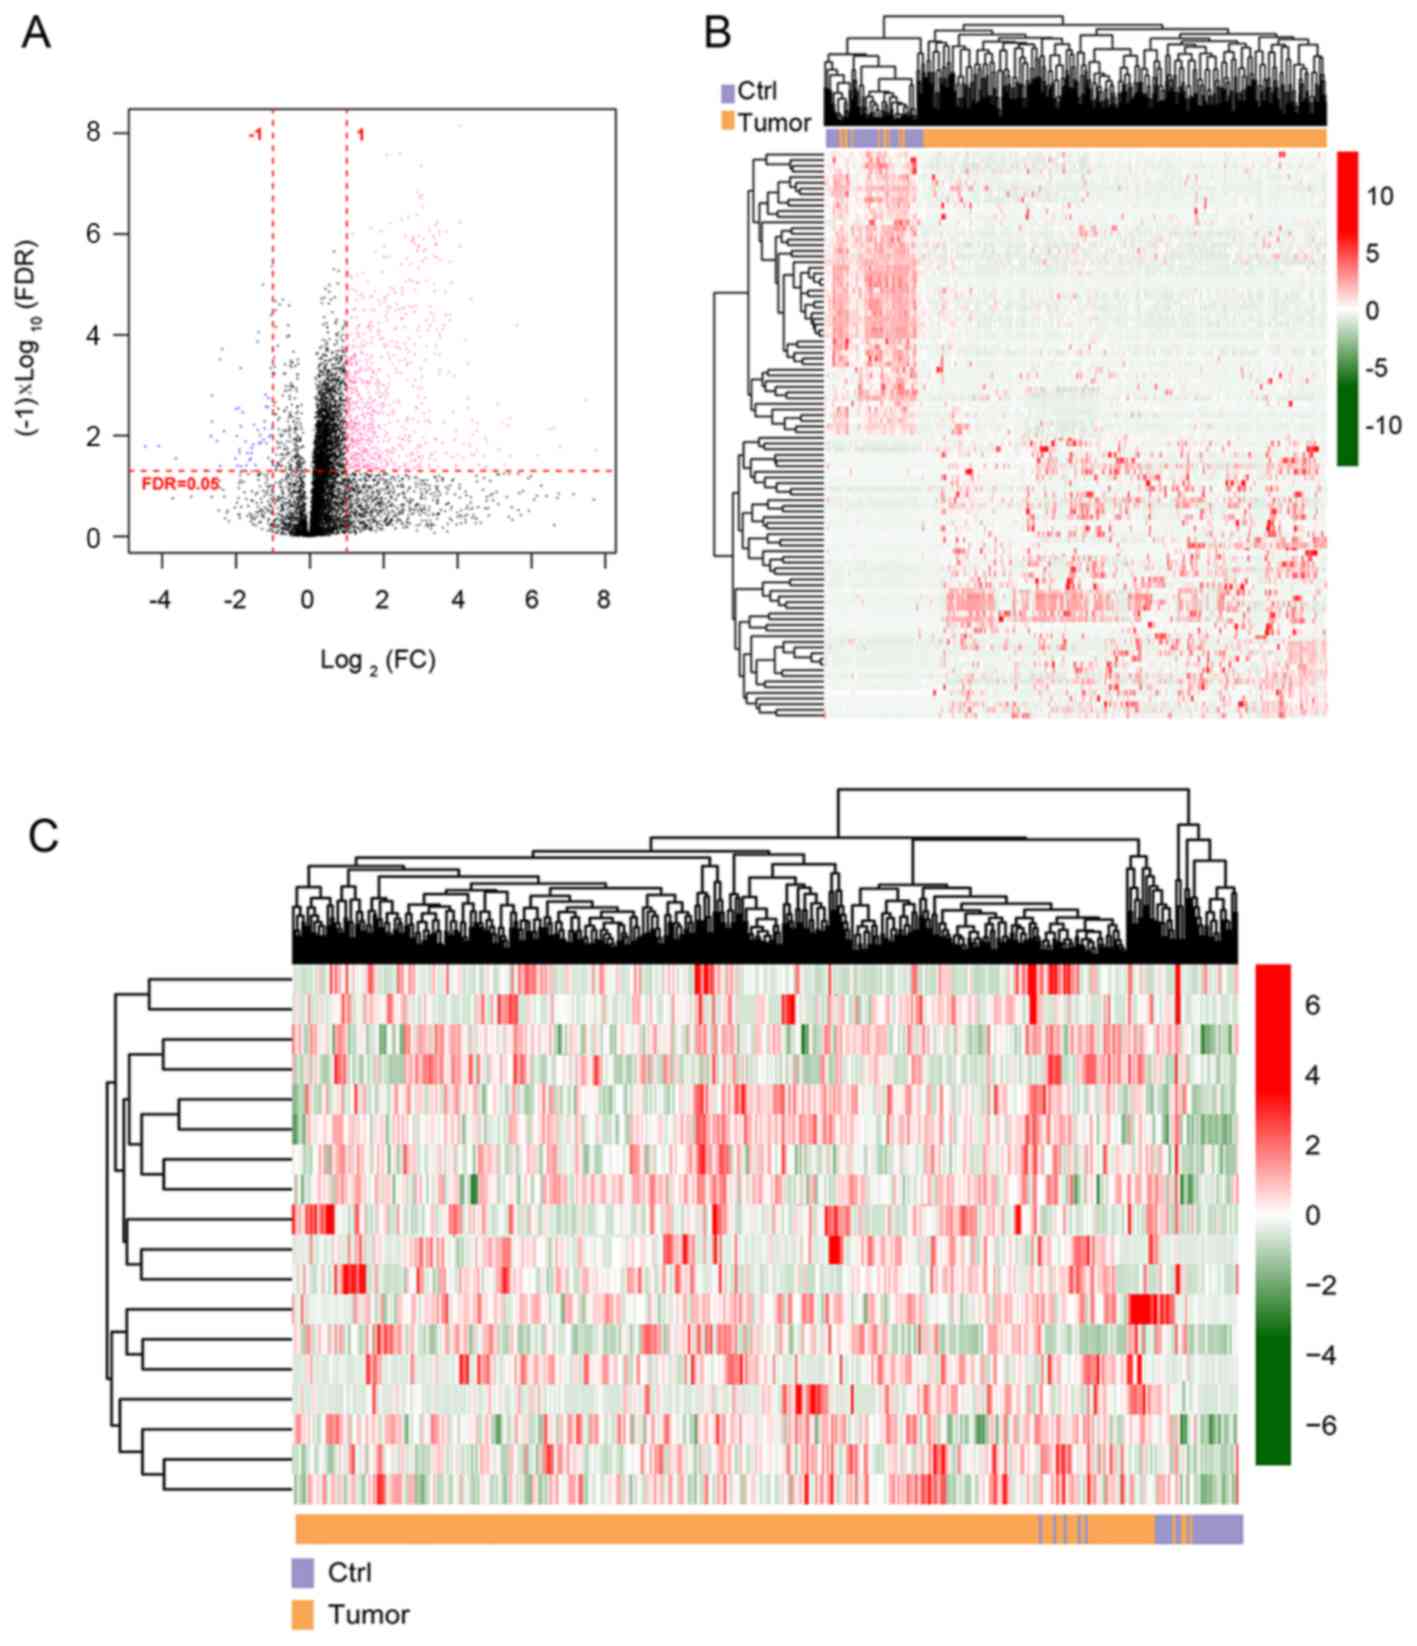
Following annotation based on the HGNC database, a total of 18,497 mRNAs and 2,528 lncRNAs were obtained in TCGA and the E-TABM-36 datasets. Comparison between the HCC (n=373) and normal control (n=50) samples from TCGA dataset revealed 154 downregulated and 625 upregulated mRNAs, as well as 18 upregulated lncRNAs in HCC samples, which resulted in a total of 797 DERs (Fig. 1A). Two-way hierarchical clustering of the identified DERs demonstrated that the expression patterns of the DEMs and DELs were different between tumor and healthy control samples (Fig. 1B and C).

Three-mRNA status risk score exhibits the best results in predicting the mortality of patients with HCC

To identify the prognostic lncRNA and mRNA signatures, univariate and multivariate Cox regression analyses of the identified DELs and DEMs were performed. In univariate Cox regression analysis, 110 mRNAs and 13 lncRNAs were significantly associated with OS (P<0.05, Table SI). In addition, 14 mRNAs and 8 lncRNAs were identified to be independent prognostic factors by multivariate Cox regression analysis (Table SII), and were used to fit the LASSO Cox-PH regression model. As a result, a five-lncRNA signature (λ=7.283) and a three-mRNA signature (λ=5.646) were obtained (Table I). The five-lncRNA signature included HLA complex group 4 (HCG4), nuclear paraspeckle assembly transcript 1 (NEAT1), RFPL1 antisense RNA 1 (RFPL1S), chromobox 2 (CBX2) and cell division cycle-associated 8 (CDCA 8), whereas the three-mRNA signature comprised hepatitis A virus cellular receptor 1 (HAVCR1), MYCN proto-oncogene BHLH transcription factor (MYCN) and stratifin (SFN). These signatures were used to calculate risk scores based on their expression level or status as follows: mRNA Status Risk Score=0.3839 × StatusCBX2 + 0.1625 × StatusCDCA8 + 0.2586 × StatusHAVCR1 + 0.2621 × StatusMYCN + 0.0814 × StatusSFN; lncRNA Status Risk Score=0.1919 × StatusHCG4 + 0.2966 × StatusNEAT1−0.1552 × StatusRFPL1S; mRNA Expression Risk Score=0.3839 × ExpCBX2 + 0.1625 × ExpCDCA8 + 0.2586 × ExpHAVCR1 + 0.2621 × ExpMYCN + 0.0814 × ExpSFN; lncRNA Expression Risk Score=0.1919 × ExpHCG4 + 0.2966 × ExpNEAT1−0.1552 × ExpRFPL1S.

Table I.

Characteristics of the five-lncRNA signature and the three-mRNA signature.

Table I.

Characteristics of the five-lncRNA signature and the three-mRNA signature.

A, Five-lncRNA signature

ID βRNAHazard ratio95% CIP-valueCut-off
HCG40.19191.30551.0997–1.7100 P=5.30×10⁻³−0.54
NEAT10.29661.27431.1713–1.8640 P=2.12×10⁻²−0.91
RFPL1S−0.15520.79510.6477–0.9760 P=2.80×10−30.15
CBX20.38393.29331.7548–6.1810 P=2.00×10−40.67
CDCA80.16255.16011.3476–19.7600 P=1.66×10−20.91

B, Three-mRNA signature

ID βRNAHazard ratio95% CIP-valueCut-off

HAVCR10.25862.15611.4016–3.3170 P=5.00×10−41.13
MYCN0.26211.97751.3593–2.8770 P=4.00×10−41.69
SFN0.08141.23791.0198–1.5030 P=3.09×10−20.92

[i] lncRNA, long non-coding RNA; HCG4, HLA complex group 4; NEAT1, nuclear paraspeckle assembly transcript 1; RFPL1S, RFPL1 antisense RNA 1; CBX2, chromobox 2; CDCA8, cell division cycle-associated 8; HAVCR1, hepatitis A virus cellular receptor 1; MYCN, MYCN proto-oncogene BHLH transcription factor; SFN, stratifin; βRNA, Cox proportional hazard coefficient; CI, confidence interval.

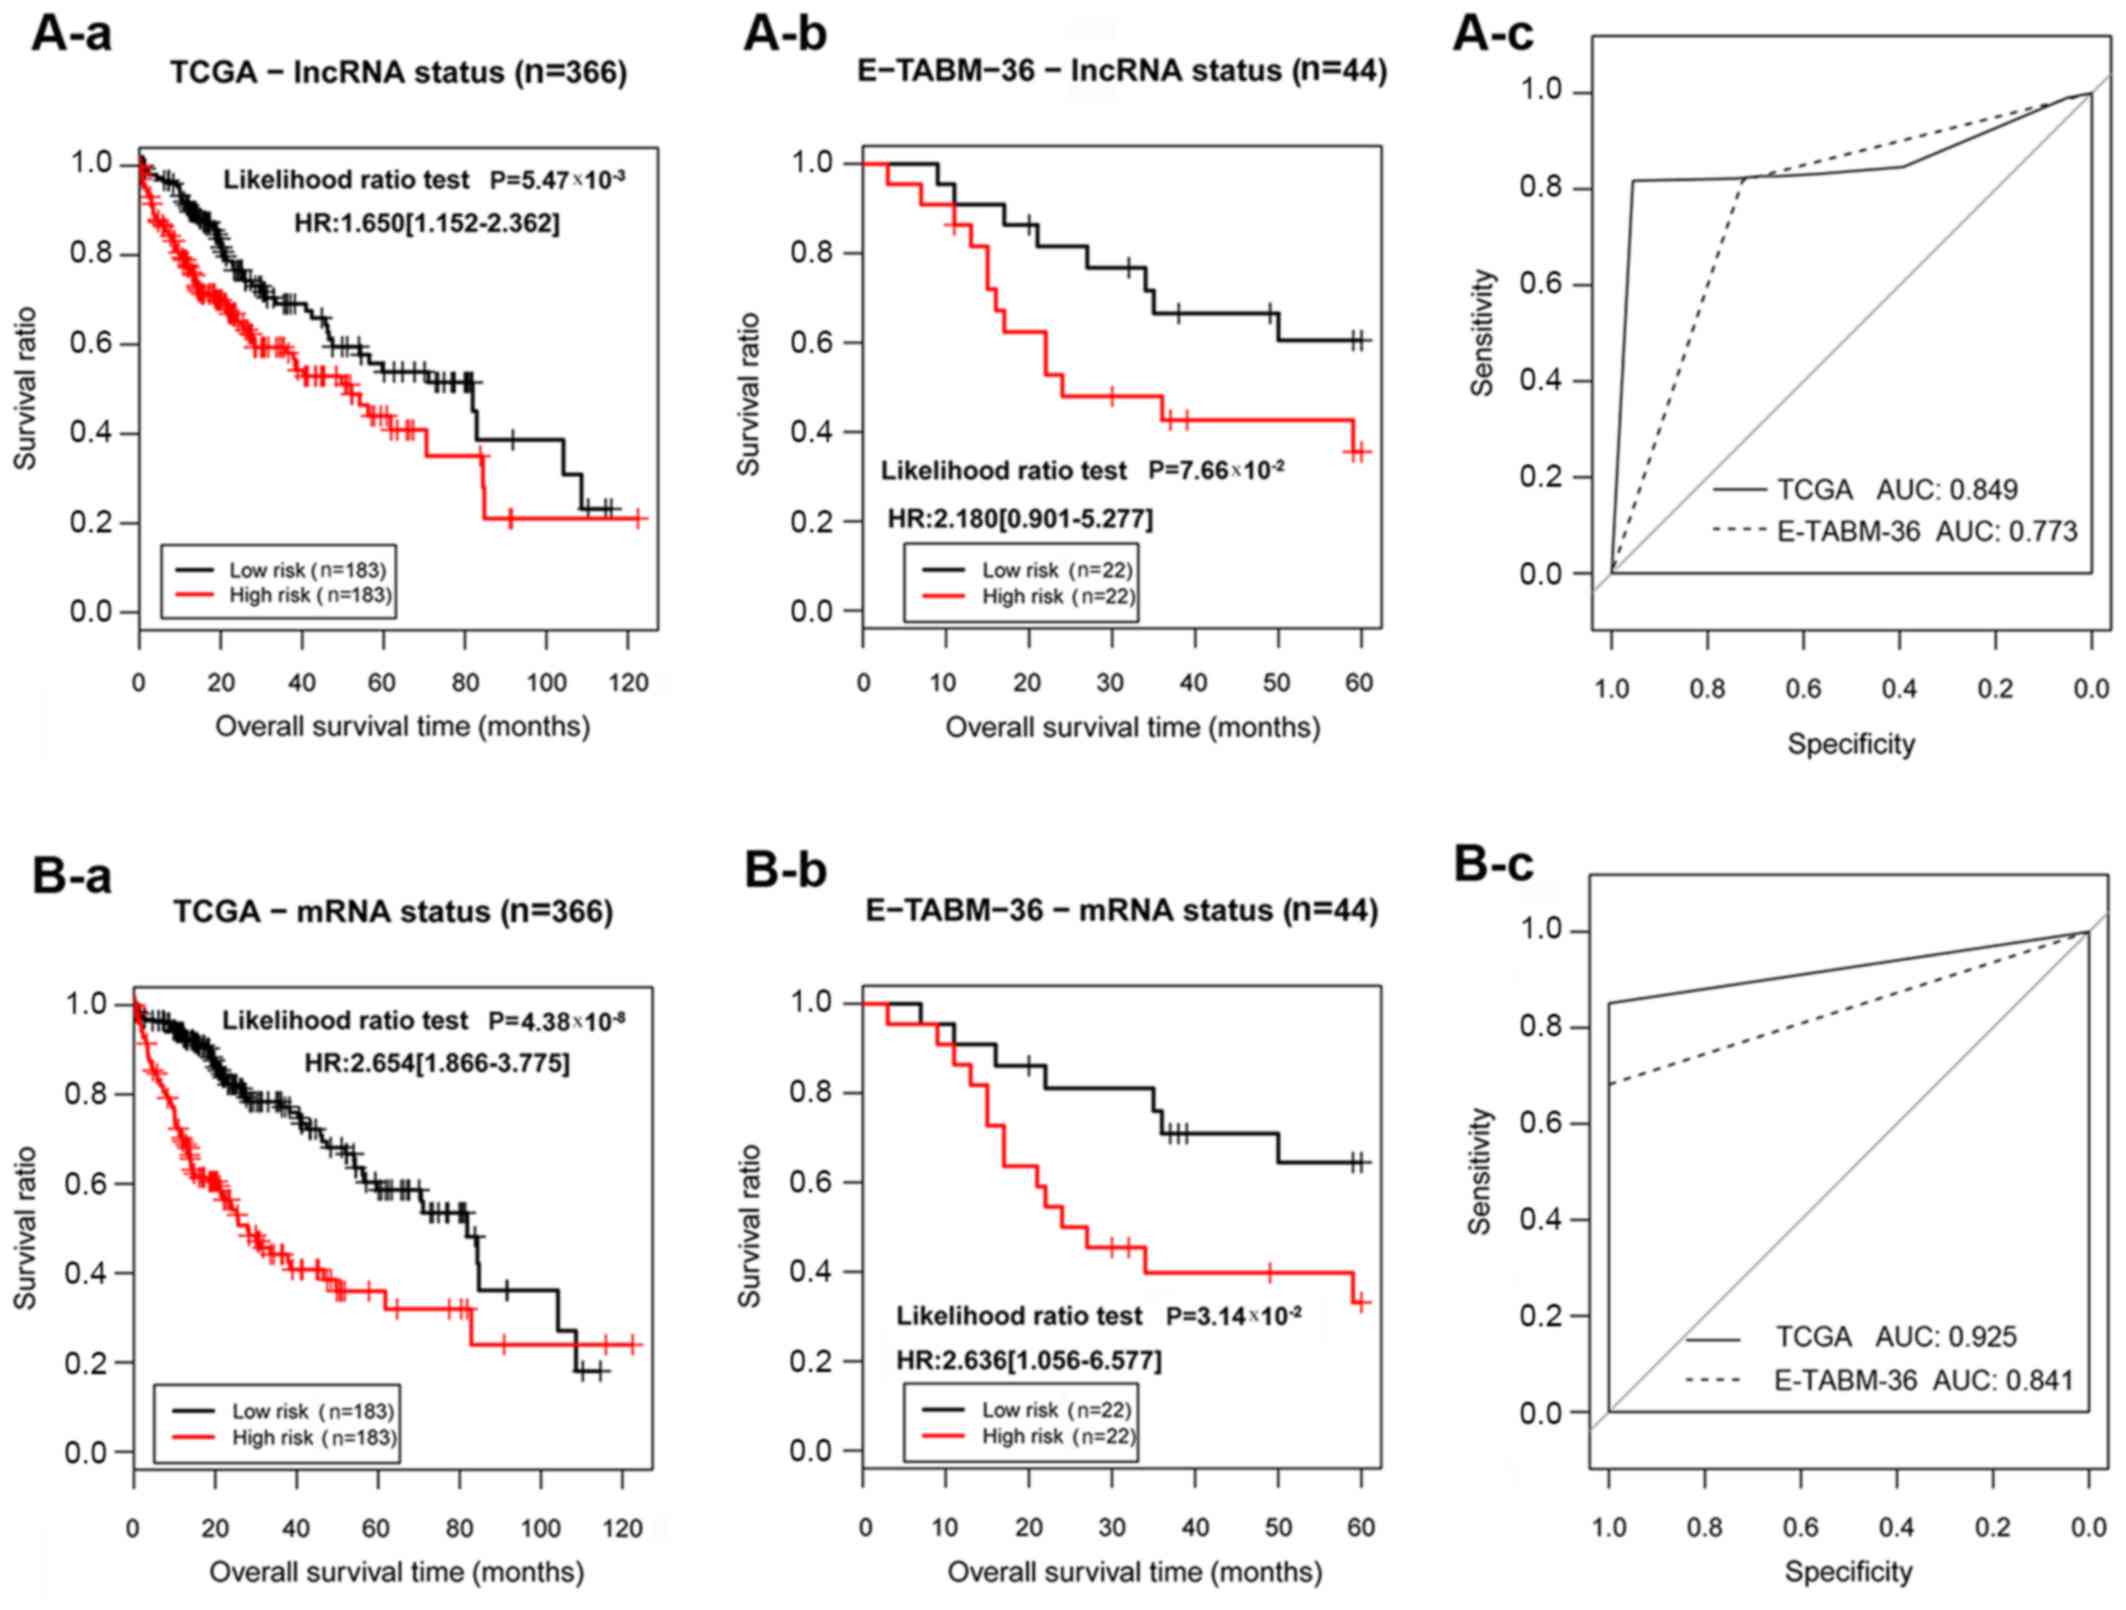
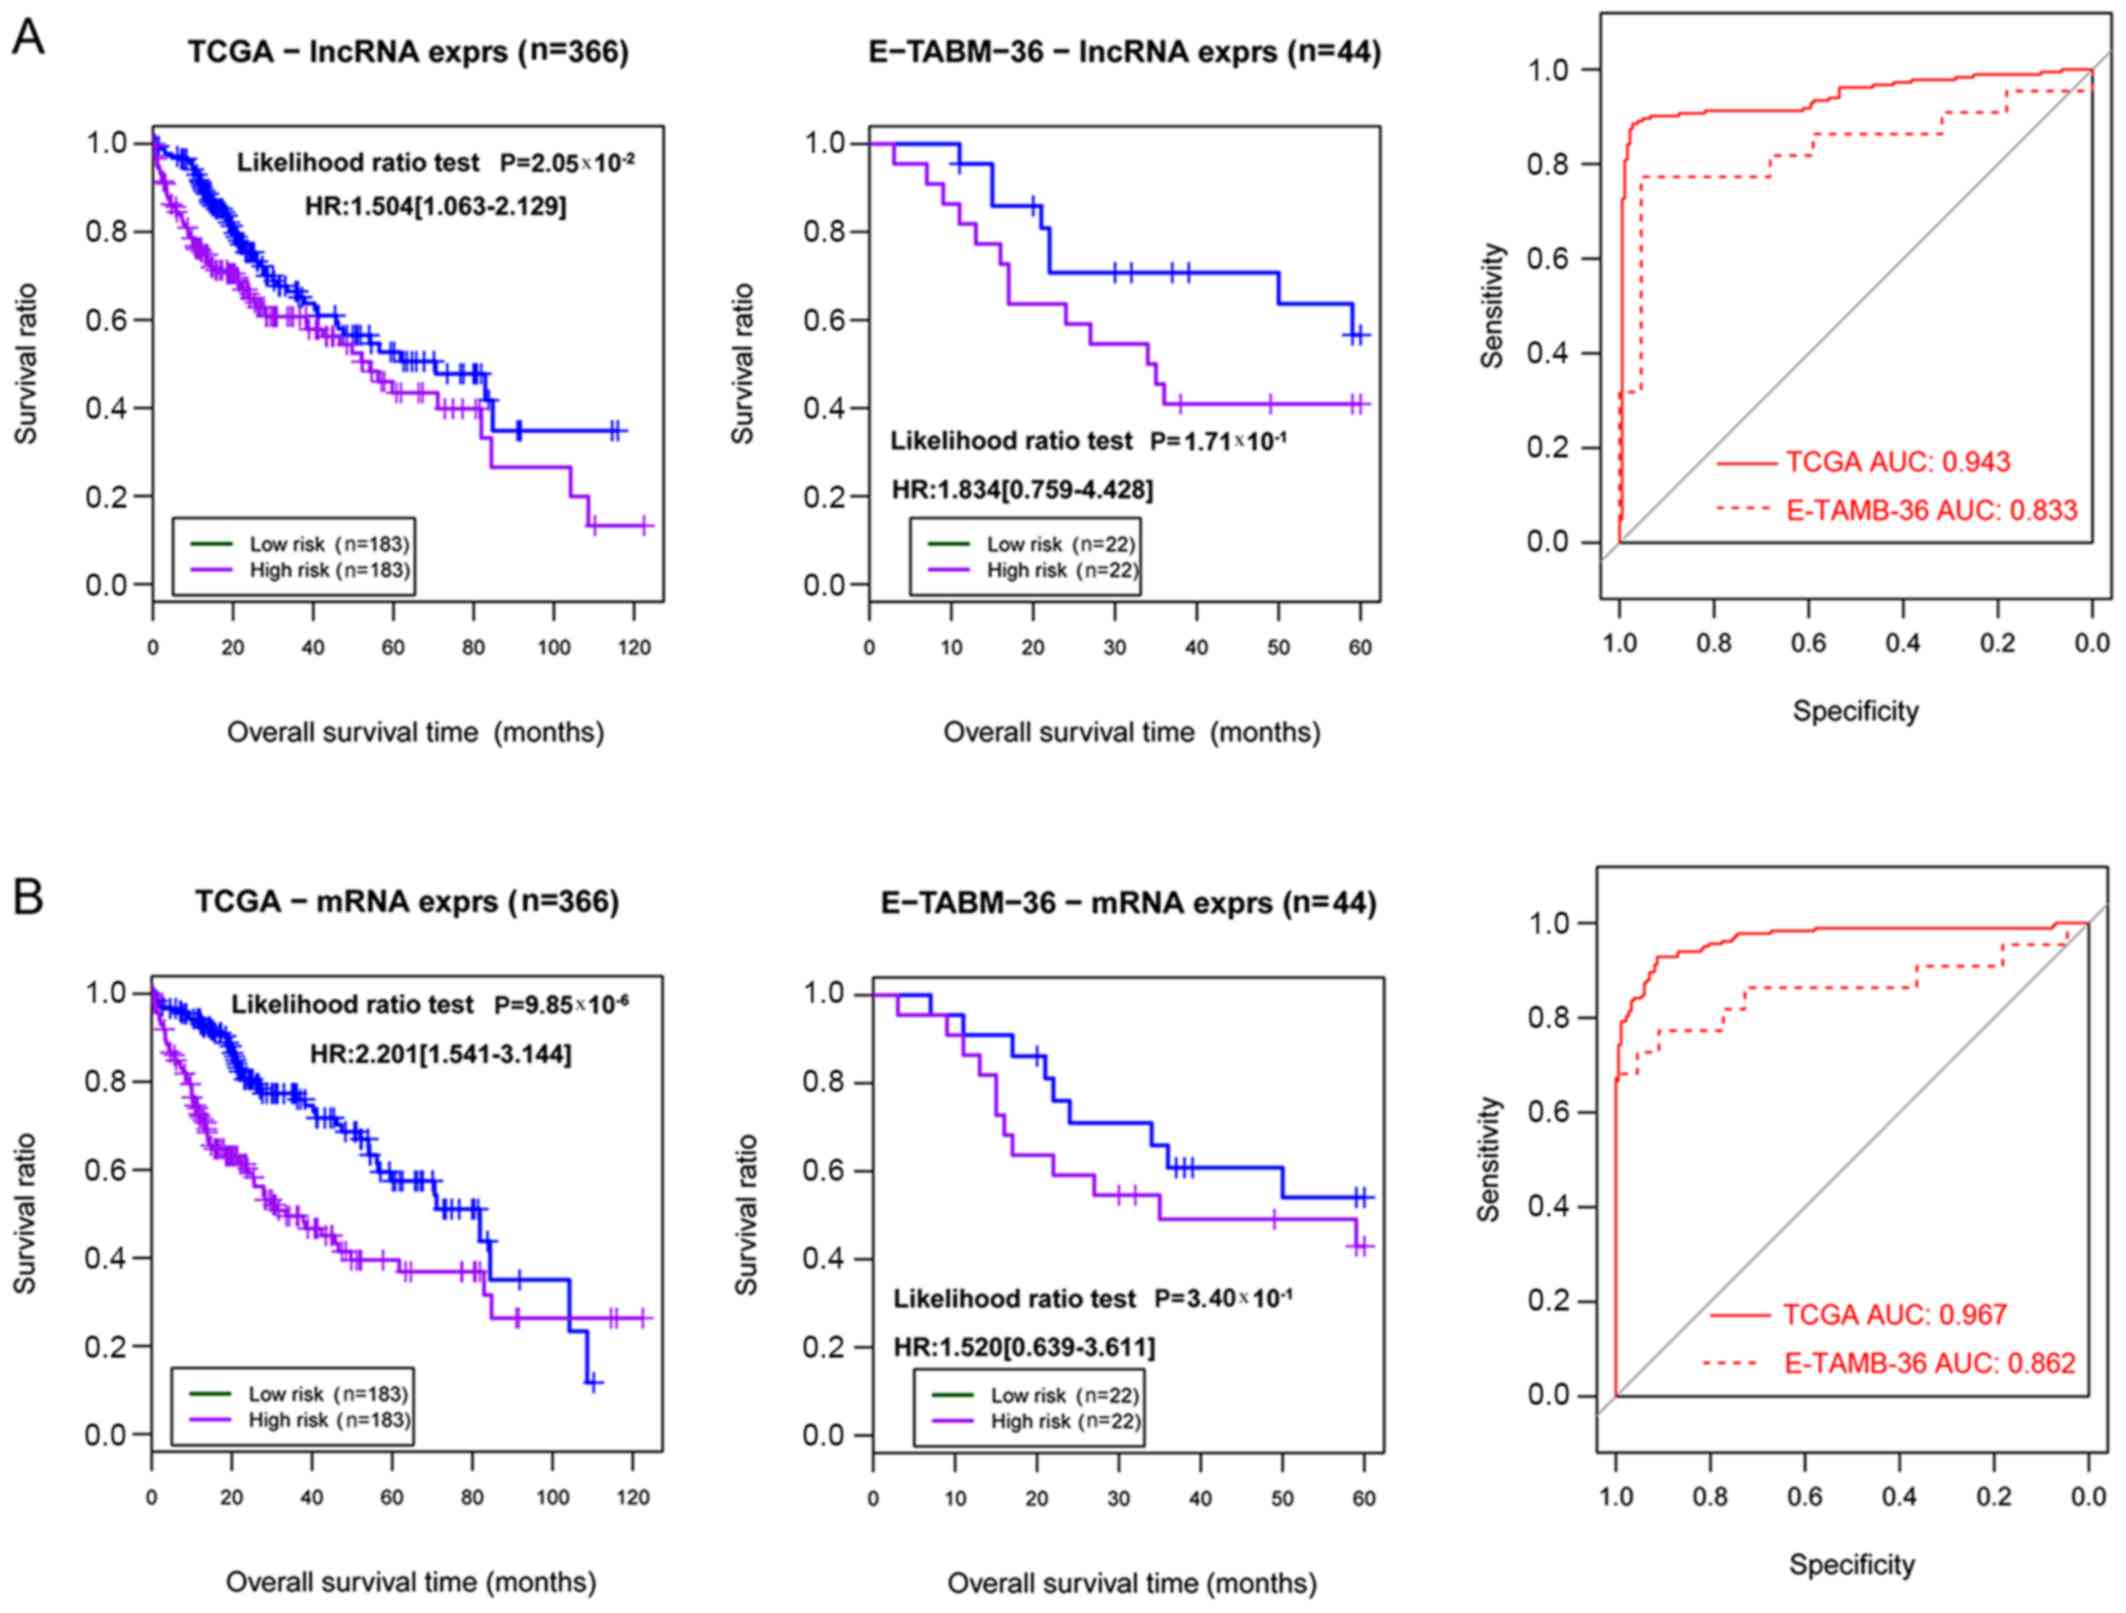
TCGA and the E-TABM-36 datasets were classified into high- and low-risk groups based on the status and expression risk scores of the three-mRNA and five-lncRNA signatures separately (Figs. 2 and 3). The discriminatory power of the four risk scores for patients with HCC was evaluated and compared using Kaplan-Meier analysis for OS and ROC curves (Table II; Figs. 2 and 3).

Table II.

Evaluation of the prognostic power of four risk scores based on lncRNAs or mRNAs.

Table II.

Evaluation of the prognostic power of four risk scores based on lncRNAs or mRNAs.

Expression risk scoreStatus risk score


Likelihood ratio P-valueAUC valueLikelihood ratio P-valueAUC value


TypeTraining setValidation setTraining setValidation setTraining setValidation setTraining setValidation set
lncRNA P=2.05×10⁻² P=1.71×10−10.94300.8330 P=5.50×10⁻³ P=7.66×10−20.84900.7730
mRNAP<0.0001 P=3.40×10−10.96700.8620P<0.0001 P=3.14×10−20.92500.8410

[i] lncRNA, long non-coding RNA; AUC, area under the curve.

The four risk scores split TCGA dataset into two risk groups with significantly different OS rate (P<0.05). However, only the three-mRNA status risk score exhibited significant prognostic value for patients with HCC in the E-TABM-36 dataset (P=0.031). Among the four risk scores, the three-mRNA status risk score exhibited the lowest P-values in the Kaplan-Meier OS analysis (TCGA, P<0.001; E-TABM-36, P=0.031). Since the results suggested that the three-mRNA status risk score exhibited the greatest predictive value for HCC, it was selected for further analyses. Notably, HAVCR1 (log2FC=4.2553; FDR=4.34×10⁻¹⁴), MYCN (log2FC=3.1756; FDR=1.59×10⁻¹⁴) and SFN (log2FC=2.08; FDR=7.05×10⁻¹⁴) were upregulated in HCC samples compared with normal control samples.

Establishment of a nomogram combining three-mRNA status risk score, pathological T stage and pathological stage

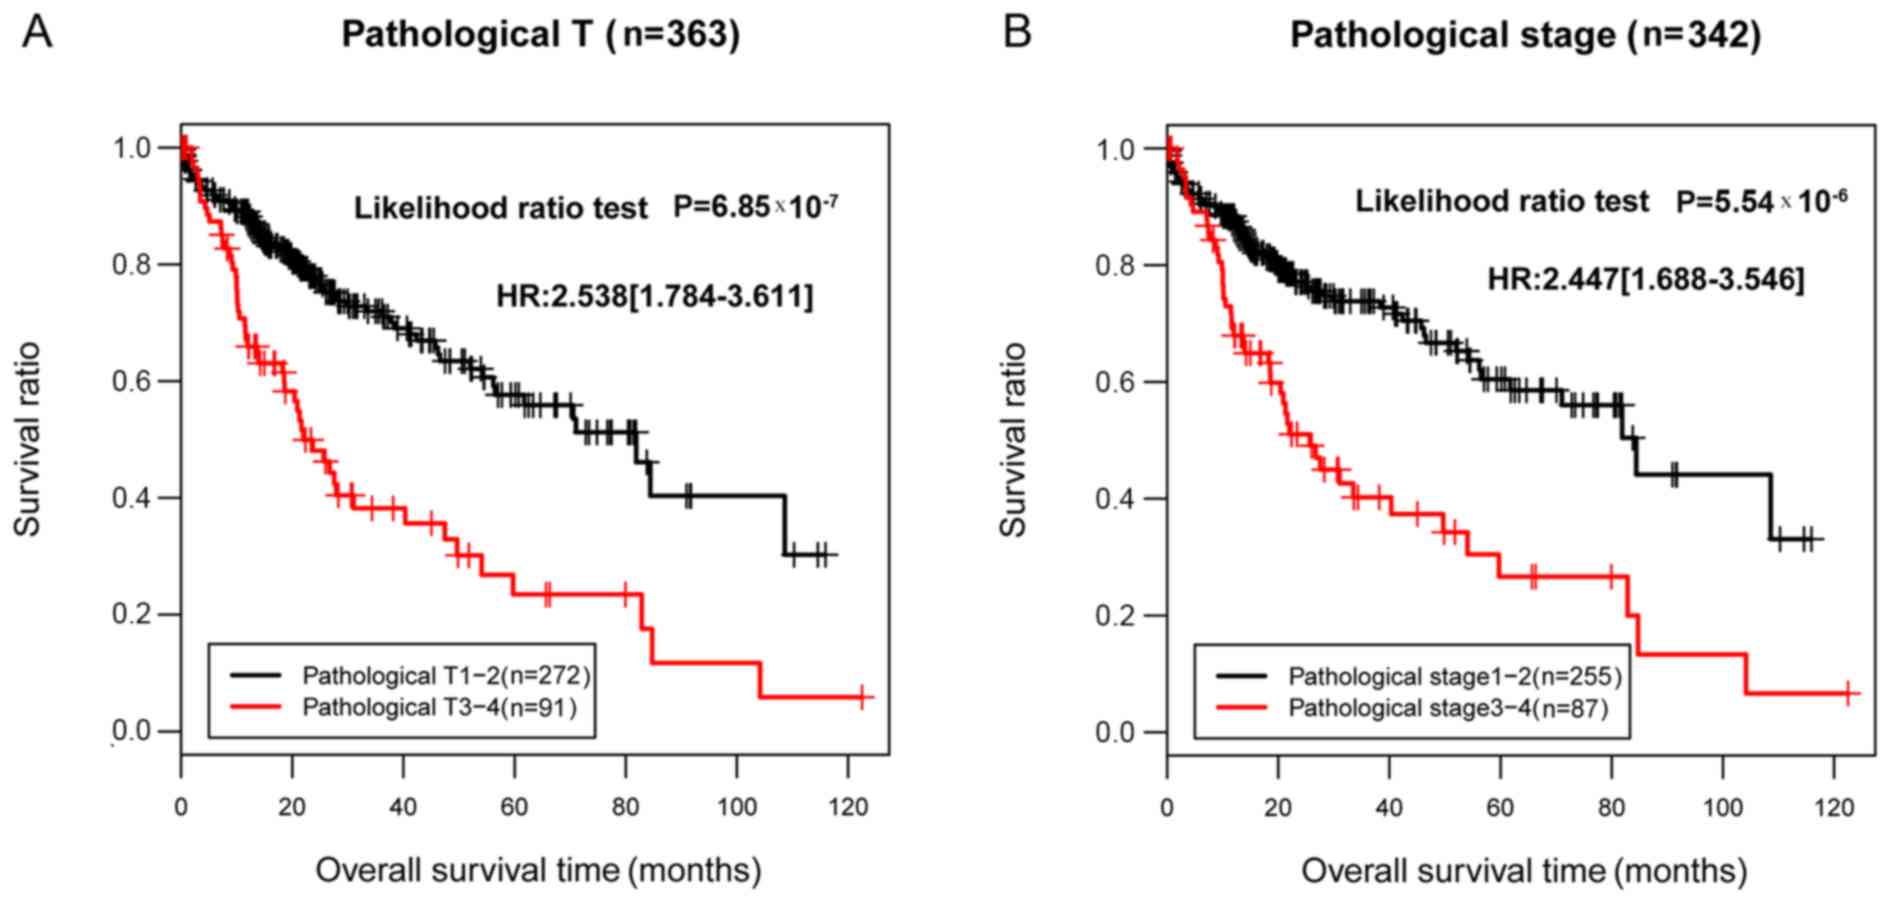
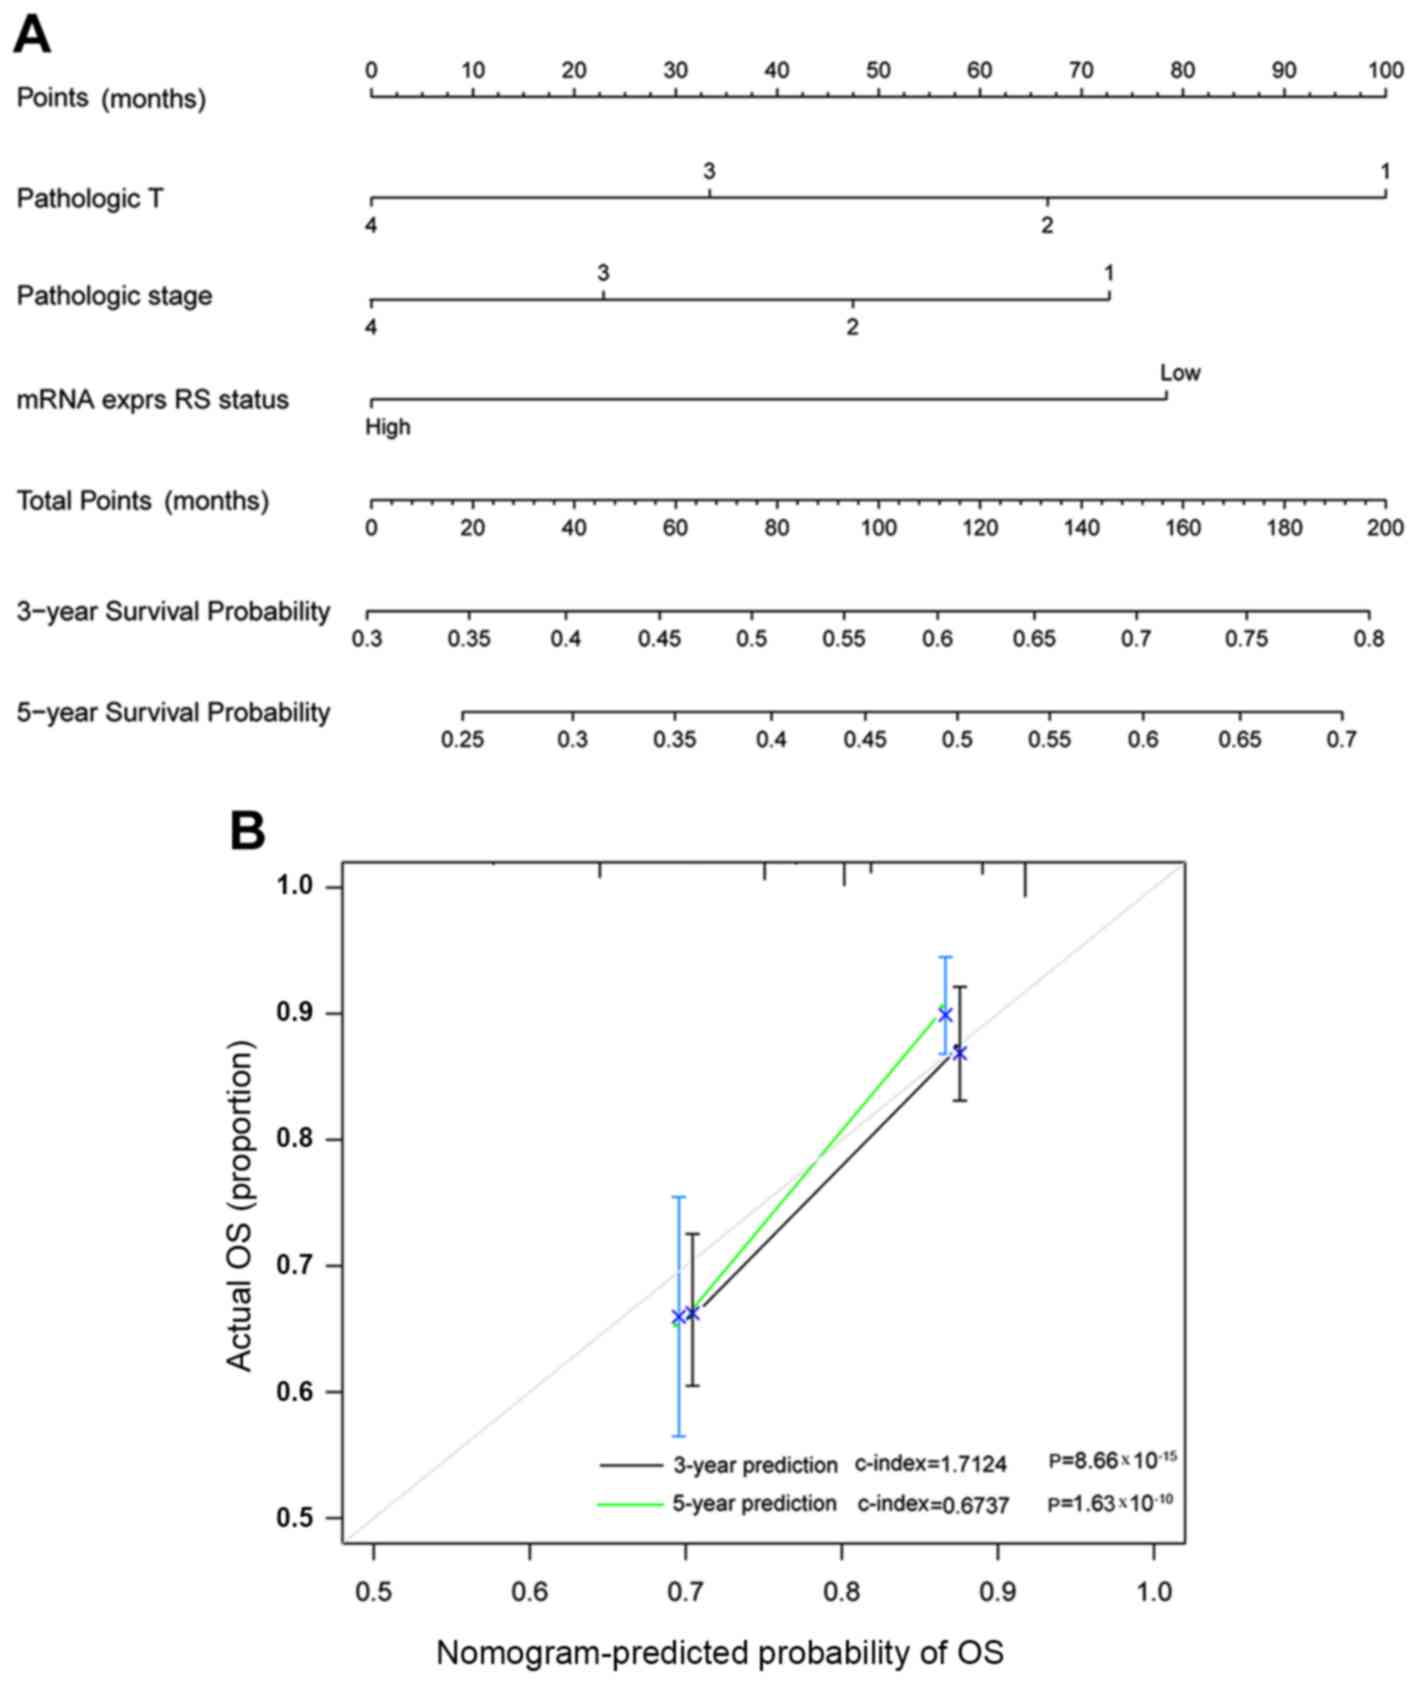
Univariate Cox regression analysis was performed to select the prognostic clinical factors. Pathological T stage, pathological stage and the three-mRNA status risk score were determined to be significantly associated with OS (P<0.05; Table III). As presented in Fig. 4, patients with HCC in TCGA dataset were successfully divided by pathological T stage (P<0.001) or pathological stage (P<0.001) into two groups with significantly different OS rates, respectively. To improve the predictive power of the three-mRNA status risk score, a nomogram based on the three-mRNA status risk score, pathological T stage and pathological stage was developed (Fig. 5A). Calibration plots demonstrated that good concordance was achieved between the predicted and actual 3- and 5-year OS probabilities (Fig. 5B).

Table III.

Identification of prognostic clinical factors in TCGA set.

Table III.

Identification of prognostic clinical factors in TCGA set.

Univariate Cox analysis

Clinical characteristicTCGA set (n=366)HR (95% CI)P-value
Age, years (mean ± SD)59.66±13.341.012 (0.999–1.026) P=7.90×10⁻²
Gender (Male/Female)247/1190.816 (0.573–1.164) P=2.62×10⁻¹
Pathologic M (M0/M1/-)263/3/1004.032 (0.267–12.83) P=1.06×10⁻¹
Pathologic N (N0/N1/-)248/4/1142.004 (0.491–8.181) P=3.83×10⁻¹
Pathologic T (T1/T2/T3/T4/-)180/92/78/13/31.675 (1.397–2.007) P<0.0001a
Pathologic stage (I/II/III/IV/-)170/85/83/4/241.661 (1.355–2.037) P<0.0001a
Histologic grade (G1/G2/G3/G4/-) 55/176/118/12/51.121 (0.887–1.416) P=3.39×10⁻¹
Vascular invasion (Yes/No/-)107/205/541.351 (0.892–2.047) P=1.54×10⁻¹
Recurrence (Yes/No/-)140/179/471.375 (0.914–2.068) P=1.25×10⁻¹
RS status (High/Low)183/1832.177 (1.524–3.110) P<0.0001a
Survival status (Dead/Alive)130/263
Overall survival time, months (mean ± SD)27.23±24.31

a P<0.05. HR, hazard ratio; CI, confidence index; TCGA, The Cancer Genome Atlas; RS, Risk score.

Functional annotation of the three-mRNA signature

To determine the functional roles of the three-mRNA signature in the biology of HCC, DEGs were identified between the high- and low-risk patient groups predicted by the three-mRNA status risk score in TCGA dataset. A total of 91 downregulated and 1,300 upregulated DEGs were identified. These DEGs were functionally enriched in GO biological processes associated with the cell cycle, cell proliferation and intracellular signaling cascades (Tables IV and V). In addition, five significant KEGG pathways were identified, including ‘cell cycle progression’, ‘DNA replication’, ‘cytokine-cytokine receptor interaction’, ‘progesterone-mediated oocyte maturation’ and ‘oocyte meiosis’ (Table IV).

Table IV.

Summary of significant GO biological processes and KEGG pathways for upregulated genes.

Table IV.

Summary of significant GO biological processes and KEGG pathways for upregulated genes.

CategoryTermn-valueP-valueFDRGenes
GOTERM_BP_DIRECTGO:0006260~DNA replication43 P=1.95×10⁻¹⁴ 7.41×10⁻¹¹CLSPN, BLM, DBF4, TIPIN, POLA1, CHEK1, POLA2, MCM10, CDT1, CDC45, POLE2, ORC6, EGF, ORC1, RTEL1, EXO1, RECQL4, CDC7, CDK1, CDC6, GINS2, CCDC88A, DTL, GINS3, GINS4, BRIP1, TREX1, MCM2, WRN, CDC25C, MCM4, BRCA1, CDC25A, RBBP8, MCM6, POLD3, DNA2, RFC4, POLD1, RRM2, CHAF1B, BARD1, DSCC1
GOTERM_BP_DIRECTGO:0051301~cell division67 P=2.18×10⁻¹³ 4.14×10⁻¹⁰CDK19, KIFC1, CDC14A, KNTC1, PTTG1, SPICE1, CCNE2, KIF2C, CCNE1, NDE1, CDCA8, OIP5, CCNA2, CDCA4, CDCA3, KIF2A, KIF14, ANAPC1, CDC7, CDK1, CDC6, ARHGEF2, KIF11, CCNF, TPX2, UBE2C, TACC3, NCAPD3, RBBP8, NCAPD2, CDK3, MAD2L1, SPAG5, ZWINT, BUB1B, FBXL7, UBE2S, HAUS6, NEK2, TIPIN, SPC25, NCAPH, NCAPG2, NCAPG, BUB1, FBXO5, SKA1, ZWILCH, HELLS, ERCC6L, PARD6B, PSRC1, CENPF, KIF18B, NDC80, CENPE, CDC20, BIRC5, CDC25C, SMC2, CENPJ, CDC25A, SMC4, CCNB1, CCNB2, KIF20B, CDK20
GOTERM_BP_DIRECTGO:0006270~DNA replication initiation18 P=5.76×10⁻¹² 7.28×10⁻⁹CDC7, CDC6, GINS4, POLA1, POLA2, MCM2, MCM10, MCM4, RPA4, MCM6, PRIM1, CCNE2, CCNE1, CDC45, POLE2, PRIM2, ORC6, ORC1
GOTERM_BP_DIRECTGO:0000082~G1/S transition of mitotic cell cycle31 P=1.08×10⁻¹¹ 1.03×10⁻⁸BCAT1, DBF4, POLA1, PKMYT1, POLA2, MCM10, RPA4, CDT1, CCNE2, PRIM1, CCNE1, TYMS, CDC45, CDKN2A, POLE2, PRIM2, FBXO5, ORC6, ORC1, CDC7, CDC6, CDK1, GPR132, MCM2, CDKN3, MCM4, CDC25A, RBBP8, CDK3, MCM6, RRM2
GOTERM_BP_DIRECTGO:0007067~mitotic nuclear division47 P=1.71×10⁻⁹ 1.30×10⁻⁶HAUS6, NEK2, TIPIN, KNTC1, PKMYT1, CEP55, AURKB, PTTG1, SPC25, KIF2C, NCAPG2, OIP5, INCENP, TTYH1, BUB1, FBXO5, SKA1, ZWILCH, CCNA2, ASPM, TUBB3, HELLS, CDCA3, ERCC6L, ANAPC1, CDK1, CDC6, ARHGEF2, KIF11, CCNF, KIF15, TPX2, CENPF, NDC80, CDC20, BIRC5, PBK, CDC25C, CDC25A, RBBP8, CDK3, CCNB2, PLK1, KIF20B, BUB1B, FBXL7, CIT
GOTERM_BP_DIRECTGO:0007062~sister chromatid cohesion28 P=1.99×10⁻⁹ 1.26×10⁻⁶KNTC1, AURKB, SPC25, KIF2C, CDCA8, NDE1, DDX11, CENPA, INCENP, BUB1, SKA1, ZWILCH, KIF2A, ERCC6L, CENPO, CENPM, CENPQ, KIF18A, CENPF, NDC80, BIRC5, CDC20, CENPE, CENPI, MAD2L1, PLK1, ZWINT, BUB1B
GOTERM_BP_DIRECTGO:0000731~DNA synthesis involved in DNA repair16 P=4.77×10⁻⁹ 2.59×10⁻⁶EXO1, XRCC3, RAD51AP1, XRCC2, BLM, POLA1, BRCA2, BRIP1, WRN, BRCA1, RAD51, RBBP8, POLD3, DNA2, POLD1, BARD1
GOTERM_BP_DIRECTGO:0000732~strand displacement14 P=4.99×10⁻⁹ 2.36×10⁻⁶EXO1, XRCC3, RAD51AP1, XRCC2, BLM, BRCA2, BRIP1, WRN, BRCA1, RAD51, RBBP8, DNA2, RTEL1, BARD1
GOTERM_BP_DIRECTGO:0006271~DNA strand elongation involved in DNA replication11 P=7.05×10⁻⁹ 2.97×10⁻⁶POLD3, GINS1, PRIM1, GINS2, RFC4, POLD1, GINS3, GINS4, PRIM2, POLA1, POLA2
GOTERM_BP_DIRECT GO:0051726~regulation of cell cycle30 P=8.79×10⁻⁹ 3.34×10⁻⁶CDK19, E2F2, E2F5, FOXM1, PRR11, PKMYT1, MYBL2, SRC, CCNE2, CCNE1, OVOL2, PLCB1, MX2, MAK, DTL, CCNF, L3MBTL1, RBL1, CENPF, CDC25C, MECOM, CDKL5, CDC25A, CDK3, CCNB1, TRIM36, CCNB2, CDKL1, PLK1, CDK20
GOTERM_BP_DIRECTGO:0000086~G2/M transition of mitotic cell cycle29 P=3.32×10⁻⁷ 1.14×10⁻⁶CEP72, HAUS6, NEK2, FOXM1, PKMYT1, CHEK1, HMMR, NDE1, CDKN2B, CEP250, CEP290, PLCB1, CDK1, CEP135, CEP192, TPX2, BIRC5, SFI1, CDC25C, CEP152, CENPJ, CDC25A, CCNB1, PLK4, CCNB2, PLK1, FBXL7, CIT, MELK
GOTERM_BP_DIRECTGO:0000070~mitotic sister chromatid segregation12 P=4.05×10⁻⁷ 1.28×10⁻⁴KIFC1, MAD2L1, CENPA, PLK1, NEK2, SPAG5, ZWINT, NUSAP1, KIF18B, NDC80, ESPL1, SMC4
GOTERM_BP_DIRECTGO:0000722~telomere maintenance via recombination13 P=9.64×10⁻⁷ 2.81×10⁻⁴POLD3, PRIM1, DNA2, XRCC3, RFC4, POLE2, POLD1, PRIM2, POLA1, BRCA2, POLA2, WRN, RAD51
GOTERM_BP_DIRECT GO:0007018~microtubule-based movement20 P=3.01×10⁻⁶ 8.15×10⁻⁴KIF14, KIF23, KIFC1, KIF4A, KIF24, KIF11, KIF5A, KIF15, KIF18A, KIF18B, CENPE, RACGAP1, KIF3C, KIF2C, DYNC2H1, KIF20B, KIF21B, KIF26B, KIF20A, KIF2A
GOTERM_BP_DIRECTGO:0043547~positive regulation of GTPase activity69 P=1.39×10⁻⁵ 3.52×10⁻³EZH2, BTC, ARHGAP22, TIAM2, GIT2, CSF2RB, ARHGAP11A, AGAP1, DOCK10, PLCB1, CSF2RA, ARHGEF2, ARHGEF18, GRIN2A, RAB3IL1, ARTN, SIPA1L3, DEPDC1, ECT2, CDKL5, ANKRD27, NCK2, PLCE1, SH2D3A, ARHGAP33, OPHN1, RIN1, SEMA4D, DENND3, RAPGEFL1, EPS8L1, SPTB, FGFR2, FGFR1, CSF2, RAP1GAP, CYTH4, ASAP1, KITLG, LLGL1, ADAP1, RASAL1, DOCK2, CCL20, GMIP, PLEKHG6, IL2RG, EGF, RASA3, RAP1GAP2, FGD6, IQSEC2, PIK3R2, OBSCN, IL2RA, ABR, VAV3, ARHGEF38, RGS17, RACGAP1, VAV1, RGS20, RGS1, CHML, RGS5, JAK3, XCL1, SH3BP1, ARAP2
GOTERM_BP_DIRECT GO:0000083~regulation of transcription involved in G1/S transition of mitotic cell cycle10 P=1.51×10⁻⁵ 3.57×10⁻³CCNE1, CDK1, CDC6, TYMS, CDC45, RRM2, POLA1, FBXO5, ORC1, CDT1
GOTERM_BP_DIRECTGO:0008283~cell proliferation49 P=3.00×10⁻⁵ 6.67×10⁻³BCAT1, STIL, CDK5R1, IL9R, CDC14A, E2F8, NR6A1, UCHL1, POLA1, KITLG, EHF, AURKB, FER, MCM10, TRAIP, SRC, TGFB2, GPC4, EDNRA, TYMS, KIF2C, BUB1, TGFA, BHLHE41, IL1A, OCA2, SYK, CDK1, IL2RA, MKI67, DLGAP5, KIF15, TPX2, SIX2, CENPF, ITGA2, TNFSF9, TACC3, CDC25C, CDC25A, CDK3, SH2D2A, PLCE1, S100B, PLK1, SIX1, BUB1B, FBXL7, MELK
GOTERM_BP_DIRECTGO:0032508~DNA duplex unwinding13 P=4.04×10⁻⁵ 8.49×10⁻³RECQL4, GINS1, GINS2, DNA2, CDC45, DDX11, BLM, GINS4, BRIP1, RAD54B, WRN, RTEL1, CHD3
GOTERM_BP_DIRECTGO:0007165~signal transduction119 P=4.66×10⁻⁵ 9.26×10⁻³IL9R, CRABP2, TLR1, TNFSF15, IL15, TLR6, ITPKA, ADORA1, CASP8AP2, UNC5B, ANK2, PDE4A, CHRNA5, CSF3R, IL1B, TYRO3, STK24, PIK3CD, LRRC1, DEPDC1, PDE4C, PLAUR, GABRR2, LILRB1, TNFAIP6, CCR6, IGSF1, LRP12, LILRB4, PDE5A, OPHN1, MST1R, CLEC5A, PTK7, OPN1SW, SOX9, SRC, RASAL1, VDR, NPHP4, IL12RB1, EGF, TRAF5, NPHP1, GABRE, ABR, GNRH1, SPHK1, CD300C, SALL2, RGS1, HIVEP3, XCL1, GRB7, CHRNG, GPR85, CLDN4, TAS2R4, RASSF8, PDCD1, SIRPB1, EDNRA, ARHGAP22, TNFRSF11A, PTGES, CSF2RB, MICAL1, CNTNAP1, ARHGAP11A, DLG5, PLCB1, LTA, MPP2, LIMK1, MPP3, ARTN, CDS1, SH2D2A, HUNK, DOK1, NCK2, TNFRSF10C, ACVR2B, ARHGAP33, CLIC3, ZDHHC13, RIN1, PDE9A, INPP4A, GNB3, RAP1GAP, CXCL5, GULP1, CTNND2, TNFRSF8, KITLG, SFN, TRAIP, IGF1R, CCL20, FCGR1A, DGKG, BCL11A, ARR3, IL2RG, SH2B2, DKKL1, RASA3, HPGDS, PIK3R2, EPO, TNFSF4, LRRN2, TNFSF9, RACGAP1, LRP8, SH3BP1, ARAP2, CHRNA10
GOTERM_BP_DIRECT GO:0001932~regulation of protein phosphorylation11 P=8.80×10⁻⁵ 1.65×10⁻²PHIP, CCDC88A, CCDC88C, ARR3, EZH2, CELSR3, FER, TLR7, KDM4D, TLR8, RAD51
GOTERM_BP_DIRECT GO:0007059~chromosome segregation15 P=2.62×10⁻⁴ 4.63×10⁻²KIF11, NEK2, CENPF, NDC80, CENPE, BRCA1, SPC25, NDE1, HJURP, SPAG5, OIP5, INCENP, SKA1, TOP2A, TOP3B
KEGG_PATHWAYhsa04110:Cell cycle38 P=2.06×10⁻¹⁴ 5.08×10⁻¹²E2F1, E2F2, E2F3, CDC14A, E2F5, DBF4, PKMYT1, TTK, CHEK1, SFN, PTTG1, TGFB2, CCNE2, CCNE1, CDC45, CDKN2A, CDKN2B, BUB1, ORC6, CCNA2, ORC1, CDC7, ANAPC1, CDK1, CDC6, RBL1, ESPL1, CDC20, MCM2, CDC25C, MCM4, CDC25A, MCM6, CCNB1, MAD2L1, CCNB2, PLK1, BUB1B
KEGG_PATHWAYhsa03030:DNA replication13 P=4.28×10⁻⁶ 5.26×10⁻⁴POLD3, PRIM1, DNA2, RFC4, POLE2, POLD1, PRIM2, POLA1, MCM2, POLA2, MCM4, RPA4, MCM6
KEGG_PATHWAYhsa03440:Homologous recombination11 P=1.95×10⁻⁵ 1.60×10⁻³POLD3, XRCC3, XRCC2, BLM, POLD1, BRCA2, RAD54B, RAD54L, RPA4, RAD51, TOP3B
KEGG_PATHWAY hsa04640:Hematopoietic cell lineage19 P=3.55×10⁻⁵ 2.18×10⁻³CSF2, IL9R, IL2RA, KITLG, ITGA2, CD1B, CD1A, ITGA3, ITGA4, ITGAM, FCGR1A, CD22, IL1B, CSF3R, CD24, IL1A, CSF2RA, EPO, CD7
KEGG_PATHWAY hsa04060:Cytokine-cytokine receptor interaction35 P=1.20×10⁻⁴ 5.87×10⁻³CSF2, IL9R, CXCL5, IL21R, TNFSF15, TNFRSF8, IL15, TGFB2, LIF, TNFRSF11A, IL12RB1, IL17B, CCL20, CLCF1, CCR10, CSF3R, CSF2RB, IL1B, IL2RG, LTA, CSF2RA, IL1A, EPO, TNFSF4, IL2RA, TNFSF9, CCR8, AMH, TNFRSF10C, ACVR2B, CCR6, IL20RA, IL12A, EDA, XCL1
KEGG_PATHWAYhsa05200:Pathways in cancer48 P=3.17×10⁻⁴ 1.29×10⁻²E2F1, FGFR2, E2F2, FGFR1, E2F3, ADCY7, MMP9, ARNT2, MITF, EGLN3, KITLG, LPAR2, BDKRB1, MMP1, TGFB2, GLI1, EDNRA, CCNE2, CCNE1, IGF1R, CDKN2A, CDKN2B, PAX8, SLC2A1, TGFA, CSF3R, EGF, PLCB1, TRAF5, CSF2RA, PIK3R2, CTBP2, PTGER4, MSH2, PIK3CD, CBL, FZD1, ITGA2, BRCA2, ITGA3, BIRC5, FZD2, MECOM, FZD7, RAD51, COL4A5, LAMC2, GNB3
KEGG_PATHWAY hsa04914:Progesterone-mediated oocyte maturation16 P=1.21×10⁻³ 4.19×10⁻²ANAPC1, CDK1, ADCY7, PIK3CD, PKMYT1, CDC25C, CDC25A, CCNB1, IGF1R, CCNB2, MAD2L1, PLK1, MAPK13, BUB1, CCNA2, PIK3R2

[i] GO, Gene Ontology; KEGG, Kyoto Encyclopedia of Genes and Genomes; FDR, false discovery rate.

Table V.

Summary of significant GO biological processes and KEGG pathways for down-regulated genes.

Table V.

Summary of significant GO biological processes and KEGG pathways for down-regulated genes.

CategoryTermn-valueP-valueFDRGenes
GOTERM_BP_DIRECT GO:0055114~oxidation-reduction process17 P=5.41×10⁻⁸ 3.79×10⁻⁵CYP3A4, STEAP4, CYP11A1, CYP1A1, AASS, CYP26A1, CYP1A2, CYP2E1, ACADL, RDH5, CYP3A43, CYP39A1, CYP4A22, CYP2A6, CYP2A7, SRD5A2, HPD
GOTERM_BP_DIRECT GO:0006805~xenobiotic metabolic process8 P=1.54×10⁻⁷ 5.38×10⁻⁵CYP3A4, GLYAT, NR1I2, SULT1B1, NAT2, CYP26A1, CYP2E1, CYP1A2
GOTERM_BP_DIRECT GO:0019373~epoxygenase P450 pathway5 P=1.95×10⁻⁶ 4.54×10⁻⁴CYP1A1, CYP2A6, CYP2A7, CYP2E1, CYP1A2
GOTERM_BP_DIRECTGO:0008202~steroid metabolic process6 P=2.74×10⁻⁶ 4.79×10⁻⁴CYP3A4, NR1I2, CYP1A1, SULT1B1, CYP2A6, CYP2E1
GOTERM_BP_DIRECTGO:0017144~drug metabolic process5 P=1.08×10⁻⁵ 1.51×10⁻³CYP3A4, CYP1A1, CYP2A6, CYP2E1, CYP1A2
GOTERM_BP_DIRECT GO:0042738~exogenous drug catabolic process4 P=2.86×10⁻⁵ 3.33×10⁻³CYP3A4, NR1I2, CYP2A6, CYP1A2
GOTERM_BP_DIRECTGO:0006706~steroid catabolic process3 P=2.63×10⁻⁴ 2.59×10⁻²CYP3A4, SRD5A2, CYP1A2
GOTERM_BP_DIRECTGO:0015721~bile acid and bile salt transport4 P=3.59×10⁻⁴ 3.09×10⁻²SLCO1B3, ABCB11, SLC27A5, SLC10A1
GOTERM_BP_DIRECT GO:0016098~monoterpenoid metabolic process3 P=3.93×10⁻⁴ 3.01×10⁻²CYP3A4, CYP2E1, CYP1A2
GOTERM_BP_DIRECT GO:0046483~heterocycle metabolic process3 P=3.93×10⁻⁴ 3.01×10⁻²CYP3A4, CYP2E1, CYP1A2
GOTERM_BP_DIRECT GO:0006810~transport9 P=4.42×10⁻⁴ 3.05×10⁻²ABCA8, AR, AQP9, ABCB11, SLC6A12, FABP4, SEC14L2, ABCB4, SLC10A1
GOTERM_BP_DIRECT GO:0042908~xenobiotic transport3 P=5.48×10⁻⁴ 3.43×10⁻²ABCA8, NR1I2, ABCB4
KEGG_PATHWAYhsa04976:Bile secretion7 P=1.61×10⁻⁵ 1.61×10⁻³SLCO1B3, AQP9, ABCB11, SLC27A5, SLC22A1, ABCB4, SLC10A1
KEGG_PATHWAYhsa05204:Chemical carcinogenesis7 P=3.78×10⁻⁵ 1.89×10⁻³CYP3A43, CYP3A4, CYP1A1, NAT2, CYP2A6, CYP2E1, CYP1A2
KEGG_PATHWAYhsa00140:Steroid hormone biosynthesis6 P=9.01×10⁻⁵ 3.00×10⁻³CYP3A4, CYP1A1, CYP11A1, CYP2E1, SRD5A2, CYP1A2
KEGG_PATHWAYhsa00830:Retinol metabolism6 P=1.45×10⁻⁴ 3.61×10⁻³CYP3A4, CYP1A1, CYP26A1, CYP2A6, CYP1A2, RDH5
KEGG_PATHWAYhsa00232:Caffeine metabolism3 P=6.18×10⁻⁴ 1.23×10⁻²NAT2, CYP2A6, CYP1A2
KEGG_PATHWAYhsa03320:PPAR signaling pathway5 P=1.93×10⁻³ 3.17×10⁻²FABP4, ACADL, SLC27A5, ACSL6, PCK1
KEGG_PATHWAYhsa00980:Metabolism of xenobiotics by cytochrome P4505 P=2.78×10⁻³ 3.90×10⁻²CYP3A4, CYP1A1, CYP2A6, CYP2E1, CYP1A2

[i] GO, Gene Ontology; KEGG, Kyoto Encyclopedia of Genes and Genomes; FDR, false discovery rate.

Discussion

HCC is a lethal cancer that accounts for 85–90% of primary liver cancers, with risk factors including hepatitis B or C infection, alcoholic liver disease and non-alcoholic fatty liver disease (25). Considerable efforts should be devoted to developing an effective stratification model for the prognosis of patients with HCC. The current study utilized a multi-step exploration and validation strategy to identify a three-mRNA and a five-lncRNA expression signatures. Consequently, three-mRNA and five-lncRNA expression and status risk scores were developed and compared for prognostic value. According to the likelihood ratio P-values and AUC, the three-mRNA status risk score was the optimal score for OS stratification of patients with HCC. In addition, the validation dataset confirmed the prognostic value of the three-mRNA status risk score for patients with HCC. To the best of our knowledge, the present study is the first to comparatively analyze mRNA and lncRNA signatures for predicting the mortality of patients with HCC. The results of the present study suggested that the three-mRNA status risk score may be an effective and robust risk stratification tool for HCC.

The identified three-mRNA expression signature comprised HAVCR1, MYCN and SFN. HAVCR1, also known as T-cell immunoglobulin and mucin domain (TIM)-1 or kidney injury molecule (KIM)-1, is a member of the TIM gene family, which participates in the regulation of immune cell activity and kidney regeneration (26). HAVCR1 has been demonstrated to serve a role in renal cell and ovarian clear cell carcinoma progression by reducing the expression of tight junction molecules (26). A recent study has reported that HAVCR1 is upregulated at the mRNA and protein levels in gastric cancer tissues and may be a prognostic biomarker for patients with gastric cancer (27). The MYCN gene encodes the N-myc proto-oncogene protein (c-Myc), which belongs to the MYC family of transcription factors and serves an oncogenic role in various types of tumors (28,29). c-Myc is overexpressed in the majority of HCC cases and may be a potential therapeutic target (30). Excessive activation of MYCN is observed in ~70% of HCC cases associated with human viruses and alcohol (31). In addition, MYCN may be a prognostic biomarker and a therapeutic target of acyclic retinoid in liver cancer stem cells in HCC (32). The SFN gene encodes stratifin, also known as 14-3-3σ protein; several 14-3-3σ isoforms are implicated in the progression of HCC through the regulation of cell proliferation, migration and epithelial-mesenchymal transition (33). Zhang et al (34) have reported that 14-3-3σ is upregulated in HCC and has prognostic value for HCC, which is in concordance with the results of the present study. Additionally, 14-3-3σ induced HCC cell migration and tumor progression by regulating the β-catenin/heat shock factor 1α/70 kDa heat shock protein pathway and may serve as a promising prognostic indicator (35). The three mRNAs may represent novel potential therapeutic targets for the treatment of HCC.

To determine the molecular mechanisms of action of the three prognostic mRNAs in the pathogenesis of HCC, GO function and KEGG pathway enrichment analyses were performed using the 1,391 DEGs identified between the two risk groups predicted by the three-mRNA status risk score in TCGA dataset. The results demonstrated that the three mRNAs were involved in various cell cycle-related biological processes, cytokine-cytokine receptor interaction pathways and two progesterone-associated pathways. Similarly, based on HCC microarray data, a recent study has demonstrated that cytokine-cytokine receptor interactions may involve a large number of differentially co-expressed genes (36). The incidence of HCC is higher in men compared with women (37), and sex hormones including progesterone may influence this statistic. Progesterone may also act as the precursor for androgens and estrogens, while the higher incidence in men compared with women may be attributable to the stimulatory effects of androgens and the inhibitory effects of estrogen (38). In addition, a number of studies have demonstrated that the hepatic androgen receptor promotes HCC development, whereas the estrogen receptor suppresses HCC progression (39,40). In hepatoma cells treated with epirubicin, progesterone increases apoptosis and inhibits autophagy by enhancing oxidative stress and upregulating the cell surface death receptor Fas/CD95 (41,42). Based on these results, it may be concluded that the three prognostic mRNAs in HCC identified in the present study may act through the modulation of these DEGs, which affect cell cycle progression, cytokine-cytokine receptor interaction and progesterone-associated pathways.

By conducting comprehensive bioinformatics analyses on existing microarray data from TCGA and EBI array repositories, the present study identified and validated a three-mRNA status risk score as the optimal score for predicting the prognosis of patients with HCC. The three-mRNA status risk score exhibited higher prognostic value compared with the lncRNA-based risk scores, and the prognosis of patients with HCC may be predicted with the median risk score calculated using the mRNA status-based risk score system as the cut-off value. The three mRNAs identified in the present study may be involved in the pathogenesis of HCC through effects on cell cycle progression and progesterone-associated pathways. Further study in larger patient cohorts is required to validate these findings.

Supplementary Material

Supporting Data
Supporting Data

Acknowledgements

Not applicable.

Funding

No funding was received.

Availability of data and materials

All the data used in the study were derived from public databases including TCGA (https://gdc-portal.nci.nih.gov/), EBI (https://www.ebi.ac.uk/arrayexpress/) and HGNC (http://www.genenames.org/).

Authors' contributions

WZ, QF and KY all contributed to data analysis and manuscript writing and revision. All authors read and approved the final version of the manuscript.

Ethics approval and consent to participate

Not applicable.

Patient consent for publication

Not applicable.

Competing interests

The authors declare that they have no competing interests.

References

1 

Siegel RL, Miller KD and Jemal A: Cancer statistics, 2017. CA Cancer J Clin. 67:7–30. 2017. View Article : Google Scholar : PubMed/NCBI

2 

Mittal S and El-Serag HB: Epidemiology of hepatocellular carcinoma: Consider the population. J Clin Gastroenterol. 47 (Suppl):S2–S6. 2013. View Article : Google Scholar : PubMed/NCBI

3 

Wallace MC, David P, Jeffrey GP and Adams LA: The evolving epidemiology of hepatocellular carcinoma: A global perspective. Expert Rev Gastroenterol Hepatol. 9:765–779. 2015. View Article : Google Scholar : PubMed/NCBI

4 

Yang Y, Chen L, Gu J, Zhang H, Yuan J, Lian Q, Lv G, Wang S, Wu Y, Yang YT, et al: Recurrently deregulated lncRNAs in hepatocellular carcinoma. Nat Commun. 8:144212017. View Article : Google Scholar : PubMed/NCBI

5 

Huo X, Han S, Wu G, Latchoumanin O, Zhou G, Hebbard L, George J and Qiao L: Dysregulated long noncoding RNAs (lncRNAs) in hepatocellular carcinoma: Implications for tumorigenesis, disease progression, and liver cancer stem cells. Mol Cancer. 16:1652017. View Article : Google Scholar : PubMed/NCBI

6 

Gu JX, Zhang X, Miao RC, Xiang XH, Fu YN, Zhang JY, Liu C and Qu K: Six-long non-coding RNA signature predicts recurrence-free survival in hepatocellular carcinoma. World J Gastroenterol. 25:220–232. 2019. View Article : Google Scholar : PubMed/NCBI

7 

Wang Z, Wu Q, Feng S, Zhao Y and Tao C: Identification of four prognostic LncRNAs for survival prediction of patients with hepatocellular carcinoma. PeerJ. 5:e3742017. View Article : Google Scholar

8 

Yan J, Zhou C, Guo K, Li Q and Wang Z: A novel seven-lncRNA signature for prognosis prediction in hepatocellular carcinoma. J Cell Biochem. 120:213–223. 2019. View Article : Google Scholar : PubMed/NCBI

9 

Li B, Feng W, Luo O, Xu T, Cao Y, Wu H, Yu D and Ding Y: Development and validation of a three-gene prognostic signature for patients with hepatocellular carcinoma. Sci Rep. 7:55172017. View Article : Google Scholar : PubMed/NCBI

10 

Shi YM, Li YY, Lin JY, Zheng L, Zhu YM and Huang J: The discovery of a novel eight-mRNA-lncRNA signature predicting survival of hepatocellular carcinoma patients. J Cell Biochem. 2018.(Online ahead of print).

11 

Tomczak K, Czerwińska P and Wiznerowicz M: The cancer genome Atlas (TCGA): An immeasurable source of knowledge. Contemp Oncol (Pozn). 19:A68–A77. 2015.PubMed/NCBI

12 

Kim SM, Leem SH, Chu IS, Park YY, Kim SC, Kim SB, Park ES, Lim JY, Heo J, Kim YJ, et al: Sixty-five gene-based risk score classifier predicts overall survival in hepatocellular carcinoma. Hepatology. 55:1443–1452. 2012. View Article : Google Scholar : PubMed/NCBI

13 

Chaudhary K, Poirion OB, Lu L and Garmire LX: Deep learning based multi-omics integration robustly predicts survival in liver cancer. Clin Cancer Res. 24:1248–1259. 2018. View Article : Google Scholar : PubMed/NCBI

14 

Li S, Chen X, Liu X, Yu Y, Pan H, Haak R, Schmidt J, Ziebolz D and Schmalz G: Complex integrated analysis of lncRNAs-miRNAs-mRNAs in oral squamous cell carcinoma. Oral Oncol. 73:1–9. 2017. View Article : Google Scholar : PubMed/NCBI

15 

Liu JY, Yao J, Li XM, Song YC, Wang XQ, Li YJ, Yan B and Jiang Q: Pathogenic role of lncRNA-MALAT1 in endothelial cell dysfunction in diabetes mellitus. Cell Death Dis. 5:e15062014. View Article : Google Scholar : PubMed/NCBI

16 

Wang P, Wang Y, Hang B, Zou X and Mao JH: A novel gene expression-based prognostic scoring system to predict survival in gastric cancer. Oncotarget. 7:55343–55351. 2016. View Article : Google Scholar : PubMed/NCBI

17 

Goeman JJ: L1 penalized estimation in the Cox proportional hazards model. Biom J. 52:70–84. 2010.PubMed/NCBI

18 

Anevski D: Functional central limit theorems for the Nelson-Aalen and Kaplan-Meier estimators for dependent stationary data. Statistics Probability Lett. 124:83–91. 2017. View Article : Google Scholar

19 

Zhi S, Liu Y, Li Z and Zhang J: A weighted likelihood ratio test-based chart for monitoring process mean and variability. J Statistical Computation Simulation. 88:1–22. 2018.

20 

Obuchowski NA and Bullen JA: Receiver operating characteristic (ROC) curves: Review of methods with applications in diagnostic medicine. Phy Med Biol. 63:07TR012018. View Article : Google Scholar

21 

Khaksar E, Askarishahi M, Hekmatimoghaddam S and Vahedian-Ardakani H: Cox regression and parametric models comparison of how they determine factors influencing survival of patients with non-small cell lung carcinoma. Asian Pac J Cancer Prev. 18:3389–3393. 2017.PubMed/NCBI

22 

Eng KH, Emily S and Kayla M: On representing the prognostic value of continuous gene expression biomarkers with the restricted mean survival curve. Oncotarget. 6:36308–36318. 2015. View Article : Google Scholar : PubMed/NCBI

23 

Wu J, Zhou L, Huang L, Gu J, Li S, Liu B, Feng J and Zhou Y: Nomogram integrating gene expression signatures with clinicopathological features to predict survival in operable NSCLC: A pooled analysis of 2164 patients. J Exp Clin Cancer Res. 36:42017. View Article : Google Scholar : PubMed/NCBI

24 

Huang G, Zhao G, Xia J, Wei Y, Chen F, Chen J and Shi J: FGF2 and FAM201A affect the development of osteonecrosis of the femoral head after femoral neck fracture. Gene. 652:39–47. 2018. View Article : Google Scholar : PubMed/NCBI

25 

Balogh J, Victor D III, Asham EH, Burroughs SG, Boktour M, Saharia A, Li X, Ghobrial RM and Monsour HP Jr: Hepatocellular carcinoma: A review. J Hepatocell Carcinoma. 3:41–53. 2016. View Article : Google Scholar : PubMed/NCBI

26 

Telford EJ, Jiang WG and Martin TA: HAVcR-1 involvement in cancer progression. Histol Histopathol. 32:121–128. 2017.PubMed/NCBI

27 

Liu L, Song Z, Zhao Y, Li C, Wei H, Ma J and Du Y: HAVCR1 expression might be a novel prognostic factor for gastric cancer. PLoS One. 13:e02064232018. View Article : Google Scholar : PubMed/NCBI

28 

Lee JK, Phillips JW, Smith BA, Park JW, Stoyanova T, McCaffrey EF, Baertsch R, Sokolov A, Meyerowitz JG, Mathis C, et al: N-myc drives neuroendocrine prostate cancer initiated from human prostate epithelial cells. Cancer Cell. 29:536–547. 2016. View Article : Google Scholar : PubMed/NCBI

29 

Rickman DS, Schulte JH and Eilers M: The expanding world of N-MYC-driven tumors. Cancer Discov. 8:150–163. 2018. View Article : Google Scholar : PubMed/NCBI

30 

Lin CP, Liu CR, Lee CN, Chan TS and Liu HE: Targeting c-Myc as a novel approach for hepatocellular carcinoma. World J Hepatol. 2:16–20. 2010. View Article : Google Scholar : PubMed/NCBI

31 

Schlaeger C, Longerich T, Schiller C, Bewerunge P, Mehrabi A, Toedt G, Kleeff J, Ehemann V, Eils R, Lichter P and Bernhard PS: Etiology-dependent molecular mechanisms in human hepatocarcinogenesis. Hepatology. 47:511–520. 2008. View Article : Google Scholar : PubMed/NCBI

32 

Qin XY, Suzuki H, Honda M, Okada H, Kaneko S, Inoue I, Ebisui E, Hashimoto K, Carninci P, Kanki K, et al: Prevention of hepatocellular carcinoma by targeting MYCN-positive liver cancer stem cells with acyclic retinoid. Proc Natl Acad Sci USA. 115:4969–4974. 2018. View Article : Google Scholar : PubMed/NCBI

33 

Wu YJ, Jan YJ, Ko BS, Liang SM and Liou JY: Involvement of 14-3-3 proteins in regulating tumor progression of hepatocellular carcinoma. Cancers (Basel). 7:1022–1036. 2015. View Article : Google Scholar : PubMed/NCBI

34 

Zhang Y, Li Y, Lin C, Ding J, Liao G and Tang B: Aberrant upregulation of 14-3-3σ and EZH2 expression serves as an inferior prognostic biomarker for hepatocellular carcinoma. PLoS One. 9:e1072512014. View Article : Google Scholar : PubMed/NCBI

35 

Liu CC, Jan YJ, Ko BS, Wu YM, Liang SM, Chen SC, Lee YM, Liu TA, Chang TC, Wang J, et al: 14-3-3σ induces heat shock protein 70 expression in hepatocellular carcinoma. BMC Cancer. 14:4252014. View Article : Google Scholar : PubMed/NCBI

36 

Wang Y, Jiang T, Li Z, Lu L, Zhang R, Zhang D, Wang X and Tan J: Analysis of differentially co-expressed genes based on microarray data of hepatocellular carcinoma. Neoplasma. 64:216–221. 2017. View Article : Google Scholar : PubMed/NCBI

37 

Hainaut P, Amadou A and Gormally E: Cancer prevention and control: Hepatocellular carcinoma. Ecancermedicalscience. 13:9492019. View Article : Google Scholar : PubMed/NCBI

38 

Yeh YT, Chang CW, Wei RJ and Wang SN: Progesterone and related compounds in hepatocellular carcinoma: Basic and clinical aspects. Biomed Res Int. 2013:2905752013. View Article : Google Scholar : PubMed/NCBI

39 

Ma WL, Hsu CL, Yeh CC, Wu MH, Huang CK, Jeng LB, Hung YC, Lin TY, Yeh S and Chang C: Hepatic androgen receptor suppresses hepatocellular carcinoma metastasis through modulation of cell migration and anoikis. Hepatology. 56:176–185. 2012. View Article : Google Scholar : PubMed/NCBI

40 

Keng VW, Largaespada DA and Augusto V: Why men are at higher risk for hepatocellular carcinoma? J Hepatol. 57:453–454. 2012. View Article : Google Scholar : PubMed/NCBI

41 

Chang WT, Hsieh BS, Cheng HL, Lee KT and Chang KL: Progesterone augments epirubicin-induced apoptosis in HA22T/VGH cells by increasing oxidative stress and upregulating Fas/FasL. J Surg Res. 188:432–441. 2014. View Article : Google Scholar : PubMed/NCBI

42 

Chang WT, Cheng HL, Hsieh BS, Chiu CC, Lee KT and Chang KL: Progesterone increases apoptosis and inversely decreases autophagy in human hepatoma HA22T/VGH cells treated with epirubicin. ScientificWorldJournal. 2014:5671482014. View Article : Google Scholar : PubMed/NCBI

Related Articles

Journal Cover

October-2020
Volume 20 Issue 4

Print ISSN: 1792-1074
Online ISSN:1792-1082

Sign up for eToc alerts

Recommend to Library

Copy and paste a formatted citation
x
Spandidos Publications style
Zhang W, Fu Q and Yao K: A three‑mRNA status risk score has greater predictive ability compared with a lncRNA‑based risk score for predicting prognosis in patients with hepatocellular carcinoma. Oncol Lett 20: 48, 2020
APA
Zhang, W., Fu, Q., & Yao, K. (2020). A three‑mRNA status risk score has greater predictive ability compared with a lncRNA‑based risk score for predicting prognosis in patients with hepatocellular carcinoma. Oncology Letters, 20, 48. https://doi.org/10.3892/ol.2020.11911
MLA
Zhang, W., Fu, Q., Yao, K."A three‑mRNA status risk score has greater predictive ability compared with a lncRNA‑based risk score for predicting prognosis in patients with hepatocellular carcinoma". Oncology Letters 20.4 (2020): 48.
Chicago
Zhang, W., Fu, Q., Yao, K."A three‑mRNA status risk score has greater predictive ability compared with a lncRNA‑based risk score for predicting prognosis in patients with hepatocellular carcinoma". Oncology Letters 20, no. 4 (2020): 48. https://doi.org/10.3892/ol.2020.11911