Introduction
Gliomas are the most common type of primary central
nervous system tumor and intracranial malignant tumor, accounting
for ~81% of all malignant brain tumors (1). Alkylglycerone phosphate synthase (AGPS)
is an important enzyme for ether ester synthesis and it has been
discovered to serve an important role in the pathogenicity of
cancer cells (2). It was previously
reported that the overexpression of AGPS increased the survival,
migratory, proliferative and invasive abilities of tumor cells,
including SKOV3 ovarian cancer, 231MFP breast cancer, C8161
melanoma, PC3 prostate cancer and primary breast cancer cells
(3,4). Furthermore, the levels of tumor-related
lipids, including ether lipids, prostaglandins and acyl
phosphatides, were discovered to decrease following the
inactivation of AGPS, resulting in a decrease in the cancer
pathogenicity (5,6). In addition, our previous study revealed
a positive correlation between AGPS and the malignant potential of
gliomas (7). Therefore, it was
hypothesized that the overexpression of AGPS may be an important
mechanism for the aggravation of gliomas.
The present study analyzed changes in the expression
profiles of long non-coding RNAs (lncRNAs) and co-expressed mRNAs
in glioma. lncRNAs are RNAs of >200 nucleotides in length, which
have no protein-coding ability due to the lack of a complete open
reading frame (8). lncRNAs have been
identified to regulate gene expression via a variety of biological
processes, demonstrating important roles in the apoptosis,
proliferation, invasion and metastasis of cells (9). Moreover, mRNAs encode the genetic
information for their corresponding protein (10). In the present study, the full-length
sequence expression data for glioma cells was obtained using gene
chip technology, and lncRNA and mRNA expression profiles from
glioma cells were analyzed. In addition, their functions were
predicted using bioinformatical methods, which provided a
theoretical basis for studying the molecular mechanisms of the
AGPS-induced malignancy, migration and invasiveness of glioma.
Materials and methods
Cell culture and AGPS short hairpin
(sh)RNA lentivirus infection
U251 cells were obtained from the Cell Resource
Center of the Chinese Academy of Medical Sciences. Cells were
cultured in RPMI-1640 medium (Corning Life Sciences), supplemented
with 10% FBS (Corning Life Sciences), and maintained in a
CO2-controlled incubator at a constant temperature of
37°C.
For transfection, 2×10⁵ U251 cells were
plated into a six-well plate with 2 ml medium/well the day before
transfection and cultured at 37°C for 24 h to reach 60–80%
confluence on the second day. AGPS shRNA lentiviral particles
(shR-AGPS-1 and −2 groups; Santa Cruz Biotechnology, Inc.) or empty
lentiviral particles used as a negative control (control group;
Santa Cruz Biotechnology, Inc.) stably integrated cell lines were
established following infection with 8 µg/ml lentiviruses of U251
cells using 5 µg/ml polybrene-containing RPMI-1640 medium. After
infecting the cells at 37°C for 24 h, the medium was replaced with
2 ml RPMI-1640 medium without polybrene, and the cells were further
incubated at 37°C for 72 h. Cell morphology was observed under an
inverted light microscope (magnification, ×100 and ×200).
Monoclonal cell selection
Following infection and further cell culture for 72
h, 1 mg/ml puromycin (5 µl; Beyotime Institute of Biotechnology)
was added in the RPMI-1640 medium to the cells at 80% confluence.
The RPMI-1640 medium with puromycin was refreshed every 3 days for
12 days. The cells in each group were separately diluted in
RPMI-1640 medium via serial dilution to produce a single cell
suspension with a density of 1×10³ cells/ml, which were
subsequently plated into the first row of wells in a 96-well plate
at 0.2 ml/well. From those first wells, 0.1 ml cell solution was
inoculated into the second row and the process was then repeated
until the 8th row, with the goal of ultimately obtaining wells
containing single cells. Isolated cells were cultured at 37°C for 1
week in complete medium to obtain monoclonal cell lines.
Cell proliferation assay
In total, 3×10³ cells/well were seeded
into a 96-well plate and cultured at 37°C for 24, 48 and 72 h. Cell
proliferation was analyzed using a BrdU cell proliferation ELISA
kit (cat. no. ab126556; Abcam), according to the manufacturer's
protocol. Briefly, at each time point, 20 µl BrdU label was added
and incubated at 37°C for 12 h. Following the incubation, the cells
were fixed with 3.7% formaldehyde diluted in PBS at room
temperature for 30 min and then washed three times with PBS. Then,
100 µl anti-BrdU monoclonal detector antibody (1:2,000; supplied in
the BrdU cell proliferation kit) was incubated with the cells for 1
h at room temperature. Following the incubation, each well was
washed three times using PBS and 100 µl horseradish peroxidase
(HRP)-conjugated goat anti-mouse IgG antibody (1:2,000; supplied in
the BrdU cell proliferation kit) was added and incubated for 30 min
at room temperature. The wells were washed three times with PBS and
then, 100 µl 3,3,5′,5′-Tetramethyl benzidine peroxidase substrate
was added and incubated for 30 min at room temperature in the dark.
Finally, 100 µl stop solution (supplied in the BrdU cell
proliferation kit) was added and the optical density value was
measured every 24 h using the Multiskan™ Spectrum microplate
photometer (Thermo Fisher Scientific, Inc.) at 450 nm.
Western blotting
The selected stable U251 cell line (2×10⁵
cells/well) was plated into a six-well plate and after 24 h, total
protein was extracted using 300 µl/well RIPA lysis buffer (Beyotime
Institute of Biotechnology). Cells were gently agitated at 4°C for
30 min and then the cell lysate was transferred to a 1.5 ml
centrifuge tube for centrifugation at 10,000 × g for 10 min at 4°C.
Total protein was quantified using a bicinchoninic acid assay, and
50 µg protein/lane was separated via 10% SDS-PAGE. The separated
proteins were subsequently transferred onto a PVDF membrane and the
membrane was blocked with 5% milk at room temperature for 2 h. The
membrane was cut around the position of the protein according to
the molecular size and then it was incubated with an anti-AGPS
antibody (1:1,000; cat. no. sc-374201; Santa Cruz Biotechnology,
Inc.) or an anti-β-tubulin antibody (1:1,000; cat. no. SRP01044;
Saierbio, LLC) at 4°C overnight. Following the primary antibody
incubation, the membranes were washed 4 times for 5 min each with
TBS-Tween (TBST; 0.5% Tween 20) solution and incubated with a
HRP-conjugated goat anti-mouse IgG antibody (1:1,000; cat. no.
SRPGAM001; Saierbio, LLC) or an HRP-conjugated goat anti-rabbit IgG
antibody (1:1,000; cat. no. SRPGAR001; Saierbio, LLC) at room
temperature for 1.5 h. The membranes were then washed and shaken in
TBST solution 4 times for 5 min each. Total protein was visualized
using a Western Lightning™ chemiluminescent agent (PerkinElmer,
Inc.). The protein expression levels were analyzed using ImageJ
Software v1.52 (National Institutes of Health) and the gray value
for the AGPS band in each sample was normalized to the
corresponding β-tubulin band. The control group was set at a
standard value of 1 and a histogram was generated to compare all
groups.
Screening to identify differentially
expressed lncRNAs and co-expressed mRNAs
Total RNA was extracted from cells using the
RNAeasy™ Animal RNA Isolation kit according to the
manufacturer's protocol (Beyotime Institute of Biotechnology), and
the QuantiTect Whole Transcriptome kit (Qiagen China Co., Ltd.) was
used for library construction and amplification according to the
manufacturer's protocol. The GeneChip Scanner 3000 System
(Affymetrix; Thermo Fisher Scientific, Inc.) was used to detect the
expression levels of lncRNA and the profile of co-expressed mRNAs
using the Affymetrix Clariom D array in each group of cells. The
control group and the two experimental groups were compared to
screen differentially expressed lncRNAs and co-expressed mRNAs. The
screening was analyzed using the free online platform OmicShare
tools (www.omicshare.com/tools), and the
criteria were fold-change (|FC|)>1.2, P<0.05 and a false
discovery rate <0.05.
Reverse transcription-quantitative PCR
(RT-qPCR)
Total RNA was extracted from cells using QIAzol
reagent (Qiagen, Inc.) and reverse transcribed at 50°C for 15 min
using the BeyoFast™ Probe One-Step qRT-PCR kit (Beyotime Institute
of Biotechnology), according to the manufacturer's protocol. To
determine the expression levels of mRNAs, qPCR was subsequently
performed using SYBR Green I dye (Takara Biotechnology Co., Ltd.)
on a 7500 Real-Time PCR system (Applied Biosystems; Thermo Fisher
Scientific, Inc.). The sequences of the primers used for the qPCR
are listed in Table I. The following
thermocycling conditions were used for the qPCR: Initial
denaturation at 95°C for 10 min, followed by 40 cycles at 95°C for
15 sec and 60°C for 60 sec, and a final extension step at 72°C for
5 min. The expression levels of mRNAs were quantified using the
2−ΔΔCq method (11) and
normalized to the internal loading control β-actin.
 | Table I.Primer sequences used for the reverse
transcription-quantitative PCR. |
Table I.
Primer sequences used for the reverse
transcription-quantitative PCR.
| Gene | Primer sequence
(5′→3′) |
|---|
| COL1A2 | F:
GTGCGATGACGTGATCTGTGA |
|
| R:
GTTTCTTGGTCGGTGGGTG |
| COL6A3 | F:
TCTGTTCCTCTTTGACGGCT |
|
| R:
CCACCTTGACATCATCGCTG |
| THBS1 | F:
GCTCCAGCTCTACCAATGTCCT |
|
| R:
TTGTGGCCGATGTAGTTAGTGC |
| FN1 | F:
CAGTGGGAGACCTCGAGAA |
|
| R:
TCCCTCGGAACATCAGAAAC |
| SPP1 | F:
TTCTCAGCCAAACGCCGA |
|
| R:
GGTAGGTACATCTTTAGTGCTGCTT |
| ITGA11 | F:
GTATTTGTAGGTTTTTTTGGATTGATTGT |
|
| R:
ATCCCTATTTAAAATACACACAAAAATTTC |
| VEGFA | F:
GAGGGCAGAATCATCACGAAG |
|
| R:
TGTGCTGTAGGAAGCTCATCTCTC |
| IGF1R | F:
GTGGAGACAGGGGCTTTTATT |
|
| R:
CTCCAGCCTCCTTAGATCACA |
| EGFR | F:
CCTATGTGCAGAGGAATTATGATCTTT |
|
| R:
CCACTGTGTTGAGGGCAAT |
| TLN2 | F:
CTGAGGCTCTTTTCACAGCA |
|
| R:
CTCATCTCATCTGCCAAGCA |
| PXN | F:
GCCCCTCTCAGAGCCTTTTC |
|
| R:
GCAGCTACTGAGGTCACAGC |
| AKT3 | F:
CCACAGGTCGCTACTATGCC |
|
| R:
ACAGCCCGAAGTCCGTTATC |
| PIK3CA | F:
CATCATTTGCTCCAAACTGACCA |
|
| R:
CCTATGCAATCGGTCTTTGCC |
| JUN | F:
AAGTGAAAACCTTGAAAGCTCAG |
|
| R:
TTAACGTGGTTCATGACTTTCTG |
| SHC3 | F:
AAAAAGCTTATGAGTGCCACCAGGAAGAGCCGG |
|
| R:
TTGGATCCCGGGGTTTCCTCTCCACTGGTT |
| FGF2 | F:
GAGAAGAGCGACCCTCACA |
|
| R:
TAGCTTTCTGCCCAGGTCC |
| ANGPT2 | F:
ACAGCAGAATGCAGTACAGAACCAGACG |
|
| R:
CAAGTCTCGTGGTCTGATTTAATACTTGGGCT |
| CSF3 | F:
CTGCTCTAGTGGACACACAAATG |
|
| R:
TTTCTCCGGACTAGGCTTTG |
| IL7R | F:
AACCCCGTCTCCACTGAAAA |
|
| R:
GAGTCTTGCTTTGTTGCCCA |
| PRKAA2 | F:
GAAGATCGGACACTACGTGCT |
|
| R:
AACTGCCACTTTATGGCCTG |
| DDIT4 | F:
GGACCAAGTGTGTTTGTTGTTTG |
|
| R:
CACCCACCCCTTCCTACTCTT |
| HSP90B1 | F:
AAATCATTTTCAAAGGAAAGTGATGACCC |
|
| R:
CATCAAACAGACCACGTGGAGGAG |
| CREB5 | F:
ATTGACTCACCACCCTGCTG |
|
| R:
GCATGAAGGTGGGAATGGGA |
| TLR3 | F:
GCTCTGGAAACACGCAAACC |
|
| R:
CTCGTCAAAGCCGTTGGACT |
| IL1B | F:
GGACAGGATATGGAGCAACAAGTGG |
|
| R:
TTCAACACGCAGGACAGGTACAGAT |
| CXCL8 | F:
TCAGAGACAGCAGAGCACAC |
|
| R:
ACACAGTGAGATGGTTCCTTCC |
| PTGS2 | F:
ATTGTACCCGGACAGGATTCTATG |
|
| R:
TTTGGAGTGGGTTTCAGAAATAATT |
| SDC4 | F:
ACCAGACGATGAGGATGTAGTG |
|
| R:
AAGGGATGGACAACTTCAGGG |
| β-actin | F:
CTACAATGAGCTGCGTGTG |
|
| R:
AAGGAAGGCTGGAAGAGTGC |
Functional prediction of lncRNA and
mRNA co-expression
The mRNAs co-expressed with the lncRNAs were
subjected to functional term enrichment analysis using the Gene
Ontology (GO) resource (http://geneontology.org), functional annotation of the
differentially expressed genes and Venn diagrams were performed
using free online platform OmicShare tools (www.omicshare.com/tools). Signaling pathway enrichment
analysis was also performed on the co-expressed mRNAs using the
Kyoto Encyclopedia of Genes and Genomes (KEGG) database (www.genome.jp) and the signaling pathways associated
with the differentially expressed mRNAs were identified.
Subsequently, Degree values were calculated using the OmicShare
tools 3.0, and pathway networks and global signal transduction
networks of co-expressed lncRNAs and mRNAs in AGPS-silenced U251
cells were constructed using the OmicShare tools with more
connections there were, the higher the Degree. The differentially
co-expressed lncRNAs and mRNAs predicted by GO functional term for
biological process (BP) and KEGG signaling pathway enrichment
analysis were used to determine the function of the unknown
lncRNAs. The threshold of the Degree value was 1.
Statistical analysis
Statistical analysis was performed using SPSS
version 11 software (SPSS, Inc.). Statistical differences were
determined using a one-way ANOVA, followed by a Tukey's post hoc
test for multiple group comparisons. P<0.05 was considered to
indicate a statistically significant difference. A
log10(P-value)>2 was considered to indicate a significant
threshold for GO analysis.
Results
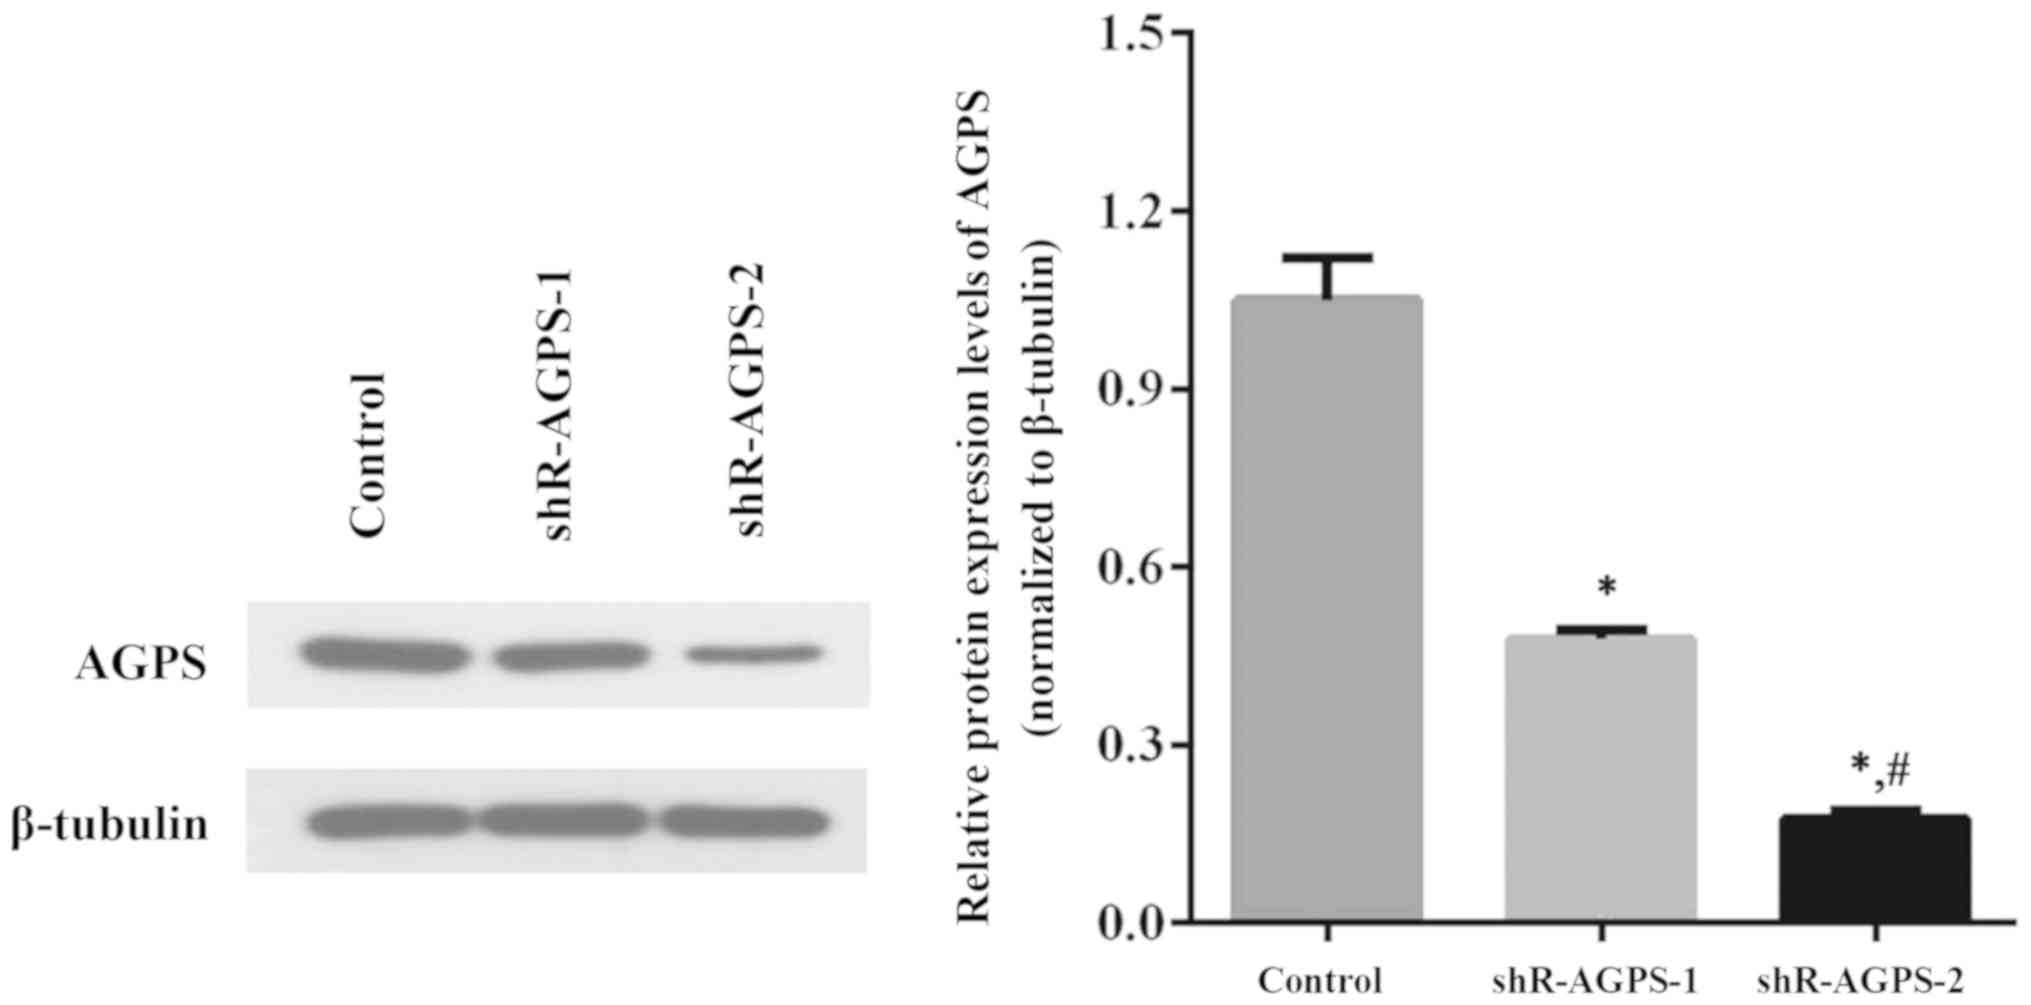
Effect of AGPS shRNA interference on
AGPS expression levels in U251 cells
Two shR-AGPS lentiviral plasmids were transfected
into U251 cells to construct stable AGPS-silenced U251 cell lines;
negative control lentiviruses transfected into U251 cells were used
as the control. In total, two groups (shR-AGPS-1 and shR-AGPS-2
group) of AGPS-silenced cell lines were established by monoclonal
selection, and the AGPS expression levels in these shR-AGPS-1 and
shR-AGPS-2 groups were significantly downregulated compared with
the control group (Fig. 1).
Furthermore, the expression levels of AGPS in the shR-AGPS-2 group
were significantly downregulated compared with the shR-AGPS-1 group
(Fig. 1).
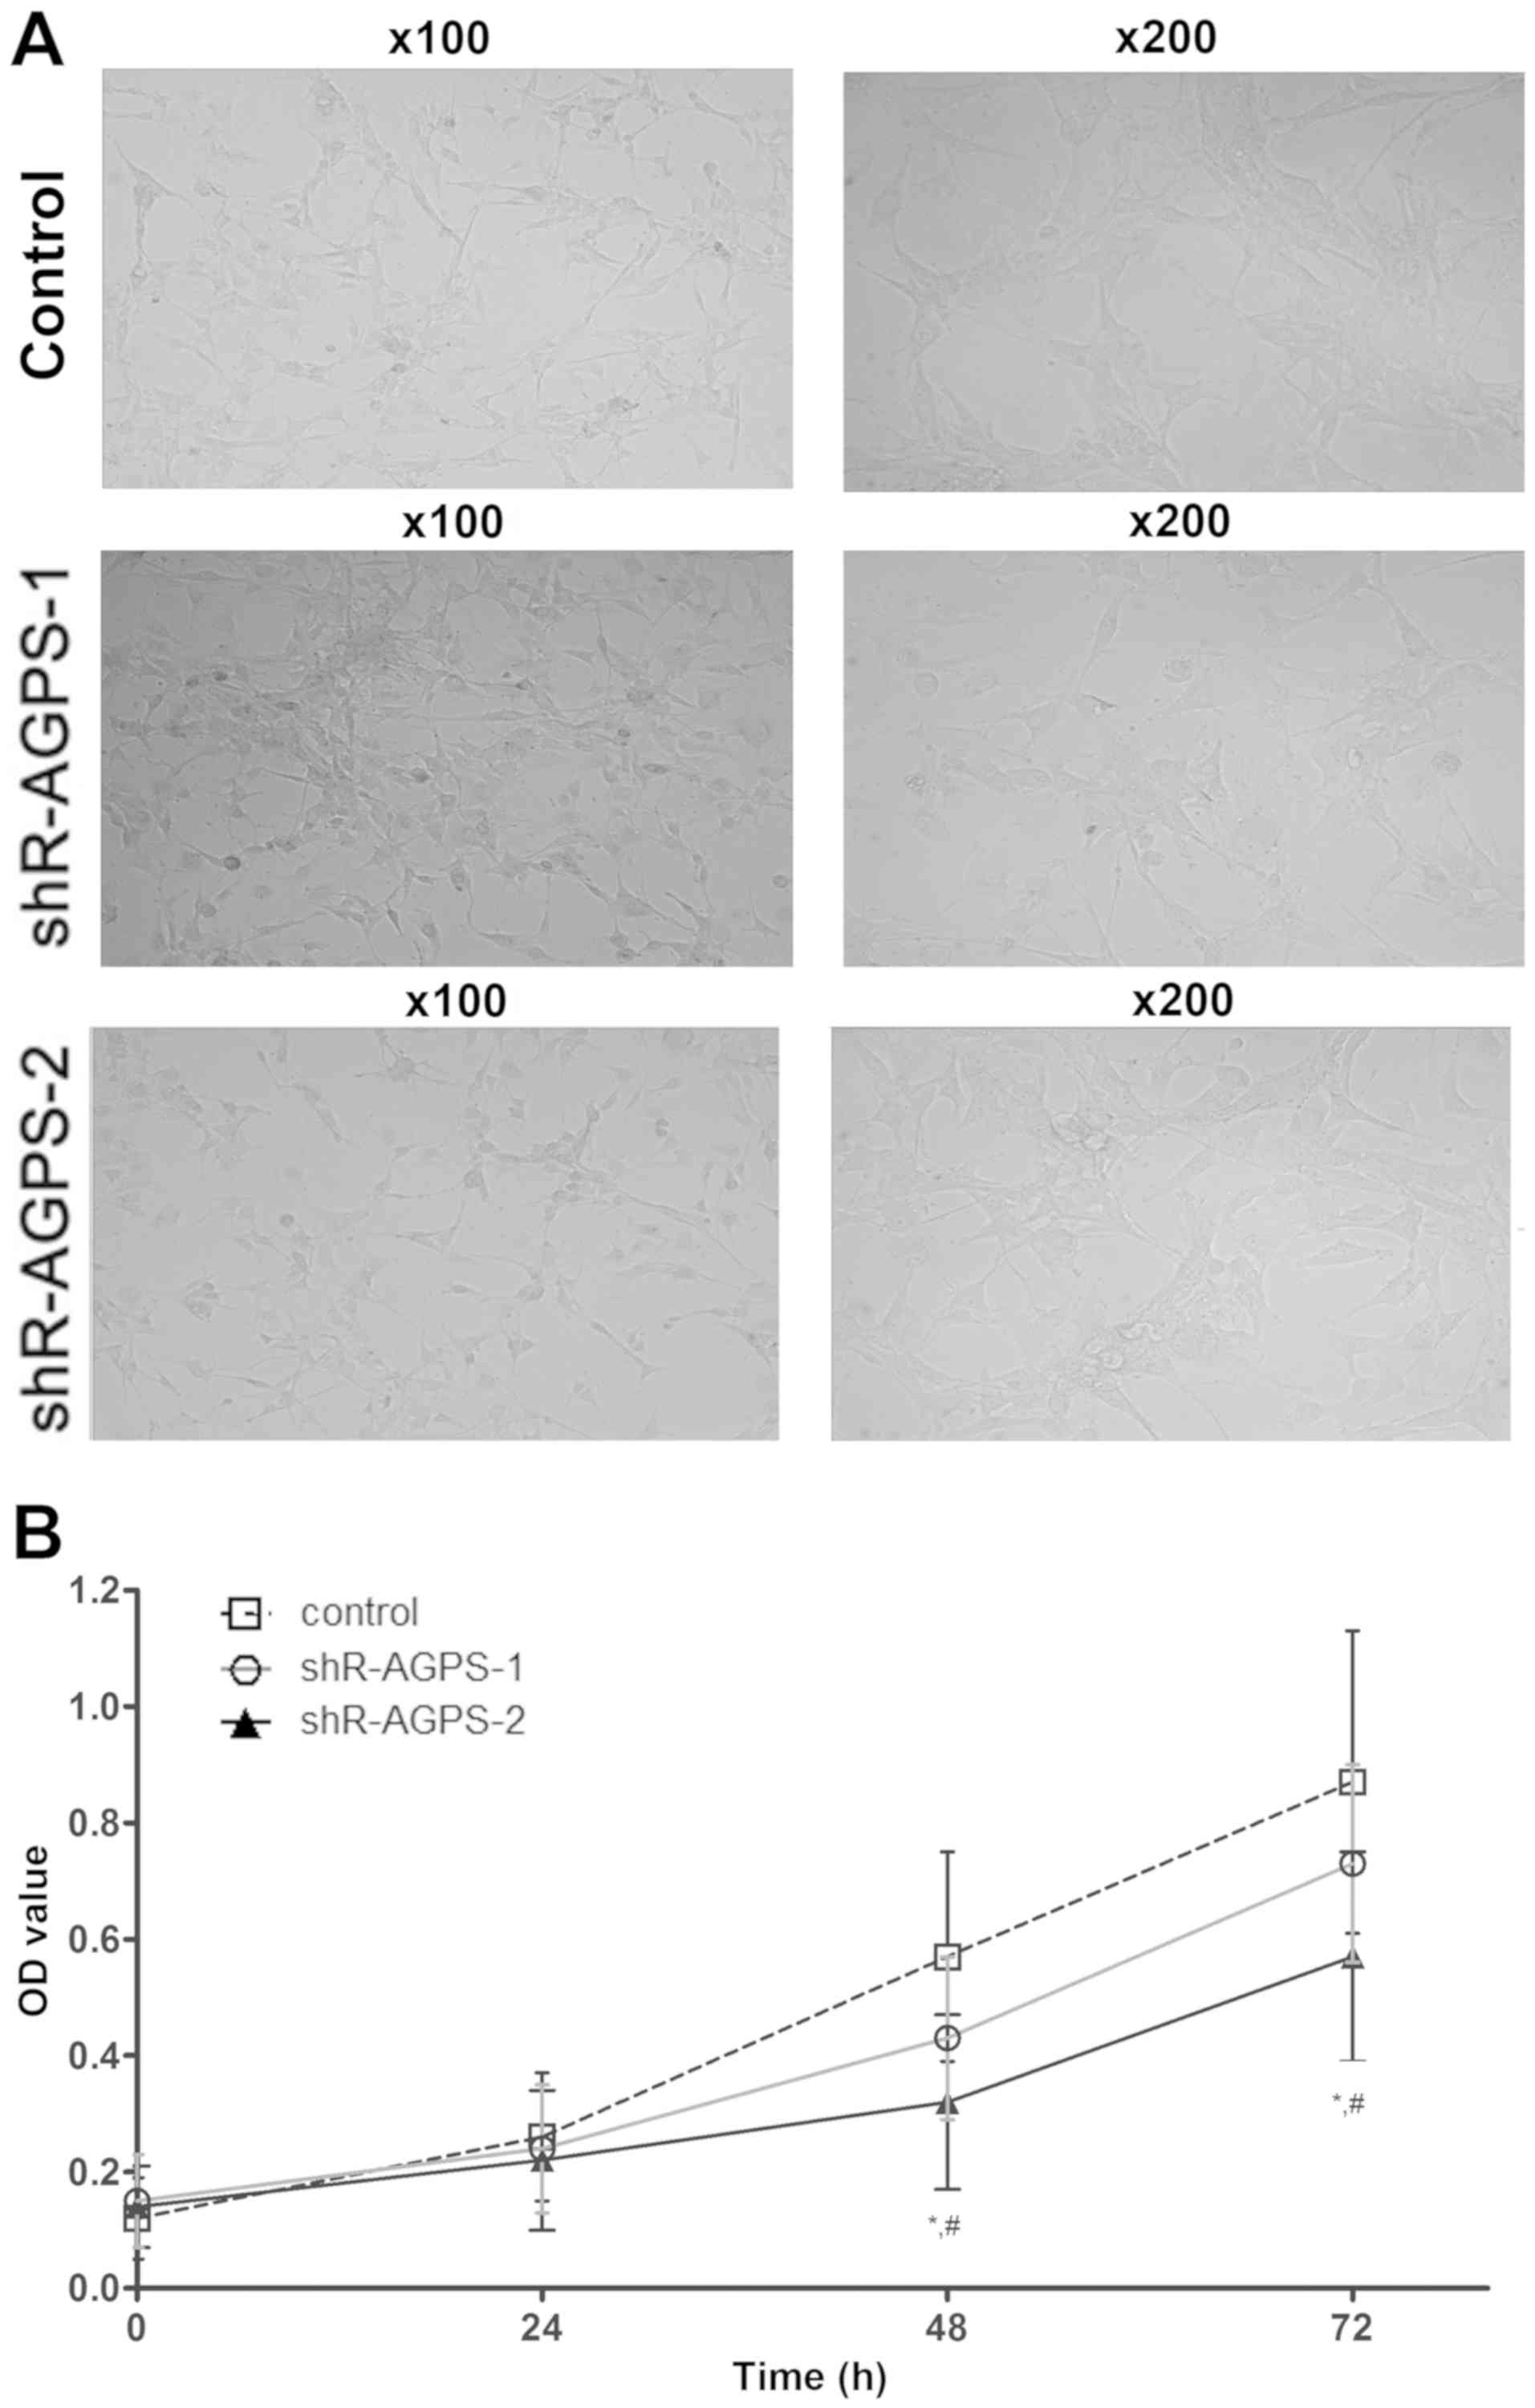
Effect of AGPS silencing on the
morphology of U251 cells
After silencing the expression levels of AGPS in
U251 cells, the proliferation of each group was observed under a
microscope at ×100 and ×200 magnification. The cell morphology of
the shR-AGPS-1 and shR-AGPS-2 groups was observed (Fig. 2A). In addition, the proliferative
ability in the shR-AGPS-2 group was significantly decreased
compared with that in the shR-AGPS-1 and control groups after 48
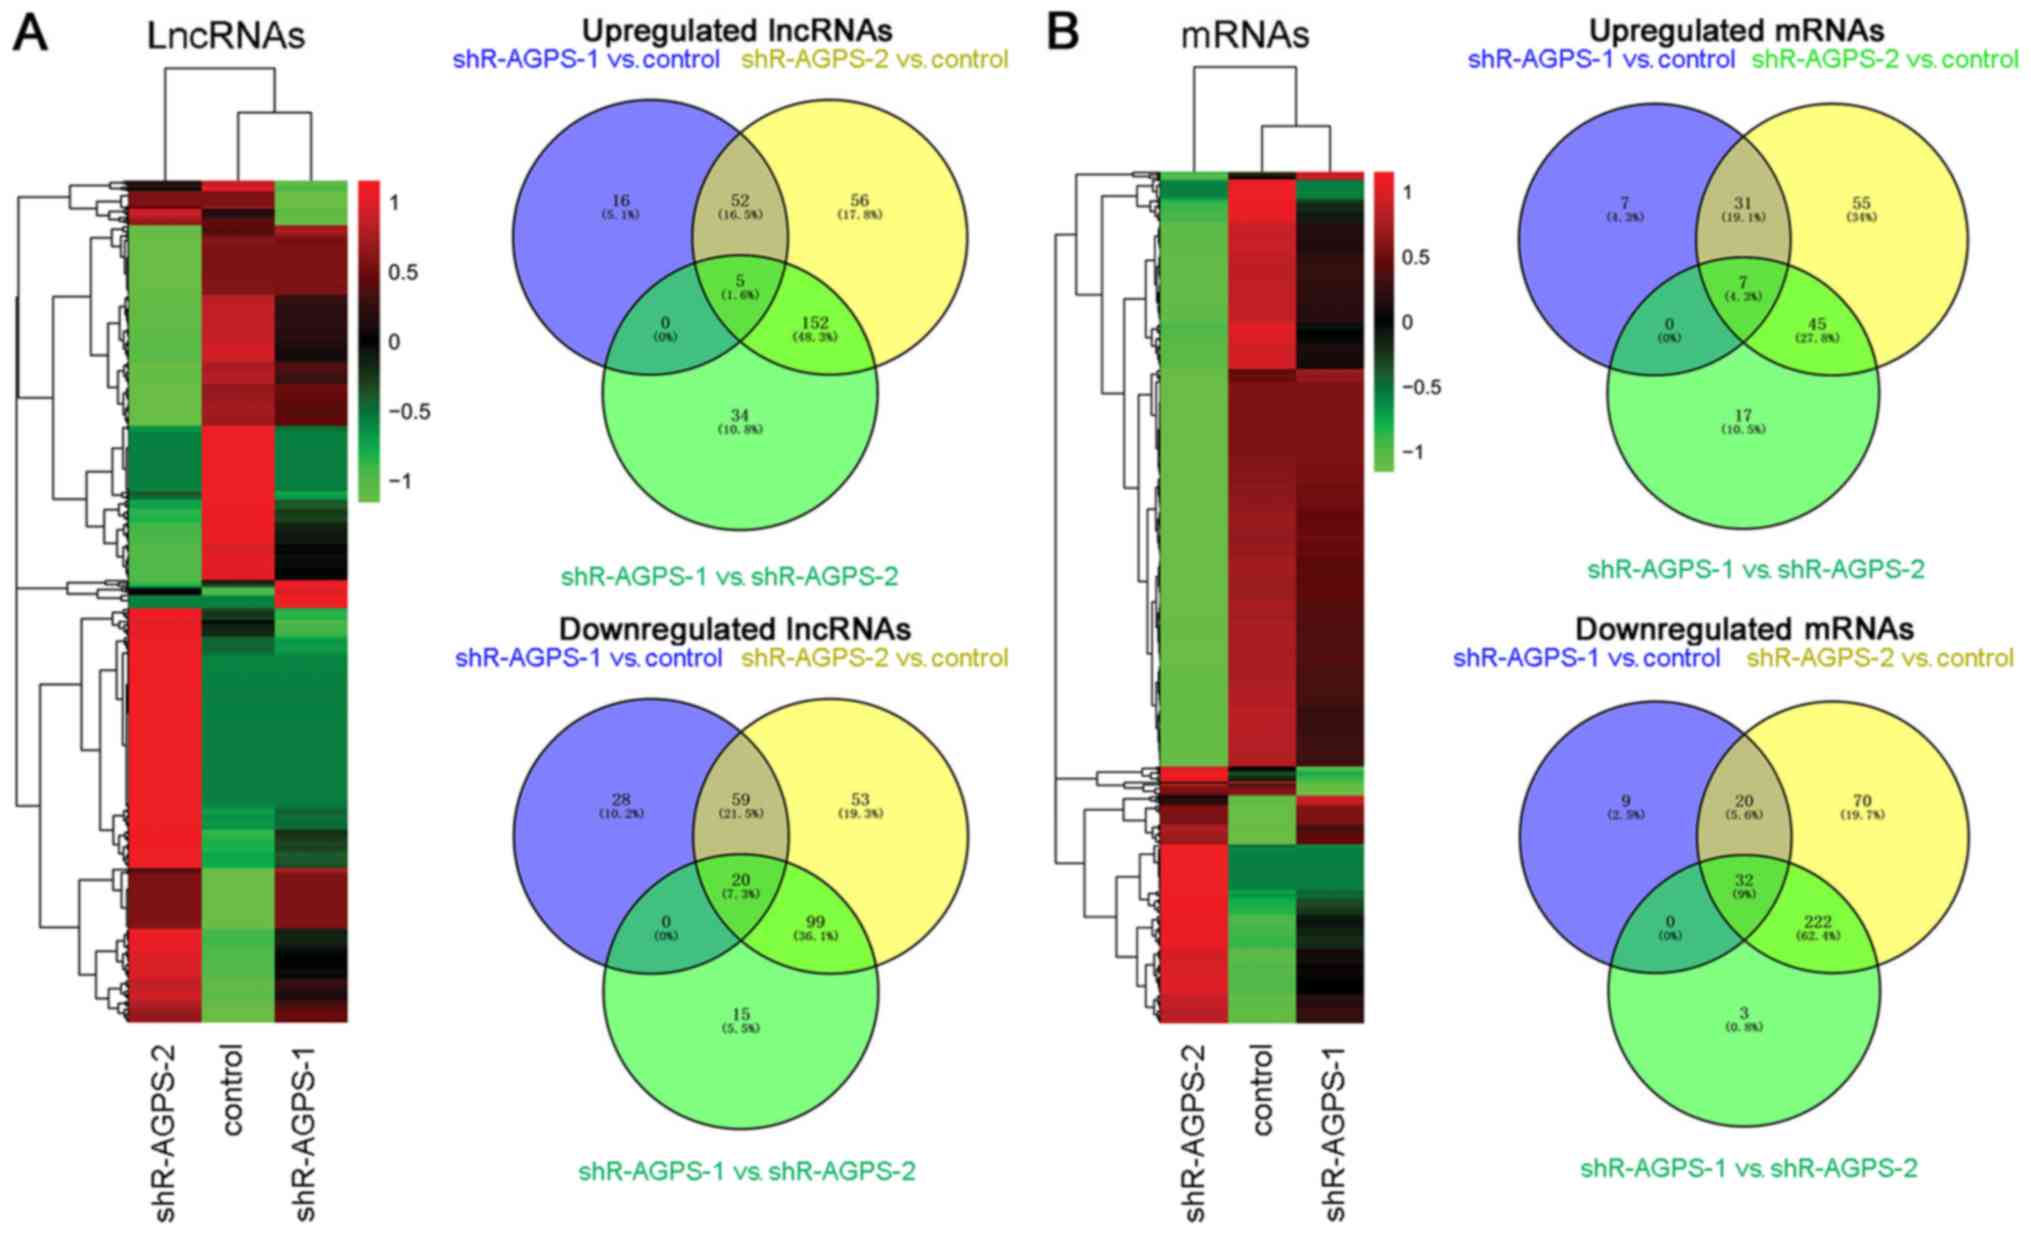
and 72 h (Fig. 2B). Cluster analysis
and regulation of differentially expressed lncRNAs and mRNAs. In
the heatmap, the identified downregulated lncRNAs (107 for
shR-AGPS-1 vs. control, 231 for shR-AGPS-2 vs. control, and 134 for
shR-AGPS-1 vs. shR-AGPS-2) and mRNAs (61 for shR-AGPS-1 vs.
control, 344 for shR-AGPS-2 vs. control, and 257 for shR-AGPS-1 vs.
shR-AGPS-2) are represented in green, while the identified
upregulated lncRNAs (73 for shR-AGPS-1 vs. control, 265 for
shR-AGPS-2 vs. control, and 191 for shR-AGPS-1 vs. shR-AGPS-2) and
mRNAs (45 for shR-AGPS-1 vs. control, 138 for shR-AGPS-2 vs.
control, and 69 for shR-AGPS-1 vs. shR-AGPS-2) are represented in
red, in AGPS-silenced and control glioma cells (Fig. 3A and B). Venn diagrams were used to
compare the differentially regulated lncRNAs and mRNAs in the
control, shR-AGPS-1 and shR-AGPS-2 groups. There were 57 and 79
lncRNAs shared between shR-AGPS-1 vs. control and shR-AGPS-2 vs.
control, 5 and 20 shared between shR-AGPS-1 vs. control and
shR-AGPS-1 vs. shR-AGPS-2, 157 and 119 shared between shR-AGPS-2
vs. control and shR-AGPS-1 vs. shR-AGPS-2, and 5 and 20 shared
among all three groups for upregulated and downregulated lncRNAs,
respectively; additionally, there were 38 and 52 mRNAs shared
between shR-AGPS-1 vs. control and shR-AGPS-2 vs. control, 7 and 32
shared between shR-AGPS-1 vs. control and shR-AGPS-1 vs.
shR-AGPS-2, 52 and 254 shared between shR-AGPS-2 vs. control and
shR-AGPS-1 vs. shR-AGPS-2, and 7 and 32 shared among all three
groups for upregulated and downregulated mRNAs, respectively
(Fig. 3A and B). The top 40
differentially expressed lncRNAs and mRNAs, such as FOXF1 adjacent
non-coding developmental regulatory RNA (FENDRR) and OR2J2 (which
were upregulated compared with the control group), are presented in
Tables II and III. RNAs with a (|FC|)>1.2 were
upregulated or downregulated.
| Table II.Top 40 differentially expressed
lncRNAs in AGPS-silenced human glioma U251 cells. |
Table II.
Top 40 differentially expressed
lncRNAs in AGPS-silenced human glioma U251 cells.
| A, Top 40
differentially expressed lncRNAs in the shR-AGPS-1 vs. control
groups |
|---|
|
|---|
| lncRNA | Upregulated FC | lncRNA | Downregulated
FC |
|---|
| LINC00837 | 1.79 | CR604135 | 1.32 |
| CR626472 | 1.49 | CTC-436K13.3 | 1.76 |
| ERI3-IT1 | 1.48 | AK129941 | 1.64 |
| linc-AKR1B10-2 | 1.44 | MIR548AA2 | 1.58 |
| AF344193 | 1.44 | linc-FCGR1B-7 | 1.57 |
| LINC01079 | 1.41 | AK098597 | 1.42 |
| XXbac-B33L19.4 | 1.41 | AF086041 | 1.40 |
|
ENST00000551732 | 1.40 |
linc-LOC388630-3 | 1.40 |
| AC008440.10 | 1.40 | linc_luo_384 | 1.40 |
| linc_luo_541 | 1.39 | linc-SEC23B | 1.39 |
| linc-TMEM169-2 | 1.35 | linc-CNTN3-3 | 1.39 |
| linc-MAGEA1-1 | 1.35 | linc-TEKT4-1 | 1.39 |
| AF087965 | 1.34 | uc003srb.1 | 1.38 |
| LOC101928354 | 1.34 | BX641068 | 1.38 |
| FENDRR | 1.34 | linc_luo_692 | 1.36 |
| CR618740 | 1.33 | uc011edo.1 | 1.35 |
| linc-ZFP42-2 | 1.33 | LINC00973 | 1.34 |
| linc-B4GALT1 | 1.32 | FAM138B | 1.34 |
| BC047484 | 1.31 | LUCAT1 | 1.33 |
| AK054755 | 1.29 | linc-ERG-8 | 1.33 |
|
| B, Top 40
differentially expressed lncRNAs in the shR-AGPS-2 vs. control
groups |
|
| lncRNA | Upregulated
FC | lncRNA | Downregulated
FC |
|
| LINC00837 | 2.95 | CR618823 | 2.59 |
| FENDRR | 2.21 | MIR548AA2 | 2.58 |
| linc-U2AF1-1 | 1.71 | LINC00973 | 2.42 |
| CTD-2377D24.4 | 1.66 | linc_luo_1251 | 2.11 |
| LOC100506532 | 1.56 | LINC00263 | 2.01 |
| FENDRR | 1.55 | linc-JAK1-1 | 1.95 |
| CR624806 | 1.55 | BC013423 | 1.88 |
| AK130416 | 1.50 | linc-COL1A2-2 | 1.87 |
|
linc-ARHGAP11B-2 | 1.47 | linc_luo_1846 | 1.85 |
| uc004cic.2 | 1.46 | linc-WDR7-7 | 1.83 |
| AF344193 | 1.46 | AC003092.1 | 1.82 |
| AF147353 | 1.45 | uc001tkz.2 | 1.81 |
| linc-UMODL1-5 | 1.44 | linc_luo_1223 | 1.79 |
| linc-AKR1B10-2 | 1.44 | AL110176 | 1.78 |
| linc-SLC16A7-1 | 1.42 | LUCAT1 | 1.76 |
| ERI3-IT1 | 1.42 | CTC-436K13.3 | 1.76 |
| linc-CDH11-5 | 1.42 | uc003flo.2 | 1.7 |
| AL133249.1 | 1.4 | uc001gla.1 | 1.69 |
| ENST551732 | 1.4 | FAM138B | 1.66 |
| AC008440.10 | 1.4 | uc003cpd.1 | 1.65 |
|
| C, Top 40
differentially expressed lncRNAs in the shR-AGPS-1 vs. shR-AGPS-2
groups |
|
| lncRNA | Upregulated
FC | lncRNA | Downregulated
FC |
|
| FENDRR | 1.65 | CR618823 | 1.97 |
| LINC00837 | 1.65 | LINC00973 | 1.80 |
| CTD-2377D24.4 | 1.62 | BC013423 | 1.79 |
| linc-U2AF1-1 | 1.61 | LINC00263 | 1.70 |
| linc-LRRC8D-1 | 1.53 | AL110176 | 1.69 |
| linc-ACVR2B | 1.47 | linc_luo_1223 | 1.64 |
| linc-GPATCH2-4 | 1.46 | MIR548AA2 | 1.63 |
| AF147353 | 1.45 | linc-WDR7-7 | 1.62 |
| linc-FBRSL1-3 | 1.44 | linc_luo_1251 | 1.61 |
| LINC01314 | 1.44 | uc002axu.2 | 1.58 |
| linc-UMODL1-5 | 1.44 | uc001tkz.2 | 1.57 |
| linc-SLC16A7-1 | 1.42 | linc_luo_888 | 1.53 |
| linc-RREB1-2 | 1.42 | AX721161 | 1.53 |
| linc-CDH11-5 | 1.42 | linc-COL1A2-2 | 1.53 |
| linc-PELO-3 | 1.40 | linc-PTPRQ-4 | 1.50 |
| linc-GADD45G-1 | 1.40 | CR598627 | 1.50 |
| linc-COX4NB-1 | 1.39 | AL833129 | 1.49 |
| RP11-339N8.1 | 1.38 | uc003hoi.2 | 1.49 |
| linc-SIPA1L1 | 1.38 | CR626472 | 1.49 |
| U84508 | 1.37 | uc003cpd.1 | 1.49 |
| Table III.Top 40 differentially expressed mRNAs
in AGPS-silenced human glioma U251 cells. |
Table III.
Top 40 differentially expressed mRNAs
in AGPS-silenced human glioma U251 cells.
| A, Top 40
differentially expressed mRNAs in the shR-AGPS-1 vs. control
groups |
|---|
|
|---|
| mRNA | Upregulated FC | mRNA | Downregulated
FC |
|---|
| OR2J2 | 1.84 | CXCL8 | 2.10 |
| THBS1 | 1.58 | SLC7A11 | 1.81 |
| KIR2DL5B | 1.53 | APOH | 1.56 |
| LTB | 1.50 | HMGA2 | 1.53 |
| PRPS1 | 1.42 | PSAT1 | 1.49 |
| HIST1H3I | 1.41 | BLID | 1.45 |
| INTS4 | 1.35 | ZNF404 | 1.44 |
| RGCC | 1.35 | SLC38A1 | 1.43 |
| MFAP4 | 1.34 | CXCL8 | 1.43 |
| KRT75 | 1.33 | IGHD3-16 | 1.42 |
| UNK | 1.32 | ZNF404 | 1.42 |
| HES1 | 1.32 | C3orf17 | 1.41 |
| NQO1 | 1.30 | CHML | 1.41 |
| FAIM2 | 1.30 | IGFBP1 | 1.39 |
| HIST1H4C | 1.28 | RPE | 1.35 |
| KIR3DL2 | 1.28 | OR2Z1 | 1.32 |
| KRTAP5-3 | 1.27 | SLC7A5 | 1.32 |
| CCL2 | 1.27 | DST | 1.31 |
| HIST2H2AA4 | 1.26 | PDK3 | 1.30 |
| IGKV2-40 | 1.26 | ASNS | 1.30 |
|
| B, Top 40
differentially expressed mRNAs in the shR-AGPS-2 vs. control
groups |
|
| mRNA | Upregulated
FC | mRNA | Downregulated
FC |
|
| THBS1 | 2.31 | CXCL8 | 6.94 |
| PRPS1 | 1.89 | AGPS | 4.53 |
| RGCC | 1.79 | IGFBP1 | 4.22 |
| KRT75 | 1.71 | APOH | 3.22 |
| NQO1 | 1.67 | CXCL8 | 2.70 |
| HIST1H3I | 1.67 | SLC7A11 | 2.67 |
| KIR2DL5B | 1.63 | SLC38A1 | 2.45 |
| CNN2 | 1.61 | PTGS2 | 2.29 |
| PLEKHA6 | 1.60 | TREM1 | 2.28 |
| IGKC | 1.56 | SCD | 2.21 |
| MFAP4 | 1.56 | CHML | 2.20 |
| ITGA11 | 1.55 | OGFRL1 | 2.16 |
| OR10P1 | 1.51 | IL7R | 2.15 |
| LTB | 1.50 | IGFBP3 | 2.12 |
| TRDV1 | 1.46 | SEL1L3 | 2.09 |
| CCL2 | 1.46 | HMGA2 | 2.06 |
| DEPTOR | 1.46 | PSAT1 | 2.05 |
| NOB1 | 1.45 | DOCK10 | 2.03 |
| C1QBP | 1.43 | ROS1 | 2.03 |
| KRTAP10-10 | 1.42 | PMAIP1 | 1.98 |
|
| C, Top 40
differentially expressed mRNAs in the shR-AGPS-1 vs. shR-AGPS-2
groups |
|
| mRNA | Upregulated
FC | mRNA | Downregulated
FC |
|
| THBS1 | 1.46 | AGPS | 3.55 |
| IGHJ1 | 1.43 | CXCL8 | 3.30 |
| GPR33 | 1.38 | IGFBP1 | 3.04 |
| IGHD3-16 | 1.37 | OR2J2 | 2.20 |
| IGKC | 1.34 | APOH | 2.06 |
| KRTAP19-4 | 1.34 | TREM1 | 1.90 |
| PLEKHA6 | 1.34 | SCD | 1.90 |
| EN2 | 1.33 | CXCL8 | 1.89 |
| BTNL2 | 1.33 | IGFBP3 | 1.87 |
| RGCC | 1.33 | PTGS2 | 1.84 |
| PRPS1 | 1.32 | OGFRL1 | 1.83 |
| OR2Z1 | 1.32 | SLC38A1 | 1.71 |
| VN1R4 | 1.31 | SEL1L3 | 1.70 |
| OR10P1 | 1.30 | STC1 | 1.70 |
| ATOH8 | 1.30 | ROS1 | 1.69 |
| CNN2 | 1.30 | IL7R | 1.69 |
| IGHV3OR16-9 | 1.30 | SLC2A3 | 1.66 |
| OR51B6 | 1.30 | BDKRB1 | 1.65 |
| DEPTOR | 1.29 | PANK3 | 1.63 |
| KRT75 | 1.29 | TXNIP | 1.62 |
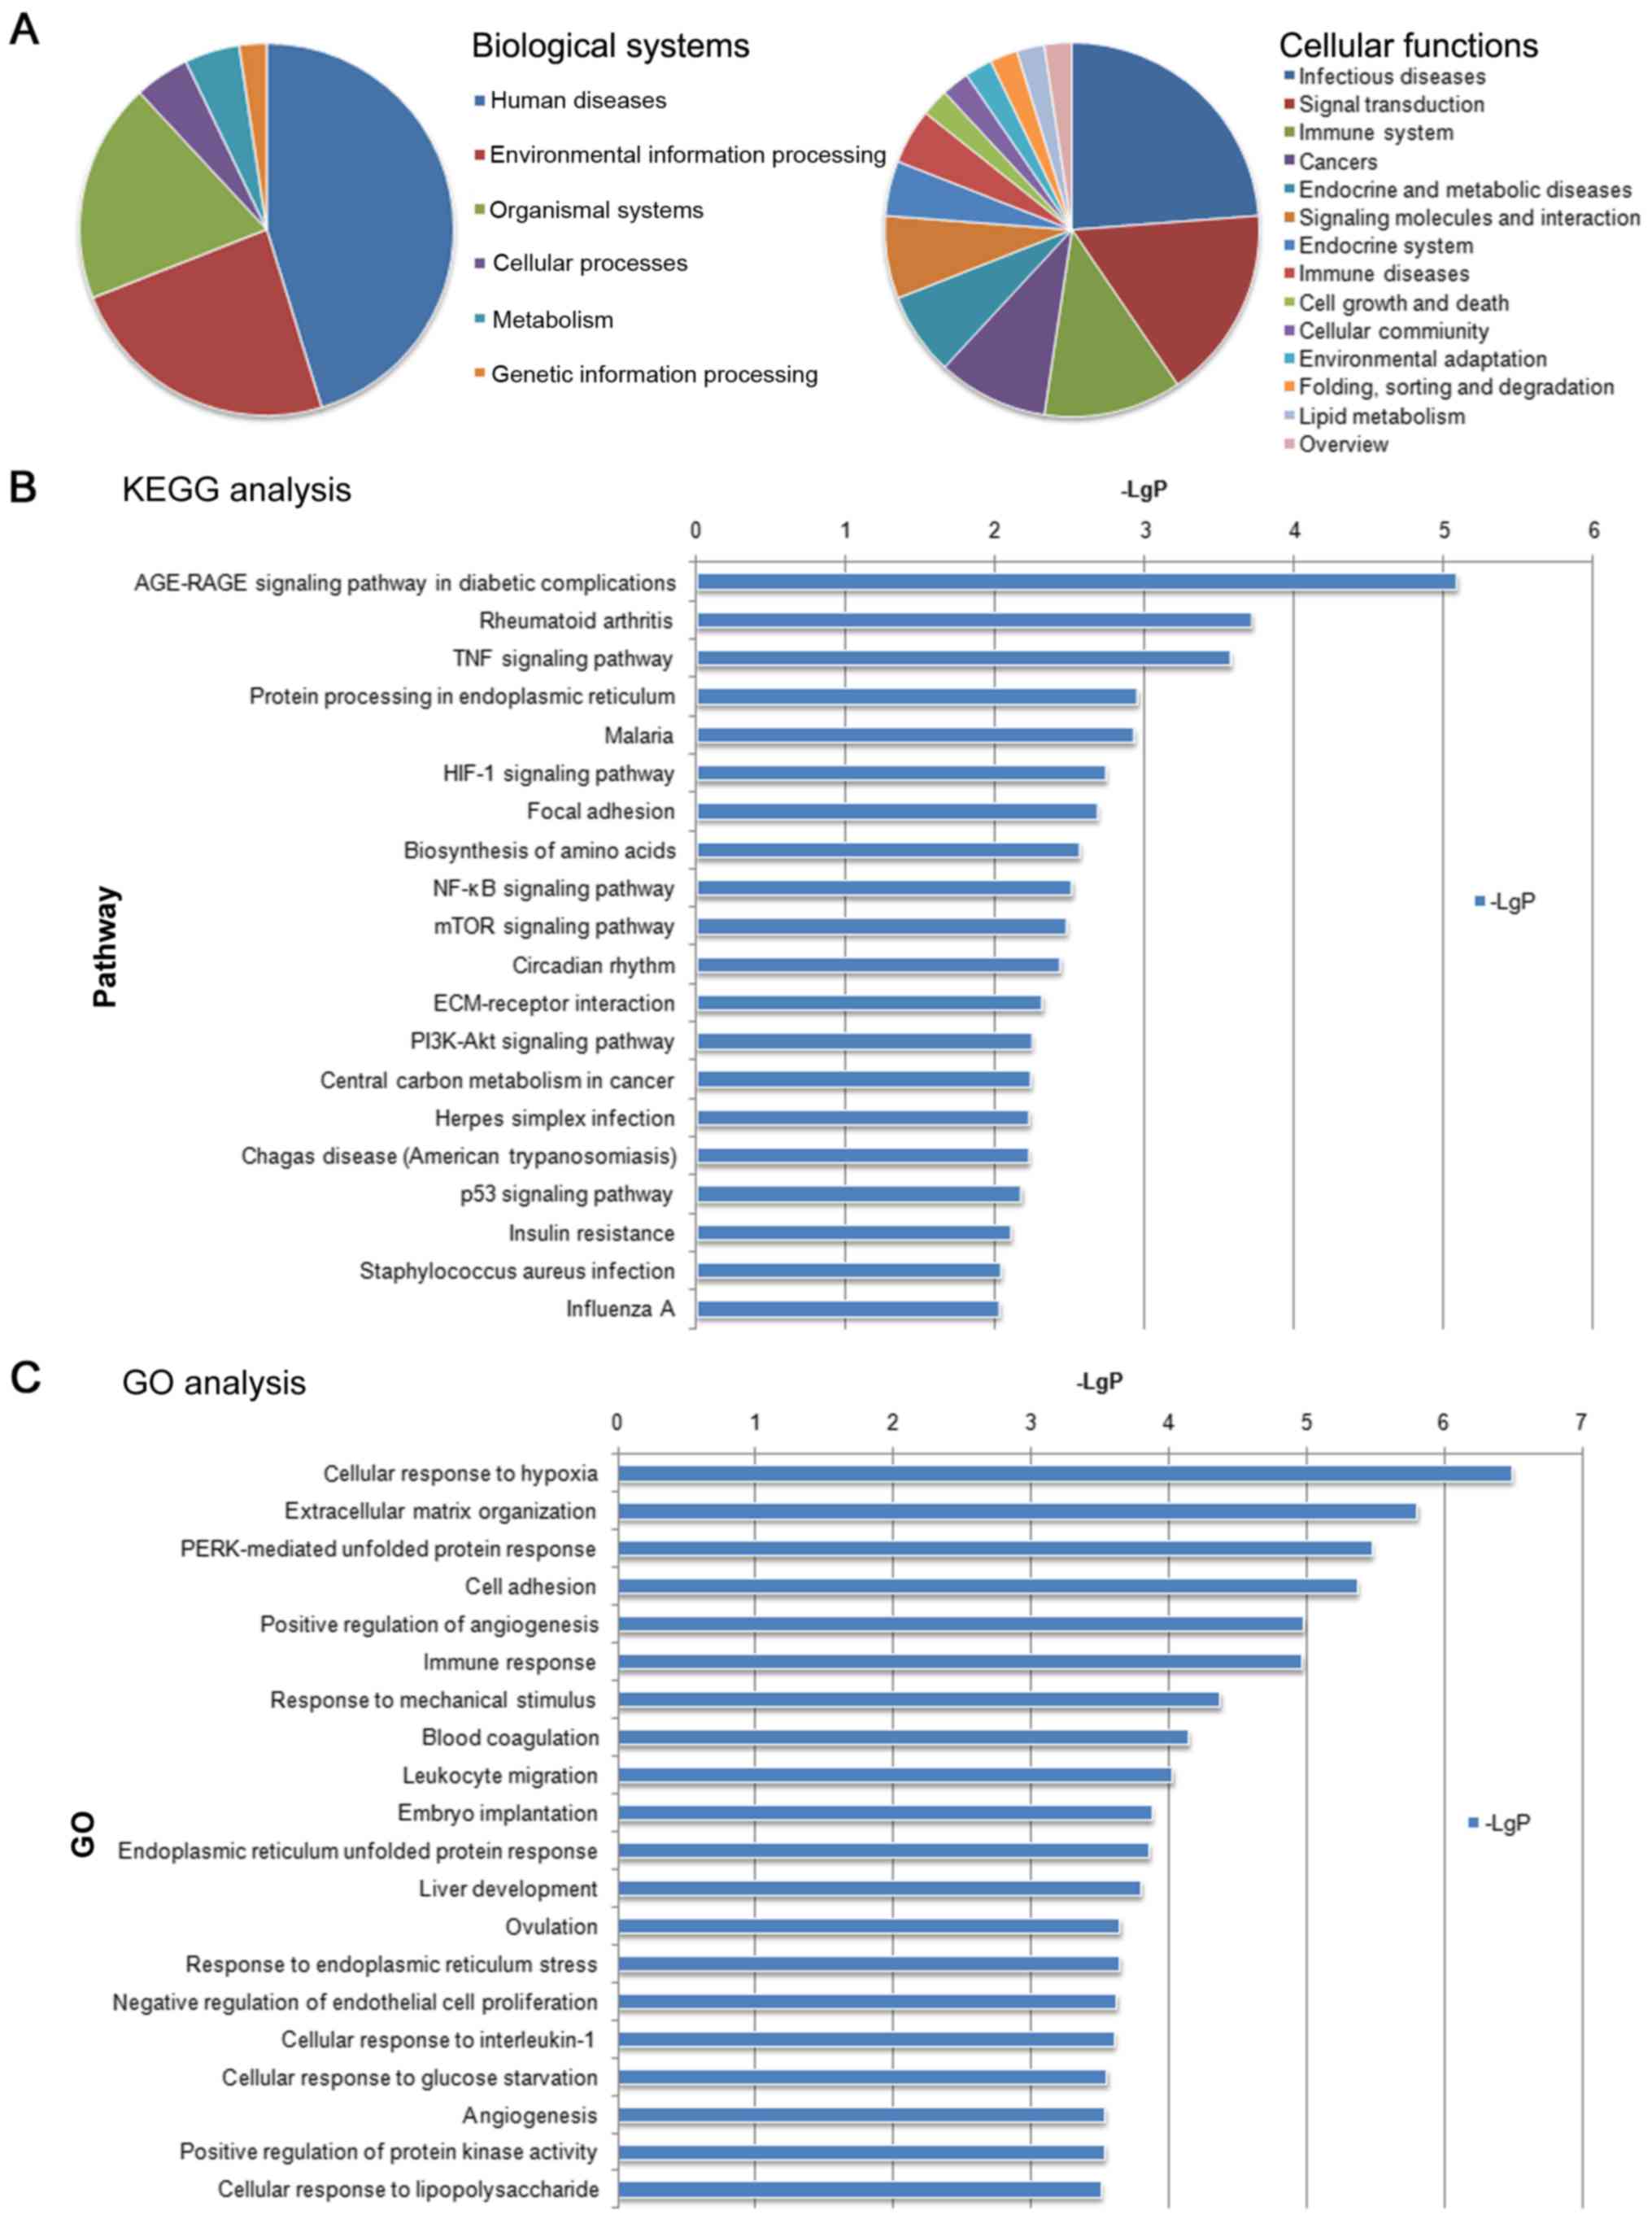
Functional prediction based on lncRNA
and mRNA co-expression
According to the KEGG biological function analysis,
the biological functions that were significantly enriched by
differentially expressed genes were mainly involved in ‘Human
Diseases’, ‘Environmental Information Processing’ and ‘Organismal
Systems’ in biological systems. The biological functions that were
significantly enriched by differential gene analysis were mainly
involved in the ‘Infectious diseases’, Signal transduction’ and
‘Immune system’ in cellular functions (Fig. 4A).
The co-expressed mRNAs identified in the present
study were subjected to signaling pathway enrichment analysis by
KEGG. It was identified that significantly enriched signaling
pathways for the co-expressed mRNAs included the ‘AGE-RAGE
signaling pathway in diabetic complications’, ‘Rheumatoid
arthritis’, ‘TNF signaling pathway’, ‘Protein processing in
endoplasmic reticulum’ and ‘Malaria’ (Fig. 4B).
GO enrichment BP analysis of the co-expressed
lncRNAs and mRNAs indicated that the BPs of these two regulated
types of RNA were associated with ‘Cellular response to hypoxia’,
‘Extracellular matrix organization’ and ‘PERK-mediated unfolded
protein response’ (Fig. 4C); these
functions are known to mediate protein responses, cell adhesion and
the positive regulation of angiogenesis (12–14).
Construction of a signal transduction
and pathway network from the co-expressed lncRNAs and mRNAs
Based on the signal transduction pathway
interactions identified by KEGG signaling pathway enrichment
analysis, a signaling pathway network was constructed using the
OmicShare tools. The network consisted of 37 nodes and 158
connections. Amongst the most connected nodes identified was the
PI3K-Akt signaling pathway, the Toll-like receptor signaling
pathway, the complement and coagulation cascades, focal adhesion
and the vascular endothelial growth factor (VEGF) signaling pathway
(Fig. 5A). The analysis of the mRNAs
corresponding to the signaling pathway action network was used to
construct a global signal transduction network based on the
interaction between genes, proteins and compounds, and to further
obtain a network of interactions between mRNAs using the OmicShare
tools. The network consisted of 75 nodes and 164 connections. The
epidermal growth factor receptor (EGFR), integrin α-11 (ITGA11) and
insulin-like growth factor 1 receptor (IGF1R) were the central
sites in the pathway network (Fig.
5B).
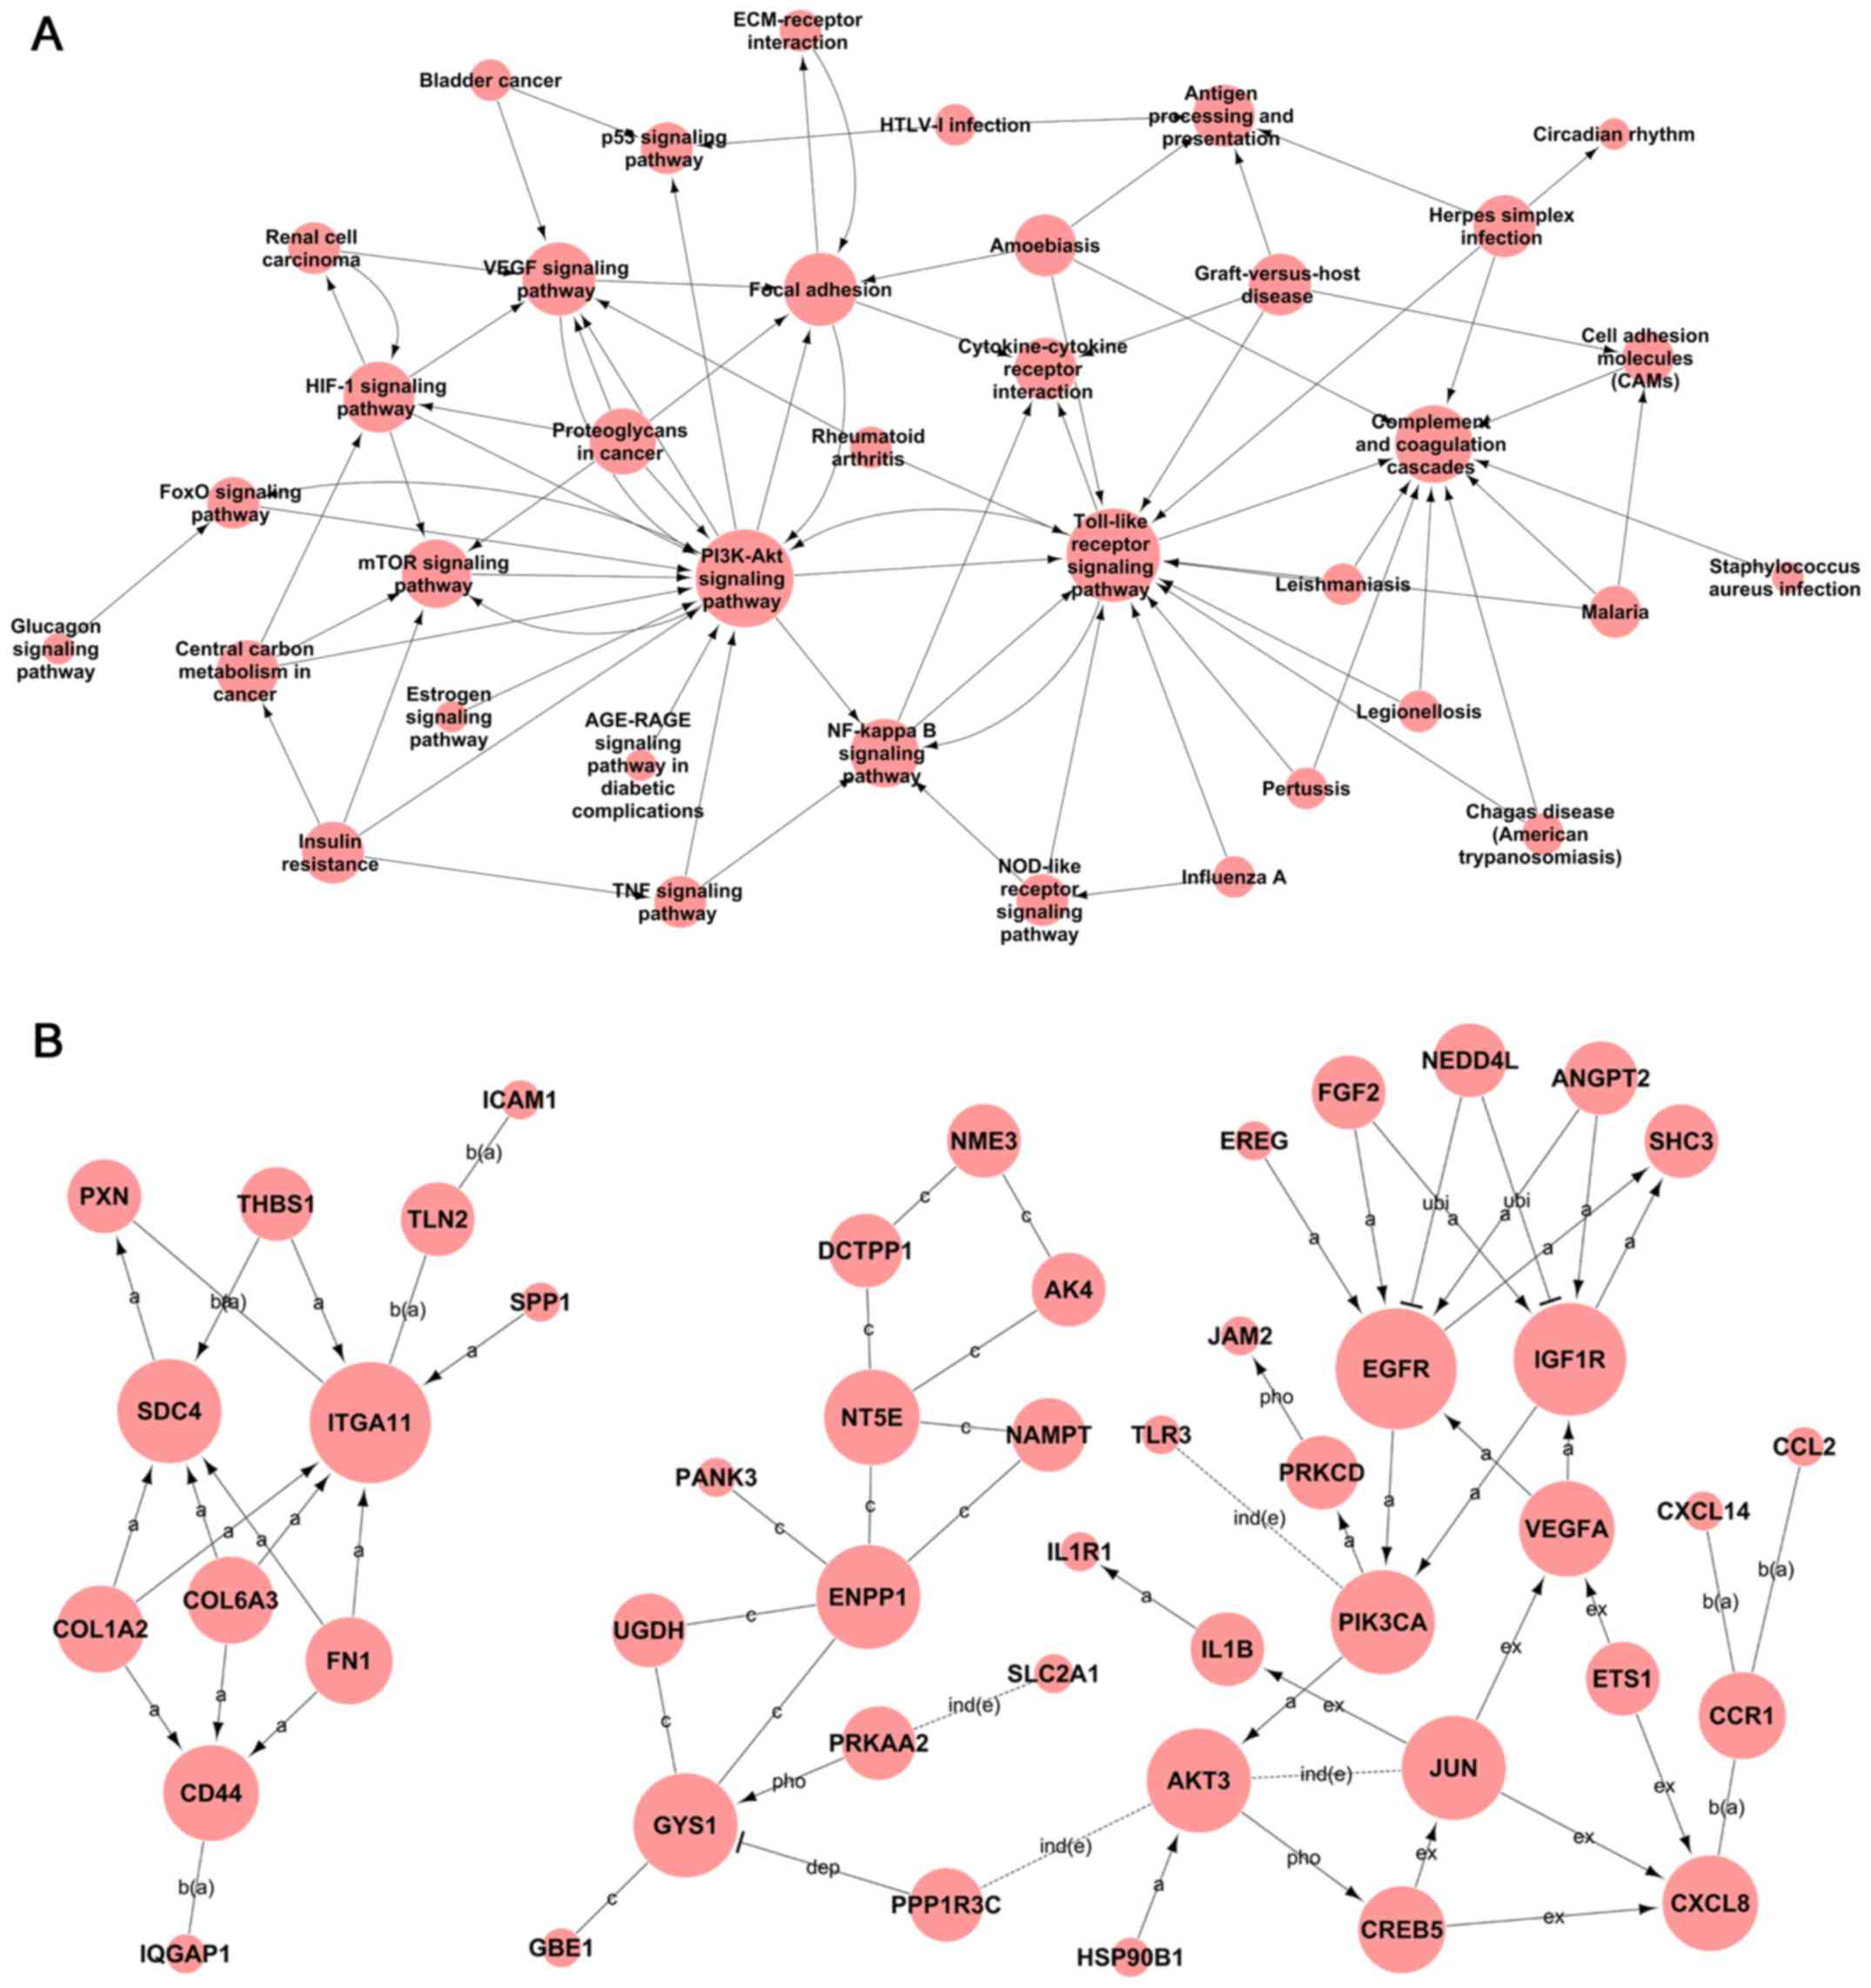 | Figure 5.Signaling transduction and pathway
network of co-expressed lncRNAs and mRNAs in AGPS-silenced U251
cells. (A) Pathway network of co-expressed lncRNAs and mRNAs in
AGPS-silenced U251 cells. (B) Global signal transduction network of
co-expressed lncRNAs and mRNAs in AGPS-silenced U251 cells. The
nodes represent signaling pathways, lncRNAs and mRNAs and the
arrows (or edges) represent the interaction/regulation between
nodes. Ex, expression; pho, phosphorylation; a, activation; ind(e),
indirect effect; b(a), binding/association; ubi, ubiquitination;
dep, dephosphorylation; c, compound; s(c), state change; inh,
inhibition; lncRNA, long non-coding RNA; AGPS, alkylglycerone
phosphate synthase. |
Pathway network in AGPS-silenced human
glioma cells
The pathway network in AGPS-silenced U251 cells is
presented in Table IV. To further
assess the expression levels and regulatory effect of AGPS on the
pathway networks in human glioma cells, the mRNAs of important
genes in the PI3K/Akt, Toll-like receptor, focal adhesion and VEGF
signaling pathways were analyzed using RT-qPCR. Compared with the
control cells, significantly upregulated expression levels of
thrombospondin-1 (THBS1) and ITGA11, and significantly
downregulated expression levels of secreted phosphoprotein 1
(SPP1), VEGFA, EGFR, interleukin-7 receptor subunit α (IL7R),
interleukin-8 (CXCL8), prostaglandin G/H synthase 2 (PTGS2) and
syndecan-4 (SDC4), were identified in the shR-AGPS-transfected
cells (Fig. 6).
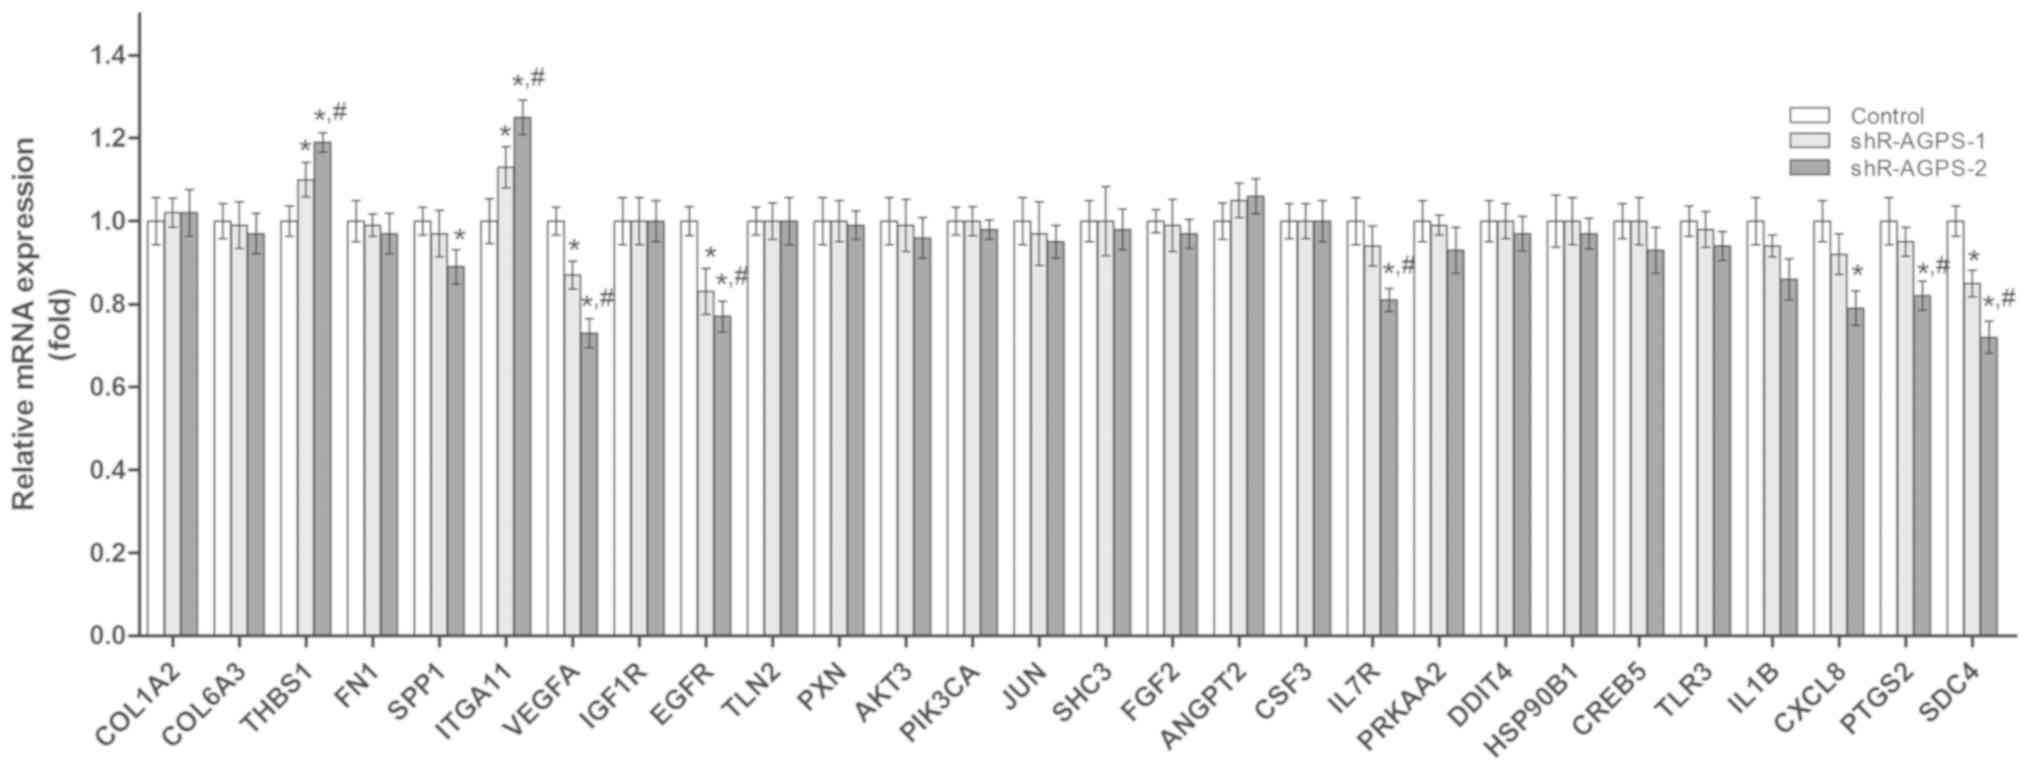 | Figure 6.Effect of AGPS silencing on the
expression levels of tumor-related mRNAs in glioma cells. Reverse
transcription-quantitative PCR was used to analyze the mRNA
expression levels of tumor-related mRNAs in AGPS-silenced U251
cells. *P<0.05 vs. control group; #P<0.05 vs.
shR-AGPS-1 group. COL1A2, collagen I α2; COL6A3, collagen 6 α3;
THBS1, thrombospondin-1; FN1, fibronectin 1; SPP1, secreted
phosphoprotein 1; ITGA11, integrin subunit α11; VEGFA, vascular
endothelial growth factor A; IGF1R, insulin-like growth factor 1
receptor; EGFR, epidermal growth factor receptor; TLN2, Talin 2;
PXN, Paxillin; PIK3CA, phosphoinositide 3-kinase α; SHC3, Src
homology 2 domain containing transforming protein 3; FGF2,
fibroblast growth factor 2; ANGPT2, angiopoietin 2; CSF3, colony
stimulating factor 3; IL-7R, interleukin-7 receptor subunit α;
PRKAA2, protein kinase AMP-activated α2; DDIT4, DNA damage
inducible transcript 4; HSP90B1, heat shock protein 90 kDa β1;
CREB5, cyclic AMP-responsive element-binding protein 5; TLR3,
Toll-like receptor 3; IL-1B, interleukin-1β; CXCL8, chemokine
ligand 8; PTGS2, prostaglandin G/H synthase 2; SDC4, syndecan-4;
shRNA, short hairpin RNA; AGPS, alkylglycerone phosphate
synthase. |
| Table IV.Pathway networks in alkylglycerone
phosphate synthase-silenced human glioma U251 cells. |
Table IV.
Pathway networks in alkylglycerone
phosphate synthase-silenced human glioma U251 cells.
| Pathway name | Degree | Indegree | Outhegree |
|---|
| PI3K-Akt signaling
pathway | 19 | 12 | 7 |
| Toll-like receptor
signaling pathway | 17 | 13 | 4 |
| Complement and
coagulation cascades | 10 | 10 | 0 |
| Focal adhesion | 8 | 5 | 3 |
| VEGF signaling
pathway | 8 | 6 | 2 |
| HIF-1 signaling
pathway | 7 | 3 | 4 |
| mTOR signaling
pathway | 6 | 5 | 1 |
| NF-kappa B
signaling pathway | 6 | 4 | 2 |
| Proteoglycans in
cancer | 5 | 0 | 5 |
| Central carbon
metabolism in cancer | 4 | 1 | 3 |
| Graft-versus-host
disease | 4 | 0 | 4 |
| Antigen processing
and presentation | 4 | 4 | 0 |
| Herpes simplex
infection | 4 | 0 | 4 |
| Cytokine-cytokine
receptor interaction | 4 | 4 | 0 |
| Amoebiasis | 4 | 0 | 4 |
| Insulin
resistance | 4 | 0 | 4 |
| TNF signaling
pathway | 3 | 1 | 2 |
| Renal cell
carcinoma | 3 | 1 | 2 |
| Cell adhesion
molecules | 3 | 0 | 0 |
| FoxO signaling
pathway | 3 | 2 | 1 |
| Malaria | 3 | 0 | 3 |
| NOD-like receptor
signaling pathway | 3 | 1 | 2 |
| p53 signaling
pathway | 3 | 3 | 0 |
| Legionellosis | 2 | 0 | 2 |
| Pertussis | 2 | 0 | 2 |
| HTLV–I
infection | 2 | 0 | 2 |
| ECM-receptor
interaction | 2 | 1 | 1 |
| Influenza A | 2 | 0 | 2 |
| Leishmaniasis | 2 | 0 | 2 |
| Bladder cancer | 2 | 0 | 2 |
| Chagas disease
(American trypanosomiasis) | 2 | 0 | 0 |
| Rheumatoid
arthritis | 2 | 0 | 2 |
| AGE-RAGE signaling
pathway in diabetic complications | 1 | 0 | 1 |
| Circadian
rhythm | 1 | 1 | 0 |
| Glucagon signaling
pathway | 1 | 0 | 1 |
| Staphylococcus
aureus infection | 1 | 0 | 1 |
| Estrogen signaling
pathway | 1 | 0 | 1 |
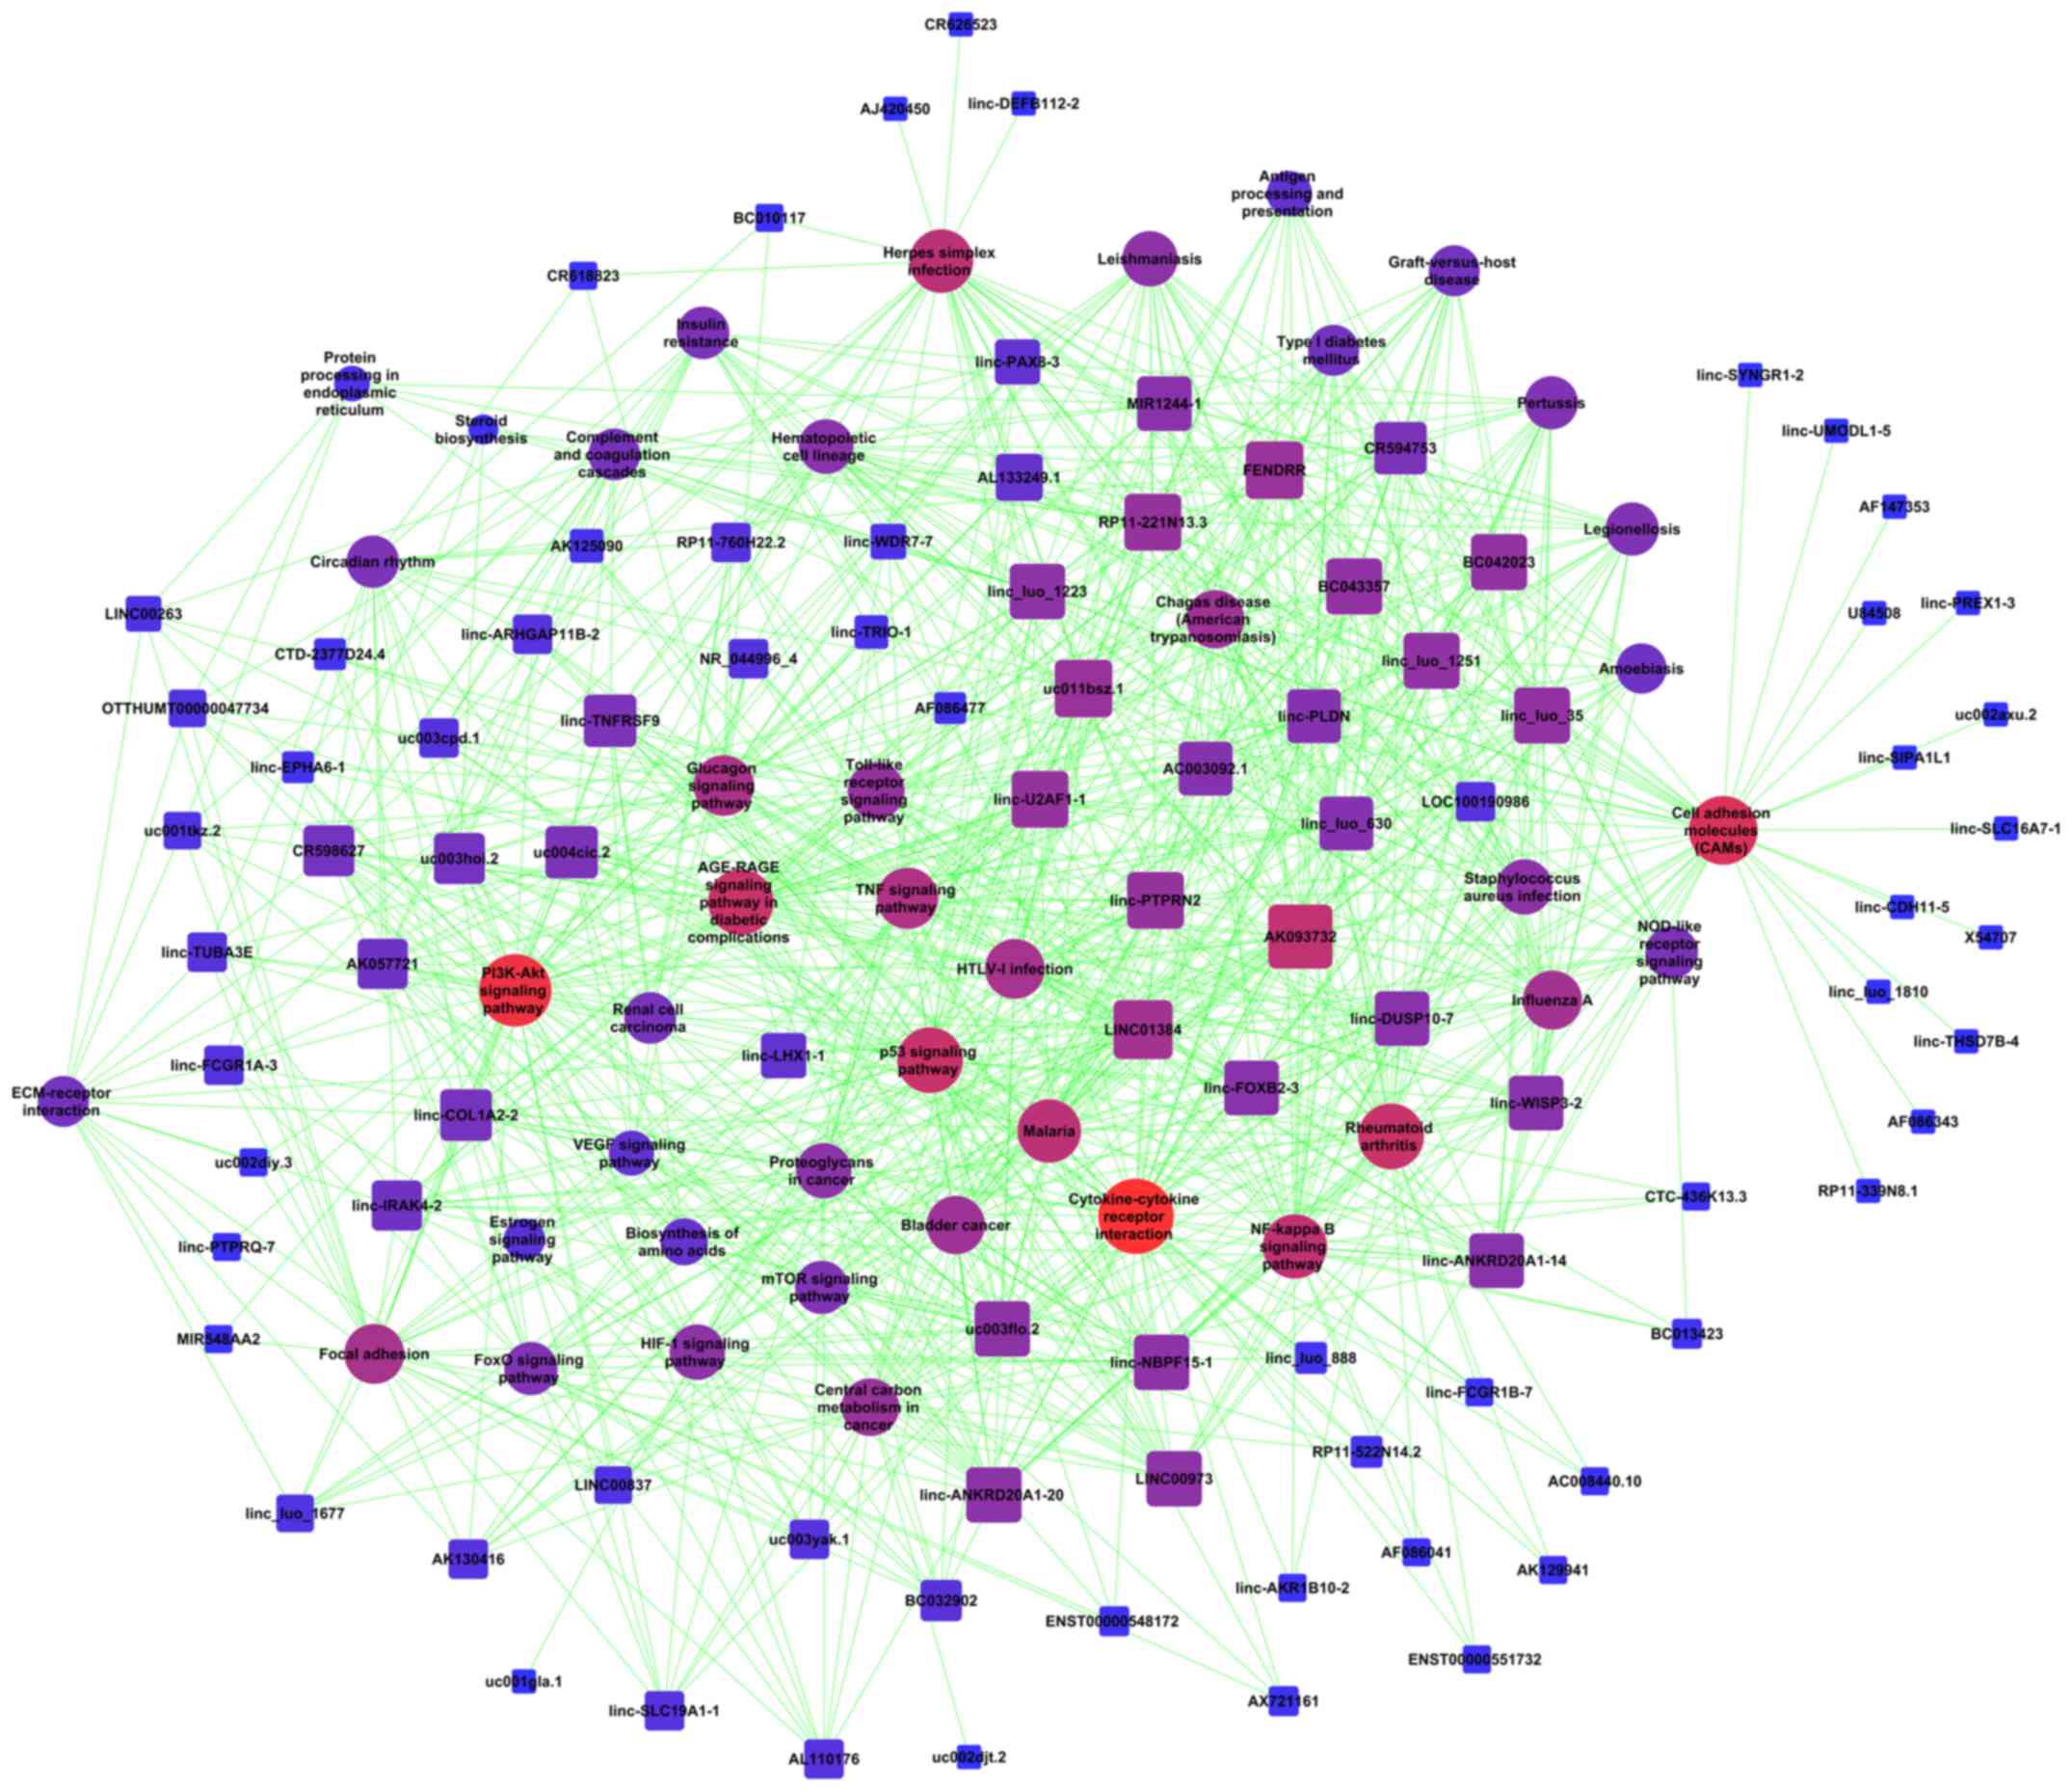
lncRNA regulation pathway network
A lncRNA regulatory network was constructed using
the OmicShare tools. Moreover, 979 connections were identified
between the nodes. The Degree of the lncRNA and its target pathway
was calculated by OmicShare tools 3.0 according to the connection
around the lncRNA and its target pathway, and the more connections
there were, the higher the Degree. Table
V shows that the lncRNA with the highest Degree was AK093732.
To analyze the importance of each pathway in the network, it was
identified that the core signal transduction pathway regulated by
differentially expressed lncRNAs was cytokine-cytokine receptor
interaction (Fig. 7). The top 20
lncRNA-target pathway networks in AGPS-silenced U251 cells are
presented in Table V.
| Table V.Top 20 lncRNA-target pathway networks
in alkylglycerone phosphate synthase-silenced U251 cells. |
Table V.
Top 20 lncRNA-target pathway networks
in alkylglycerone phosphate synthase-silenced U251 cells.
| A, Pathway | Degree |
|---|
| Cytokine-cytokine
receptor interaction | 49 |
| PI3K-Akt signaling
pathway | 45 |
| Cell adhesion
molecules (CAMs) | 40 |
| AGE-RAGE signaling
pathway | 36 |
| p53 signaling
pathway | 36 |
| Rheumatoid
arthritis | 36 |
| NF-kappa B
signaling pathway | 34 |
| Herpes simplex
infection | 33 |
| Malaria | 33 |
| TNF signaling
pathway | 30 |
| Glucagon signaling
pathway | 29 |
| Focal adhesion | 28 |
| HTLV–I
infection | 28 |
| Influenza A | 27 |
| Bladder cancer | 26 |
| Chagas disease
(American trypanosomiasis) | 26 |
| Central carbon
metabolism in cancer | 25 |
| Toll-like receptor
signaling pathway | 24 |
| HIF-1 signaling
pathway | 22 |
| Leishmaniasis | 22 |
|
| B,
lncRNA | Degree |
|
| AK093732 | 34 |
| LINC01384 | 27 |
| FENDRR | 25 |
| uc011bsz.1 | 25 |
| linc-PTPRN2 | 24 |
| linc-U2AF1-1 | 24 |
| RP11-221N13.3 | 24 |
| BC042023 | 23 |
| BC043357 | 23 |
| linc_luo_1251 | 23 |
| linc_luo_35 | 23 |
| linc_luo_1223 | 22 |
| LINC00973 | 22 |
|
linc-ANKRD20A1-20 | 22 |
| linc-NBPF15-1 | 22 |
| uc003flo.2 | 22 |
|
linc-ANKRD20A1-14 | 21 |
| linc-DUSP10-7 | 21 |
| linc-FOXB2-3 | 21 |
| linc-WISP3-2 | 21 |
Discussion
AGPS is an enzyme that converts
acylglycerol-3-phosphate to alkylglycerol-3-phosphate, which is a
necessary step to generate all ether lipids (4). Cancer cells are known to metabolize
lipids in a manner that is different from normal cells (15). In addition, the content of ether
lipids in tumors has been discovered to be higher compared with
healthy tissues (16). Moreover, the
levels of ether lipids in malignant tumors were found to be
increased compared with non-invasive tumors, and AGPS expression
levels were also observed to be different in cancer cells (5–7).
Tumorigenicity is known to be caused by invasive cancer cells
(17), which is consistent with the
present findings. In the present study, it was identified that,
compared with the control group, AGPS silencing suppressed the
proliferation of U251 cells.
The effect of AGPS on the pathway network was
analyzed in human glioma cells by sequencing and bioinformatics
analysis, and it was discovered that AGPS silencing regulated
tumor-related signaling pathways, such as the PI3K/Akt, Toll-like
receptor, focal adhesion and VEGF signaling pathways. These
aforementioned results were further validated by RT-qPCR, where
significantly upregulated expression levels of THBS1 and ITGA11,
and downregulated expression levels of SPP1, VEGFA, EGFR, IL7R,
CXCL8, PTGS2 and SDC4, were all identified; all of these are
crucial genes involved in the aforementioned signaling pathways,
and have been found to serve roles in tumor metastasis and
angiogenesis (18–23).
lncRNAs were once considered to be a noisy byproduct
of the transcription process (24).
However, previous studies have reported that lncRNAs serve an
important role at the RNA level in regulating cell proliferation,
differentiation, the maintenance of pluripotent stem cells and
cancer pathogenesis (25,26). The present study aimed to identify
the lncRNAs associated with glioma, and subsequently used
bioinformatics to analyze the biological functions and signal
transduction pathways involved in the regulation of the lncRNAs
identified. Furthermore, a regulatory network of lncRNAs in
relation to signal transduction pathways was constructed to
identify lncRNAs in a pivotal position. For example, FENDRR is an
endothelial cell gene critical for vascular development, and it was
previously reported that FENDRR overexpression promoted the
apoptosis of human brain microvascular endothelial cells (27). Other previous studies have also
reported that FENDRR served an important regulatory role in
numerous types of malignant tumor, such as human lung, colon,
breast and liver cancer (28–30). For
example, FENDRR reduced the stem cell characteristics of non-small
cell lung cancer by inhibiting the ELAV-like protein
1/P-glycoprotein axis; and FENDRR was also discovered to inhibit
Sox4 protein expression, which slowed the progression of colon
cancer (31). However, to the best
of our knowledge, there has been no previous research conducted on
the role of FENDRR in glioma. In the present study, the expression
levels of FENDRR in the AGPS-silenced groups were significantly
upregulated compared with the control group, indicating that the
expression levels of FENDRR may be negatively associated with the
degree of glioma malignancy. However, the role of FENDRR in glioma
cells and its related mechanisms requires further
investigation.
It has been revealed that the expression levels of
the lncRNA-PTPRN2 in the brains of mice treated with a
neuroprotective preparation of trans-resveratrol were significantly
downregulated compared with mice fed the standard diet (32). Notably, a previous study suggested
that the lncRNA-PTPRN2, which had a pivotal position in the pathway
regulatory network, may be involved in the regulation of cell
adhesion molecules by regulating the expression levels of
intercellular adhesion molecule-1 and signal transduction pathways,
such as advanced glycation end products/receptor for advanced
glycosylation end products, NF-κB and tumor necrosis factor
(33). It was reported that also
found that lncRNA AK093732 was an important site and highest
Degree. In a previous study, lncRNA AK093732 was increased in
laryngeal squamous cell carcinoma and considered a potential
biomarker (34). However, further
research is required to identify the regulatory mechanisms of
PTPRN2 and AK093732 in these signaling pathways.
In conclusion, the present study analyzed the
association and role of AGPS with the expression levels of lncRNAs
and mRNAs in glioma. It was discovered that the identified
differentially expressed lncRNAs and co-expressed mRNAs may serve
important biological roles in the development, progression and
metastasis of gliomas. Furthermore, the pathway networks identified
also provide a reference and direction for further studies into the
regulatory mechanisms of important lncRNAs in glioma and their
associated signaling pathways.
Acknowledgements
Not applicable.
Funding
The present study was supported by the Special
Program of Talent Development for Excellent Youth Scholars in
Tianjin, China (grant no. TJTZJH-QNBJRC-2-9), the Natural Science
Foundation of Tianjin (grant no. 16JCQNJC11500) and the Science and
Technology Development Fund of Bengbu Medical College (grant no.
BYKF1783).
Availability of data and materials
All data generated or analyzed during this study are
included in this published article.
Authors' contributions
YZ was responsible for the conception and design of
the study. LC and WZ were responsible for acquisition of data. LH
and LJ were responsible for data interpretation. LQ was responsible
for cellular and molecular experiments. All authors read and
approved the final manuscript.
Ethics approval and consent to
participate
Not applicable.
Patient consent for publication
Not applicable.
Competing interests
The authors declare that they have no competing
interests.
References
|
1
|
Ferris SP, Hofmann JW, Solomon DA and
Perry A: Characterization of gliomas: From morphology to molecules.
Virchows Arch. 2:257–269. 2017. View Article : Google Scholar
|
|
2
|
Benjamin Daniel I, Cravatt Benjamin F and
Nomura Daniel K: Global profiling strategies for mapping
dysregulated metabolic pathways in cancer. Cell Metab. 5:565–577.
2012. View Article : Google Scholar
|
|
3
|
Piano V, Benjamin DI, Valente S, Nenci S,
Marrocco B, Mai A, Aliverti A, Nomura DK and Mattevi A: Discovery
of inhibitors for the ether lipid-generating enzyme AGPS as
anti-cancer agents. ACS Chem Biol. 11:2589–2597. 2015. View Article : Google Scholar
|
|
4
|
Benjamin DI, Cozzo A, Ji X, Roberts LS,
Louie SM, Mulvihill MM, Luo K and Nomura DK: Ether lipid generating
enzyme AGPS alters the balance of structural and signaling lipids
to fuel cancer pathogenicity. Proc Natl Acad Sci USA.
110:14912–14917. 2013. View Article : Google Scholar : PubMed/NCBI
|
|
5
|
Hou S, Tan J, Yang B, He L and Zhu Y:
Effect of alkylglycerone phosphate synthase on the expression
profile of circRNAs in the human thyroid cancer cell line FRO.
Oncol Lett. 15:7889–7899. 2018.PubMed/NCBI
|
|
6
|
Stazi G, Battistelli C, Piano V, Mazzone
R, Marrocco B, Marchese S, Louie SM, Zwergel C, Antonini L,
Patsilinakos A, et al: Development of alkyl glycerone phosphate
synthase inhibitors: Structure-activity relationship and effects on
ether lipids and epithelial-mesenchymal transition in cancer cells.
Eur J Med Chem. 163:722–735. 2019. View Article : Google Scholar : PubMed/NCBI
|
|
7
|
Zhu Y, Zhu L, Lu L, Zhang L, Zhang G, Wang
Q and Yang P: Role and mechanism of the alkylglycerone phosphate
synthase in suppressing the invasion potential of human glioma and
hepatic carcinoma cells in vitro. Oncol Rep. 32:431–436.
2014. View Article : Google Scholar : PubMed/NCBI
|
|
8
|
Jarroux J, Morillon A and Pinskaya M:
History, discovery, and classification of lncRNAs. Adv Exp Med
Biol. 1008:1–46. 2017. View Article : Google Scholar : PubMed/NCBI
|
|
9
|
Jiang X, Yan Y, Hu M, Chen X, Wang Y, Dai
Y, Wu D, Wang Y, Zhuang Z and Xia H: Increased level of H19 long
noncoding RNA promotes invasion, angiogenesis, and stemness of
glioblastoma cells. J Neurosurg. 2016:129–136. 2016. View Article : Google Scholar : PubMed/NCBI
|
|
10
|
Lim W and Kim HS: Exosomes as therapeutic
vehicles for cancer. Tissue Eng Regen Med. 16:213–223. 2019.
View Article : Google Scholar : PubMed/NCBI
|
|
11
|
Livak KJ and Schmittgen TD: Analysis of
relative gene expression data using real-time quantitative PCR and
the 2(-Delta Delta C(T)) method. Methods. 25:402–408. 2001.
View Article : Google Scholar : PubMed/NCBI
|
|
12
|
Noman MZ, Hasmim M, Messai Y, Terry S,
Kieda C, Janji B and Chouaib S: Hypoxia: A key player in antitumor
immune response. A review in the theme: Cellular responses to
hypoxia. Am J Physiol Cell Physiol. 309:C569–C579. 2015. View Article : Google Scholar : PubMed/NCBI
|
|
13
|
Pickup MW, Mouw JK and Weaver VM: The
extracellular matrix modulates the hallmarks of cancer. EMBO Rep.
15:1243–1253. 2014. View Article : Google Scholar : PubMed/NCBI
|
|
14
|
Soni H, Bode J, Nguyen CDL, Puccio L,
Neßling M, Piro RM, Bub J, Phillips E, Ahrends R, Eipper BA, et al:
PERK-mediated expression of peptidylglycine α-amidating
monooxygenase supports angiogenesis in glioblastoma. Oncogenesis.
9:182020. View Article : Google Scholar : PubMed/NCBI
|
|
15
|
Wood R and Snyder F: Characterization and
identification of glyceryl ether diesters present in tumor cells. J
Lipid Res. 8:494–500. 1967.PubMed/NCBI
|
|
16
|
Jaffrès PA, Gajate C, Bouchet AM,
Couthon-Gourvès H, Chantôme A, Potier-Cartereau M, Besson P,
Bougnoux P, Mollinedo F and Vandier C: Alkyl ether lipids, ion
channels and lipid raft reorganization in cancer therapy. Pharmacol
Ther. 165:114–131. 2016. View Article : Google Scholar : PubMed/NCBI
|
|
17
|
Li Y, Han X, Feng H and Han J: Long
noncoding RNA OIP5-AS1 in cancer. Clin Chim Acta. 499:75–80. 2019.
View Article : Google Scholar : PubMed/NCBI
|
|
18
|
Shen J, Cao B, Wang Y, Ma C, Zeng Z, Liu
L, Li X, Tao D, Gong J and Xie D: Hippo component YAP promotes
focal adhesion and tumour aggressiveness via transcriptionally
activating THBS1/FAK signalling in breast cancer. J Exp Clin Cancer
Res. 37:1752018. View Article : Google Scholar : PubMed/NCBI
|
|
19
|
Wu P, Wang Y, Wu Y, Jia Z, Song Y and
Liang N: Expression and prognostic analyses of ITGA11, ITGB4 and
ITGB8 in human non-small cell lung cancer. PeerJ. 7:e82992019.
View Article : Google Scholar : PubMed/NCBI
|
|
20
|
Jeong BY, Cho KH, Jeong KJ, Park YY, Kim
JM, Rha SY, Park CG, Mills GB, Cheong JH and Lee HY: Rab25 augments
cancer cell invasiveness through a β1 integrin/EGFR/VEGF-A/Snail
signaling axis and expression of fascin. Exp Mol Med. 50:e4352018.
View Article : Google Scholar : PubMed/NCBI
|
|
21
|
Zeng B, Zhou M, Wu H and Xiong Z: SPP1
promotes ovarian cancer progression via Integrin β1/FAK/AKT
signaling pathway. Onco Targets Ther. 11:1333–1343. 2018.
View Article : Google Scholar : PubMed/NCBI
|
|
22
|
Rhead B, Shao X, Quach H, Ghai P,
Barcellos LF and Bowcock AM: Global expression and CpG methylation
analysis of primary endothelial cells before and after TNFa
stimulation reveals gene modules enriched in inflammatory and
infectious diseases and associated DMRs. PLoS One. 15:e02308842020.
View Article : Google Scholar : PubMed/NCBI
|
|
23
|
Ni M, Liu X, Meng Z, Liu S, Jia S, Liu Y,
Zhou W, Wu J, Zhang J, Guo S, et al: A bioinformatics investigation
into the pharmacological mechanisms of javanica oil emulsion
injection in non-small cell lung cancer based on network
pharmacology methodologies. BMC Complement Med Ther. 20:1742020.
View Article : Google Scholar : PubMed/NCBI
|
|
24
|
Long Y, Wang X, Youmans DT and Cech TR:
How do lncRNAs regulate transcription? Sci Adv. 3:eaao21102017.
View Article : Google Scholar : PubMed/NCBI
|
|
25
|
Abedini P, Fattahi A, Agah S, Talebi A,
Beygi AH, Amini SM, Mirzaei A and Akbari A: Expression analysis of
circulating plasma long noncoding RNAs in colorectal cancer: The
relevance of lncRNAs ATB and CCAT1 as potential clinical hallmarks.
J Cell Physiol. 234:22028–22033. 2019. View Article : Google Scholar : PubMed/NCBI
|
|
26
|
Liang WC, Ren JL, Wong CW, Chan SO, Waye
MM, Fu WM and Zhang JF: LncRNA-NEF antagonized epithelial to
mesenchymal transition and cancer metastasis via cis-regulating
FOXA2 and inactivating Wnt/β-catenin signaling. Oncogene.
37:1445–1456. 2018. View Article : Google Scholar : PubMed/NCBI
|
|
27
|
Wang B, Xian J, Zang J, Xiao L, Li Y, Sha
M and Shen M: Long non-coding RNA FENDRR inhibits proliferation and
invasion of hepatocellular carcinoma by down-regulating glypican-3
expression. Biochem Biophys Res Commun. 509:143–147. 2019.
View Article : Google Scholar : PubMed/NCBI
|
|
28
|
Zhang G, Han G, Zhang X, Yu Q, Li Z, Li Z
and Li J: Long non-coding RNA FENDRR reduces prostate cancer
malignancy by competitively binding miR-18a-5p with RUNX1.
Biomarkers. 23:435–445. 2018. View Article : Google Scholar : PubMed/NCBI
|
|
29
|
Liu J and Du W: LncRNA FENDRR attenuates
colon cancer progression by repression of SOX4 protein. Onco
Targets Ther 12: 4287-4295, 2019; Li Y, Zhang W, Liu P, Xu Y, Tang
L, Chen W and Guan X: Long non-coding RNA FENDRR inhibits cell
proliferation and is associated with good prognosis in breast
cancer. Onco Targets Ther. 11:1403–1412. 2018.PubMed/NCBI
|
|
30
|
Xu R and Han Y: Long non-coding RNA FOXF1
adjacent non-coding developmental regulatory RNA inhibits growth
and chemotherapy resistance in non-small cell lung cancer. Arch Med
Sci. 15:1539–1546. 2019. View Article : Google Scholar : PubMed/NCBI
|
|
31
|
Gong F, Dong D, Zhang T and Xu W: Long
non-coding RNA FENDRR attenuates the stemness of non-small cell
lung cancer cells via decreasing multidrug resistance gene 1 (MDR1)
expression through competitively binding with RNA binding protein
HuR. Eur J Pharmacol. 853:345–352. 2019. View Article : Google Scholar : PubMed/NCBI
|
|
32
|
Navarro G, Martínez-Pinilla E,
Sánchez-Melgar A, Ortiz R, Noé V, Martín M, Ciudad C and Franco R:
A genomics approach identifies selective effects of
trans-resveratrol in cerebral cortex neuron and glia gene
expression. PLoS One. 12:e01760672017. View Article : Google Scholar : PubMed/NCBI
|
|
33
|
Lee EJ, Rath P, Liu J, Ryu D, Pei L,
Noonepalle SK, Shull AY, Feng Q, Litofsky NS, Miller DC, et al:
Identification of global DNA methylation signatures in
glioblastoma-derived cancer stem cells. J Genet Genomics.
42:355–371. 2015. View Article : Google Scholar : PubMed/NCBI
|
|
34
|
Shen Z, Li Q, Deng H, Lu D, Song H and Guo
J: Long non-coding RNA profiling in laryngeal squamous cell
carcinoma and its clinical significance: Potential biomarkers for
LSCC. PLoS One. 9:e1082372014. View Article : Google Scholar : PubMed/NCBI
|