Introduction
Lung cancer (1) is
one of the most frequently diagnosed cancers nowadays, with high
morbidity and mortality (2), which
poses a great threat to human health and life. There is small cell
lung cancer (SCLC) and non-small cell lung cancer (NSCLC), with the
latter accounting for 80% of the total (3). Most lung cancer patients are diagnosed
at moderate or even advanced stage, with low survival rate. The
median survival of patients with untreated metastatic NSCLC is only
4–5 months and the 1-year survival rate is only 10% (4). In the treatment of advanced NSCLC,
chemotherapy has very little effect on relieving the symptoms and
improving survival (5). Although it
has been reported (6) that the
combined immune checkpoint blockade has promising benefits for lung
cancer, the predictors of response to combined therapy are unclear,
and combined immunotherapy cannot overcome the negative predictive
impact of high tumor mutation burden. With the development of
medical science and technology, targeted therapy has been widely
accepted, which facilitates the diagnosis and treatment of NSCLC
(7).
miRNA is a kind of small non-coding RNA of ~22
nucleotides (8,9). Studies have shown that abnormal
expression of miRNAs can lead to the occurrence and development of
human malignant tumors (10–12). In recent years, it has been reported
that miR-218-1-3p, as an important member of miRNAs, can inhibit
the proliferation of lung cancer cells, block their cell cycle and
promote apoptosis (13). In
addition, it has been demonstrated that the expression of miR-149
is commonly downregulated in various malignancies, including oral
squamous cell carcinoma (14),
prostate cancer (15) and colorectal
cancer (16), which can inhibit the
invasion and migration of related cancer cells (17–19).
There are also studies that have shown that lower miR-218-1-3p
expression in lung cancer cells (20) and the overexpression of miR-218 can
inhibit the migration and invasion of NSCLC cells, but do not
affect cell growth (21). Therefore,
the effects of miR-218-1-3p and miR-149 on A549 cell apoptosis were
explored in the present study.
Patients and methods
Patients
Paired NSCLC and adjacent normal tissues were
obtained from 50 patients who underwent NSCLC resection in Shandong
Provincial Chest Hospital Affiliated to Shandong University (Jinan,
China) between April 2015 and May 2018. There were 33 males and 17
females, with an average age of 56.28±7.32 years. The inclusion
criteria were as follows: Patients diagnosed with NSCLC, without
other major diseases, with complete medical history and follow-up
information available. The exclusion criteria were as follows:
Patients who had undergone chemoradiotherapy before surgery, with
blood diseases or severe liver and kidney dysfunction. The study
was approved by the Medical Ethics Committee of the Shandong
Provincial Chest Hospital Affiliated to Shandong University
(SPCASU1903). Written informed consents were obtained from all
patients or their legal guardians. The study is in line with the
requirements for human studies (22).
Main reagents, instruments and
detection methods
Main reagents
Human lung adenocarcinoma A549 cell line was
purchased from Shanghai Huzhen Biological Technology Co., Ltd.
Apoptosis detection kit was purchased from Shanghai Meilian
Biotechnology Co., Ltd. DMEM was purchased from Shanghai Rhawn
Chemical Technology Co., Ltd. Fetal bovine serum (10%; FBS) was
purchased from Serana Europe GmbH. TRIzol® reagent was
purchased from Shanghai Yuduo Biotechnology Co., Ltd., and
Lipofectamine™ 3000 was purchased from Tideradar Beijing Technology
Co., Ltd. The primer sequences and transfected plasmid synthesis of
miR-218-1-3p, miR-149 and internal reference U6 were purchased from
Shanghai Xinghan Biotechnology Co., Ltd.
miR-218-1-3p and miR-149 detection
The expression levels of miR-218-1-3p and miR-149 in
NSCLC and adjacent tissues were detected by reverse
transcription-quantitative PCR (RT-qPCR). Total RNA was extracted
by TRIzol® reagent (Shanghai Yuduo Biotechnology Co.,
Ltd.) according to the manufacturer's protocol. RNA was reverse
transcribed into cDNA using TaqMan Reverse Transcription kit
(4366596; Hangzhou Woosen Biotechnology Co., Ltd.) following the
manufacturer's instructions. U6 was set as the internal control,
and the expression levels of miR-218-1-3p and miR-149 were detected
using specific primers of miR-218-1-3p and miR-149 in an ABI 7900HT
fluorescence quantitative PCR instrument (Shanghai PuDi
Biotechnology Co., Ltd.) according to the manufacturer's
instructions. qPCR conditions were as follows: 94°C for 10 sec,
94°C for 5 sec, 52°C for 30 sec, 72°C for 15 sec, for a total of 40
cycles. Three replicates were set for each experiment, and the
experiment was repeated three times. The experimental results were
analyzed using a relative quantitative method, and the expression
levels of miR-218-1-3p and miR-149 were quantified using the
2−ΔCq method (23).
Primer sequences are shown in Table
I.
 | Table I.List of primer sequences. |
Table I.
List of primer sequences.
| Gene | Upstream primers | Downstream
primers |
|---|
| miR-218-1-3p |
5′-ACAUGGUUAGAUCAAGCACAA-3′ |
5′-UUGUACUACACAAAAGUACUG-3′ |
| miR-149 |
5′-UCUGGCUCCGUGUCUUCACUCCC-3′ |
5′-UUCUCCGAACGUGUCACGU-3′ |
| U6 |
5′-CTCGCTTCGGCAGCACA-3′ |
5′-AACGCTTCACGAATTTGCGT-3′ |
Cell culture and transfection
High-glucose DMEM containing 10% FBS was used for
routine passage culture in an incubator with 5% CO2 at
37°C. The A549 cells were seeded into 6-well plates, and divided
into blank group, negative control (NC) group (empty plasmid, 100
nM), miR-218-1-3p mimic group (miR-218-1-3p-shRNA, 100 nM), and
miR-149 mimic group (miR-149-shRNA, 100 nM) before transfection.
Transfection was then performed on the above four groups using
Lipofectamineä 2000 kit, according to the manufacturer's protocol,
and the expression levels of miR-218-1-3p and miR-149 in the
transfected A549 cells were detected. All plasmids were purchased
from HedgehogBio Science and Technology, Ltd. The medium was
changed 24 h after transfection and then the cells were further
cultured for 48 h and collected.
Cell growth detection
Four groups of transfected A549 cells were
inoculated into 96-well plates, respectively, and three multiple
wells were set in each well. Cell proliferation colorimetric
reagent (CCK-8) was added into the wells (20 µl in each well) 2 h
before the different time points of culture (24, 48, and 72 h), and
then the plates were placed in a cell incubator with 5%
CO2 at 37°C. After the cell culture, proliferation was
analyzed by measuring the absorbance (OD value) at a wavelength of
490 nm using a fully automated enzyme-labeling instrument (Image
Trading Co., Ltd.).
Detection of cell migration and invasion
Cells were digested with trypsin, resuspended in
serum-free medium, and then 200 µl of the resuspended solution were
used for the determination of cell migration. A total of
5×10⁴ cells were plated in the upper chamber of
Transwell plates. Next, 200 µl of the resuspended solution,
containing ~5×10⁴ cells, were collected for the
migration experiment and medium containing 10% FBS was added to the
subcompartment of the 6-well plate. Following incubation for 24 h
at 37°C, the cells in the upper chamber of Transwell assay were
wiped off with a cotton swab, whereas the cells that migrated to
the lower chamber were stained with 4% paraformaldehyde and 0.1%
crystal violet for 15 min. After the Transwell chamber was dried,
the membrane was sealed and the penetrating cells were observed and
counted under an optical microscope (×200). The experiment was
repeated three times. The invasion assay was performed following
the aforementioned steps using 8% Matrigel.
Apoptosis detection
Cell apoptosis was detected using an apoptosis
detection kit in accordance with the manufacturer's instructions.
The cells that had been transfected for 48 h in the 6-well plates
and were stained with Annexin V and propidium iodide were detected
by a BD flow cytometer (BD Biosciences), and the experiment was
repeated three times. The apoptosis rate was analyzed using FlowJo
v10 software (FlowJo LLC).
Statistical analysis
SPSS 22.0 software (IBM Corp.) was used for the
statistical analysis of the experimental data. t-test was used for
the comparison of the measurement data which were expressed as the
mean ± standard deviation (mean ± SD). ANOVA (F analysis) was
applied for multiple group comparisons, whereas repeated measures
ANOVA was used for intra-group comparisons among different time
points. P<0.05 was considered to indicate a statistically
significant difference.
Results
Expression levels of miRNA-218-1-3p
and miRNA-149 in NSCLC and adjacent tissues
The expression levels of miR-218-1-3p in NSCLC and
adjacent tissues were 0.59±0.06 and 1.58±0.10 µg/ml, respectively,
whereas the expression levels of miR-149 were 2.88±0.80 and
4.98±1.34 µg/ml, respectively. miR-218-1-3p and miR-149 expression
levels were significantly lower in NSCLC tissues than those in
adjacent tissues (P<0.001), as shown in Table II.
| Table II.Expression levels of miR-218-1-3p and
miR-149 in NSCLC and adjacent tissues. |
Table II.
Expression levels of miR-218-1-3p and
miR-149 in NSCLC and adjacent tissues.
| Factor | NSCLC tissues
(n=50) | Adjacent tissues
(n=50) | t | P-value |
|---|
| miR-218-1-3p | 0.59±0.06 | 1.58±0.10 | 60.03 | <0.001 |
| miR-149 | 2.88±0.80 | 4.98±1.34 | 9.515 | <0.001 |
Relative expression levels of
miR-218-1-3p and miR-149 in each group of cells after transfection
with the mimic vector
The expression levels of miR-218-1-3p in the
miR-218-1-3p mimic, NC and blank groups were 2.67±0.21, 0.58±0.05
and 0.58±0.06 µg/ml, respectively, and miR-218-1-3p expression in
the miR-218-1-3p mimic group was significantly higher than that in
the other two groups (P<0.05) (Table III). In addition, the expression
levels of miR-149 in the miRNA-149 mimic, NC and blank groups were
5.03±0.20, 2.86±0.77 and 2.87±0.80 µg/ml, respectively, and the
miR-149 expression in the miR-149 mimic group was significantly
higher than that in the NC and blank groups (P<0.05). There was
no significant difference in the expression levels of miR-218-1-3p
and miR-149 between the NC and blank groups (P>0.05) (Table IV). These results indicated that
miR-218-1-3p and miR-149 were successfully upregulated in A549
cells after transfection with mimic.
| Table III.miR-218-1-3p expression in each group
after transfection. |
Table III.
miR-218-1-3p expression in each group
after transfection.
| Factor | miR-218-1-3p mimic
group | NC group | Blank group | F | P-value |
|---|
| miR-218-1-3p | 2.67±0.21 |
0.58±0.05a |
0.58±0.06a | 4,351.00 | <0.001 |
| Table IV.miR-149 expression in each group after
transfection. |
Table IV.
miR-149 expression in each group after
transfection.
| Factor | miR-149 mimic
group | NC group | Blank group | F | P-value |
|---|
| miR-149 | 5.03±0.20 |
2.86±0.77a |
2.87±0.80a | 183.30 | <0.001 |
Comparison of the cell growth of human
adenocarcinoma cells A549 at different time points
A549 cell growth in the miR-218-1-3p mimic, NC
and blank groups at different time points
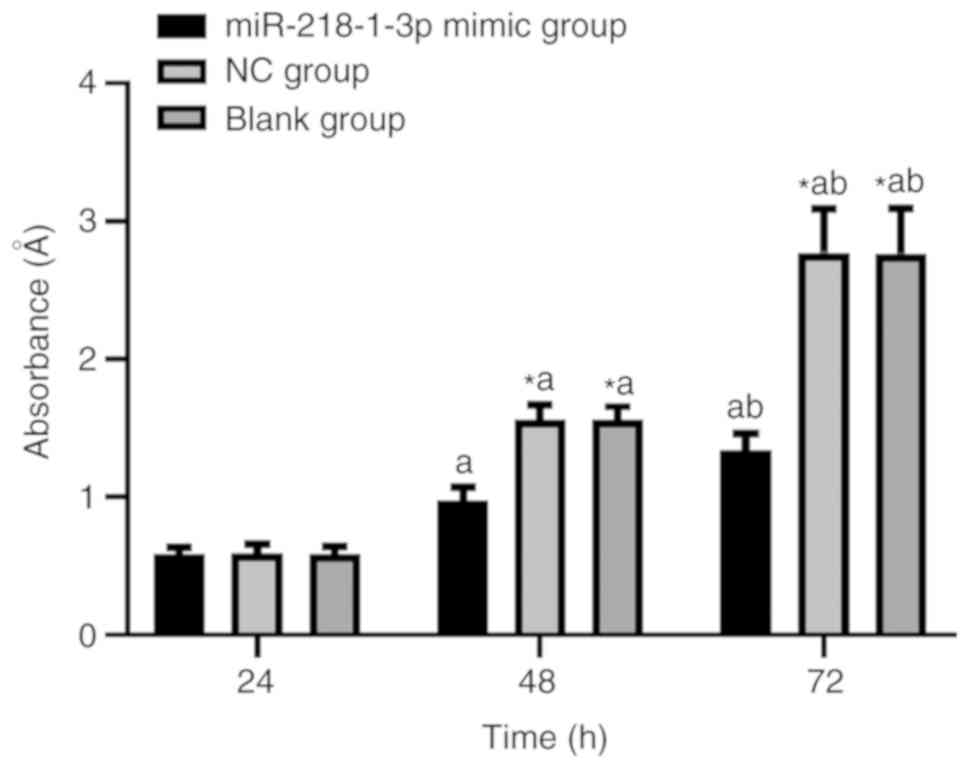
As shown in Table V
and Fig. 1, there was no significant
difference in the growth of A549 cells among the three groups at 24
h (P>0.05), whereas at 48 and 72 h, the growth of A549 cells in
the miR-218-1-3p mimic group was significantly lower than that in
the NC and the blank groups (P<0.05). Within each group, there
were significant differences in the cell growth of A549 cells at
24, 48 and 72 h (P<0.05).
| Table V.Growth of A549 cells in the
miR-218-1-3p mimic, NC and blank groups at different time
points. |
Table V.
Growth of A549 cells in the
miR-218-1-3p mimic, NC and blank groups at different time
points.
| Time (h) | miR-218-1-3p mimic
group | NC group | Blank group | F | P-value |
|---|
| 24 | 0.58±0.05 | 0.59±0.07 | 0.58±0.06 | 0.454 | 0.635 |
| 48 |
0.97±0.10a |
1.56±0.11a,c |
1.56±0.10a,c | 542.2 | <0.001 |
| 72 |
1.34±0.12a,b |
2.78±0.32a–c |
2.77±0.33a–c | 456.2 | <0.001 |
A549 cell growth in the miR-149 mimic, NC and
blank groups at different time points
The results demonstrated that the growth of A549
cells in the miR-149 mimic, NC and blank groups had no significant
difference at 24 h (P>0.05), whereas the growth of A549 cells in
the miR-149 mimic group was significantly lower than that in NC and
blank groups at 48 and 72 h (P<0.05). Within each group, there
were significant differences in the cell growth of A549 cells at
24, 48 and 72 h (P<0.05). Details are shown in Table VI and Fig. 2.
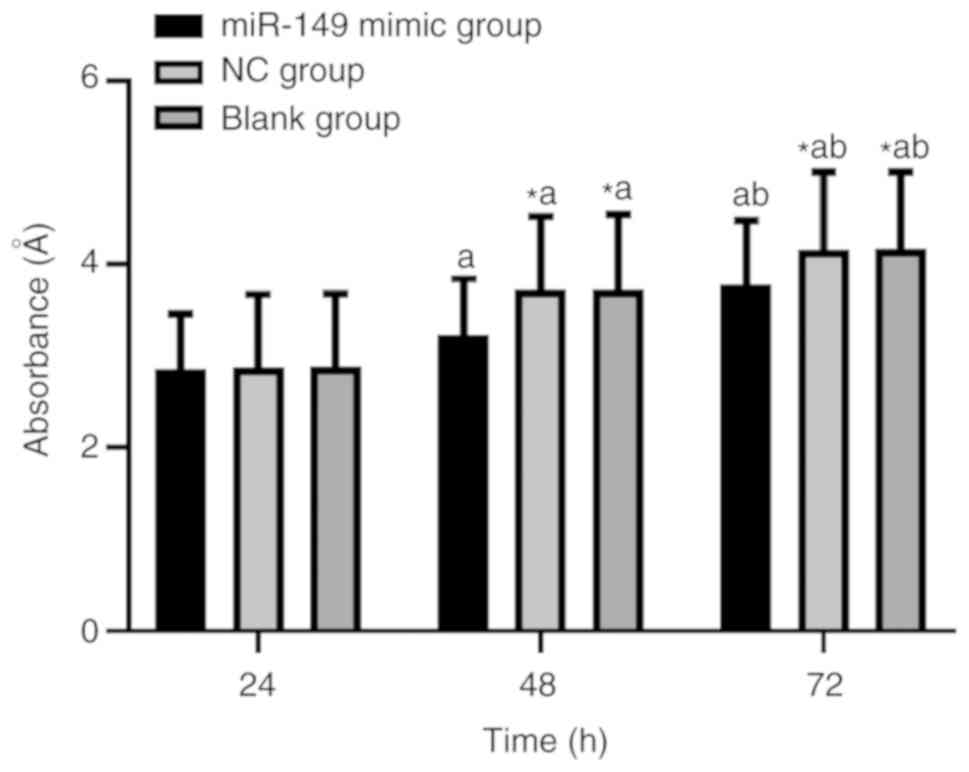 | Figure 2.A549 cell growth after miR-149
upregulation. At 24 h, the growth of A549 cells among the miR-149
mimic, NC and blank groups showed no significant difference
(P>0.05); whereas, at 48 and 72 h, the growth of A549 cells in
miR-149 mimic group was significantly lower than that in the NC and
blank groups (P<0.05). Intra-group comparisons showed
significant differences in the growth of A549 cells at 24, 48 and
72 h in the miR-149 mimic, NC and blank groups (P<0.05).
Inter-group comparisons at the same time point: *P<0.05,
compared with the miR-218-1-3p mimic group. Intra-group comparisons
between different time points: aP<0.05, compared with
the growth of A549 cells at 24 h; bP<0.05, compared
with the growth of A549 cells at 48 h. NC, negative control. |
| Table VI.Growth of A549 cells in the miR-149
mimic, NC and blank groups at different time points. |
Table VI.
Growth of A549 cells in the miR-149
mimic, NC and blank groups at different time points.
| Time (h) | miR-149 mimic
group | NC group | Blank group | F | P-value |
|---|
| 24 | 2.86±0.60 | 2.87±0.80 | 2.88±0.80 | 0.009 | 0.991 |
| 48 |
3.23±0.62a |
3.72±0.83a,c |
3.72±0.82a,c | 6.943 | <0.05 |
| 72 |
3.78±0.70a,b |
4.16±0.85a–c |
4.17±0.84a–c | 3.866 | <0.05 |
Comparison of A549 cell invasion among
groups
The number of invasive cells in the miR-218-1-3p
mimic, miR-149 mimic, NC and blank control groups were 80.56±7.25,
81.34±6.98, 136.93±10.23, and 139.78±11.98, respectively. The
number of invasive cells in the miR-218-1-3p mimic and miR-149
mimic groups was significantly lower than that of the blank and NC
groups, with statistically significant differences (P<0.05, as
shown in Table VII.
| Table VII.Invasion of A549 cells in each
group. |
Table VII.
Invasion of A549 cells in each
group.
| Index | miR-218-1-3p mimic
group (n=50) | miR-149 mimic group
(n=50) | NC group
(n=50) | Blank group
(n=50) | F | P-value |
|---|
| No. of invasive
cells | 80.56±7.25 | 81.34±6.98 |
136.93±10.23a,b |
139.78±11.98a,b | 629.50 | <0.001 |
Comparison of A549 cell apoptosis after
transfection among groups
The apoptotic rates in miR-218-1-3p mimic and
miR-149 mimic groups were 26.34±2.12 and 25.74±3.95%, respectively,
which were significantly higher than those in the NC group
(4.63±0.40%) and blank group (4.56±0.37%) (P<0.05). The
apoptotic rates of NC group and blank group showed no significant
difference (P>0.05). Details are shown in Table VIII.
| Table VIII.Apoptosis of A549 cells after
transfection in each group. |
Table VIII.
Apoptosis of A549 cells after
transfection in each group.
| Index | miR-218-1-3p mimic
group (n=50) | miR-149 mimic group
(n=50) | NC group
(n=50) | Blank group
(n=50) | F | P-value |
|---|
| Apoptotic rate
(%) | 26.34±2.12 | 25.74±3.95 |
4.63±0.40a,b |
4.56±0.37a,b | 1,504.00 | <0.001 |
Discussion
As one of the most common malignant tumors, lung
cancer can be divided into SCLC and NSCLC (24), with the latter presenting slower
growth, slower proliferation and later metastasis, while
characterized by high mortality and morbidity (25). Therefore, NSCLC has also been
clinically treated by inhibiting the proliferation and migration of
cancer cells.
MicroRNAs are non-coding small RNAs related to
proto-oncogenes, whose abnormal expression results in continuous
proliferation or spread and migration of cancer cells eventually
leading to death. A previous study has demonstrated that miRNAs
could inhibit the expression of important cancer-associated genes
and therefore might prove to be useful in the diagnosis and
treatment of cancer (26). On this
basis, the effects of miR-218-1-3p and miR-149, as important
members of the miRNA family, on the proliferation, invasion and
apoptosis of NSCLC cells were explored in the present study.
The expression levels of miR-218-1-3p and miR-149 in
NSCLC and adjacent tissues were investigated. The results showed
that the expression levels of miR-218-1-3p and miR-149 in NSCLC
tissues were significantly lower than those in adjacent tissues,
suggesting that miR-218-1-3p and miR-149 were downregulated in
NSCLC. Ke et al (27) also
reported that deletion of miR-149 would lead to increased
expression of oncogenes, in consistency with the results of the
present study. The relative expression levels of miR-218-1-3p and
miR-149 in each group after transfection were also determined.
miR-218-1-3p expression in miR-218-1-3p mimic group was
significantly higher than that of the NC and blank groups, and
miR-149 expression in the miR-149 mimic group was also
significantly higher than that in the NC and blank groups. These
results suggest that miR-218-1-3p could be upregulated to inhibit
the proliferation of cancer cells in the treatment of NSCLC, in
agreement with the results of a previous study (28). In addition, miR-149 could also
inhibit the proliferation and migration of cancer cells through
upregulation. In a preceding study (29), the downregulation of miR-149 was
reported in NSCLC, which was roughly the same with the results of
the present study. Furthermore, in the same study, the clinical
significance of miR-149 in NSCLC was further investigated and the
expression of miR-149 was shown to be negatively correlated with
tumor size. Also, the 3-year survival rates of patients with
different miR-149 expression levels were compared and the results
indicated that the patients with poor survival had low miR-149
expression. All these results suggested that upregulation of
miR-218-1-3p and miR-149 expression levels could inhibit the
proliferation of cancer cells. In the present study, the growth,
migration, invasion and apoptosis of human lung adenocarcinoma
cells A549 were also studied and compared among the different
groups. The results revealed that the growth of A549 cells in the
miR-218-1-3p mimic and miR-149 mimic groups was significantly lower
than that in the NC and blank groups. Regarding cell invasion, the
number of invasive cells in the miR-218-1-3p mimic and the miR-149
mimic groups was significantly lower than that in the blank and the
NC groups. As to the apoptosis of human lung adenocarcinoma cells
A549, the apoptotic rates in the miR-218-1-3p mimic and miR-149
mimic groups were significantly higher than those in the NC and
blank groups, indicating that upregulation of miR-218-1-3p and
miR-149 could inhibit the growth and invasion of A549 cells and
promote their apoptosis in NSCLC. Chen et al (30) used Transwell assay to detect the
changes of cell migration and invasion after transfection. The
results showed that inhibited expression of miRNA-218-1-3p could
significantly enhance the migration and invasion of A549 cells,
which was roughly in line with the findings of the present study.
Chen et al (30) also used
bioinformatics analysis and showed that miR-218 affected the
migration and invasion of cancer cells through high expression, as
the result of direct targeting of Robo1.
The present study has also some limitations. The
correlation between miR-218-1-3p and miR-149 expression in the
development of tumors was not investigated and no relevant research
was conducted on drug resistance. These will be the aim of our
future research.
In conclusion, miR-218-1-3p and miR-149 were both
lowly expressed in NSCLC and upregulation of their expression could
inhibit the proliferation and promote the apoptosis of A549 cells
facilitating treatment. Thus, miR-218-1-3p and miR-149 could serve
as potential markers for the diagnosis and prognosis of NSCLC, and
as targeted sites for the treatment of NSCLC, providing a new
direction for the clinical treatment and a theoretical basis for
further research on new targets of gene therapy for NSCLC.
Acknowledgements
Not applicable.
Funding
No funding was received.
Availability of data and materials
The datasets used and/or analyzed during the present
study are available from the corresponding author on reasonable
request.
Authors' contributions
PG wrote the manuscript. PG and MS performed RT-qPCR
and CCK-8 assay. HL and LJ were responsible for the Transwell assay
and flow cytometry. NY and YS contributed to the statistical
analysis of the data. All authors read and approved the final
version of the manuscript.
Ethics approval and consent to
participate
The study was approved by the Medical Ethics
Committee of the Shandong Provincial Chest Hospital Affiliated to
Shandong University (SPCASU1903; Jinan, China). Patients who
participated in this research had complete clinical data and
written informed consents were obtained from all the patients or
their legal guardians.
Patient consent for publication
Not applicable.
Competing interests
The authors declare that they have no competing
interests.
References
|
1
|
Torre LA, Siegel RL and Jemal A: Lung
cancer statistics. Adv Exp Med Biol. 893:1–19. 2016. View Article : Google Scholar : PubMed/NCBI
|
|
2
|
Hirsch FR, Scagliotti GV, Mulshine JL,
Kwon R, Curran WJ Jr, Wu YL and Paz-Ares L: Lung cancer: Current
therapies and new targeted treatments. Lancet. 389:299–311. 2017.
View Article : Google Scholar : PubMed/NCBI
|
|
3
|
Oser MG, Niederst MJ, Sequist LV and
Engelman JA: Transformation from non-small-cell lung cancer to
small-cell lung cancer: Molecular drivers and cells of origin.
Lancet Oncol. 16:e165–e172. 2015. View Article : Google Scholar : PubMed/NCBI
|
|
4
|
Schiller JH, Harrington D, Belani CP,
Langer C, Sandler A, Krook J, Zhu J and Johnson DH; Eastern
Cooperative Oncology Group, : Comparison of four chemotherapy
regimens for advanced non-small-cell lung cancer. N Engl J Med.
346:92–98. 2002. View Article : Google Scholar : PubMed/NCBI
|
|
5
|
Shepherd FA, Rodrigues Pereira J, Ciuleanu
T, Tan EH, Hirsh V, Thongprasert S, Campos D, Maoleekoonpiroj S,
Smylie M, Martins R, et al: Erlotinib in previously treated
non-small-cell lung cancer. N Engl J Med. 353:123–132. 2005.
View Article : Google Scholar : PubMed/NCBI
|
|
6
|
Hellmann MD, Nathanson T, Rizvi H, Creelan
BC, Sanchez-Vega F, Ahuja A, Ni A, Novik JB, Mangarin LMB,
Abu-Akeel M, et al: Genomic features of response to combination
immunotherapy in patients with advanced non-small-cell lung cancer.
Cancer Cell. 33:843–852.e4. 2018. View Article : Google Scholar : PubMed/NCBI
|
|
7
|
Sequist LV, Bell DW, Lynch TJ and Haber
DA: Molecular predictors of response to epidermal growth factor
receptor antagonists in non-small-cell lung cancer. J Clin Oncol.
25:587–595. 2007. View Article : Google Scholar : PubMed/NCBI
|
|
8
|
Bartel DP: MicroRNAs: Genomics,
biogenesis, mechanism, and function. Cell. 116:281–297. 2004.
View Article : Google Scholar : PubMed/NCBI
|
|
9
|
Carthew RW and Sontheimer EJ: Origins and
mechanisms of miRNAs and siRNAs. Cell. 136:642–655. 2009.
View Article : Google Scholar : PubMed/NCBI
|
|
10
|
Davidson-Moncada J, Papavasiliou FN and
Tam W: MicroRNAs of the immune system: Roles in inflammation and
cancer. Ann N Y Acad Sci. 1183:183–194. 2010. View Article : Google Scholar : PubMed/NCBI
|
|
11
|
Fabbri M: miRNAs as molecular biomarkers
of cancer. Expert Rev Mol Diagn. 10:435–444. 2010. View Article : Google Scholar : PubMed/NCBI
|
|
12
|
Zhou X, Yin C, Dang Y, Ye F and Zhang G:
Identification of the long non-coding RNA H19 in plasma as a novel
biomarker for diagnosis of gastric cancer. Sci Rep. 5:115162015.
View Article : Google Scholar : PubMed/NCBI
|
|
13
|
Wang Z, Zhao Z, Yang Y, Luo M, Zhang M,
Wang X, Liμ L, Hou N, Guo Q, Song T, et al: miR-99b-5p and
miR-203a-3p function as tumor suppressors by targeting IGF-1R in
gastric cancer. Sci Rep. 8:101192018. View Article : Google Scholar : PubMed/NCBI
|
|
14
|
Massano J, Regateiro FS, Januario G and
Ferreira A: Oral squamous cell carcinoma: Review of prognostic
andet predictive factors. Oral Surg Oral Med Oral Pathol Oral
Radiol Endod. 102:67–76. 2006. View Article : Google Scholar : PubMed/NCBI
|
|
15
|
Mohler JL, Armstrong AJ, Bahnson RR,
D'Amico AV, Davis BJ, Eastham JA, Enke CA, Farrington TA, Higano
CS, Horwitz EM, et al: Prostate cancer, version 1.2016. J Natl
Compr Canc Netw. 14:19–30. 2016. View Article : Google Scholar : PubMed/NCBI
|
|
16
|
Siegel RL, Miller KD, Fedewa SA, Ahnen DJ,
Meester RGS, Barzi A and Jemal A: Colorectal cancer statistics,
2017. CA Cancer J Clin. 67:177–193. 2017. View Article : Google Scholar : PubMed/NCBI
|
|
17
|
Xu K, Liu X, Mao X, Xue L, Wang R, Chen L
and Chu X: MicroRNA-149 suppresses colorectal cancer cell migration
and invasion by directly targeting forkhead box transcription
factor FOXM1. Cell Physiol Biochem. 35:499–515. 2015. View Article : Google Scholar : PubMed/NCBI
|
|
18
|
Kumar B, Khaleghzadegan S, Mears B, Hatano
K, Kudrolli TA, Chowdhury WH, Yeater DB, Ewing CM, Luo J, Isaacs
WB, et al: Identification of miR-30b-3p and miR-30d-5p as direct
regulators of androgen receptor signaling in prostate cancer by
complementary functional microRNA library screening. Oncotarget.
7:72593–72607. 2016. View Article : Google Scholar : PubMed/NCBI
|
|
19
|
Chen J, Chen J and Li W: MicroRNA-149
targets specificity protein 1 to suppress human tongue squamous
cell carcinoma cell proliferation and motility. Oncol Lett.
13:851–856. 2017. View Article : Google Scholar : PubMed/NCBI
|
|
20
|
Jo SJ: Identification and functional
characterization of miR-30c-2-3p, miR-218-1-3p and miR-27a-5p as
tumor suppressors in lung adenocarcinoma. 2019.
|
|
21
|
Zhang C, Ge S, Hu C, Yang N and Zhang J:
MiRNA-218, a new regulator of HMGB1, suppresses cell migration and
invasion in non-small cell lung cancer. Acta Biochim Biophys Sin
(Shanghai). 45:1055–1061. 2013. View Article : Google Scholar : PubMed/NCBI
|
|
22
|
Ormond KE, Mortlock DP, Scholes DT,
Bombard Y, Brody LC, Faucett WA, Garrison NA, Hercher L, Isasi R,
Middleton A, et al: Human germline genome editing. Am J Hum Genet.
101:167–176. 2017. View Article : Google Scholar : PubMed/NCBI
|
|
23
|
Silver N, Best S, Jiang J and Thein SL:
Selection of housekeeping genes for gene expression studies in
human reticulocytes using real-time PCR. BMC Mol Biol. 7:332006.
View Article : Google Scholar : PubMed/NCBI
|
|
24
|
Eramo A, Lotti F, Sette G, Pilozzi E,
Biffoni M, Di Virgilio A, Conticello C, Ruco L, Peschle C and De
Maria R: Identification and expansion of the tumorigenic lung
cancer stem cell population. Cell Death Differ. 15:504–514. 2008.
View Article : Google Scholar : PubMed/NCBI
|
|
25
|
Reck M, Rodriguez-Abreu D, Robinson AG,
Hui R, Csoszi T, Fulop A, Gottfried M, Peled N, Tafreshi A, Cuffe
S, et al: Pembrolizumab versus chemotherapy for PD-L1-positive
non-small-cell lung cancer. N Engl J Med. 375:1823–1833. 2016.
View Article : Google Scholar : PubMed/NCBI
|
|
26
|
Esquela-Kerscher A and Slack FJ:
Oncomirs-microRNAs with a role in cancer. Nat Rev Cancer.
6:259–269. 2006. View
Article : Google Scholar : PubMed/NCBI
|
|
27
|
Ke Y, Zhao W, Xiong J and Cao R: miR-149
inhibits non-small-cell lung cancer cells EMT by targeting FOXM1.
Biochem Res Int. 2013:5067312013. View Article : Google Scholar : PubMed/NCBI
|
|
28
|
Sun C, Li S, Zhang F, Xi Y, Wang L, Bi Y
and Li D: Long non-coding RNA NEAT1 promotes non-small cell lung
cancer progression through regulation of miR-377-3p-E2F3 pathway.
Oncotarget. 7:51784–51814. 2016. View Article : Google Scholar : PubMed/NCBI
|
|
29
|
Zhao L, Liμ L, Dong Z and Xiong J: miR-149
suppresses human non-small cell lung cancer growth and metastasis
by inhibiting the FOXM1/cyclin D1/MMP2 axis. Oncol Rep.
38:3522–3530. 2017.PubMed/NCBI
|
|
30
|
Chen P, Zhao Y and Li Y: miR-218 Inhibits
migration and invasion of lung cancer cell by regulating Robo1
expression. Zhongguo Fei Ai Za Zhi. 20:452–458. 2017.(In Chinese).
PubMed/NCBI
|