Introduction
Liver cancer is one of the leading causes of
cancer-related death worldwide (1).
Despite developments in liver cancer treatment, with improved
surgical techniques and interventional therapies, the 5-year
survival rate remains poor and the mortality rate has increased
significantly over the past 20 years (2,3). Unlike
other organs, the liver displays some potential to regenerate, but
the proliferation rate of liver cancer cells is higher compared
with that of normal liver cells due to several deregulated
signaling pathways during cancer, such as PTEN, PI3K and AKT
(4). Such deregulation occurs
throughout all stages of tumor development, which leads to
inconsistent and ineffective diagnosis and treatment of liver
cancer (5). To improve the diagnosis
and monitor the progression of liver cancer in patients, the
development of more accurate and stable biomarkers is required.
The HOX gene family is highly conserved across
species; according to the distribution of the HOX gene family in
different chromosomes, four subgroups with genomic clusters of A-D
were established (6,7). Primarily, the HOX gene family drives
normal cellular differentiation and morphogenesis in embryonic
stages, and regulates normal tissue morphology in adults (8). HOX genes have been reported to be
abnormally expressed in leukemia, breast and gastric cancer
(9,10). In addition, it has been reported that
the HOX gene family alters the occurrence and development of
malignant tumors (11), indicating
that the HOX gene family may serve as potential biomarkers of
cancer. HOXC10, a member of the HOX gene family, promotes tumor
cell migration and invasion in multiple forms of cancer, including
glioma (12), lung cancer (13), breast cancer (14,15),
thyroid cancer (16), gastric cancer
(17,18) and osteosarcoma (19). However, the role of HOXC10 in liver
cancer is not completely understood. The present study aimed to
investigate the role of HOXC10 in liver cancer, and identify the
molecular mechanisms by which HOXC10 alters the development and
progression of liver cancer.
Materials and methods
Patients and tissue sample
A total of 40 paired specimens were retrospectively
collected from patients with primary liver cancer who received
treatment at the Second Affiliated Hospital of Dalian Medical
University between January 2016 and December 2019. Samples were
collected intraoperatively and immediately snap-frozen with liquid
nitrogen. Adjacent healthy tissues were obtained ≥5 cm from the
edge of the tumor. All specimens were pathologically confirmed as
liver cancer. Comprehensive reports of all clinical and
pathological examinations were provided for each patient. The
clinical characteristics of the patients are provided in Table I. The present study was approved by
the Ethics Committee of the Second Affiliated Hospital of Dalian
Medical University (approval no. 2019.087). Written informed
consent was obtained from all the participants. Patients with a
history of tumor resection surgery, chemotherapy, radiotherapy,
second primary tumors or other malignant diseases were excluded
from the present study.
 | Table I.Association between HOXC10 expression
and clinicopathological features of liver cancer. |
Table I.
Association between HOXC10 expression
and clinicopathological features of liver cancer.
|
|
| HOXC10
expression |
|
|---|
|
|
|
|
|
|---|
| Variable | All cases | Low | High | P-value |
|---|
| Sex |
|
|
| 0.983 |
|
Male | 33 | 14 (82.4%) | 19 (82.6%) |
|
|
Female | 7 | 3 (17.6%) | 4 (17.4%) |
|
| Median age | 59.39±11.313 | 59.16±7.313 | 59.63±8.447 | 0.854 |
| Tumor size |
|
|
| 0.006 |
| ≤3
cm | 10 | 2 (8.7%) | 8 (47.1%) |
|
| >3
cm | 30 | 21 (91.3%) | 9 (52.9%) |
|
| Glisson capsule
invasion |
|
|
| 0.789 |
| No | 22 | 12 (54.5%) | 10 (58.8%) |
|
|
Yes | 18 | 10 (45.5%) | 8 (41.2%) |
|
| Tumor
differentiation |
|
|
| 0.767 |
|
Well | 2 | 1 (4.2%) | 1 (6.3%) |
|
| Poor or
moderate | 38 | 23 (95.8%) | 15 (93.8%) |
|
| Satellite
nodules |
|
|
| 0.327 |
| No | 20 | 6 (40.0%) | 14 (56.0%) |
|
|
Yes | 20 | 9 (60.0%) | 11 (44.0%) |
|
| Lymphatic
metastasis |
|
|
| 0.001 |
| No | 25 | 5 (31.3%) | 20 (83.3%) |
|
|
Yes | 15 | 7 (68.8%) | 8 (16.7%) |
|
| Distant
metastasis |
|
|
| 0.266 |
| No | 32 | 13 (72.2%) | 19 (86.4%) |
|
|
Yes | 8 | 5 (27.8%) | 3 (13.6%) |
|
| TNM stage |
|
|
| 0.005 |
| I and
II | 18 | 5 (23.8%) | 13 (68.4%) |
|
| III and
IV | 22 | 16 (76.2%) | 6 (31.6%) |
|
Cell culture and cell lines
A total of seven liver cancer cell lines (Huh7,
MHCC97-H, MHCC97-L, HepG2, Hep3B, Snu449 and PLC/PRF/5) were
obtained from American Type Culture Collection and authenticated
via STR profiling. Cells were cultured in RPMI-1640 (cat. no.
SH30027.01; HyClone; Cytiva), DMEM (cat. no. 11965118; Thermo
Fisher Scientific, Inc.) or EMEM (cat. no. 670086; Thermo Fisher
Scientific, Inc.) supplemented with 1% antibiotics (100 mg/ml
streptomycin and 100 U/ml penicillin) and 10% FBS (cat. no.
26140079; Gibco; Thermo Fisher Scientific, Inc.) at 37°C with 5%
CO2.
Western blotting
Total protein was extracted from liver cancer cells
and tissues using lysis RIPA buffer (cat. no. P0013B; Beyotime
Institute of Biotechnology) containing phosphatase and protease
inhibitors. Total protein was quantified using a standard
bicinchoninic acid protein assay kit (cat. no. 23225; Thermo Fisher
Scientific, Inc.). Proteins were diluted in 5X loading buffer (cat.
no. P0015L; Beyotime Institute of Biotechnology) and subsequently,
proteins (15 µg per lane) were separated via 10% SDS-PAGE and
transferred to PVDF membranes at 250 mA for 2 h. The membranes were
blocked with 5% skim milk at room temperature for 1 h.
Subsequently, the membranes were incubated at 4°C for 16 h with
primary antibodies targeted against: HOXC10 (cat. no. SC-517164;
1:1,000; Santa Cruz Biotechnology, Inc.), GAPDH (cat. no. 5174S;
1:1,000; Cell Signaling Technology, Inc.), JNK (cat. no. 9252S;
1:1,000; Cell Signaling Technology, Inc.), phosphorylated (p)-JNK
(cat. no. 9255S; 1:2,000; Cell Signaling Technology, Inc.), ERK
(cat. no. 4695S; 1:1,000; Cell Signaling Technology, Inc.) and
p-ERK (cat. no. 4370S; 1:2,000; Cell Signaling Technology, Inc.).
Following primary incubation, the membranes were incubated with
anti-mouse IgG and anti-rabbit IgG secondary antibodies (cat. nos.
7076S and 7074S; 1:2,000; Cell Signaling Technology, Inc.) for 1 h
at room temperature. Protein bands were visualized using an ECL kit
(cat. no. P0018FS; Beyotime Institute of Biotechnology). GAPDH was
used as the loading control. ImageJ version 1.8.0 112 bundled with
64-bit Java (National Institutes of Health) was used for
densitometry analysis.
Reverse transcription-quantitative PCR
(RT-qPCR)
Total RNA was extracted from cells and tissues using
TRIzol® reagent (Invitrogen; Thermo Fisher Scientific,
Inc.). Total RNA was diluted in RNase-free DNase solution and
reverse transcribed into cDNA using PrimeScript RT Reagent Kit with
gDNA Eraser (cat. no. RR047A; Takara Bio, Inc.) on a TP350 thermal
cycler (Takara Bio, Inc.). The following temperature protocol was
used for reverse transcription: 42°C for 2 min for gDNA Eraser;
followed by first strand cDNA synthesis at 37°C for 15 min and 85°C
for 5 sec. Subsequently, qPCR was performed using the Mx3005P
real-time PCR system (Agilent Technologies, Inc.) and SYBR Premix
Ex Taq kit (Applied Biosystems; Thermo Fisher Scientific, Inc.).
The following thermocycling conditions were used for qPCR: Initial
denaturation at 95°C for 30 sec; followed by 40 cycles of 95°C for
5 sec and 72°C for 30 sec, and a final extension at 72°C for 30
sec. The following primers were used for qPCR: HOXC10 forward,
5′-ACATCTGGAATCGCCTCAGC-3′ and reverse, 5′-GGCTCTGCTCCGTCTTGATT-3′;
and β-actin (ACTB) forward, 5′-ATGTGGCCGAGGACTTTGATT-3′ and
reverse, 5′-AGTGGGGTGGCTTTTAGGATG-3′. HOXC10 mRNA expression levels
were quantified using the 2−∆∆Cq method (20) and normalized to the internal
reference gene ACTB.
To assess microRNA (miRNA/miR) expression levels,
total RNA (1 µg) was reverse transcribed using an ImProm-II™
Reverse Transcription kit (Promega Corporation) according to the
manufacturer's protocol. The following temperature protocol was
used for reverse transcription: 25°C for 5 min for annealing,
followed by extension at 42°C for 45 min and final inactivation of
the reverse transcriptase at 70°C for 15 min. Subsequently, qPCR
was performed using a QuantStudio Dx Real-Time instrument (Thermo
Fisher Scientific, Inc.) with the SYBR Premix Ex Taq Kit (Takara
Bio, Inc.). The following thermocycling conditions were used for
qPCR: Initial denaturation at 95°C for 30 sec; followed by 40
cycles of 95°C for 5 sec and 72°C for 30 sec, and a final extension
at 72°C for 30 sec. The following primers were used for qPCR:
miR-221 forward, 5′-GGGAAGCTACATTGTCTGC-3′ and reverse,
5′-CAGTGCGTGTCGTGGAGT-3′; and U6 forward,
5′-GCTTCGGCAGCACATATACTAAAAT-3′ and reverse,
5′-CGCTTCACGAATTTGCGTGTCAT-3′. miRNA expression levels were
normalized to the internal reference gene U6. The relative level
was calculated using the 2−∆∆Cq method.
miRNA and small interfering (si)RNA
transfection
Cells in the logarithmic growth phase were washed
with antibiotic- and serum-free fresh medium. A total of
5×10⁴ cells/well in a 24-well plate were used for
transfection. HOXC10 siRNA-1 (5′-CGGGAAAGAAAGAGGGAAC-3′), HOXC10
siRNA-2 (5′-GCACACAAGACGCAACAAA-3′), siRNA-negative control (NC;
sequence not available; cat. no. siB06525141910-1-5), miR-221 mimic
(5′-CUUUGGGUCGUCUGUUACAUCGA-3′; cat. no. miR10000890-1-5),
miR-mimic-NC (cat. no. miR1N0000001-1-5), miR-221 inhibitor
(5′-UCGAUGUAACAGACGACCCAAAG-3′; cat. no. miR21335173141-1-5) and
miR-221-NC (sequence not available; cat. no. miR2N0000001-1-5) were
purchased from Guangzhou RiboBio Co., Ltd.. Cells were transfected
with 20 nM siRNA, miR mimic, miR inhibitor or corresponding
negative controls using Lipofectamine® 2000 (Invitrogen;
Thermo Fisher Scientific, Inc.) and incubated at 37°C with 5%
CO2. After 24 h, the medium was replaced. Transfection
efficiency was assessed via reverse transcription-quantitative
PCR.
Plasmid transfection
The pcDNA3.1-HOXC10 overexpression vector was based
on the pcDNA3.1 plasmid (pcDNA3.1-HA; gifted by Dr Oskar Laur
(Emory School of Medicine, Emory University, Atlanta, GA, USA);
Addgene plasmid no. 128034; n2t.net/addgene:128034; RRID: Addgene_128034). HOXC10
cDNA was amplified from Huh7 cells with initial denaturation at
98°C for 30 sec, followed by 35 cycles of 98°C for 10 sec, 58°C for
30 sec and 72°C for 30 sec, and a final extension at 72°C for 2
min, using Q5 High-Fidelity 2X Master Mix (New England Biolabs) and
the following primers: Forward, 5′-TAAAGCTTATGACATGCCCTCGCAATG-3′
and reverse, 5′-TAGAATTCCCTAATAAATTTCCAGAATCATAATCCTCAAA-3′. PCR
products were digested with HindIII and EcoRI, and
cloned into pcDNA3.1 vectors digested with the same enzymes. A
total of 1×10⁵ Snu449 and PLC cells/well in a 12-well
plate cells were transfected with 2 µg pcDNA3.1 vector using
Lipofectamine® 2000 Transfection Reagent (cat. no.
11668019; Invitrogen; Thermo Fisher Scientific, Inc.) according to
the manufacturer's protocol. At 48 h post-transfection, cells were
used for subsequent experiments.
Cell counting Kit-8 (CCK-8) assay
At 24 h post-transfection, the CCK-8 assay (cat. no.
CK04-05; Dojindo Molecular Technologies, Inc.) was performed to
assess Huh7 and 97H cell viability according to the manufacturer's
protocol. Briefly, cells (1×10² cells/well) were
incubated in 96-well plates with 10 µl CCK-8 reagent. At 0, 12, 24,
36, 48 and 72 h, cell viability was measured at a wavelength of 450
nm using a microplate reader.
Colony formation assay
Huh7, 97H, Snu449 and PLC cells (2×10²
cells/well) were cultured in 60-mm wells with 5 ml medium for 24 h
at 37°C with 5% CO2. Once a visible clone was formed,
the colonies were stained using 1% crystal violet solution for 10
min. Following washing with PBS, the colonies were dried, examined
and counted. Clusters of ≥50 cells (size, 0.3–1.0 mm) were
considered as colonies. Images were obtained using an HP scanner
(Laserjet 100 color MFP; Hewlett-Packard).
Cell proliferation assay
Cell proliferation was assessed using a Cell-Light
EdU DNA Cell Proliferation kit (cat. no. C10310-1; Guangzhou
RiboBio Co., Ltd.) according to the manufacturer's protocol. Huh7,
97H, Snu449 and PLC cells were examined using a fluorescence
microscope (×20 magnification), and cell proliferation was
determined as the ratio of EdU-positive cells to Hoechst-positive
cells (21).
Luciferase reporter assay
To investigate the regulation of HOXC10 expression
by miRNA, a luciferase reporter assay was performed. To identify
the potential regulatory miRNAs of HOXC10, ENCORI (http://starbase.sysu.edu.cn/), TargetScan (http://www.targetscan.org/mamm_31/) and
miRTarBase (http://mirtarbase.mbc.nctu.edu.tw/php/index.php)
databases were used. Mutant (MUT)-HOXC10 or wild-type (WT)-HOXC10
were amplified using Q5 High-Fidelity 2X Master Mix (New England
Biolabs) with cDNA from Huh7 and the following primers: MUT-HOXC10
forward, 5′-GCGACgcttttttGGCAAAGACCTCAGACTCTCCTT−3′ and reverse,
5′-TTGCCaaaaaagcGTCGCATTGCATTTATACTCAGGG-3′; WT-HOXC10 forward,
5′-aattctaggcgatcgctcgagATCGGATCCGGGAACTGACC-3′ and reverse,
5′-aaacgaattcccgggctcgagGAACCACAGGTCCCTTGGAAG-3′. The amplification
was performed with initial denaturation at 98°C for 30 sec,
followed by 35 cycles of 98°C for 10 sec, 58°C for 30 sec and 72°C
for 30 sec, and final extension at 72°C for 2 min. The amplified
fragments were linked into the psi-CHECK2 vector (Promega Beijing
Biotech Co., Ltd.). For the luciferase reporter assay, at 70–80%
confluence, Huh7 cells were transfected with 0.5 µg MUT
HOXC10-3′-untranslated region (UTR; MUT-HOXC10) or WT HOXC10-3′UTR
using Lipofectamine® 2000 (Invitrogen; Thermo Fisher
Scientific, Inc.). The concentration of mimic-221, inhibitor-221,
mimic-NC and inhibitor-NC used for co-transfection was 50 nM. At 48
h post-transfection, luciferase activity was assessed using the
Dual-Luciferase Activity Assay system (Promega Corporation).
Statistical analysis
Statistical analyses were conducted using GraphPad
Prism (version 7; GraphPad Software, Inc.) and SPSS (version 17.0;
SPSS, Inc.) software. Comparisons among multiple groups were
analyzed using one-way ANOVA followed by Tukey's post hoc test.
Comparisons between two groups were analyzed using the paired or
unpaired Student's t-test. Data presented as n (%) were analyzed
using the χ2 test and data presented as the mean ±
interquartile range were analyzed using Student's t-test. The
prognostic potential of HOXC10 was determined using Kaplan-Meier
survival curves, which were compared using log-rank tests. Data are
presented as the mean ± standard deviation. P<0.05 was
considered to indicate a statistically significant difference.
Results
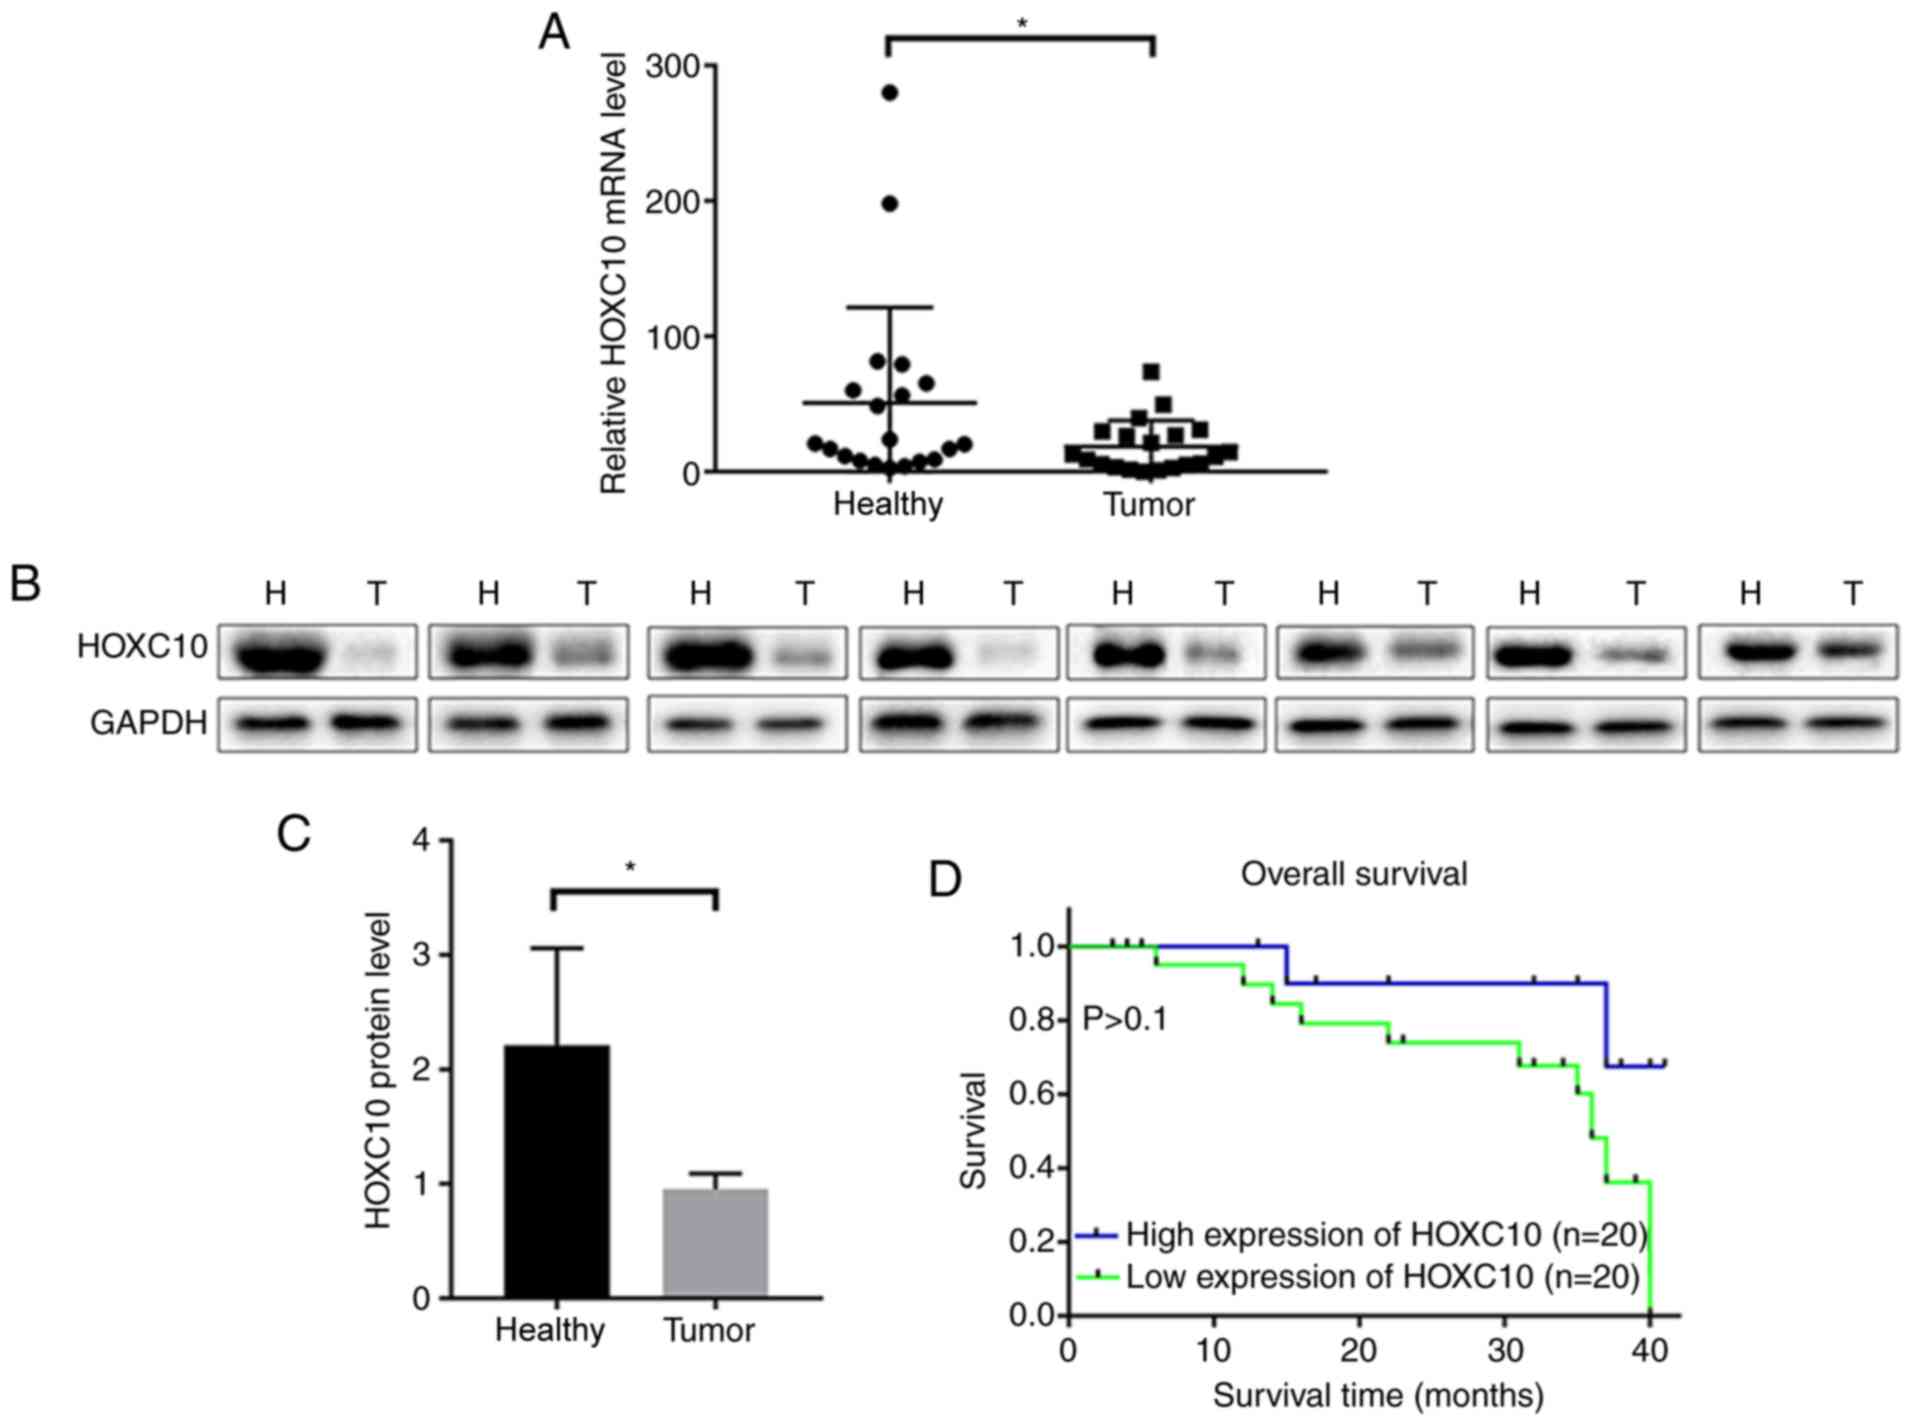
HOXC10 is downregulated in liver
cancer tissues
The expression levels of HOXC10 in 40 paired liver
cancer and adjacent non-cancerous tissues were assessed via RT-qPCR
and western blotting. HOXC10 mRNA (Fig.
1A) and protein (Fig. 1B and C)
expression levels were significantly downregulated in liver cancer
tissues compared with adjacent non-cancerous tissues.
The clinical characteristics of the liver cancer
tissues are presented in Table I.
The cases were divided into two groups (low expression and high
expression) according to the median of the mRNA expression level of
HOXC10. Patients in the low HOXC10 expression group displayed
increased tumor size, more severe lymphatic metastasis and worse
TNM stage (22) compared with
patients with high HOXC10 expression, suggesting that low HOXC10
expression may be associated with increased tumor aggression.
Although not statistically significant, the Kaplan-Meier survival
curves indicated that low HOXC10 expression levels may correlate
with poor survival in patients with liver cancer (Fig. 1D). Further studies with larger sample
sizes are required to validate the results of the present
study.
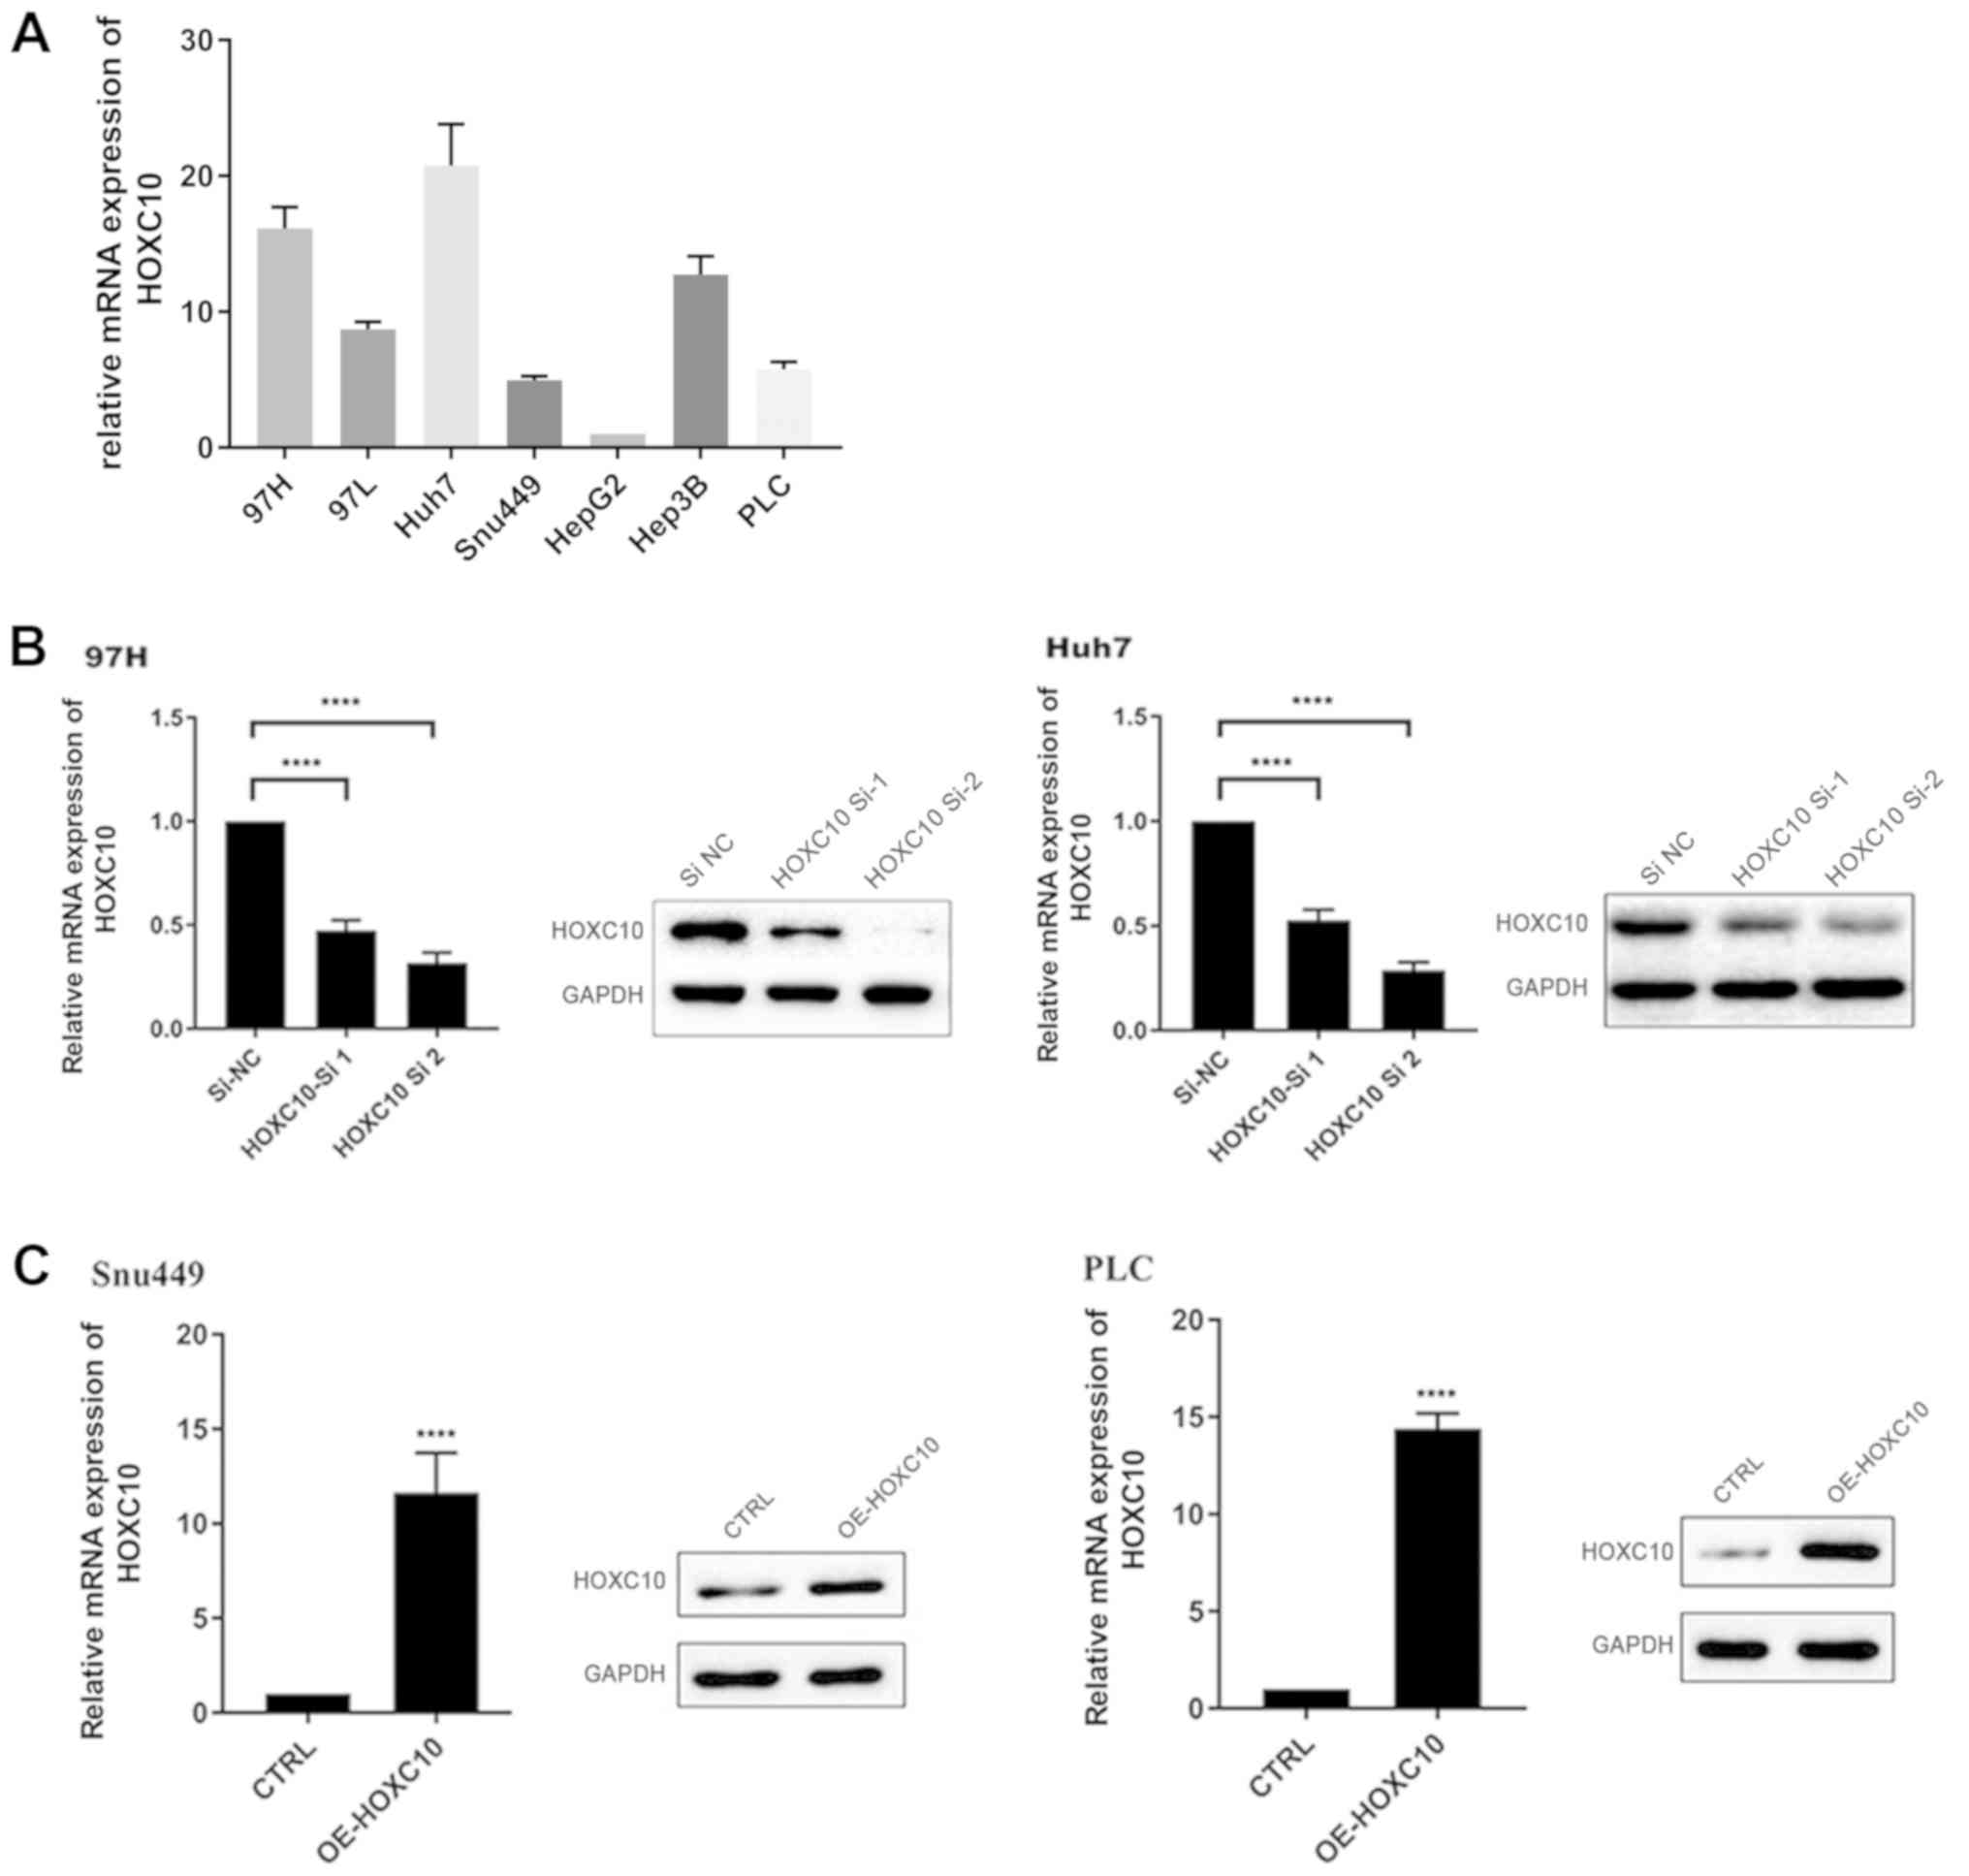
HOXC10 suppresses liver cancer cell
viability
HOXC10 mRNA expression in seven different liver
cancer cell lines was assessed (Fig.
2A). The results indicated that HOXC10 mRNA expression levels
were notably increased in Huh7 and 97H cells compared with other
liver cancer cell lines. Therefore, Huh7 and 97H cell lines were
used for loss-of-function experiments, whereas Snu449 and PLC cell
lines were used for gain-of-function experiments. HOXC10 knockdown
and overexpression efficiency were assessed via RT-qPCR and western
blotting. HOXC10 siRNA notably decreased HOXC10 mRNA and protein
expression levels in Huh7 and 97H cells compared with the si-NC
group (Fig. 2B). By contrast, mRNA
and protein expression levels of HOXC10 were notably increased in
the pcDNA3.1-HOXC10 group compared with the empty vector group
(Fig. 2C).
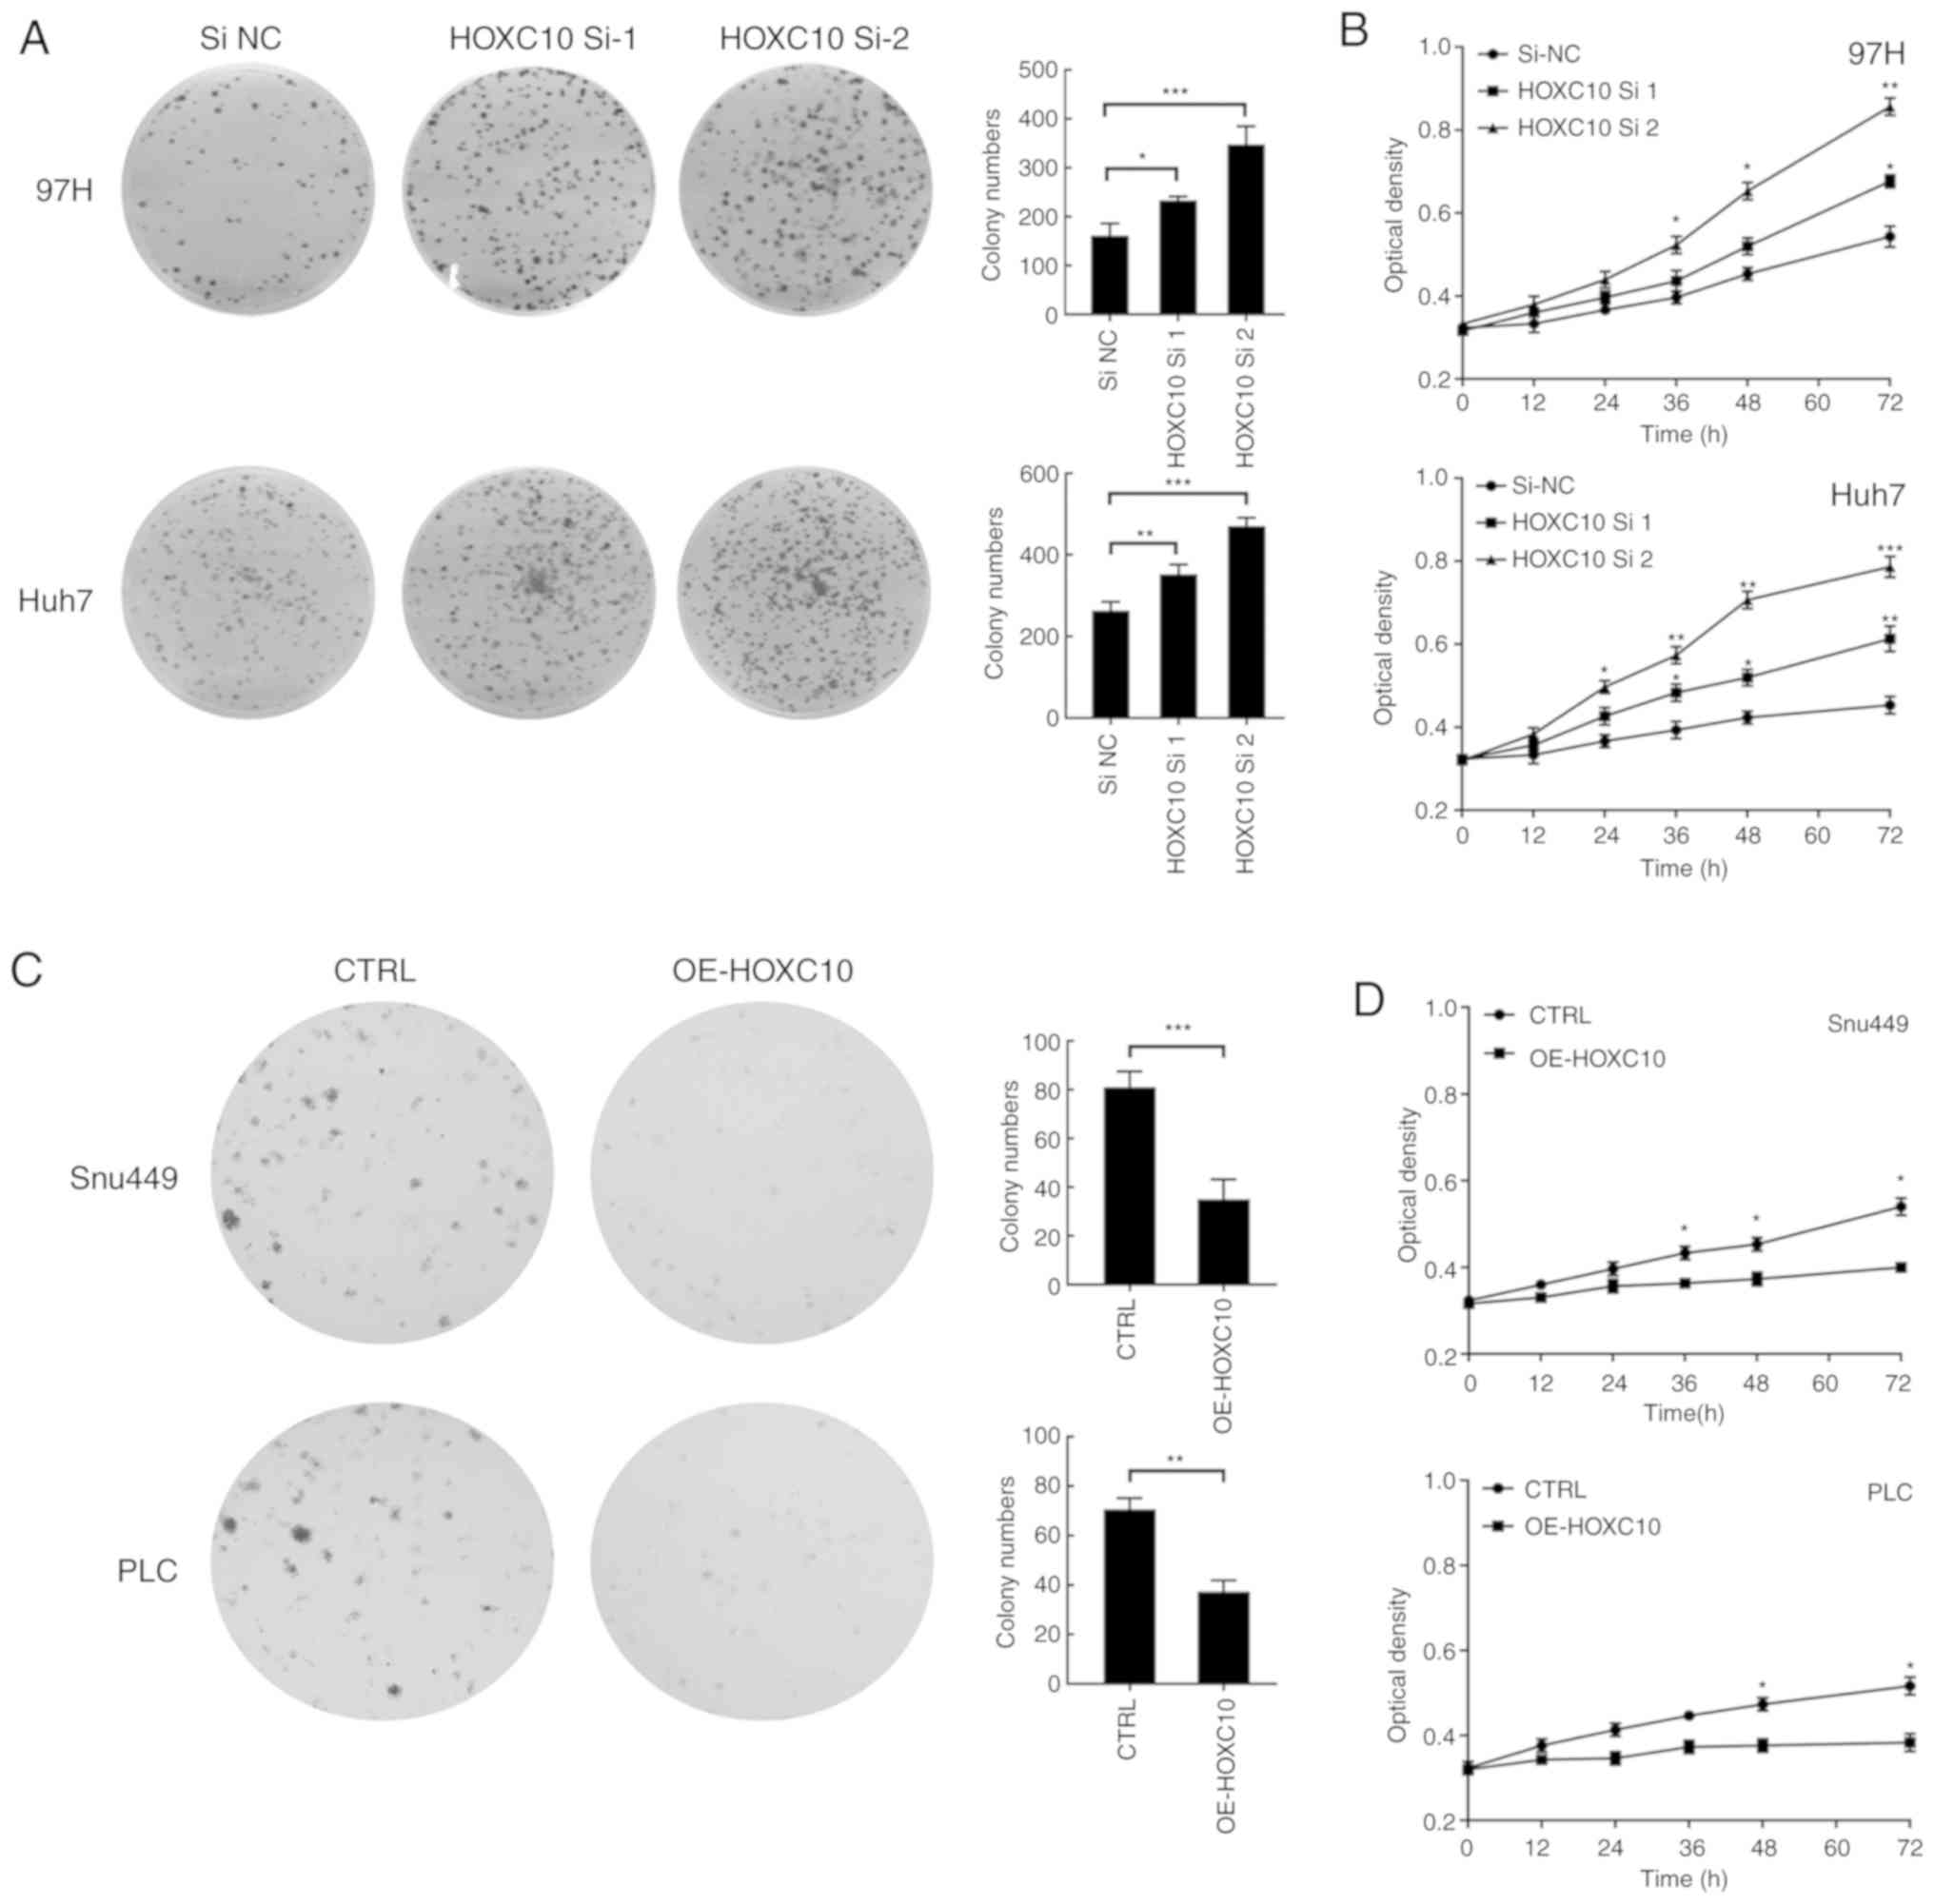
Subsequently, colony formation and CCK-8 assays were
performed to evaluate the effect of HOXC10 on liver cancer cell
viability. Compared with the si-NC group, HOXC10 knockdown
significantly increased colony formation and cell viability
(Fig. 3A and B). By contrast,
compared with the empty vector group, HOXC10 overexpression
significantly decreased colony formation and cell viability
(Fig. 3C and D).
Collectively, the results indicated that HOXC10
suppressed liver cancer cell viability.
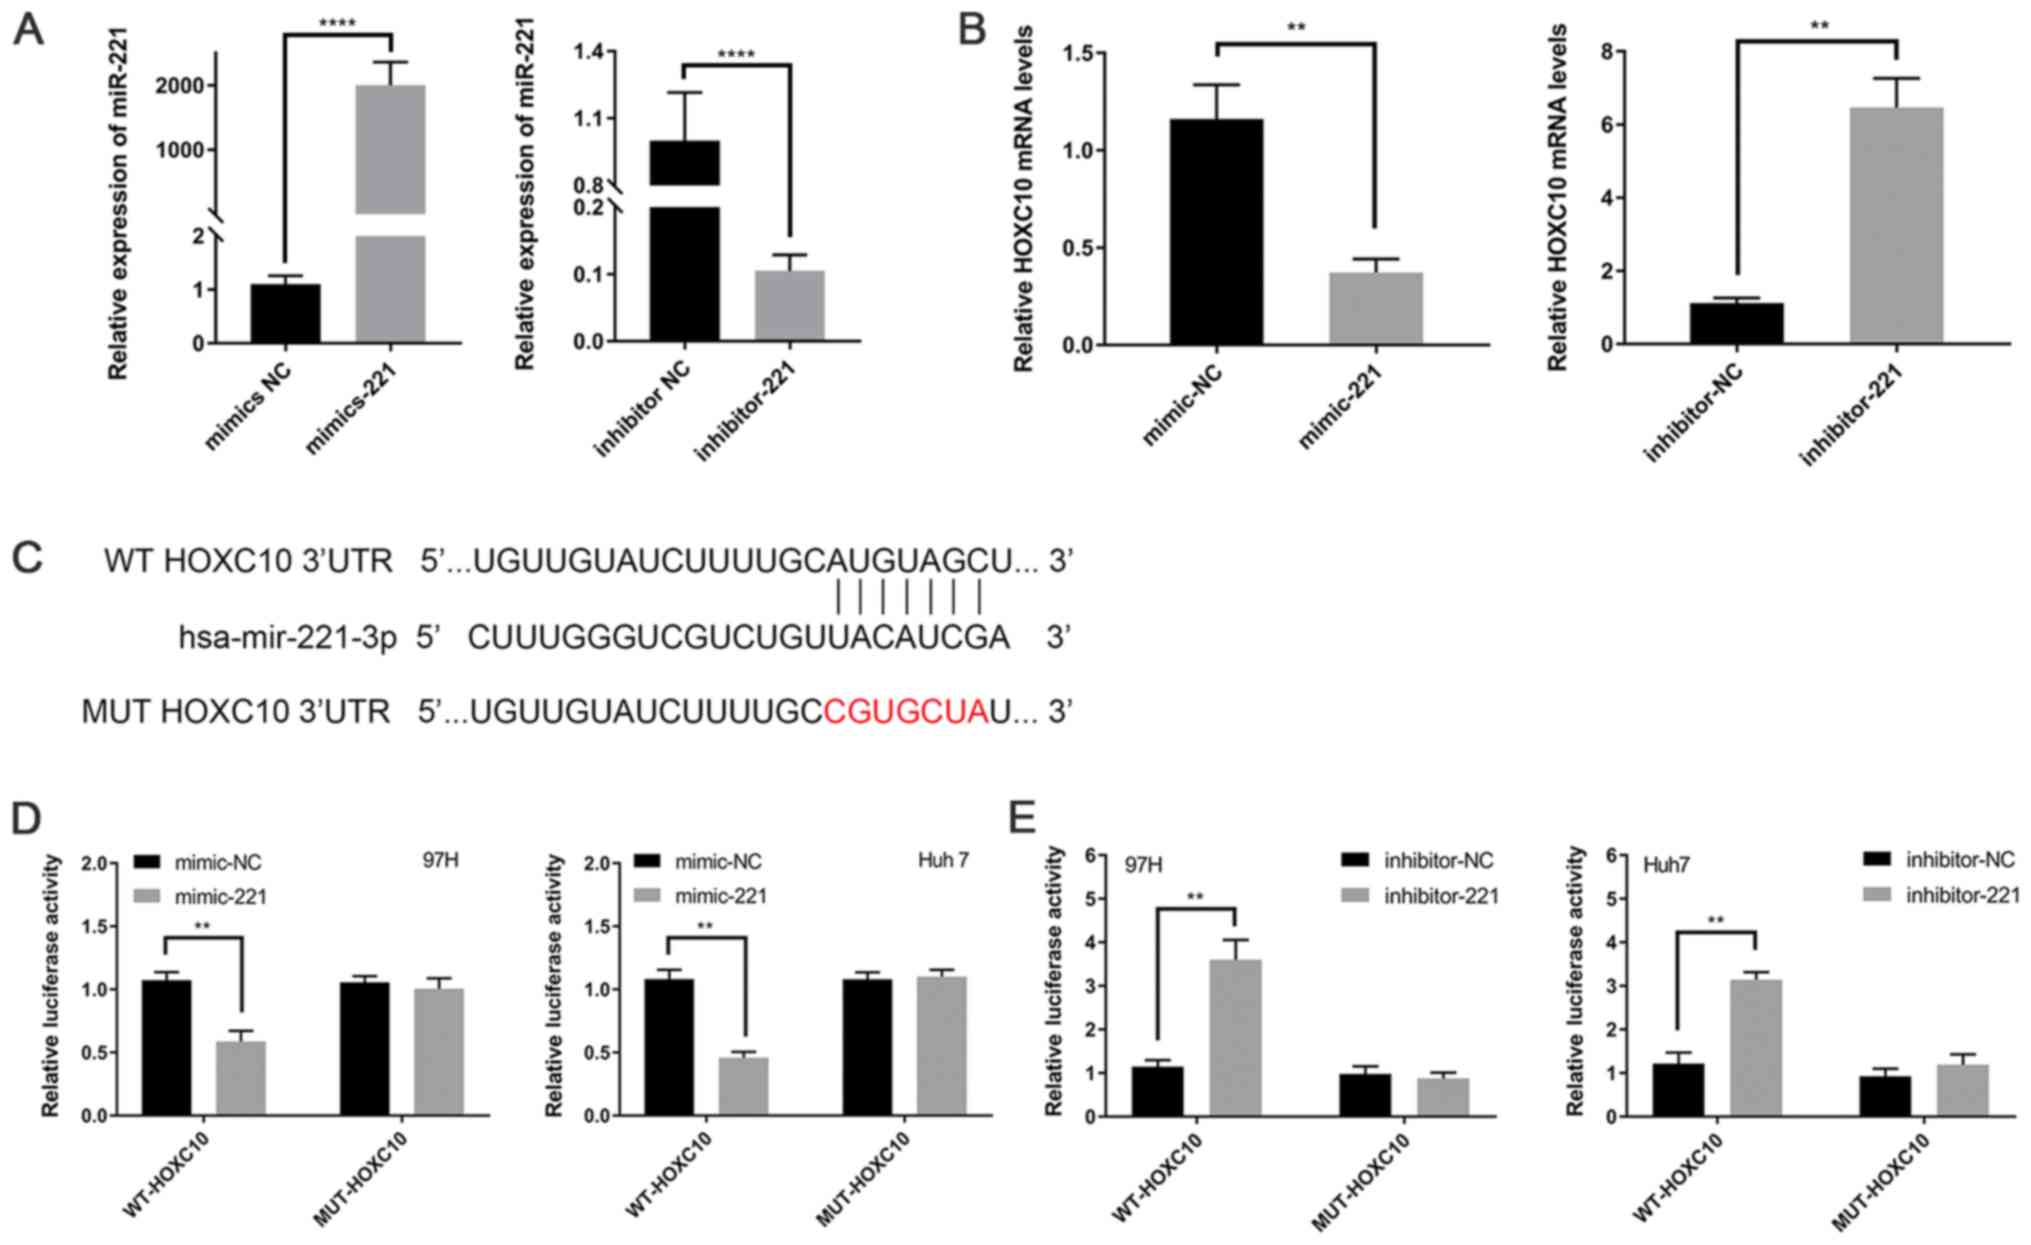
miR-221 downregulates HOXC10
expression in liver cancer by directly targeting its 3′-UTR
The aforementioned results of the present study
demonstrated that HOXC10 expression was altered in liver cancer
tissues and regulated tumor cell proliferation; therefore, it was
further investigated how HOXC10 expression may be regulated in
liver cancer. miR-221 was identified as a regulatory miRNA of
HOXC10 by bioinformatics analysis as the seed region of HOXC10 was
highly complementary to miR-221. The results indicated that miR-221
may downregulate HOXC10 in liver cancer; therefore, miR-221 was
selected for further analysis in the present study.
To confirm that miR-221 downregulated HOXC10,
miR-221 mimic, miR-221 inhibitor and the corresponding NCs were
transfected into Huh7 cells. miR-221 knockdown and overexpression
efficiency were assessed via RT-qPCR (Fig. 4A). Subsequently, HOXC10 expression
levels were detected via RT-qPCR. HOXC10 expression levels were
significantly decreased in miR-221 mimic-transfected Huh7 cells
compared with miR-221 inhibitor- and negative control-transfected
Huh7 cells (Fig. 4B). In addition,
based on the seed sequence predicted by the databases, luciferase
plasmids containing the WT or MUT 3′UTR of HOXC10 were constructed
(Fig. 4C). miR-221 mimic
significantly decreased the luciferase activity of WT-HOXC10-3′UTR
compared with mimic-NC, whereas the luciferase activity of
MUT-HOXC10-3′UTR was not significantly altered by miR-221 mimic
compared with mimic-NC (Fig. 4D).
miR-221 inhibitor significantly increased the luciferase activity
of WT-HOXC10-3′UTR compared with inhibitor-NC, whereas the
luciferase activity of MUT-HOXC10-3′UTR was not significantly
altered by miR-221 inhibitor compared with inhibitor-NC (Fig. 4E). The results indicated that miR-221
directly interacted with the 3′UTR of HOXC10 mRNA and downregulated
HOXC10 expression.
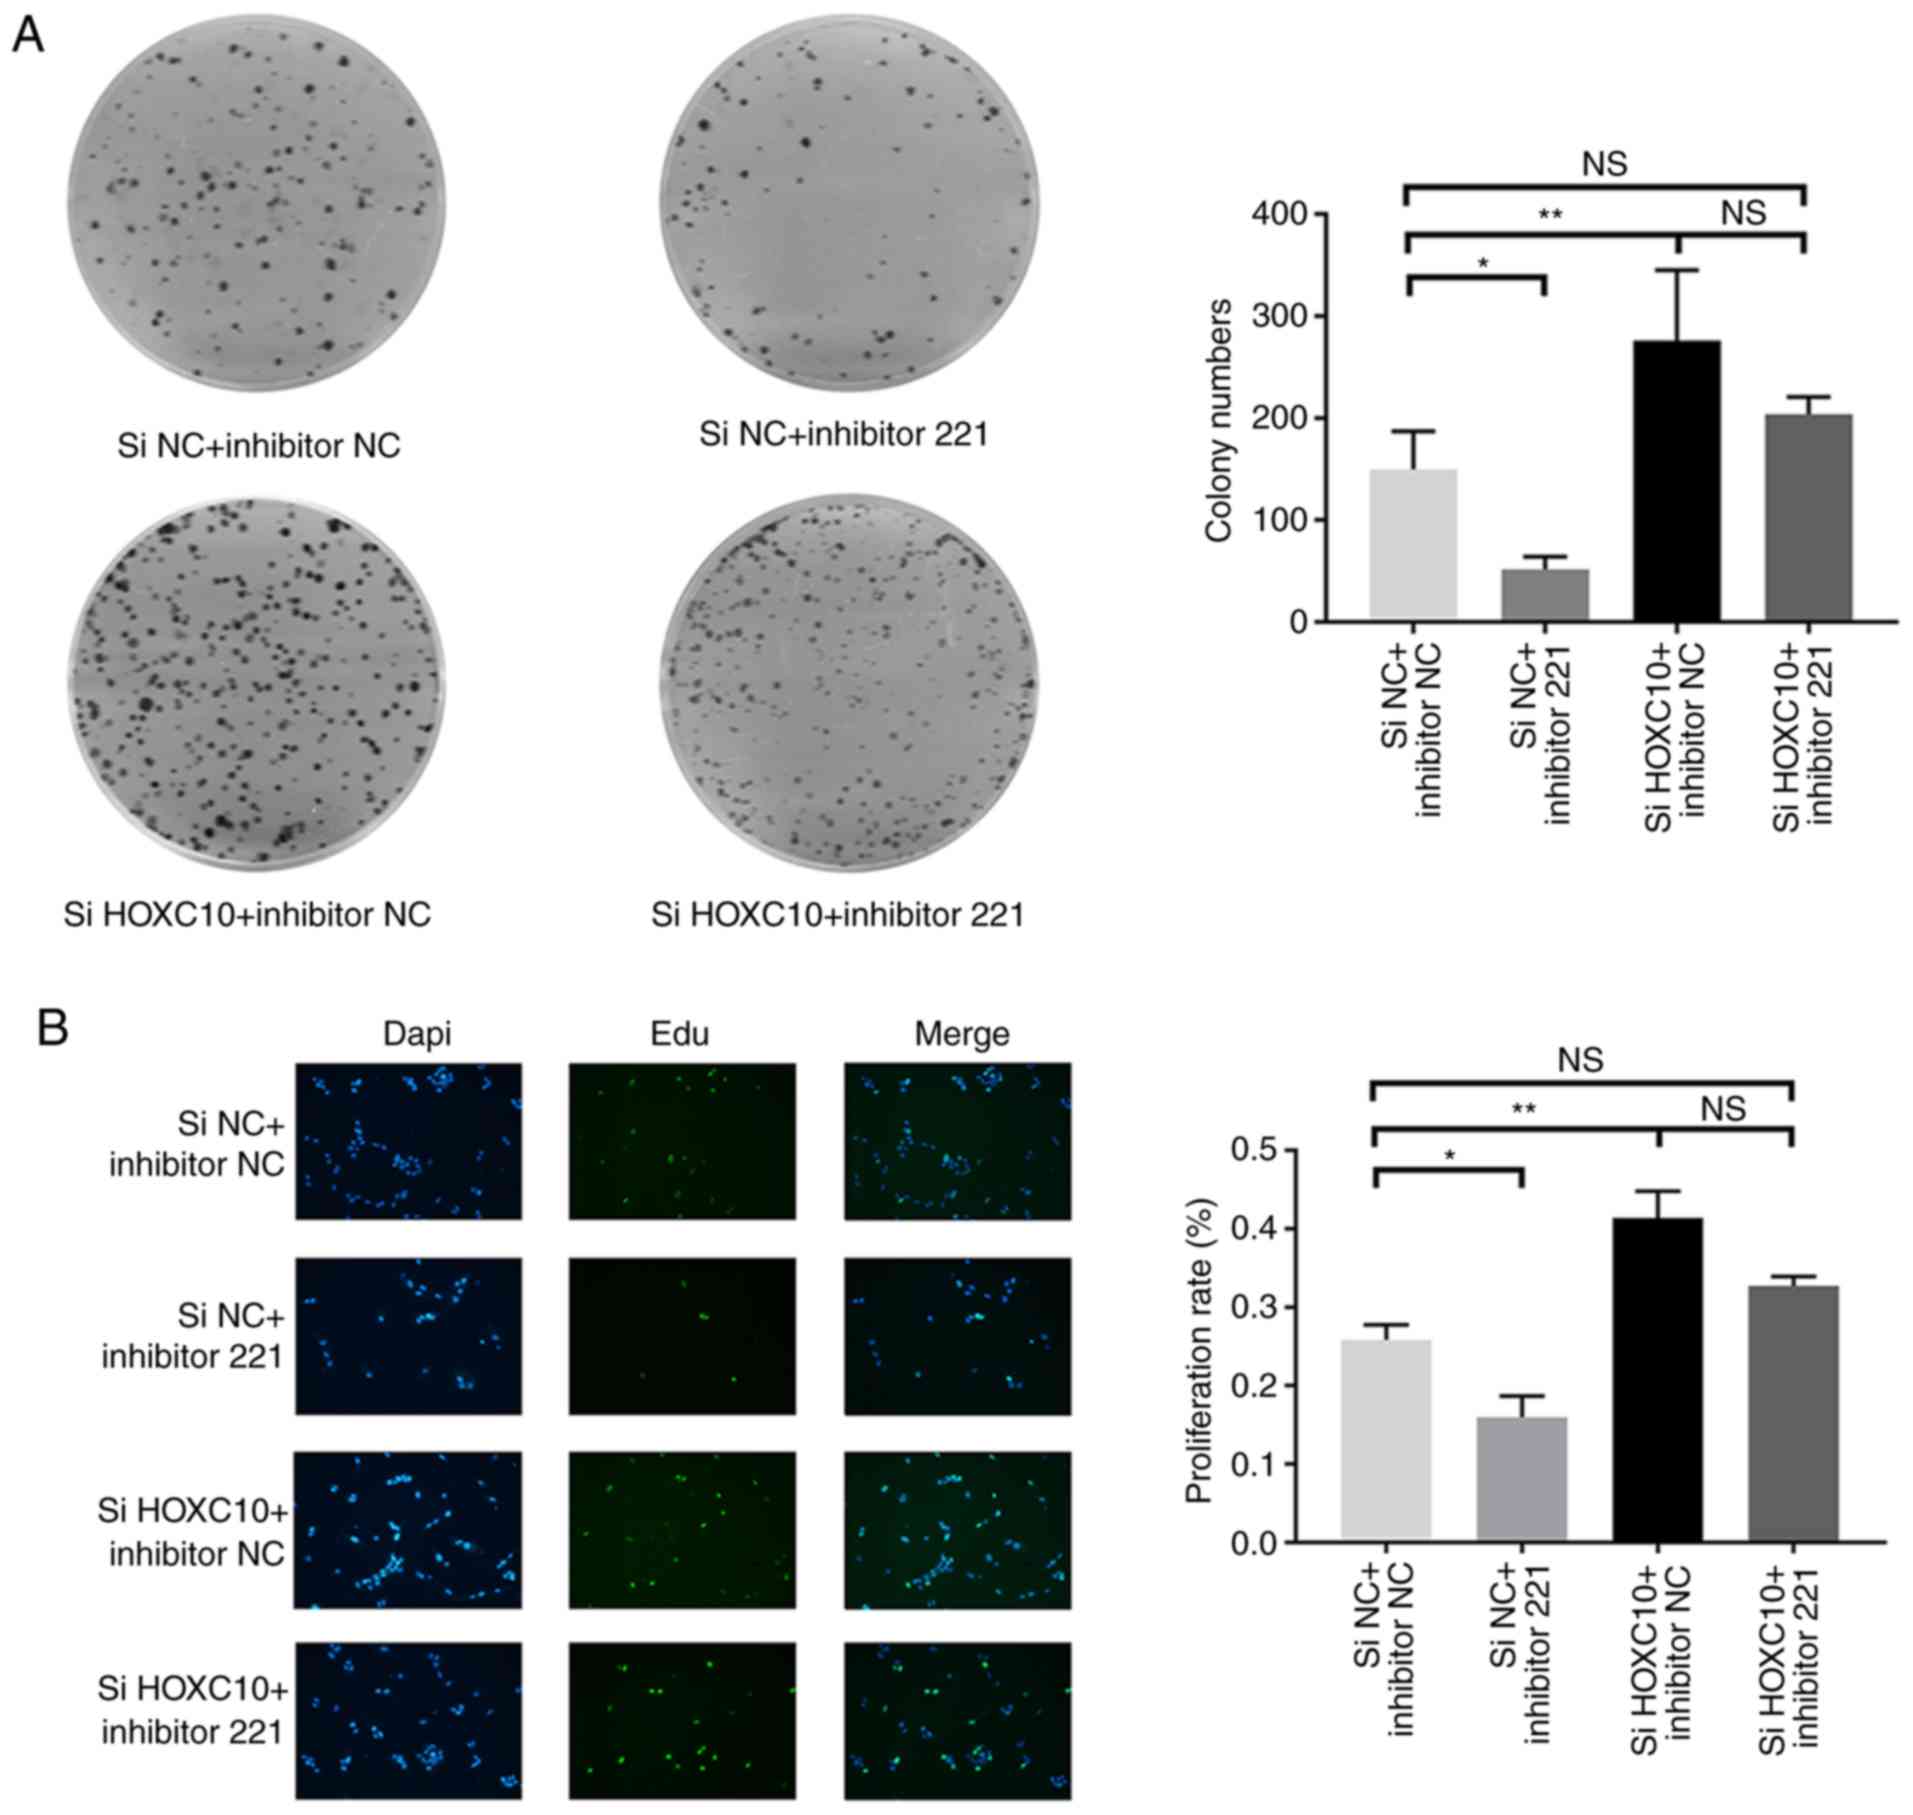
miR-221 interferes with the inhibitory
effect of HOXC10 on proliferation
Based on the interaction between miR-221 and HOXC10,
whether miR-221 could affect the functionality of HOXC10 in liver
cancer was investigated. Therefore, Huh7 cells were transfected
with HOXC10 siRNA in the presence of miR-221 inhibitor or the
corresponding NC. HOXC10 knockdown significantly increased colony
formation compared with the si-NC + inhibitor-NC group. The colony
formation assay also indicated that miR-221 inhibitor partially
reversed HOXC10 siRNA-induced increases in colony formation
(Fig. 5A). The EdU assay results
indicated that HOXC10 knockdown significantly increased cell
proliferation compared with the si-NC and inhibitor-NC group.
Similarly, miR-221 inhibitor partially reversed HOXC10
siRNA-induced cell proliferation (Fig.
5B). The results suggested that miR-221 interfered with the
inhibitory effect of HOXC10 on liver cancer cell proliferation.
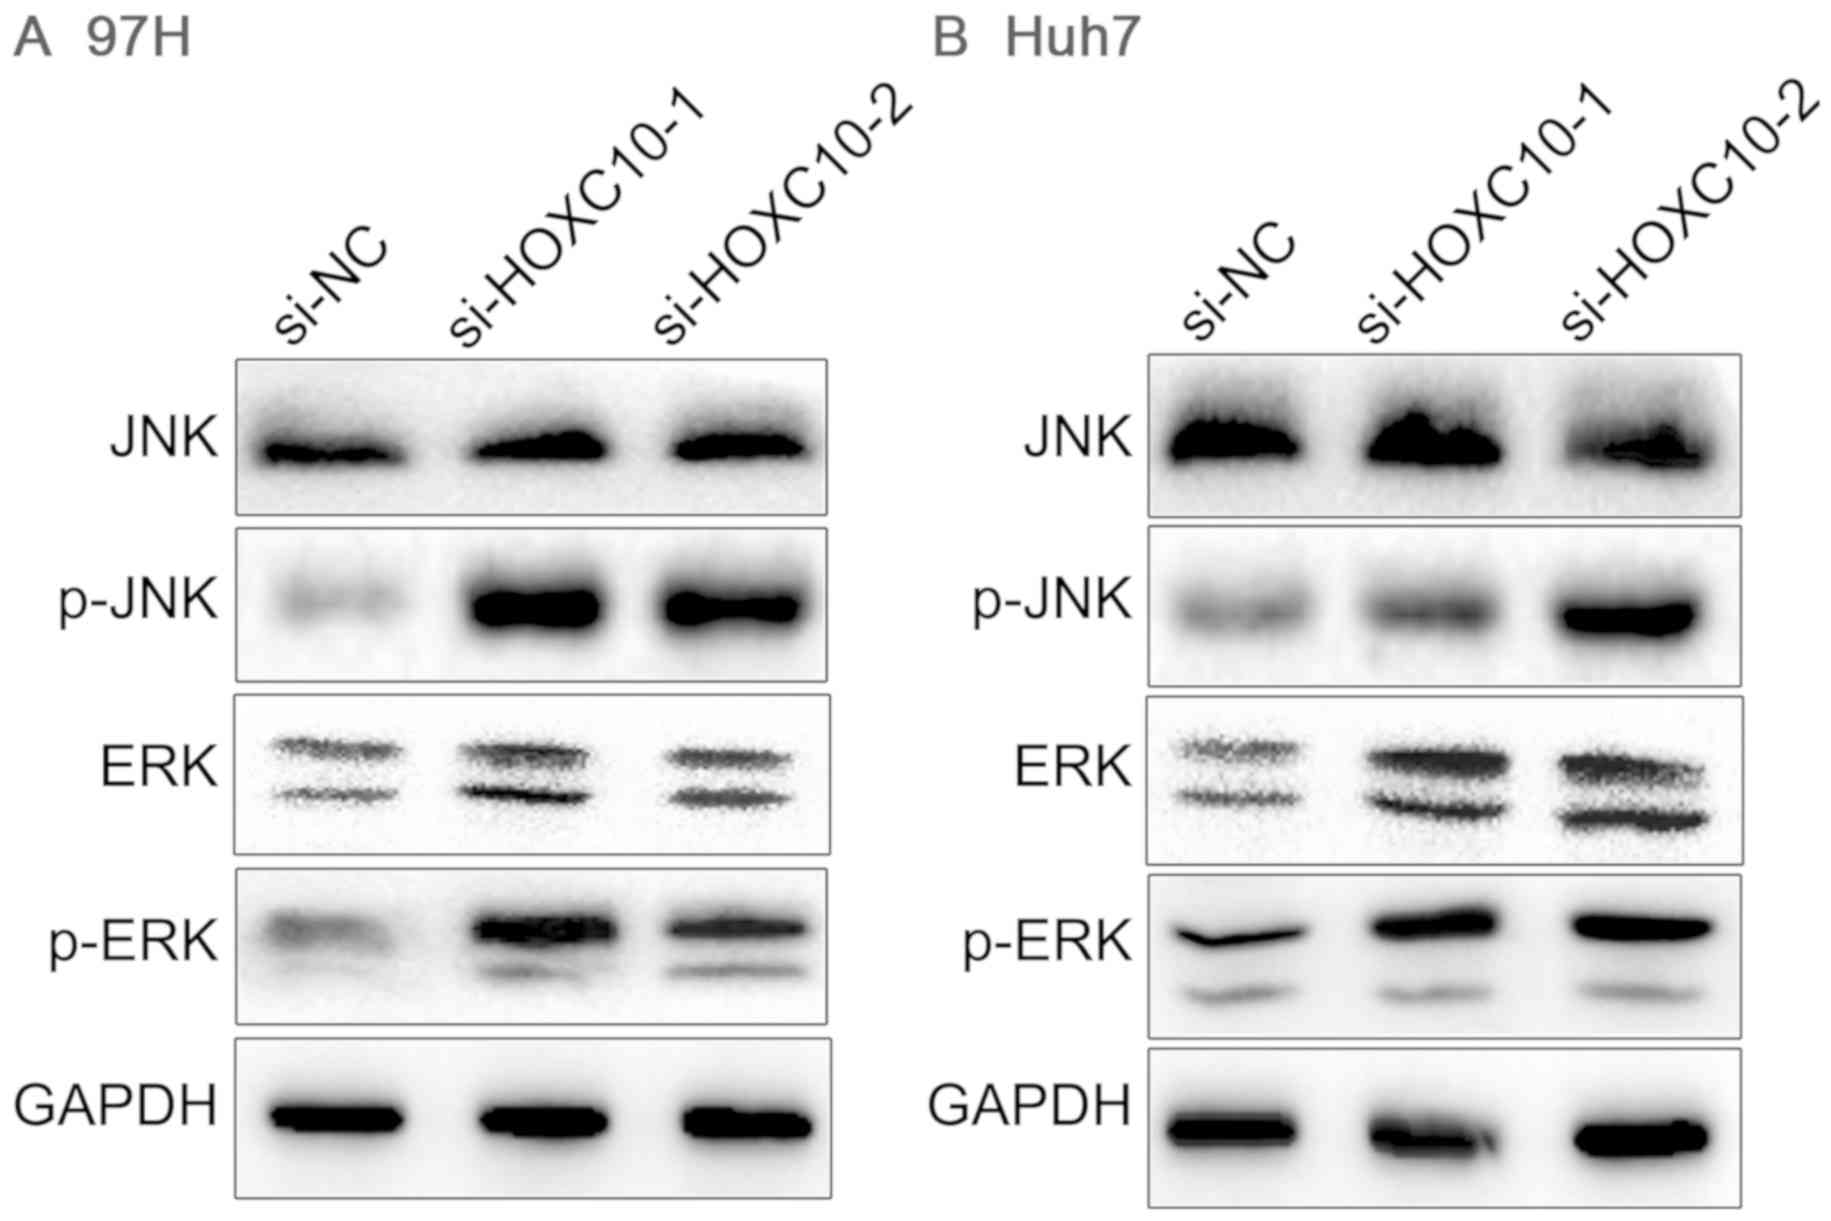
HOXC10 is associated with the
mitogen-activated protein kinase (MAPK) signaling pathway
Abnormal activation or overactivation of MAPK
modifies the malignant transformation and evolution of cells
(23). To investigate whether HOXC10
knockdown affected MAPK signaling in liver cancer, the expression
levels of MAPK marker proteins were measured, as the
phosphorylation levels of ERK and JNK partly indicate activation of
the MAPK signaling pathway. p-ERK and p-JNK expression levels were
markedly elevated in the si-HOXC10 group compared with the si-NC
group, whereas total ERK and JNK were not notably altered (Fig. 6). The results indicated that Huh7 and
97H cell proliferation may be modulated via activation of MAPK
signaling in response to HOXC10.
Discussion
Despite significant progress in the past decades in
the diagnosis, surgery and chemotherapy of liver cancer, there has
been no significant improvement in the 5-year survival rate
(1). Tumorigenesis and development
are a complex regulatory network involving numerous genes (24,25). The
present study explored the function of HOXC10 and its regulation in
liver cancer.
First, the expression of HOXC10 in liver cancer
specimens and adjacent non-cancerous tissues was assessed. HOXC10
expression was downregulated in liver cancer tissues compared with
adjacent non-cancerous tissues, which was associated with worse
prognosis and survival outcome. Moreover, HOXC10 overexpression and
knockdown suppressed and promoted liver cancer cell proliferation,
respectively. However, the upstream and downstream regulators and
targets of HOXC10 have no yet been identified. Via ENCORI,
TargetScan and miRTarBase, miRNA-221 was predicted to bind to the
3′UTR of HOXC10. The luciferase reporter assay indicated that
miR-221 interacted with HOXC10 to downregulate its expression. As
the majority of the tissues were used in other experiments, the
present study did not investigate the inverse correlation between
miR-221 and HOXC10 expression in tissue samples from patients with
liver cancer. In addition, the expression level in a normal liver
cell line was not assessed, both of which were limitations of the
present study. Rescue experiments suggested that miR-221 inhibitor
suppressed liver cancer cell proliferation compared with inhibitor
NC. The relationship between HOXC10 and the MAPK signaling pathway
has been studied in gastric cancer (17); however, whether HOXC10 affects the
MAPK signaling pathway in liver cancer is not completely
understood. A significant increase in the expression levels of MAPK
signaling pathway marker proteins was observed in the present study
following HOXC10 knockdown compared with the si-NC group, which
indicated that HOXC10 negatively affected the MAPK signaling
pathway.
The HOX genes are essential regulators of the
expression of genes involved in key cellular processes,
differentiation and cell identity (9). Apart from their roles in tissues
remodeling, the HOX gene network serves key roles in leukemogenesis
and hematopoiesis (10). Numerous
studies have demonstrated that the HOX gene family is closely
related to the occurrence and development of various types of
cancer (6–9,26). In
liver cancer, HOXA13 and HOXA7 are involved in tumor proliferation,
migration and invasion (26).
Together with the results of the present study, the aforementioned
studies indicated that HOXC10 and the HOX gene family may serve as
biomarkers for liver cancer.
HOXC10 has been reported to be oncogenic in other
tumors (12,13), but in the present study, the results
indicated that HOXC10 served as an antioncogene. This discrepancy
regarding the function of HOXC10 in liver cancer and other tumors
may be associated with the heterogeneity of tumors, such as
metastasis associated lung adenocarcinoma transcript 1 in breast
cancer (27) and p53 in hepatoma
carcinoma (28). In addition to
this, different downstream signaling pathways can also result in
different functions of the same molecule. In gastric cancer, HOXC10
serves as an oncogene via the NF-kB signaling pathway (17), whereas in breast cancer, HOXC10
supports the development of chemotherapy resistance by tuning DNA
repair (14).
It has been reported that miRNAs may serve as
potential tools for monitoring cancer progression, diagnosis and
prognosis (23,29). miRNAs are vital gene regulators that
bind to partially complementary sequences at the 3′UTR of mRNAs and
direct post-transcriptional modulation (23,30).
With the advent of miRNA expression profiles, significant efforts
have been made to correlate miRNA expression with tumor
development. Understanding miRNAs can reveal a more comprehensive
view of the dynamic regulatory networks of cancer (31). The present study conducted a
luciferase assay to assess the physical binding between miR-221 and
HOXC10, and further indicated that miR-221 could effectively alter
the function of HOXC10. However, the upstream regulatory molecules
of HOXC10 may include other microRNAs, long non-coding RNAs and
various molecules, which need to be identified in further
research.
The MAPK signaling pathway controls cell apoptosis,
differentiation and proliferation (32). Among its components, the roles of ERK
and JNK have been extensively studied (33,34).
Therefore, ERK and JNK proteins were selected to assess MAPK
signaling pathway activation. The results indicated that HOXC10
knockdown increased the phosphorylation of JNK/ERK compared with
the si-NC group.
In conclusion, the results of the present study
suggested that HOXC10 may serve as a critical negative regulator of
cell proliferation via activation of the MAPK signaling pathway. In
liver cancer, HOXC10 expression was downregulated due to the
suppressive effects of miR-221. Therefore, HOXC10 may serve as a
novel diagnostic biomarker and therapeutic target for liver
cancer.
Acknowledgements
The authors would like to thank Dr Fang Xie (Bilian
Jin's Laboratory, Dalian Medical University, Dalian, China) for
providing technical support and Dr Oskar Laur (Emory School of
Medicine, Emory University, Atlanta, GA, USA) for providing the
pcDNA3.1 plasmid.
Funding
The present study was supported by the Dalian
Medical Science Research Program (grant no. 1812040).
Availability of data and materials
The datasets used and/or analyzed during the present
study are available from the corresponding author on reasonable
request.
Authors' contributions
CZ, KM, CC and ZF designed the experiments. CZ, KG
and KM collected the clinical samples. CZ, KM, KG, SZ, CC, BD, CP,
WL and ZY performed the experiments. CZ, RL, LW and KM analyzed the
data. CZ, LW and RL drafted the manuscript. All authors read and
approved the final manuscript.
Ethics approval and consent to
participate
The present study was approved by the Ethics
Committee of the Second Affiliated Hospital of Dalian Medical
University (approval no. 2019.087). Written informed consent was
obtained from all participants.
Patient consent for publication
Not applicable.
Competing interests
The authors declare that they have no competing
interests.
References
|
1
|
Gomaa AI, Khan SA, Toledano MB, Waked I
and Taylor-Robinson SD: Hepatocellular carcinoma: Epidemiology,
risk factors and pathogenesis. World J Gastroenterol. 14:4300–4308.
2008. View Article : Google Scholar : PubMed/NCBI
|
|
2
|
El-Serag HB and Rudolph KL: Hepatocellular
carcinoma: Epidemiology and molecular carcinogenesis.
Gastroenterology. 132:2557–2576. 2007. View Article : Google Scholar : PubMed/NCBI
|
|
3
|
Han ZG: Functional genomic studies:
Insights into the pathogenesis of liver cancer. Annu Rev Genomics
Hum Genet. 13:171–205. 2012. View Article : Google Scholar : PubMed/NCBI
|
|
4
|
Kannan M, Jayamohan S, Moorthy RK,
Chabattula SC, Ganeshan M and Arockiam AJV: AEG-1/miR-221 axis
cooperatively regulates the progression of hepatocellular carcinoma
by targeting PTEN/PI3K/AKT signaling pathway. Int J Mol Sci.
20:55262019. View Article : Google Scholar
|
|
5
|
Feitelson MA, Arzumanyan A, Kulathinal RJ,
Blain SW, Holcombe RF, Mahajna J, Marino M, Martinez-Chantar ML,
Nawroth R, Sanchez-Garcia I, et al: Sustained proliferation in
cancer: Mechanisms and novel therapeutic targets. Semin Cancer
Biol. 35 (Suppl):S25–S54. 2015. View Article : Google Scholar : PubMed/NCBI
|
|
6
|
Christen B, Beck CW, Lombardo A and Slack
JM: Regeneration-specific expression pattern of three posterior Hox
genes. Dev Dyn. 226:349–355. 2003. View Article : Google Scholar : PubMed/NCBI
|
|
7
|
de Bessa Garcia SA, Araujo M, Pereira T,
Mouta J and Freitas R: HOX genes function in breast cancer
development. Biochim Biophys Acta Rev Cancer. 1873:1883582020.
View Article : Google Scholar : PubMed/NCBI
|
|
8
|
Adato O, Orenstein Y, Kopolovic J,
Juven-Gershon T and Unger R: Quantitative analysis of differential
expression of HOX genes in multiple cancers. Cancers (Basel).
12:15722020. View Article : Google Scholar
|
|
9
|
Anbazhagan R and Raman V: Homeobox genes:
Molecular link between congenital anomalies and cancer. Eur J
Cancer. 33:635–637. 1997. View Article : Google Scholar : PubMed/NCBI
|
|
10
|
Argiropoulos B and Humphries RK: Hox genes
in hematopoiesis and leukemogenesis. Oncogene. 26:6766–6776. 2007.
View Article : Google Scholar : PubMed/NCBI
|
|
11
|
Li B, Huang Q and Wei GH: The role of HOX
transcription factors in cancer predisposition and progression.
Cancers (Basel). 11:5282019. View Article : Google Scholar
|
|
12
|
Guan Y, He Y, Lv S, Hou X, Li L and Song
J: Overexpression of HOXC10 promotes glioblastoma cell progression
to a poor prognosis via the PI3K/AKT signalling pathway. J Drug
Target. 27:60–66. 2019. View Article : Google Scholar : PubMed/NCBI
|
|
13
|
Tang XL, Ding BX, Hua Y, Chen H, Wu T,
Chen ZQ and Yuan CH: HOXC10 promotes the metastasis of human lung
adenocarcinoma and indicates poor survival outcome. Front Physiol.
8:5572017. View Article : Google Scholar : PubMed/NCBI
|
|
14
|
Sadik H, Korangath P, Nguyen NK, Gyorffy
B, Kumar R, Hedayati M, Teo WW, Park S, Panday H, Munoz TG, et al:
HOXC10 expression supports the development of chemotherapy
resistance by fine tuning DNA repair in breast cancer cells. Cancer
Res. 76:4443–4456. 2016. View Article : Google Scholar : PubMed/NCBI
|
|
15
|
Pathiraja TN, Nayak SR, Xi Y, Jiang S,
Garee JP, Edwards DP, Lee AV, Chen J, Shea MJ, Santen RJ, et al:
Epigenetic reprogramming of HOXC10 in endocrine-resistant breast
cancer. Sci Transl Med. 6:229ra412014. View Article : Google Scholar : PubMed/NCBI
|
|
16
|
Feng X, Li T, Liu Z, Shi Y and Peng Y:
HOXC10 up-regulation contributes to human thyroid cancer and
indicates poor survival outcome. Mol Biosyst. 11:2946–2954. 2015.
View Article : Google Scholar : PubMed/NCBI
|
|
17
|
Guo C, Hou J, Ao S, Deng X and Lyu G:
HOXC10 up-regulation promotes gastric cancer cell proliferation and
metastasis through MAPK pathway. Chin J Cancer Res. 29:572–580.
2017. View Article : Google Scholar : PubMed/NCBI
|
|
18
|
Yao S, He L, Zhang Y, Ye L, Lai Y, Huang
L, Wu L, Wu G and Zhu S: HOXC10 promotes gastric cancer cell
invasion and migration via regulation of the NF-κB pathway. Biochem
Biophys Res Commun. 501:628–635. 2018. View Article : Google Scholar : PubMed/NCBI
|
|
19
|
Xiong W, Zhou Q, Liu G, Liu XS and Li XY:
Homeodomain-containing gene 10 inhibits cell apoptosis and promotes
cell invasion and migration in osteosarcoma cell lines. Tumour
Biol. 39:10104283176975662017. View Article : Google Scholar : PubMed/NCBI
|
|
20
|
Livak KJ and Schmittgen TD: Analysis of
relative gene expression data using real-time quantitative PCR and
the 2(-Delta Delta C(T)) method. Methods. 25:402–408. 2001.
View Article : Google Scholar : PubMed/NCBI
|
|
21
|
Xie F, Li Y, Wang M, Huang C, Tao D, Zheng
F, Zhang H, Zeng F, Xiao X and Jiang G: Circular RNA BCRC-3
suppresses bladder cancer proliferation through miR-182-5p/p27
axis. Mol Cancer. 17:1442018. View Article : Google Scholar : PubMed/NCBI
|
|
22
|
Minagawa M, Ikai I, Matsuyama Y, Yamaoka Y
and Makuuchi M: Staging of hepatocellular carcinoma: Assessment of
the Japanese TNM and AJCC/UICC TNM systems in a cohort of 13,772
patients in Japan. Ann Surg. 245:909–922. 2007. View Article : Google Scholar : PubMed/NCBI
|
|
23
|
Wagner EF and Nebreda AR: Signal
integration by JNK and p38 MAPK pathways in cancer development. Nat
Rev Cancer. 9:537–549. 2009. View
Article : Google Scholar : PubMed/NCBI
|
|
24
|
Hanahan D and Weinberg RA: Hallmarks of
cancer: The next generation. Cell. 144:646–674. 2011. View Article : Google Scholar : PubMed/NCBI
|
|
25
|
Hanahan D and Weinberg RA: The hallmarks
of cancer. Cell. 100:57–70. 2000. View Article : Google Scholar : PubMed/NCBI
|
|
26
|
Cillo C, Schiavo G, Cantile M, Bihl MP,
Sorrentino P, Carafa V, D'Armiento M, Roncalli M, Sansano S,
Vecchione R, et al: The HOX gene network in hepatocellular
carcinoma. Int J Cancer. 129:2577–2587. 2011. View Article : Google Scholar : PubMed/NCBI
|
|
27
|
Kim J, Piao HL, Kim BJ, Yao F, Han Z, Wang
Y, Xiao Z, Siverly AN, Lawhon SE, Ton BN, et al: Long noncoding RNA
MALAT1 suppresses breast cancer metastasis. Nat Genet.
50:1705–1715. 2018. View Article : Google Scholar : PubMed/NCBI
|
|
28
|
Kim J, Yu L, Chen W, Xu Y, Wu M, Todorova
D, Tang Q, Feng B, Jiang L, He J, et al: Wild-type p53 promotes
cancer metabolic switch by inducing PUMA-dependent suppression of
oxidative phosphorylation. Cancer Cell. 35:191–203.e8. 2019.
View Article : Google Scholar : PubMed/NCBI
|
|
29
|
Gregory RI and Shiekhattar R: MicroRNA
biogenesis and cancer. Cancer Res. 65:3509–3512. 2005. View Article : Google Scholar : PubMed/NCBI
|
|
30
|
Zhang Y, Tang C, Yu T, Zhang R, Zheng H
and Yan W: MicroRNAs control mRNA fate by compartmentalization
based on 3′ UTR length in male germ cells. Genome Biol. 18:1052017.
View Article : Google Scholar : PubMed/NCBI
|
|
31
|
Lu J, Getz G, Miska EA, Alvarez-Saavedra
E, Lamb J, Peck D, Sweet-Cordero A, Ebert BL, Mak RH, Ferrando AA,
et al: MicroRNA expression profiles classify human cancers. Nature.
435:834–838. 2005. View Article : Google Scholar : PubMed/NCBI
|
|
32
|
Peluso I, Yarla NS, Ambra R, Pastore G and
Perry G: MAPK signalling pathway in cancers: Olive products as
cancer preventive and therapeutic agents. Semin Cancer Biol.
56:185–195. 2019. View Article : Google Scholar : PubMed/NCBI
|
|
33
|
Ki MR, Lee HR, Goo MJ, Hong IH, Do SH,
Jeong DH, Yang HJ, Yuan DW, Park JK and Jeong KS: Differential
regulation of ERK1/2 and p38 MAP kinases in VacA-induced apoptosis
of gastric epithelial cells. Am J Physiol Gastrointest Liver
Physiol. 294:G635–G647. 2008. View Article : Google Scholar : PubMed/NCBI
|
|
34
|
Kim EK and Choi EJ: Compromised MAPK
signaling in human diseases: An update. Arch Toxicol. 89:867–882.
2015. View Article : Google Scholar : PubMed/NCBI
|