Introduction
Liver cancer is one of the most common malignant
tumours in clinical practice (1).
There are currently ~800,000 new liver cancer cases every year
worldwide, and almost half of these cases are in China (2). Liver cancer has an insidious onset, and
is prone to invasion and metastasis. At diagnosis, surgery is no
longer a treatment option for the majority of patients; therefore,
the mortality is very high. The early diagnosis and treatment are
key for increasing the survival rate of patients with liver cancer
(3). Currently, commonly used liver
cancer markers, such as α fetoprotein, have a certain specificity;
however, the majority of markers have low sensitivity. Therefore,
when liver cancer is confirmed, it is often already at a late stage
(4,5). Thus, the elucidation of the mechanism
underlying liver cancer invasion and metastasis, and the
development of highly effective and non-invasive diagnostic and
prognostic markers are of great importance for the diagnosis and
treatment of liver cancer.
α-enolase, also known as enolase 1 (ENO1), is a
multifunctional protein. In addition to catalysing glycolysis, ENO1
is also involved in transcription, apoptosis regulation and cell
differentiation, and plays an important role in a number of
biological and pathophysiological processes. Some studies have
reported that ENO1 plays important roles in the development and
progression of some malignant tumours (6–8). It has
been confirmed that ENO1 is closely associated with liver cancer
(9); however, the role of ENO1 in
liver cancer is still unclear, and relevant studies on the level of
serum anti-ENO1 antibody have not been reported yet. In the present
study, the role of ENO1 in the invasion and metastasis of liver
cancer cells was investigated, as well as the expression of ENO1 in
liver cancer tissues and that of anti-ENO1 antibody in the
peripheral blood of patients with liver cancer, to evaluate the
clinical value of ENO1 in liver cancer.
Patients and methods
Clinical specimens
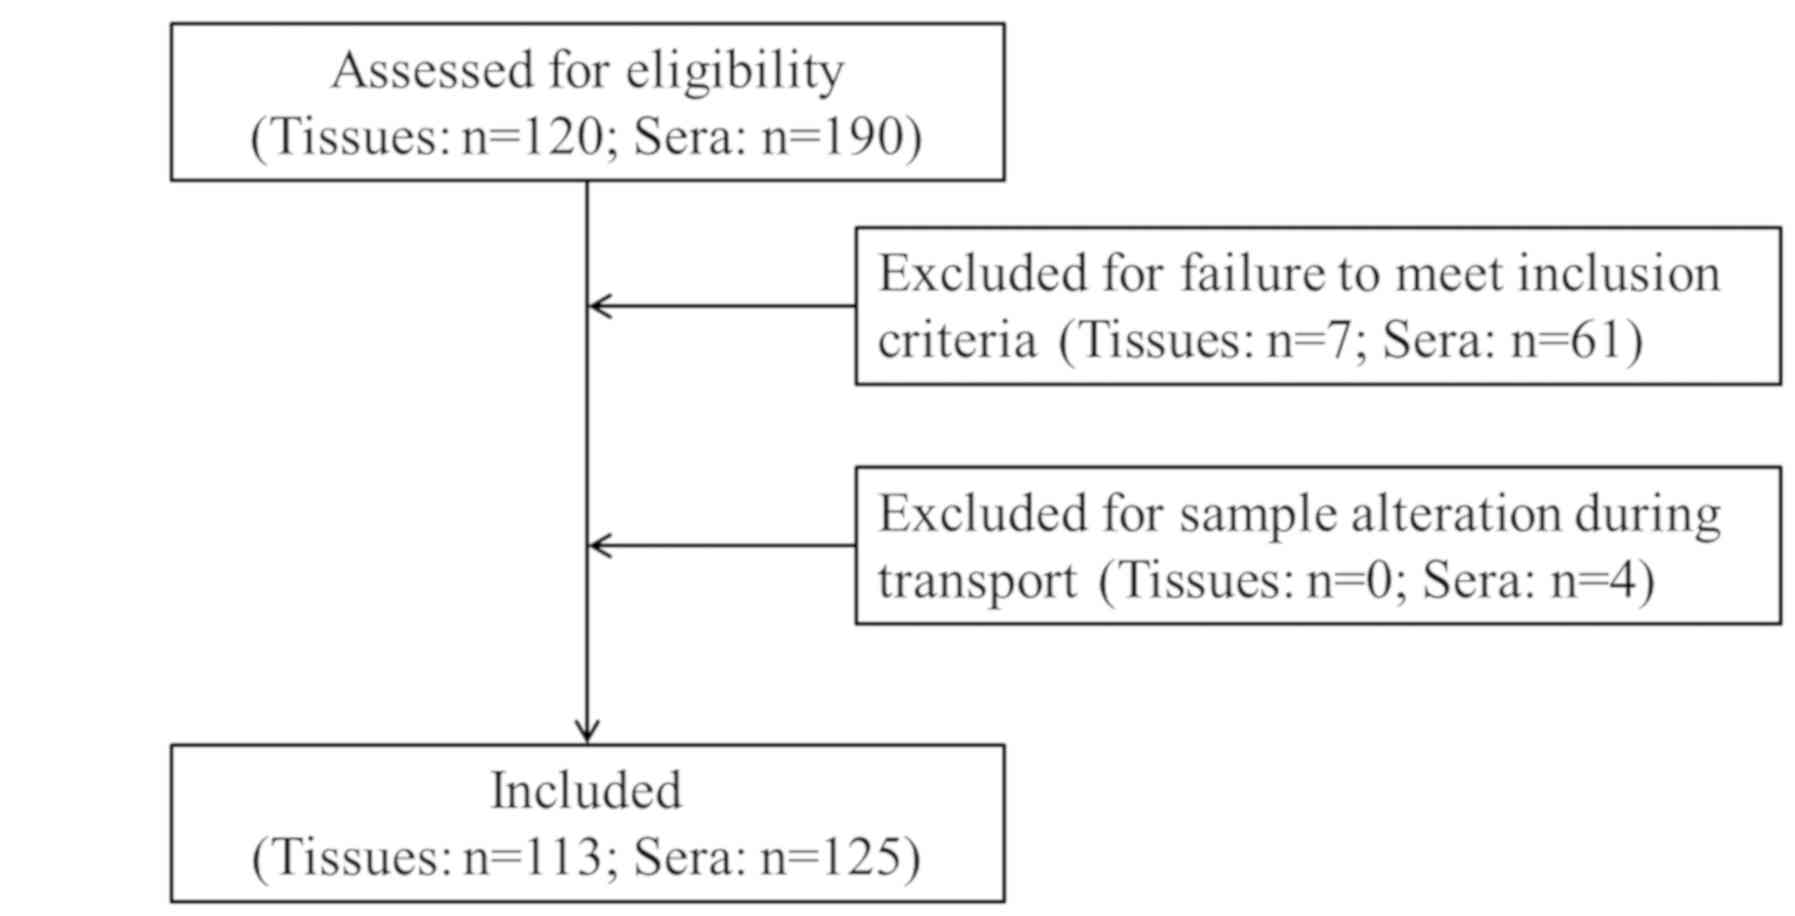
A total of 80 pathological tissue specimens and 56
serum specimens were collected from patients who were
pathologically diagnosed with liver cancer and did not receive
treatment between January 2017 and June 2019 at Shaoxing People's
Hospital (Shaoxing, China). A total of 33 pathological tissue
specimens (including 21 males and 12 females; mean age of 62.3
years; 14 cases of liver cyst, 10 cases of liver fibroma, 7 cases
of liver abscess, 1 case of hepatitis and 1 case of hepatic
hamartoma) and 29 serum specimens (including 16 males and 13
females; mean age of 56.7 years; 13 cases of liver cyst, 10 cases
of liver fibroma and 6 cases of liver abscess) were collected from
patients with benign liver lesions. In addition, 40 serum specimens
from healthy individuals who received a physical examination during
the same period were collected and used as the control group. A
patient flow diagram showing the selection of the study population
is presented in Fig. 1. The study
was approved by the Ethics Committee of Shaoxing People's Hospital
(Shaoxing, China) and signed informed consent was obtained from the
patients.
The tissue specimens were fixed in 10% neutral
formalin at room temperature for 24 h, routinely embedded in
paraffin, sectioned into 4-µm-thick sections, and stored at 4°C.
Peripheral blood specimens (3 ml) were placed in vacuum blood
collection tubes and centrifuged at 2,000 × g at 4°C for 5 min.
Serum samples were collected, aliquoted and stored at −20°C.
Cells and reagents
The human liver cancer HepG2 and Huh7 cell lines
were purchased from the Chinese Academy of Sciences Shanghai Cell
Bank. Rabbit anti-ENO1 monoclonal antibodies were purchased from
Abcam (cat. no. ab85086) for use in immunohistochemistry and
western blotting. Anti-rabbit IgG secondary antibody (cat. no.
IB000086) was purchased from OriGene Technologies, Inc., for use in
immunohistochemistry. Mouse anti-β-actin monoclonal antibody (cat.
no. DW9562; Bioworld Technology, Inc.), horseradish peroxidase
(HRP)-conjugated goat anti-rabbit IgG (cat. no. 130321; Hangzhou
HuaAn Biotechnology Co., Ltd.) and anti-mouse antibodies (cat. no.
BS12471; Bioworld Technology, Inc.) were used for western blotting.
The immunohistochemistry reagent kit was purchased from Fuzhou
Maixin Biotech Co., Ltd., (cat. no. KIT5003). The anti-ENO1
antibody ELISA detection reagent kit (cat. no. CSB-EQ027775HU) was
purchased from CUSABIO Technology LLC. Small interfering RNA
(siRNA) sequences were purchased from Guangzhou RiboBio Co., Ltd.,
(cat. nos. siG10623162542, siG10623162557 and siN05815122147).
Lipo6000™ transfection reagent and Cell Counting Kit-8 (CCK-8) were
purchased from Beyotime Institute of Biotechnology (cat. nos. C0526
and C0038, respectively). The primers (cat. no. H001) were
purchased from Sangon Biotech Co., Ltd. One Step SYBR®
PrimeScript™ RT-PCR kit was purchased from Takara Bio, Inc. (cat.
no. RR086A). SDS-PAGE Gel kit (cat. no. P1200) and
Phenylmethylsulfonyl fluoride (PMSF; cat. no. P0100) were purchased
from Beijing Solarbio Science & Technology Co., Ltd. Biolonase
was purchased from Shanghai Biolong Biotech Co., Ltd. RIPA protein
lysis solution was purchased from Biotium, Inc. Protein marker was
purchased from Invitrogen (cat. no. 26616; Thermo Fisher
Scientific, Inc.). Transwell plates were purchased from Corning,
Inc. (cat. no. 3422). Matrigel was purchased from BD Biosciences
(cat. no. 356234).
Experimental procedures
Detection of ENO1 levels in liver
cancer tissues using immunohistochemistry
The rabbit monoclonal antibody anti-ENO1 was used
for analysis. Endogenous peroxidase was blocked with 3%
H2O2 at room temperature for 10 min after
antigen retrieval in a microwave heated to 121°C for 150 sec,
xylene washing and rehydration in a descending alcohol series (100,
95 and 85%). The slides were incubated with 10% normal goat serum
(cat. no. ZLI-9056; OriGene Technologies, Inc.) at room temperature
for 1 h, followed by three washes using PBS and incubation with
anti-ENO1 antibody (1:800) at 4°C overnight. Subsequently, the
slides were incubated with anti-rabbit IgG (1:1; cat. no. IB000086;
OriGene Technologies, Inc.) at room temperature for 20 min and
stained with 3,3′-diaminobenzidine (1:20; cat. no. PV-8000D;
OriGene Technologies, Inc.) for 8 min at room temperature.
Counterstaining was performed with haematoxylin for 20 sec at room
temperature.
Five representative fields of each section were
selected and captured under a high-power light microscope
(magnification, ×100; cat. no. BX41; Olympus Corp.), and 100 tumour
cells in each field were counted. A total of 500 cells were
counted. The localization of ENO1 was observed in the cytoplasm,
cell membrane or cell nucleus. Positive cells exhibited yellow or
yellow-brown particles. The cells in which the positive signal was
≥5% were considered positive, and those in which the positive
signal was <5% were considered negative.
Detection of serum anti-ENO1
antibodies using ELISA
Standard and patient samples were added to 96-well
plates separately, and then 100 µl HRP-labelled monoclonal antibody
(1:100; included in the anti-ENO1 antibody ELISA detection reagent
kit) was added to each well. The plates were washed 5 times after
incubation at 37°C for 60 min, and then developer A and B (50 µl
each) was added to each well. The optical density (OD) values were
measured at a 450-nm wavelength after development at 37°C for 15
min without light. The concentrations of the standard samples and
the measured OD values of each plate were used to plot a standard
curve, and a linear regression equation of the standard curve was
calculated. The OD values of the samples were introduced into the
equation to calculate the concentrations of the samples.
Experiments were repeated at least three times.
Cell culture and transfection
Human liver cancer cell lines, HepG2 and Huh7, were
routinely cultured at 37°C and 5% CO2 in a humidified
environment in complete Dulbecco's modified Eagle's medium (DMEM)
containing 10% foetal bovine serum (FBS) (both HyClone; Thermo
Fisher Scientific, Inc.). The culture medium was then aspirated,
the cells were washed twice with reduced serum medium (Opti-MEM;
Gibco; Thermo Fisher Scientific, Inc.), and 2 ml culture medium was
slowly added to each well in the 6-well plates along the inner
wall. Next, 250 µl 0.05 µM siRNA and negative control (NC) reagent
was added to each well and cultured for 4–6 h. The culture medium
and the transfection reagent mixture solution were discarded, and
the cells were washed twice with PBS. Complete DMEM containing 10%
FBS was added, and the cells were cultured for 24 or 48 h in a 37°C
and 5% CO2 humidified environment. The cells were
collected, and RNA and protein were extracted to determine the
interference effect. The sequence of siRNA specific to ENO1 was
different in the interference group 1 (si-1)
(5′-GCATTGGAGCAGAGGTTTA-3′) and the interference group 2 (si-2)
(5′-CCCAGTGGTGTCTATCGAA-3′).
Validation of the interference
effect
At 48 h post-transfection, the interference effect
was measured. The interference effect of ENO1-siRNA was evaluated
by determining the downregulation of the ENO1 gene and protein.
Reverse transcription-quantitative PCR (RT-qPCR) and western blot
analysis were performed 3 times. The mean value of the experimental
results was used as the relative expression level of ENO1.
a) RT-qPCR. A 20-µl PCR system was used. The total
RNA volume in each group was 2 µl, and 0.8 µl of upstream and
downstream primers, respectively, was added. A total of 5.6 µl
ddH2O, 10 µl 2X One Step SYBR® RT-PCR Buffer
4 and 0.8 µl PrimeScript One Step Enzyme Mix 2 were used. The
reaction conditions were as follows: Stage 1, 42°C for 5 min and
95°C for 10 sec; stage 2, 95°C for 5 sec and 60°C for 20 sec (40
cycles). The primer sequences were as follows: ENO1 forward,
5′-GCCTCCTGCTCAAAGTCAAC-3′ and reverse, 5′-AACGATGAGACACCATGACG-3′;
and β-actin forward, 5′-CATGTACGTTGCTATCCGAGGC-3′ and reverse,
5′-CTCCTTATGACACGACACGAC-3′.
b) Western blot analysis. The cells of the three
groups (NC, negative control; si-1, siRNA interference group 1; and
si-2, siRNA interference group 2) were lysed in RIPA buffer
(RIPA:PMSF, 100:1), and their protein concentration was determined
using the bicinchoninic acid assay. Proteins were denatured at
100°C for 7 min and 30 µg protein/lane was loaded for SDS-PAGE on a
10% gel. Subsequently, proteins were transferred onto
polyvinylidene difluoride membranes (cat. no. IPVH00010; EMD
Millipore). The membranes were blocked with 5% non-fat milk at room
temperature for 2 h and incubated with primary antibodies against
ENO1 (1:2,000) and β-actin (1:5,000) at 4°C overnight, followed by
HRP-conjugated goat anti-rabbit IgG (1:5,000) and anti-mouse
secondary antibodies (1:6,000) at room temperature for 1 h. β-actin
expression was used as a control. The bands were visualized using
BeyoECL Plus Enhanced Chemiluminescence reagent (cat. no. P0018FS;
Beyotime Institute of Biotechnology). Carestream Molecular Imaging
software v5.0 (Carestream Health, Inc.) was used to measure the
greyscale density and calculate the relative expression levels.
Detection of cell proliferation using
CCK-8
Cells in logarithmic growth phase were used to
prepare a cell suspension that was inoculated into 6-well plates at
~3×10⁵ cells/well. Transfection was performed after 24 h
of conventional culture. At 24 h after transfection, a cell
suspension was prepared, and the cells were inoculated into 96-well
plates at ~5×10⁵ cells/well. At different time points
(24, 48 and 72 h after transfection), 10 µl CCK-8 detection
solution was added to each well, and the cells were cultured for 2
h. The absorbance at 450 nm (OD450) was measured using a microplate
reader. The liver cancer cell proliferation inhibition rate after
ENO1-siRNA transfection was calculated using the OD450 and the
following formula: Inhibition rate = (1 - control group
OD450/control group OD450) ×100%.
Assessment of cell migration ability
using a scratch test
The experimental liver cancer cells were seeded into
a 6-well plate at a density of 8×10⁵ cells/well. When
the cell density reached 100%, a cross mark was scratched in the
middle of the 6-well plate vertically using a disinfected sterile
pipette tip (200 µl). The cells were repeatedly washed with sterile
PBS buffer (6–8 times) until the floating cells were completely
removed. The culture medium was replaced with serum-free DMEM, and
changes in the scratches were observed and photographed under a
microscope at 0, 24 and 48 h. The gap size was measured using
ImageJ software v1.52a (National Institutes of Health), and the
percentage migration was calculated based on the size of the wound
at 0 h. The experiment was repeated three times for each group. The
effects of different treatment factors on the migration ability of
the cells were compared.
Assessment of the migration and
invasion ability of cells using a Transwell assay
Transwell inserts (8 µm, 24-well plate; Corning,
Inc.) were used to analyse the migration and invasion abilities of
liver cancer cell lines. For the invasion assay, the membrane at
the bottom of the upper chambers of a Transwell plate was coated
with Matrigel. A total of 50 µl of 50 mg/l Matrigel were diluted in
serum-free DMEM at a ratio of 1:6, added to each well and incubated
at 37°C for 30 min. For the migration assay, uncoated Transwell
chambers were used. For both the migration and invasion assays, a
600-µl cell suspension containing 1.5×10⁵ cells in
serum-free DMEM was added to the upper chambers of the Transwell,
and 600 µl DMEM with 10% FBS was added to the lower chambers. The
cells were routinely cultured for 24 h (migration assay) or 48 h
(invasion assay), fixed in 4% paraformaldehyde for 15 min at room
temperature and stained in Giemsa for 15 min at room temperature.
Five fields were randomly selected, and images were captured using
an inverted fluorescence microscope (magnification, ×400; cat. no.
CKX41; Olympus Corporation). The cells were counted using ImageJ
software (National Institutes of Health), and each experiment was
repeated three times.
Statistical analysis
Statistical analysis was performed using SPSS v19.0
(IBM Corp.) for Windows. The measurement data were presented as the
mean ± SD, or as the median and percentiles
(P25-P75). An unpaired Student's t-test was
used to determine the differences between two groups. The
Kruskal-Wallis test was used to determine the differences among
multiple groups, followed by Dunn's test as the post hoc test to
determine any significant differences between individual groups.
The χ2 test was performed to analyse the association of
ENO1 with clinicopathological characteristics. P<0.05 was
considered to indicate a statistically significant difference.
Receiver operating characteristic (ROC) curve analysis was used to
analyze the efficiency of the anti-ENO1 antibody in the diagnosis
of liver cancer.
Results
ENO1 expression in liver cancer
tissues
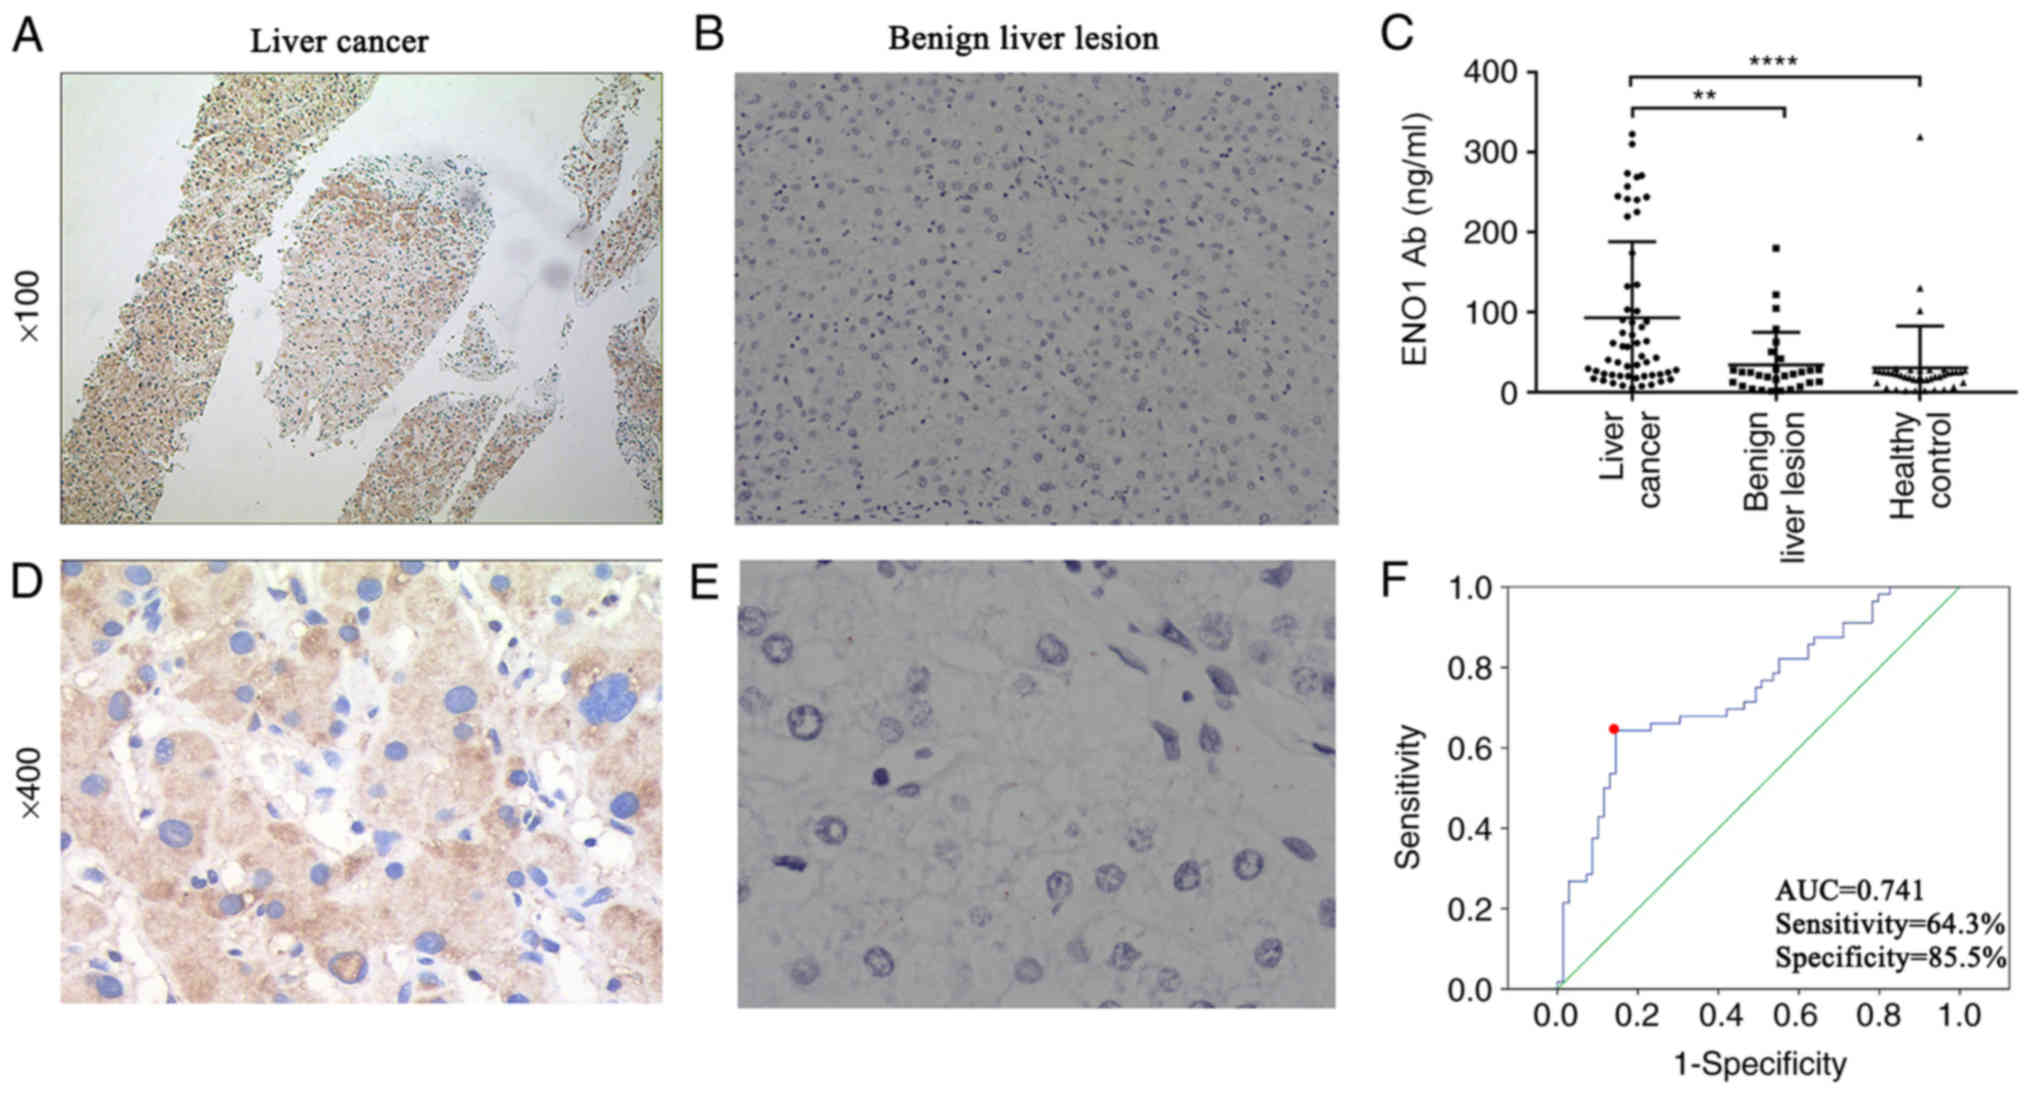
ENO1 expression in tumour tissues (Fig. 2A and D) was primarily localized in
the cytoplasm, with some localization also observed in the cell
membrane and nucleus. ENO1 expression was not expressed in the
majority of the benign liver lesions (Fig. 2B and E). ENO1 expression was observed
in all 80 tumour tissues from patients with liver cancer. The
expression levels of ENO1 based on the clinical stage, age and sex,
were compared among all the groups using the c2 test
(Table I). Table I shows that ENO1 expression in liver
cancer tissue (43.8%) was significantly higher than that in benign
liver lesions (15.2%) (c2=8.356; P=0.005). ENO1
expression was not associated with clinical stage, age or sex (all
P>0.05).
 | Table I.ENO1 expression in pathological
tissues. |
Table I.
ENO1 expression in pathological
tissues.
|
|
| ENO1 expression |
|
|
|
|---|
|
|
|
|
|
|
|
|---|
| Group | No. of cases | Positive | Negative | Positive rate, % | χ2 | P-value |
|---|
| Benign lesion
tissue | 33 | 5 | 28 | 15.2 | 8.356 | 0.005 |
| Liver cancer
tissue | 80 | 35 | 45 | 43.8 |
|
|
| Clinical stage |
|
|
|
| 0.250 | 0.157 |
| I+II | 37 | 21 | 16 | 56.8 |
|
|
| III | 43 | 22 | 21 | 51.2 |
|
|
| Age, years |
|
|
|
| 0.033 | 0.525 |
|
>60 | 54 | 24 | 30 | 44.4 |
|
|
| ≤60 | 26 | 11 | 15 | 42.3 |
|
|
| Sex |
|
|
|
| 1.270 | 0.276 |
| Male | 64 | 26 | 38 | 40.6 |
|
|
|
Female | 16 | 9 | 7 | 56.3 |
|
|
Expression of anti-ENO1 antibody in
the peripheral blood of patients with liver cancer
The levels of anti-ENO1 antibody among the three
groups (NC, si-1 and si-2) were compared. The anti-ENO1 antibody
concentrations in the three groups showed skewed distributions.
Therefore, the levels were expressed using P50
(P25-P75). The anti-ENO1 antibody levels
among the three groups were compared using the Kruskal-Wallis test,
and Dunn's post hoc test was used for the comparisons between two
groups (Fig. 2C and Table II). As presented in Table II, i) the anti-ENO1 antibody levels
in the liver cancer group were significantly higher than those in
the control and benign liver lesion groups (P<0.001). The
anti-ENO1 antibody levels between the benign liver lesion and
control groups were not significantly different (P=0.523); and ii)
the anti-ENO1 antibody levels were not associated with age, sex or
clinical stage (P=0.835, 0.326 and 0.138, respectively).
| Table II.Comparison of the serum anti-ENO1
antibody levels among the three groups of participants [P50
(P25-P75)]. |
Table II.
Comparison of the serum anti-ENO1
antibody levels among the three groups of participants [P50
(P25-P75)].
| Group | No. of cases | Anti-ENO1 antibody,
ng/ml | P-value |
|---|
| Liver cancer | 56 | 50.88
(21.67–133.97) |
<0.001a |
| Age, years |
|
| 0.835 |
|
>60 | 23 | 57.42
(21.57–90.44) |
|
|
≤60 | 33 | 45.01
(21.08–197.08) |
|
| Sex |
|
| 0.326 |
|
Male | 38 | 50.88
(22.41–225.12) |
|
|
Female | 18 | 45.77
(20.15–100.98) |
|
| Clinical stage |
|
| 0.138 |
|
I+II | 27 | 61.36
(24.88–244.18) |
|
|
III | 29 | 34.12
(20.13–118.08) |
|
| Benign liver
lesion | 29 | 22.94
(10.02–35.21) | 0.523b |
| Healthy
control | 40 | 21.46
(12.83–26.90) |
|
Diagnostic value of the anti-ENO1
antibody level in liver cancer
The ROC curve of liver cancer diagnosis using
anti-ENO1 antibody levels was plotted, and the area under the curve
(AUC) was calculated. The location with the largest Youden index
was used as the best screening cut-off value. The cut-off value for
liver cancer diagnosis using the anti-ENO1 antibody level was 29.33
ng/ml; the AUC was 0.741, the sensitivity was 64.3%, and the
specificity was 85.5% (Fig. 2F).
Validation of the interference
effect
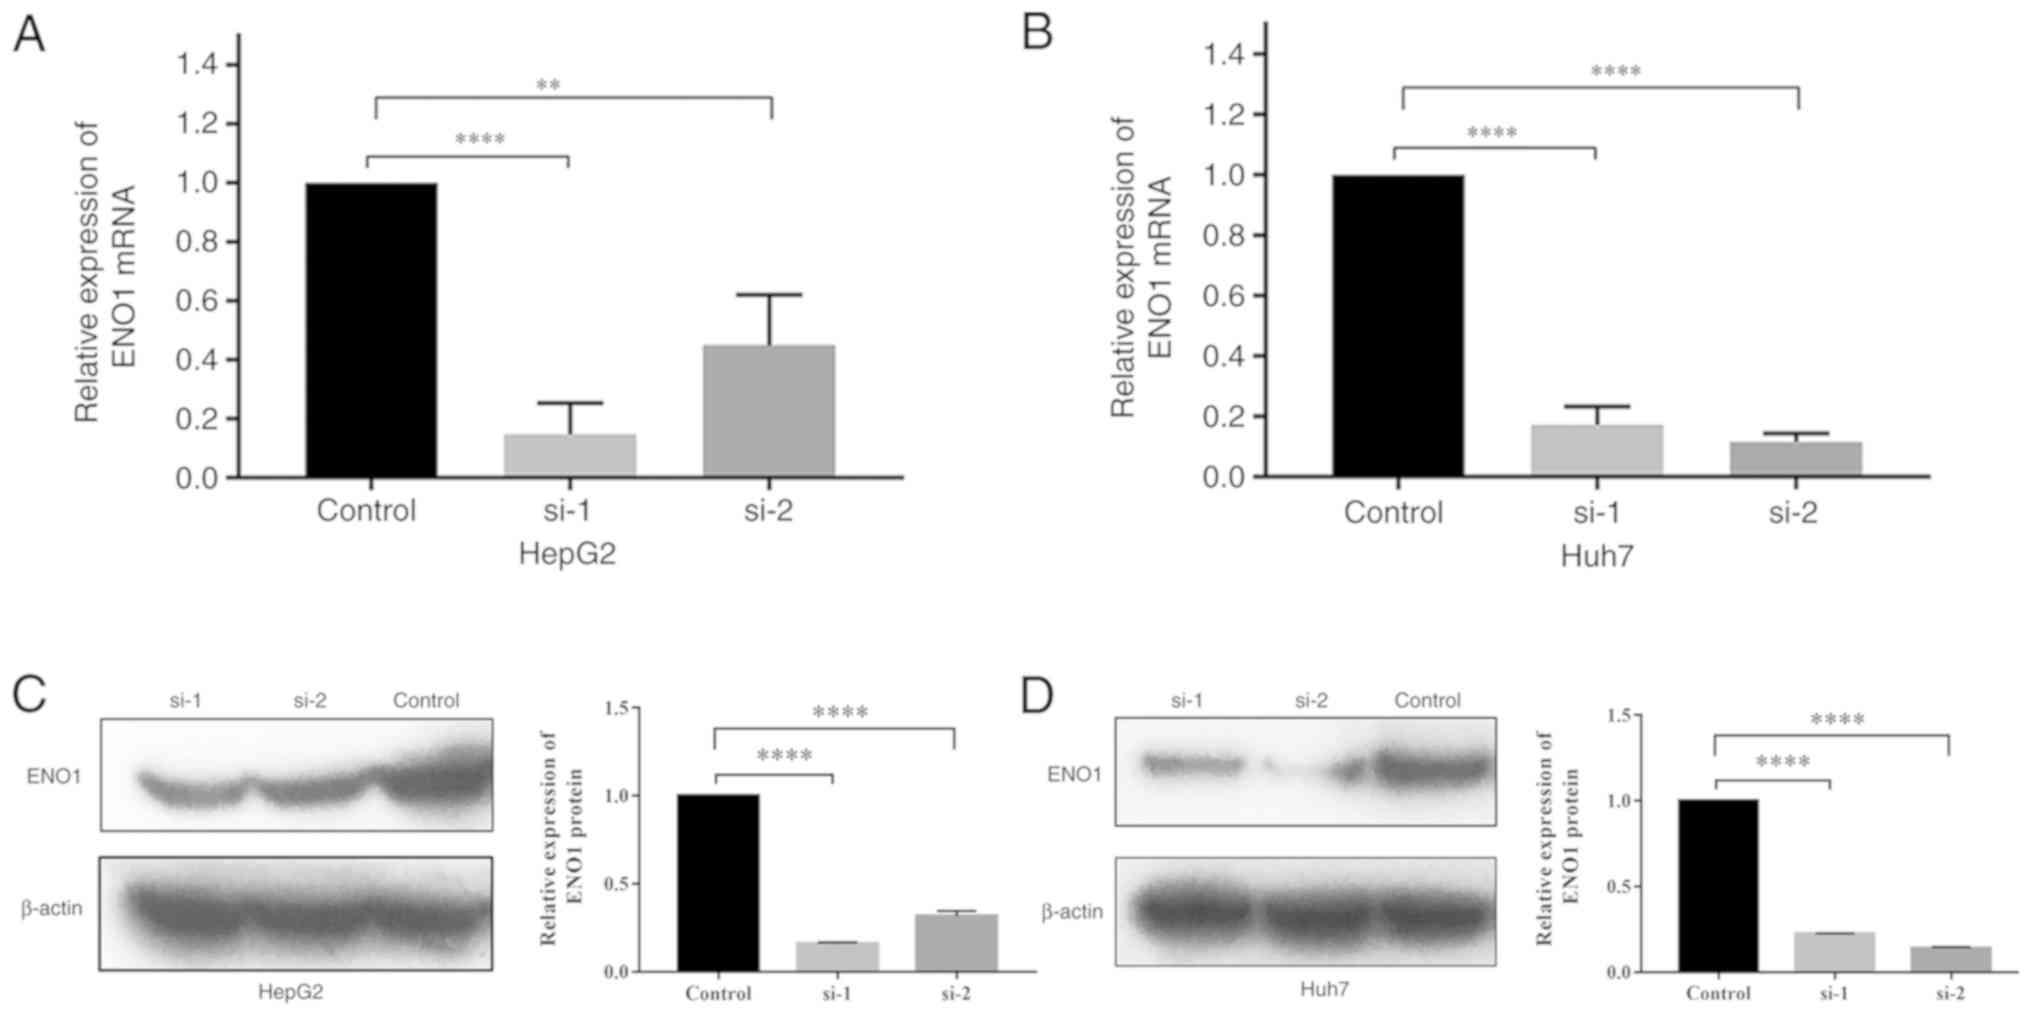
RT-qPCR
The relative expression levels of the ENO1 gene in
the siRNA groups, si-1 and si-2, were both significantly lower than
those in the control group. Compared with that in the control
group, the ENO1 interference rate in HepG2 cells reached 85.3% in
the si-1 group and 55.0% in the si-2 group. The interference rate
in Huh7 cells reached 82.8% in the si-1 group and 88.4% in the si-2
group (Fig. 3A and B).
Western blot analysis
The western blot analysis results are presented in
Fig. 3C and D. The ENO1 expression
levels were normalized to β-actin expression levels. The results
showed that the relative expression levels of the ENO1 protein in
HepG2 and Huh7 cells in the si-1 and si-2 groups were significantly
lower than those in the control group (P<0.0001).
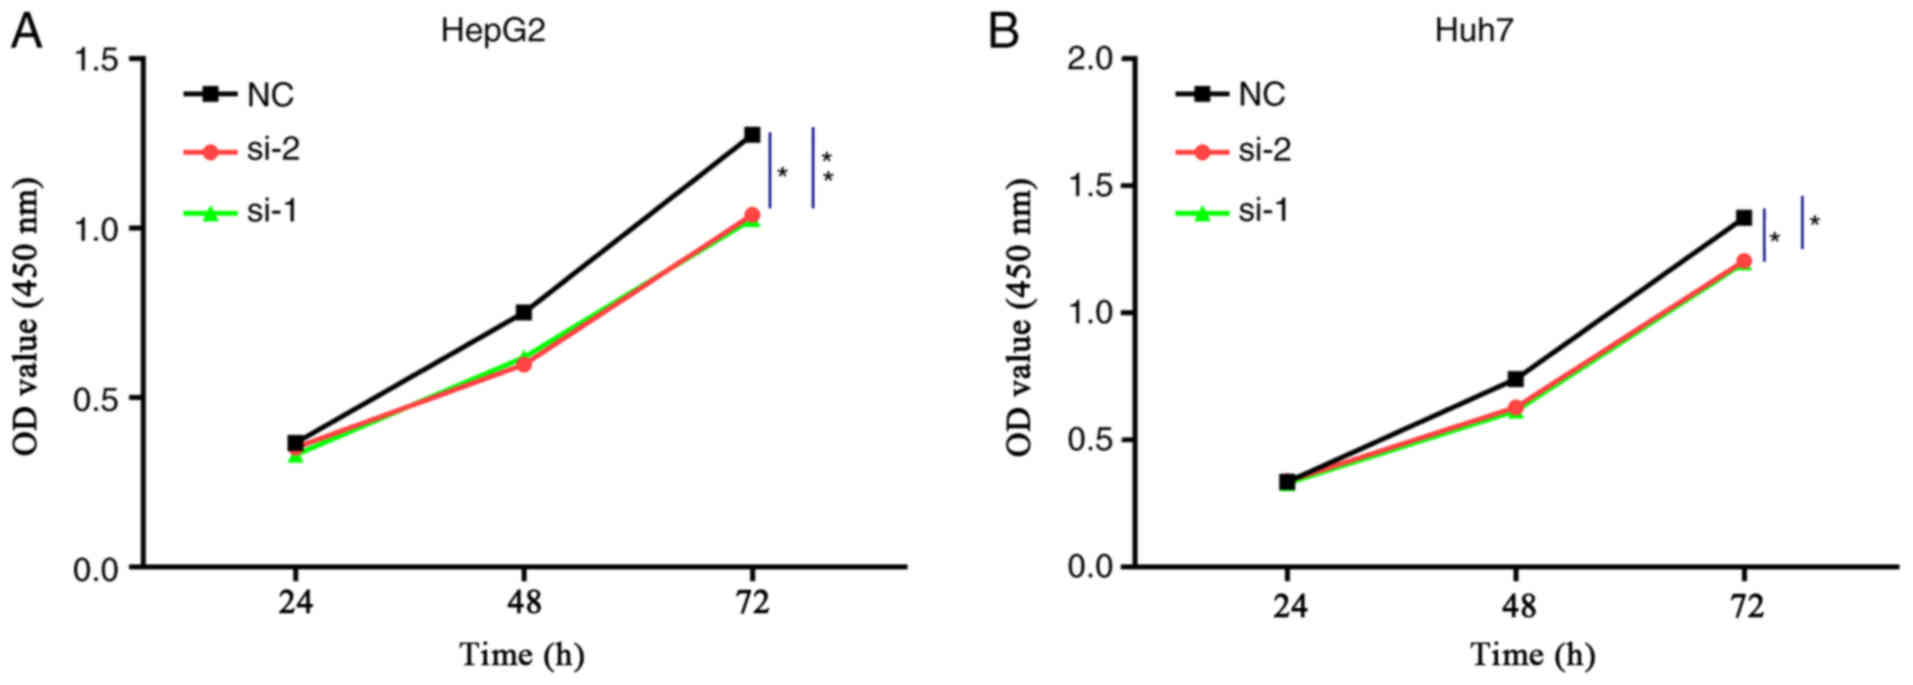
Effect of ENO1 interference on the
proliferation of liver cancer cells
The results of the CCK-8 assay showed that, compared
with the NC group, ENO1 siRNA treatment resulted in different
degrees of HepG2 and Huh7 cell proliferation inhibition after 72 h
of transfection, and the differences were statistically significant
as analysed by Kruskal-Wallis test (Fig.
4).
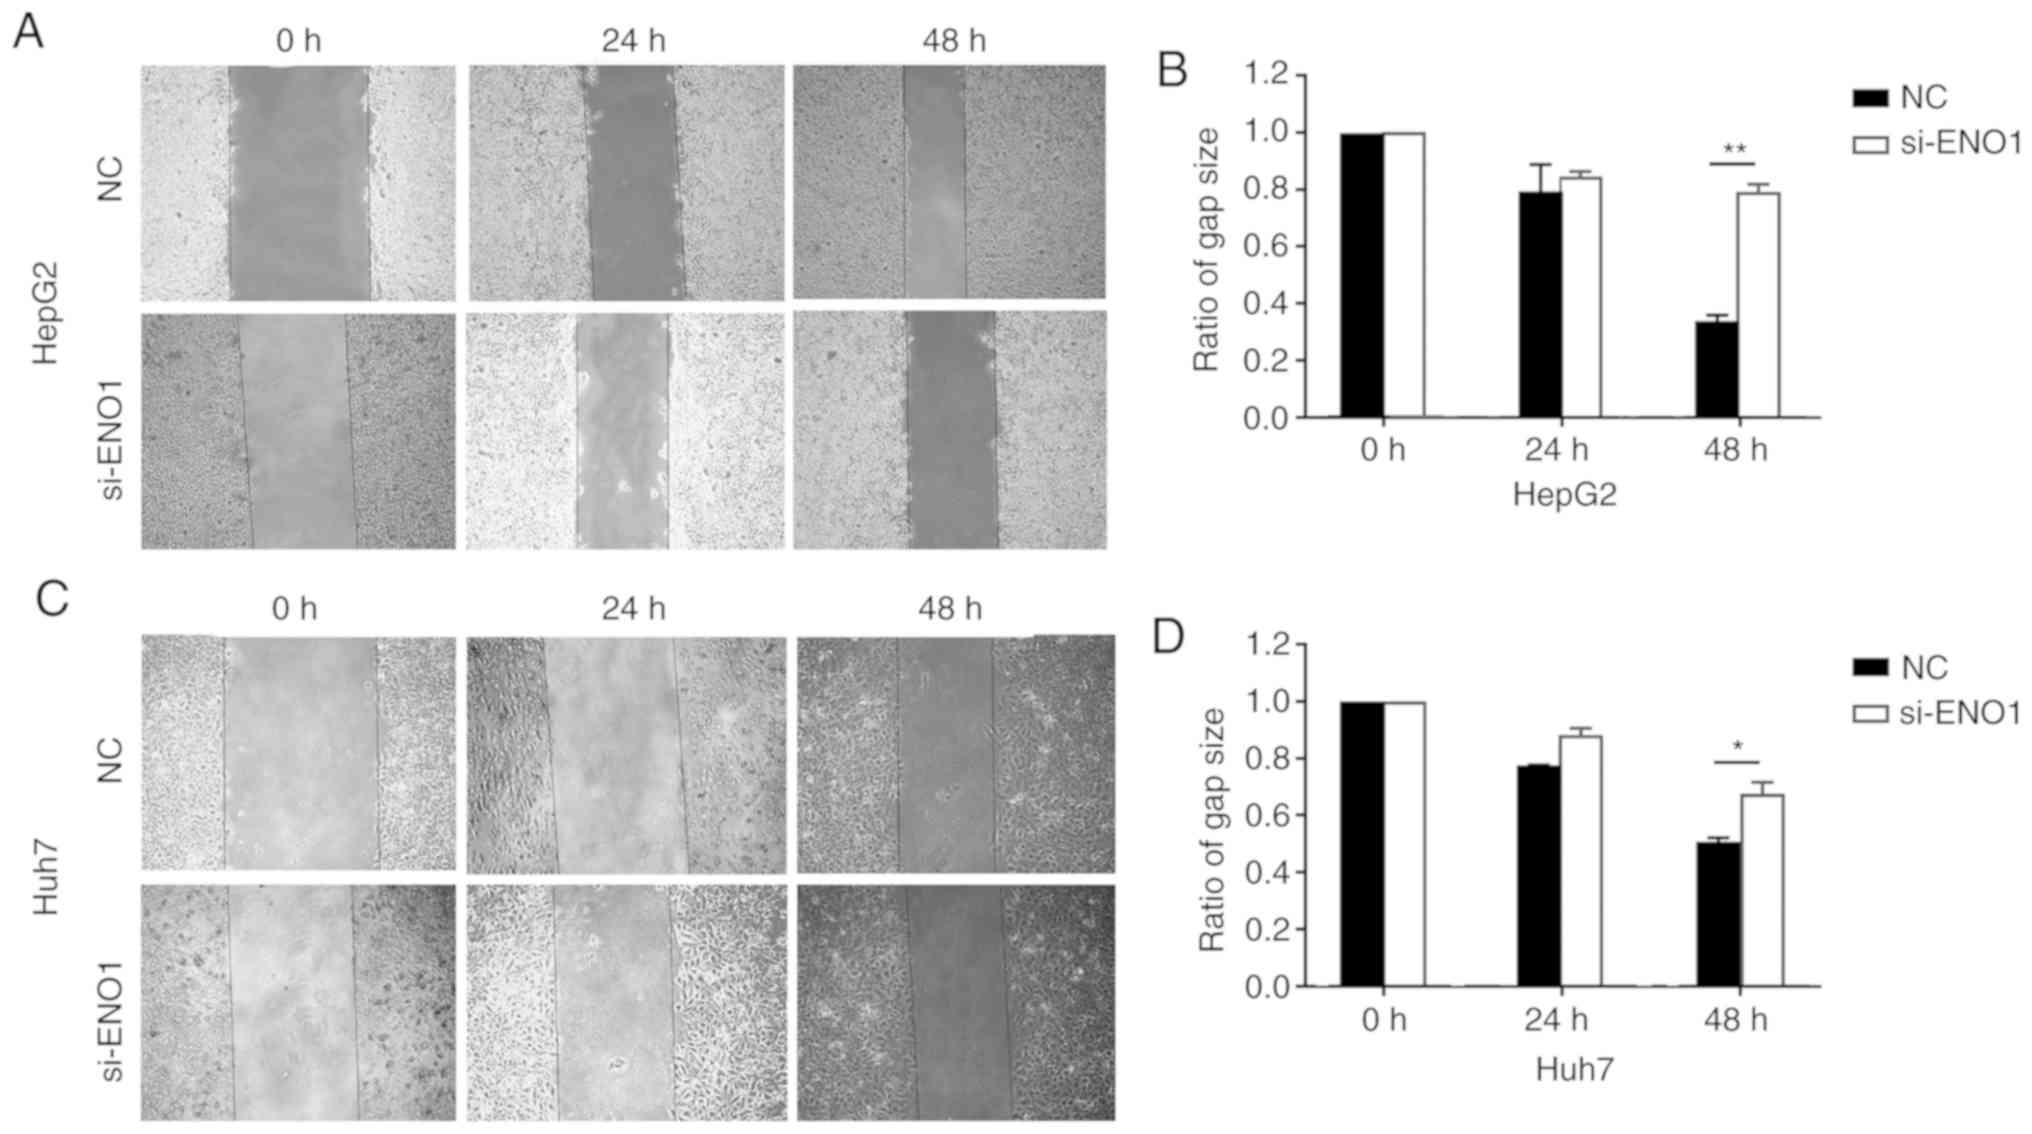
Effect of ENO1 interference on the
migration ability of liver cancer cells
The results of the scratch tests showed that,
compared with the NC group, HepG2 and Huh7 cell migration after
ENO1 siRNA treatment became slower, and the differences were
statistically significant by Student's t-test at 48 h after
treatment (Fig. 5).
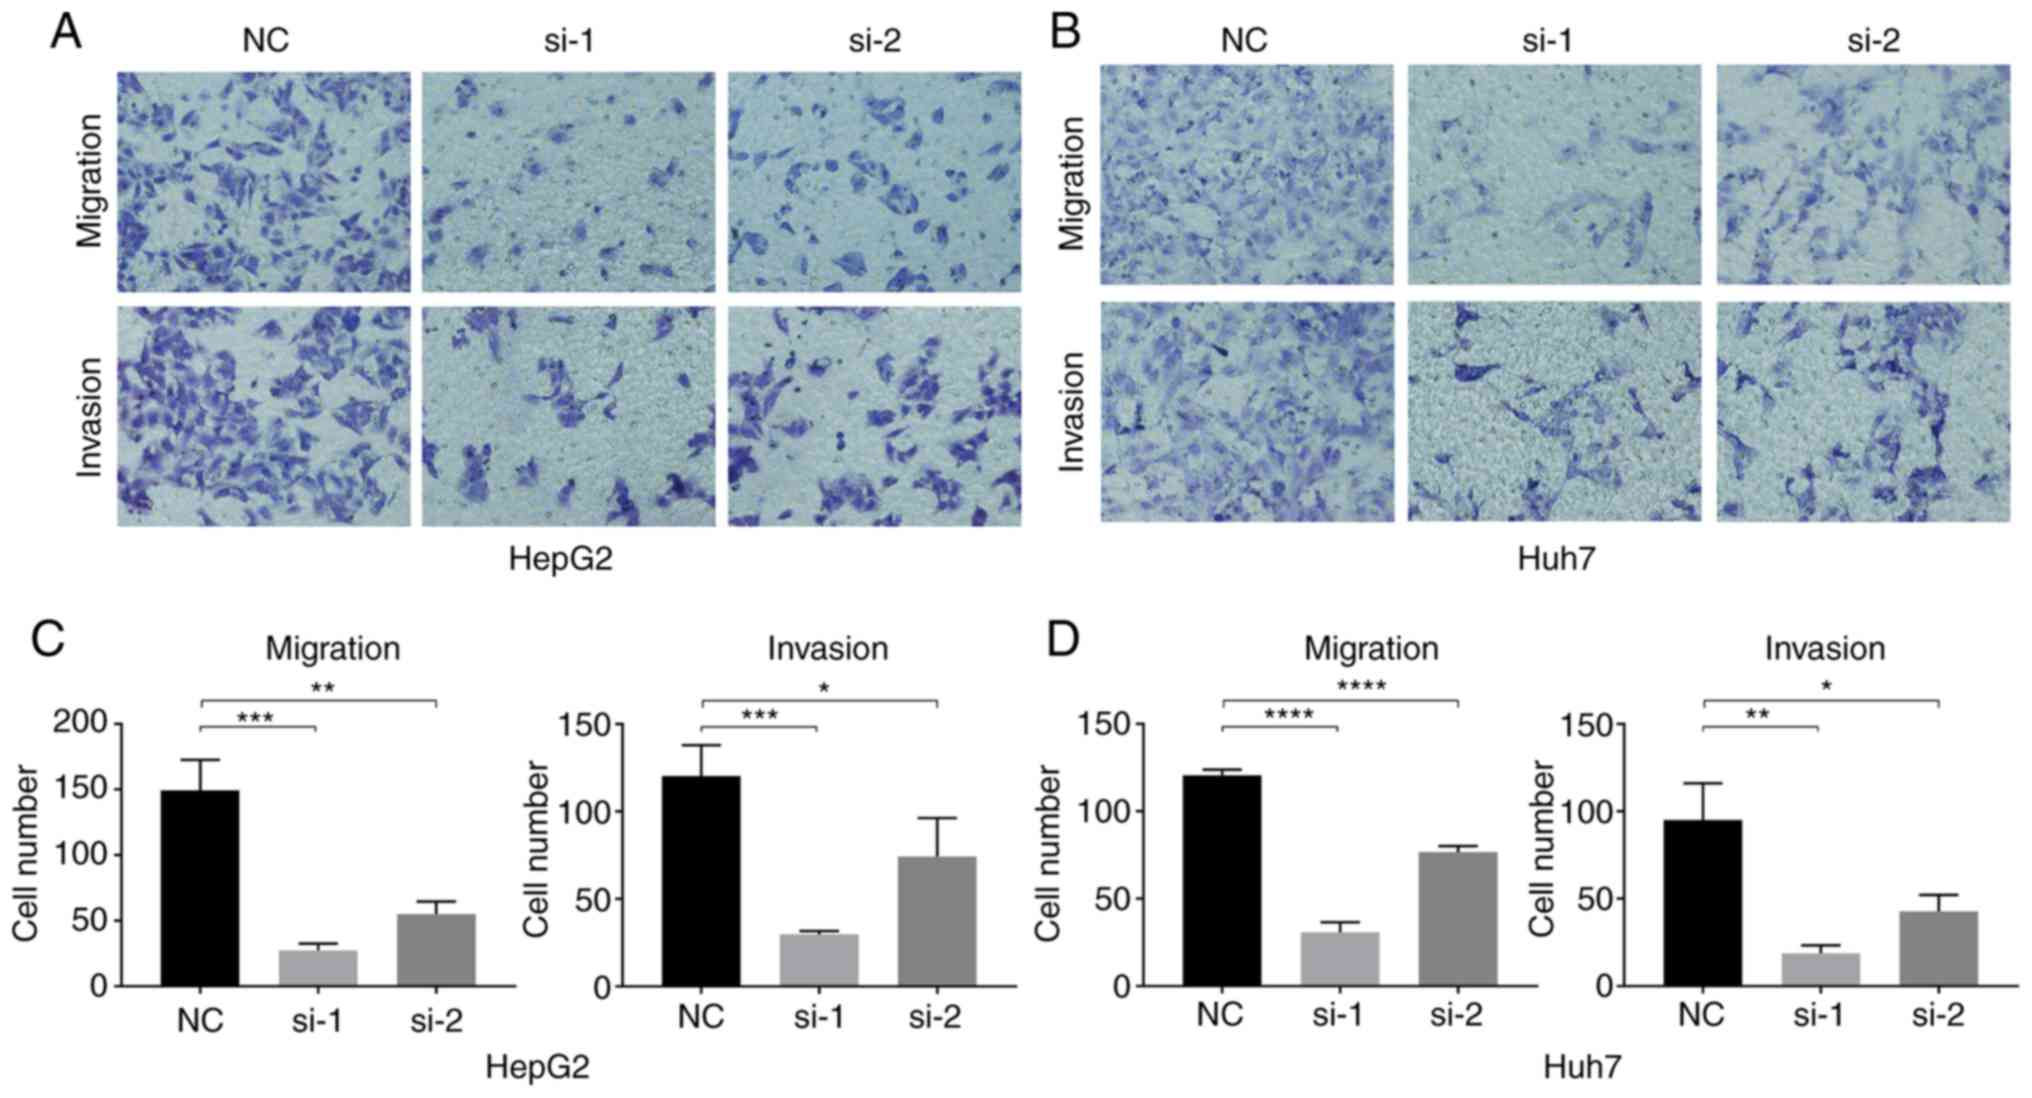
Effect of ENO1 downregulation on the
invasion ability of liver cancer cells
The results of the Transwell experiment showed that,
compared with the NC group, the in vitro invasion and
migration abilities of HepG2 and Huh7 cells after ENO1 siRNA
treatment significantly decreased (Fig.
6).
Discussion
ENO1, also known as α-enolase, is one of the three
subtypes of enolase. ENO1 is mainly present in the cytoplasm, but
also in the membrane and nucleus of a variety of eukaryotic cells.
This enzyme has important functions in cellular energy metabolic
processes. ENO1 converts 2-phosphoglycerate into
phosphoenolpyruvate during glycolysis and can also catalyse the
reverse reaction to convert phosphoenolpyruvate into
2-phosphoglycerate (10). In recent
years, the association of ENO1 with malignant tumours has received
increasing attention (11–13). A number of studies have observed
higher levels of ENO1 in cell lines and in vivo tissues of
malignant tumours, including pancreatic cancer, renal cell
carcinoma and glioma, suggesting that ENO1 has tumour
growth-promoting functions (14–16). The
main mechanism underlying the high ENO1 expression in tumour
tissues is associated with the Warburg effect proposed by Dr Otto
Warburg in 1956 (17). Warburg
hypothesized that the difference in energy source was the main
reason for the higher growth rate of tumour cells compared with
that of normal cells. Under sufficient oxygen conditions, tumour
cells utilize glucose mainly through the aerobic glycolysis
pathway, and reduce aerobic phosphorylation in mitochondria, which
is considered to be the most important cause of tumour development.
A study by Altenberg and Greulich (18) also confirmed that the genes of
glycolysis enzymes are ubiquitously overexpressed in tumour cells.
Altenberg and Greulich considered that the overexpression of
glycolysis enzymes might be a key factor causing excessive tumour
cell proliferation. Therefore, as an important glycolytic enzyme,
ENO1 might play an important role in the development, progression
and metastasis of malignant tumours.
A previous study by our group showed that ENO1 was
more highly expressed in lung cancer than in benign tumours;
additionally, the expression levels of serum ENO1 antibodies had a
diagnostic value in lung cancer (19). However, the role of ENO1 in the
development of liver cancer remains unclear and, to the best of our
knowledge, no studies have investigated the expression levels of
ENO1 antibodies in the peripheral blood and their diagnostic value
in liver cancer.
To further elucidate the role of ENO1 in liver
cancer invasion and metastasis, HepG2 and Huh7 liver cancer cells
were treated with ENO1 siRNA in the present study. The interference
effect was validated by RT-qPCR and western blot analysis. The
proliferation ability of liver cancer cells was measured using the
CCK-8 assay; the migration ability of liver cancer cells was
measured using a scratch experiment; and the invasion and migration
abilities of liver cancer cells were measured using a Transwell
assay. The results revealed that, after ENO1 gene interference, the
proliferation, migration and invasion abilities of HepG2 and Huh7
liver cancer cells exhibited different degrees of suppression,
suggesting that ENO1 promotes liver cancer growth and metastasis.
The expression of ENO1 protein in liver cancer tissue and benign
liver lesions was also measured using immunohistochemistry. The
results showed that the ENO1 protein expression in liver cancer
tissues (43.8%) was significantly higher than that in benign liver
lesions (15.2%), which was consistent with the results of a
previous study (9). In the present
study, no obvious association between ENO1 and clinical parameters
(stage, age or sex) was observed. However, Zhu et al
(9) suggested that ENO1 is
associated with Tumor Node Metastasis stage, which should be
further investigated using a larger sample size.
In the glycolysis pathway, a number of metabolic
enzymes, including ENO1, can be secreted from cells through the
exosome release pathway (20).
Furthermore, with ENO1 overexpression in tumour cells, ENO1 may be
released into peripheral blood through tumour cell apoptosis and
necrosis or other non-classical pathways (21).
However, the levels of ENO1 protein in the serum of
patients with liver cancer and of patients with benign liver
lesions were not significantly different in the present study,
which was inconsistent with the results of a previous study
(22). A reason for this
inconsistency may be that ENO1 expression is unstable and easy to
degrade in the serum environment; therefore, future studies should
perform experiments to further explore and confirm this
explanation. However, a high level of anti-ENO1 antibody in the
serum of patients with liver cancer was detected. The reasons are
as follows: As a tumour-associated antigen, ENO1 can stimulate the
immune system in the body to produce specific anti-ENO1
autoantibodies. However, the mechanism underlying the production of
autoantibodies remains unclear. It is possible that aberrant tumour
cells continue to die, causing sustained exposure of intracellular
proteins after post-translational modification or remodelling, and
that a variation in tumour cells stimulates the immune system to
induce an immune response to produce autoantibodies (23). The current tumour immunity theory
suggests that this immune response occurs in early-stage tumours,
and that the produced autoantibody has a more stable titre in
peripheral blood, suggesting that this autoantibody might be used
as a tumour-associated serum marker. The serum anti-ENO1 antibody
levels in patients with liver cancer, patients with benign liver
disease and healthy controls were measured using ELISA in the
present study. The results showed that the levels of anti-ENO1
antibody in the liver cancer group were significantly higher than
those in the benign liver lesion and control groups, whereas there
was no significant difference between the benign liver lesion and
healthy control groups. The present study also analysed the
association of the anti-ENO1 antibody level with age, sex and
clinical stage. The results revealed that the level of anti-ENO1
antibody was not associated with any of these factors. ROC curve
analysis showed that liver cancer diagnosis using anti-ENO1
antibody levels had a sensitivity of 64.3% and a specificity of
85.5%, suggesting that liver cancer diagnosis using anti-ENO1
antibody levels has a certain accuracy, and that patients have a
certain titre in peripheral blood in early-stage liver cancer.
However, a limitation of this study was the small sample size.
Therefore, the conclusions need to be further validated with a
larger sample size.
In conclusion, the results of the present study
indicated that ENO1 can promote liver cancer invasion and
migration. The ENO1 protein expression level in tissues and the
anti-ENO1 antibody level in peripheral blood have important value
for the diagnosis of liver cancer, and can be used as potential
liver cancer-associated markers. Serum anti-ENO1 antibody detection
has the advantages of convenient sample collection and minimal
trauma. Therefore, the value of anti-ENO1 antibodies in liver
cancer diagnosis may be greater than that of tissue protein
expression. However, there are some limitations in the present
study. The ability of invasion and migration of liver cancer cells
was only verified to decrease after interference of ENO1; however,
the changes after upregulation of ENO1 were not investigated, and
proliferation and invasion-related biomarkers were not determined.
The focus of our future research will be the molecular mechanism of
ENO1 that promotes liver cancer invasion and migration, as well as
relevant targets for the treatment of liver cancer.
Acknowledgements
Not applicable.
Funding
The present study was supported by the Basic Public
Welfare Research Project of Zhejiang Province (grant no.
LGF19H200004), the Medical and Scientific Research Project of
Zhejiang Province (grant no. 2020KY326) and the Science and
Technology Planning Project of Shaoxing (grant no. 2018C30057).
Availability of data and materials
The datasets used and/or analysed during the present
study are available from the corresponding author on reasonable
request.
Authors' contributions
LZ and LH conceived the study and wrote the
manuscript. LZ, LH and TL performed the experiments. YY assisted
with the collection and analysis of the patient data regarding the
clinicopathological parameters of liver cancer. All authors read
and approved the final manuscript.
Ethics approval and consent to
participate
The study was approved by the Ethics Committee of
Shaoxing People's Hospital (Shaoxing, China), and signed informed
consent was provided by the patients.
Patient consent for publication
Not applicable.
Competing interests
The authors declare that they have no competing
interests.
References
|
1
|
Bray F, Ferlay J, Soerjomataram I, Siegel
RL, Torre LA and Jemal A: Global cancer statistics 2018: GLOBOCAN
estimates of incidence and mortality worldwide for 36 cancers in
185 countries. CA Cancer J Clin. 68:394–424. 2018. View Article : Google Scholar : PubMed/NCBI
|
|
2
|
Gingold JA, Zhu D, Lee DF, Kaseb A and
Chen J: Genomic profiling and metabolic homeostasis in primary
liver cancers. Trends Mol Med. 24:395–411. 2018. View Article : Google Scholar : PubMed/NCBI
|
|
3
|
Youssef AA, Issa HA, Omar MZ, Behiry EG,
Elfallah AA, Hasaneen A, Darwish M and Ibrahim DB: Serum human
endothelial cell-specific molecule-1 (endocan) and vascular
endothelial growth factor in cirrhotic HCV patients with
hepatocellular carcinoma as predictors of mortality. Clin Exp
Gastroenterol. 11:431–438. 2018. View Article : Google Scholar : PubMed/NCBI
|
|
4
|
Zhang Z, Zhang Y, Wang Y, Xu L and Xu W:
Alpha-fetoprotein-L3 and Golgi protein 73 may serve as candidate
biomarkers for diagnosing alpha-fetoprotein-negative hepatocellular
carcinoma. Onco Targets Ther. 9:123–129. 2015.PubMed/NCBI
|
|
5
|
Park SJ, Jang JY, Jeong SW, Cho YK, Lee
SH, Kim SG, Cha SW, Kim YS, Cho YD, Kim HS, et al: Usefulness of
AFP, AFP-L3, and PIVKA-II, and their combinations in diagnosing
hepatocellular carcinoma. Medicine (Baltimore). 96:e58112017.
View Article : Google Scholar : PubMed/NCBI
|
|
6
|
Principe M, Borgoni S, Cascione M,
Chattaragada MS, Ferri-Borgogno S, Capello M, Bulfamante S,
Chapelle J, Di Modugno F, Defilippi P, et al: Alpha-enolase (ENO1)
controls alpha v/beta 3 integrin expression and regulates
pancreatic cancer adhesion, invasion, and metastasis. J Hematol
Oncol. 10:162017. View Article : Google Scholar : PubMed/NCBI
|
|
7
|
Huang Z, Lin B, Pan H, Du J, He R, Zhang S
and Ouyang P: Gene expression profile analysis of ENO1 knockdown in
gastric cancer cell line MGC-803. Oncol Lett. 17:3881–3889.
2019.PubMed/NCBI
|
|
8
|
Sun L, Lu T, Tian K, Zhou D, Yuan J, Wang
X, Zhu Z, Wan D, Yao Y, Zhu X, et al: Alpha-enolase promotes
gastric cancer cell proliferation and metastasis via regulating AKT
signaling pathway. Eur J Pharmacol. 845:8–15. 2019. View Article : Google Scholar : PubMed/NCBI
|
|
9
|
Zhu W, Li H, Yu Y, Chen J, Chen X, Ren F,
Ren Z and Cui G: Enolase-1 serves as a biomarker of diagnosis and
prognosis in hepatocellular carcinoma patients. Cancer Manag Res.
10:5735–5745. 2018. View Article : Google Scholar : PubMed/NCBI
|
|
10
|
Zhan P, Wang Y, Zhao S, Liu C, Wang Y, Wen
M, Mao JH, Wei G and Zhang P: FBXW7 negatively regulates ENO1
expression and function in colorectal cancer. Lab Invest.
95:995–1004. 2015. View Article : Google Scholar : PubMed/NCBI
|
|
11
|
Ryans K, Omosun Y, McKeithen DN, Simoneaux
T, Mills CC, Bowen N, Eko FO, Black CM, Igietseme JU and He Q: The
immunoregulatory role of alpha enolase in dendritic cell function
during Chlamydia infection. BMC Immunol. 18:272017. View Article : Google Scholar : PubMed/NCBI
|
|
12
|
Yin H, Wang L and Liu HL: ENO1
overexpression in pancreatic cancer patients and its clinical and
diagnostic significance. Gastroenterol Res Pract. 2018:38421982018.
View Article : Google Scholar : PubMed/NCBI
|
|
13
|
Yu S, Li N, Huang Z, Chen R, Yi P, Kang R,
Tang D, Hu X and Fan X: A novel lncRNA, TCONS_00006195, represses
hepatocellular carcinoma progression by inhibiting enzymatic
activity of ENO1. Cell Death Dis. 9:11842018. View Article : Google Scholar : PubMed/NCBI
|
|
14
|
Sun L, Guo C, Cao J, Burnett J, Yang Z,
Ran Y and Sun D: Over-expression of alpha-enolase as a prognostic
biomarker in patients with pancreatic cancer. Int J Med Sci.
14:655–661. 2017. View Article : Google Scholar : PubMed/NCBI
|
|
15
|
White-Al Habeeb NM, Di Meo A, Scorilas A,
Rotondo F, Masui O, Seivwright A, Gabril M, Girgis AH, Jewett MA
and Yousef GM: Alpha-enolase is a potential prognostic marker in
clear cell renal cell carcinoma. Clin Exp Metastasis. 32:531–541.
2015. View Article : Google Scholar : PubMed/NCBI
|
|
16
|
Song Y, Luo Q, Long H, Hu Z, Que T, Zhang
X, Li Z, Wang G, Yi L, Liu Z, et al: Correction: Alpha-enolase as a
potential cancer prognostic marker promotes cell growth, migration,
and invasion in glioma. Mol Cancer. 13:2352015. View Article : Google Scholar : PubMed/NCBI
|
|
17
|
Warburg O: On the origin of cancer cells.
Science. 123:309–314. 1956. View Article : Google Scholar : PubMed/NCBI
|
|
18
|
Altenberg B and Greulich KO: Genes of
glycolysis are ubiquitously overexpressed in 24 cancer classes.
Genomics. 84:1014–1020. 2004. View Article : Google Scholar : PubMed/NCBI
|
|
19
|
Zhang L, Wang H and Dong X: Diagnostic
value of α-enolase expression and serum α-enolase autoantibody
levels in lung cancer. J Bras Pneumol. 44:18–23. 2018. View Article : Google Scholar : PubMed/NCBI
|
|
20
|
Mathivanan S and Simpson RJ: ExoCarta: A
compendium of exosomal proteins and RNA. Proteomics. 9:4997–5000.
2009. View Article : Google Scholar : PubMed/NCBI
|
|
21
|
Mazurek S, Boschek CB, Hugo F and
Eigenbrodt E: Pyruvate kinase type M2 and its role in tumor growth
and spreading. Semin Cancer Biol. 15:300–308. 2005. View Article : Google Scholar : PubMed/NCBI
|
|
22
|
Luo X, Wei Y, Hai L, Hu Y, Zhao Z, Ma W,
Ma L, Liu X and Ding X: Preliminary study on serum marker α-enolase
of liver cancer in the diagnosis of liver cancer. Chin J Hepatol.
27:505–510. 2019.(In Chinese).
|
|
23
|
Tan HT, Low J, Lim SG and Chung MC: Serum
autoantibodies as biomarkers for early cancer detection. FEBS J.
276:6880–6904. 2009. View Article : Google Scholar : PubMed/NCBI
|