Introduction
Clear cell renal cell carcinoma (ccRCC) is the most
common form of renal malignancy (1,2). Yet,
the contribution of the characteristically elevated monounsaturated
fatty acids (MUFAs) to the establishment of ccRCC remains
incompletely understood (3–5). It has been hypothesized that the
elevated unsaturated fatty acid content of ccRCC cells is
responsible for their varied response to drug therapies (6). MUFAs are produced by the enzyme
stearoyl-CoA desaturase (SCD1), a protein often highly expressed in
tumors (7–9). Previous studies describe unsaturated
fatty acid as a stabilizer of oncogenes that function to promote
cell growth and inhibit apoptosis (10–14).
This suggests that the presence of unsaturated lipids in ccRCC is
necessary for growth and survival (15–21).
However, there is growing evidence that demonstrates a positive
correlation between MUFAs and survival in various model systems
(22–25). SCD1-derived MUFAs play an important
protective role in normal and transformed cells by preventing the
toxic accumulation of saturated fatty acids resulting from rapid
proliferation (26,27). The unsaturated lipids made by SCD1
are critical to membrane synthesis, signal transduction, and energy
storage (13). Targeting SCD1
activity has been suggested as a viable strategy to combat tumor
development (9,12,28).
However, blocking fatty acid desaturation creates an imbalance in
the ratio of saturated to unsaturated fat, leading to a cellular
stress response that includes inhibition of global mRNA
translation, and ultimately death in both normal and transformed
cells (29,30). Therefore, despite the therapeutic
potential, the relationship between SCD1 and organismal longevity,
makes SCD1 a precarious drug target (22–25).
Y-box binding protein 1 (YB-1) is a phylogenetically
conserved DNA and RNA binding protein that controls expression and
translation of numerous genes (31).
YB-1 is regulated both spatially and through posttranslational
modifications. In the cytoplasm YB-1 represses the translation of
mRNAs into proteins that are involved in survival and proliferation
(32,33). The ability of YB-1 to repress target
transcripts is regulated, in part, by tissue transglutaminase
(TG2). TG2 crosslinks YB-1 into detergent-resistant oligomers,
containing two or more YB-1 monomers, in a calcium-dependent manner
(34). Furthermore, transforming
growth factor (TGF-β) also stimulates YB-1 oligomer formation,
which leads to de-repression of smooth muscle actin (acta2)
(35). Under certain stress
conditions, YB-1 is phosphorylated and translocated to the nucleus
as a transcription factor for genes that promote growth, drug
resistance, and cell survival (36,37).
YB-1 is considered an oncogene because it is
overexpressed in many cancers and is highly correlated with
metastatic potential and patient mortality (38). While YB-1 regulates the expression of
a diverse group of target genes, there is no true consensus on how
YB-1 identifies its targets (39–41). We
hypothesized that SCD1 is negatively regulated by YB-1 in ccRCC.
The present study provides evidence of a previously unknown
relationship between YB-1 and SCD1 gene expression using a
combination of proteomics, bioinformatics, and molecular methods.
Our data suggests a dynamic interplay between unsaturated fatty
acid levels and oncogenic capacity, and highlights a relationship
between protein expression and lipid levels that could have
significant impact on overall survival in renal cancer
patients.
Materials and methods
Materials
We obtained fatty acids (FAs) from Nu-Chek Prep,
Inc.; radiolabeled S-35 methionine from Perkin-Elmer (cat. no.
NEG709A500UC); SCD1 inhibitor (A939572; cat. no. 19123), Nonidet
P-40 (NP-40; cat. no. 600009) and Protein Synthesis kit (cat. no.
601100) from Cayman Chemicals; rabbit anti-YB-1 from ProteinTech;
mouse anti-β-actin from Millipore Sigma; rabbit anti-SCD1 from Cell
Signal; YB-1-myc plasmid from Addgene; non-targeting control siRNA
and YB-1 siRNAs from Qiagen; FA-free BSA from Sigma-Aldrich;
Protease inhibitor cocktail from Roche; Fetal Calf serum (FCS) and
Delipidated fetal calf serum (DFCS) from Gemini Bio. All FAs added
into culture media were conjugated to BSA as previously reported
(10).
Cell lines
ccRCC cells 786-O and SW156 were obtained from ATCC.
Non-tumorigenic SV589 human fibroblasts were from the UT
Southwestern Department of Molecular Tissue Culture Core Facility.
SV589 cells were grown in Dulbecco's modified Eagle's medium (DMEM)
with 1.0 g/l glucose, 100 units/ml penicillin and 100 µg/ml
streptomycin supplemented with 5% FCS (complete DMEM). SW156 and
786-O cells were grown in DMEM with 4.5 g/l glucose (DMEM-HG), 100
units/ml penicillin, and 100 µg/ml streptomycin supplemented with
5% FCS (complete DMEM-HG). Except for SV589 cells that were
incubated in 8.8% CO2, all cells were maintained at 37°C
in 5% CO2.
Lipid deprivation
Cells were plated in complete DMEM-HG at appropriate
cell density for specific experimental conditions overnight. The
following day, all culture media was removed and cells were rinsed
one time with sterile phosphate buffered saline. Cells were
replenished with delipidation media consisting of DMEM-HG
supplemented with 100 units/ml penicillin, and 100 µg/ml
streptomycin with 5% delipidated fetal calf serum (DFCS), and 1 µM
SCD-1 inhibitor (A939572, Cayman Chemicals). Cells were incubated
in delipidation media overnight and assayed for response to lipids
the following day.
Cell harvest and lysis
Cells were harvested by scraping the cells and media
into conical tubes and placing on ice. Following harvest, the cell
suspensions were spun down at room temperature for 5 min at 800 ×
g. The supernatant was aspirated, and the cells were washed twice
with PBS. Cells were then lysed with 100 µl of seize2 lysis buffer
(25 mM Tris-HCl pH 7.2, 0.15 M NaCl, 5 µg/ml pepstatin, 10 µg/ml
leupeptin, 2 µg/ml aprotinin, 2 µg/ml
N-[N-(N-Acetyl-L-leucyl)-L-leucyl]-L-norleucine, 1% NP-40). The
lysate was passed through a 22 G needle 10 times while on ice
followed by rotation at 4°C for 15 min. The lysate was pelleted at
21,000 × g for 10 min and the supernatant was collected. Protein
concentrations were found using the BCA Gold Protein Assay kit
(Thermo Fisher Scientific) and read at 490 nm. Sample lysate was
mixed with loading buffer and then boiled for 5 min, and loaded
onto 10% SDS-PAGE gel at 10 or 20 µg total protein per well.
Stable isotope labeling of amino acids
in cell culture (SILAC)
Incorporation of amino acids into newly synthesized
proteins in the presence of unsaturated fatty acid was measured in
SW156 ccRCC cells. In brief, 150,000 cells were plated in 100 mm
dishes in complete DMEM (DMEM with 4.5 g/l glucose, 100 units/ml
penicillin, and 100 µg/ml streptomycin supplemented with 5% FCS) in
duplicate overnight. The following day, plates were divided equally
and given either complete DMEM, 10% Delipidated FCS (DFCS) with
heavy isotope of Arginine/Lysine (Heavy Medium) or complete DMEM,
10% DFCS with light isotope of Arginine/Lysine (Light Medium) for
24 h. The next day, 100 µM oleate-BSA was added to cells in Heavy
Medium, and 100 µM BSA alone was added to cell in Light Medium and
incubated for 6 h at 37°C. Total protein was harvested using seize2
lysis buffer + protease inhibitors. For each treatment 100 µg of
protein was loaded onto 16.5% Tris-Tricine BioRad precast gel
(Bio-Rad, cat. no. 3450064). Gel was run only long enough to allow
protein to enter resolving portion. Gel was stained with Gel-Code
Blue (ThermoFisher, cat. no. 24590), and protein band was excised
with ethanol-cleaned razor and diced into 10 mm2
fragments. Protein bands were sent to UT Southwestern Proteomics
core facility for protein identification using a short
reverse-phase Liquid Chromatography tandem mass spectrometry
method.
Protein synthesis
Protein synthesis was measured by
radiolabeled-methionine (S-35) incorporation into SV589 and SW156
ccRCC cells. In brief, 150,000 cells were plated in 60 mm dishes
overnight. The following day cells were treated with delipidation
media, DMEM +5% delipidated FCS (DFCS) + 1 µM A939572 (SCD1
inhibitor), overnight at 37°C. The following morning cells were
treated with 100 µM oleate-BSA or equivalent volume of 10% BSA for
4 h. Following 4-h incubation with fatty acid, cells were pulsed
with 150 µCi/ml S-35 methionine media for 1 h at 37°C. After pulse,
cells were washed and lysed with seize2 lysis buffer + protease
inhibitors. Protein was quantitated by BCA assay and total protein
was normalized across samples before performing trichloroacetic
acid (TCA; cat. no. T0699, Sigma) precipitation. TCA was added to
lysate at ¼ volume of total lysate and incubated at 4°C with
agitation for 10 min. Samples were then centrifuged at 20,000 × g
for 5 min. Pellets were washed twice in 200 µl of cold acetone.
Pellets were dried at 95°C for 5 min and rehydrated with 200 µl
scintillation fluid before transferring to labeled vials with 5 ml
of scintillation fluid. Samples were read on Beckman-Coulter
Scintillation counter. Protein synthesis in 786-O cells was
measured by non-radioactive Protein synthesis kit from Cayman
Chemical (cat. no. 601100). In brief, 500,000 cells per well were
plated into 96-well black clear bottom plates and incubated at 37°C
overnight. The following day, cells were kept in complete media or
placed in delipidation media overnight. The following day, cells
were treated with oleate, arachidonate, palmitate, or cycloheximide
as negative control. Protein synthesis assay was conducted per
manufacturers instruction and read on a microplate reader at 485 nm
excitation/535 nm emission.
Proliferation assay
786-O ccRCC were plated into black clear bottom
96-well plates at 1,000 cells/well in triplicate in complete DMEM
(100 units/ml penicillin, and 100 µg/ml streptomycin supplemented
with 5% FCS). The following day cell media was exchanged for
delipidation media with either 0, 10, 30, or 100 µM oleate or
palmitate. Cells were placed in culture for 48 h. At the end of
incubation cell growth was analyzed using Cell Titer-Glo (cat. no.
G7570; Promega) according to manufacturer's instructions.
Immunoblot analysis
Following overnight treatment with 0, 10, 30 or 100
µM oleate or palmitate, 786-O cells were harvested and lysed as
previously described. A total of 10 µg of protein was then
separated by 10% SDS-PAGE. After gel electrophoresis was completed,
the proteins were transferred to a 0.2-micron polyvinylidene
difluoride (PVDF) membrane. All immunoblot equipment and reagents
used were from Bio-Rad. The membrane was blocked with a 5% non-fat
milk/PBST solution for 30 min. The membrane had anti-YB-1
antibodies (ProteinTech, 1:1,000 dilution) applied and was
incubated at 4°C overnight. The following day the membrane was
washed 3× with PBST at 5 min per wash. The 5% non-fat milk/PBST
containing HRP-conjugated secondary was added to the membrane
(R&D Systems anti-rabbit at a 1:10,000 dilution). β-actin was
used as the loading control for all immunoblots (primary
antibodies: Sigma, 1:2,500 dilution; secondary antibody: R&D
Systems anti-mouse, 1:10,000 dilution). Protein bands were detected
by using 1 ml of SuperSignal ECL from Pierce and visualizing band
intensity using Li-Cor imaging system.
Plasmid transfection
786-O cells were seeded in 60 mm plates then
transfected with 1 µg of enhanced green fluorescent protein
(pEGFP)-YB-1-myc plasmid DNA or pEGFP-C1 plasmid DNA (from the
laboratory of Lynne Bemis). In brief, 150,000 cells were plated in
60 mm dishes the night prior to transfection and placed at 37°C.
Transfection were done using Lipofectamine 2000 transfection
reagent (Invitrogen). Each dish was transfected with 1 µg of
plasmid DNA per manufacturer's instructions. The GFP signal was
observed using a CellDrop Automated Fluorescent Cell Counter
(DeNovix) to confirm protein expression prior to cell collection.
Cells were incubated 24 h before harvest to analyze protein and
mRNA expression.
RNA interference
150,000 cells were plated in 60 mm dishes overnight
at 37°C. Following day transfection mixes were made for each
experimental permutation. Functionally verified YB-1 (NM_004559)
and control non-targeting siRNAs (20 µM) (Qiagen, YB-1 cat. no.
SI03019191, ID: 1027415; control cat. no. 0001022076, ID: 1022076)
were transfected 100 nM per dish. RNAiMax (Invitrogen) was mixed
with appropriate volume of OptiMEM (Gibco) and in a separate tube
the appropriate amount of each siRNA for experiment setup was added
to appropriate volume of OptiMEM (Gibco), mixed and incubated at
room temperature for 5 min. The two solutions were combined at
equal volume, mixed and incubated at room temperature for 20 min.
Plates containing cells, were washed and replenished with 1.6 ml of
OptiMEM, and placed back at 37°C until transfection complexes were
ready. Then 400 µl of transfection mix was added to each dish, and
incubated at 37°C for 4 h, at which cells would be washed once with
complete media and 4 ml of complete media would be added to cells.
Cells then incubated at 37°C for 48 h.
Chromatin immunoprecipitation
assay
786-O cells were grown to confluence in 10 cm
dishes; a final cell count of approximately 1×10⁶
cells/plate. Proteins were cross-linked to DNA using formaldehyde
added directly to the culture medium at a final concentration of 1%
for 10 min at room temperature. The cross-linking reaction was
quenched by adding glycine to a final concentration of 0.125 M for
5 min at room temperature. The medium was then removed and cells
were washed with 1X PBS containing a protease inhibitor cocktail.
Then cells were scraped, pelleted and washed twice with PBS plus
protease inhibitor cocktail as described above. Cells were
resuspended in SDS Lysis Buffer (20–163; Millipore) plus protease
inhibitor cocktail. Cells were sonicated in a Diagenode Bioruptor
sonicator for 30 cycles of sonication (30 sec pulses and 30 sec
rest). The soluble chromatin fraction was quantitated and 100 mg of
chromatin was precleared with 10 µl of Protein A Dynabeads
(Invitrogen) for 2 h, then incubated overnight at 4°C with 1.5 µg
of either YB-1 (9744S; Cell Signaling), or rabbit IgG (PI31887;
Thermo Scientific) antibodies. The following day, 10 µl of
Dynabeads were added to the chromatin-antibody mixture and
incubated with rotation for 2 h at 4°C. ChIPs were washed with a
low salt wash buffer (20–154; Millipore), high salt wash buffer
(20–155; Millipore), and TE (20–157; Millipore). Crosslinks were
reversed overnight at 65°C, followed by RNAse (Qiagen) at 37°C for
2 h, and proteinase K (Qiagen) at 55°C for 2 h. DNA was eluted
using Qiaquick PCR purification kit (Qiagen) and amplified by
reverse transcription-quantitative PCR (RT-qPCR). Data was analyzed
using the % input method. Firstly, input Cq was adjusted to 100%
(Cq input-4.24). Results from immunoprecipitated samples were
analyzed using the following calculation: 100×2^ [adjusted input-Cq
(IP)]. Fold difference was calculated against the negative control
(rabbit IgG).
RT-qPCR and mRNA stability assay
24-h post transfection with siRNAs as described
above, cells were re-plated into duplicate 60 mm plates for
actinomycin time-course treatment. At 48 h post transfection,
actinomycin treatment was initiated with 10 µg/ml of actinomycin D
added to appropriate dishes. Treated samples were harvested at 0,
3, 6, and 9 h after actinomycin treatment. Total RNA was obtained
from cells by Qiazol extraction and RNeasy purification (Qiagen).
YB-1 and SCD1 mRNA levels were determined using RT-qPCR using a
Rotor-gene Q PCR machine. Primer sequences are presented in
Table I. The data were analyzed
using the 2−ΔΔCq method and the Actin mRNA was used as
an endogenous control as previously described (42). SCD1 mRNA levels were plotted against
time after actinomycin D addition and fitted to a linear regression
model. SCD1 mRNA half-life was calculated using the linear
regression model. Data were analyzed with the unpaired Student's
t-test with Bonferroni correction and are presented as the mean ±
standard deviation. Experiment was carried out in triplicate.
 | Table I.Primers for qPCR and ChIP. |
Table I.
Primers for qPCR and ChIP.
| Primers | Sequence
(5′-3′) |
|---|
| qPCR primers |
|
| β-actin
forward | ATC CAC GAA ACT ACC
TTC AAC TC |
| β-actin
reverse | GAG GAG CAA TGA TCT
TGA TCT TC |
| YB-1
forward | AAG TGA TGG AGG GTG
CTG ACA ACC A |
| YB-1
reverse | GGC GTC TGC GTC GGT
AAT TGA AGT T |
| SCD1
forward | GTT CCA GAG GAG GTA
CTA CAA ACC TGG |
| SCD1
reverse | GTA GTT GTG GAA GCC
CTC ACC CA |
| EGFR
forward | GCG TTC GGC ACG GTG
TAT AAG GGA CTC TGG ATC |
| EGFR
reverse | GAG GCA GCC GAA GGG
CAT GAG C |
| ChIP primers |
|
|
SCD1-1.5 kB Forward | AGA TCA GTA GGG TCA
GAG CAT CTC AG |
|
SCD1-1.5 kB Reverse | CTG CAA GCC AAT TCA
CAA GAA TCG TT |
|
SCD1-0.7 kB Forward | GAG GGT TCA CCA CTG
TTT CCT GAG |
|
SCD1-0.7 kB Reverse | TTT CTC CTT CTC AGC
TTC TCT |
|
SCD1-0.2 kB Forward | GGG CTG AGG AAA TAC
CGG ACA C |
|
SCD1-0.2 kB Reverse | CAT CTT GGC TCT CGG
ATG CCG |
Statistical analysis
All experiments were performed in triplicate (n=3).
An unpaired two-tailed Student's t-test with two degrees of freedom
was used to compare means of the three replicate experiments
between treatments using either GraphPad Prism or MS Excel. Where
appropriate, the Bonferroni correction was applied to t-tests.
P<0.05 was considered to indicate a statistically significant
difference.
Bioinformatic analysis
CcRCC Reverse Phase Protein Array (RPPA) data
(n=445) was obtained from KIRC (Clear cell Renal carcinoma) dataset
from The Cancer Proteome Atlas (TCPA) maintained by The University
of Texas MD Anderson Cancer Center, available at http://tcpaportal.org/tcpa. The Kaplan-Meier analysis
of overall survival (OS) was done using the ‘survfit’ function from
Bioconductor package (https://rdrr.io/cran/survival/src/R/survfit.R) in R
statistical software package (v3.4.2). Association between OS and
key proteins was determined by univariable Cox proportional Hazard
models. Associations between key proteins of interest were
determined by multivariate pairwise analysis using Spearman ranked
correlations for each pair of set of variables (P<0.05 implies a
statistically significant marginal association at the 0.05 alpha
level). Multivariate analysis was done using proportion of pairwise
correlations in JMP software by SAS.
Results
MUFA increases protein synthesis in
ccRCC
The production of MUFA is essential for basic
cellular function in mammalian cells. In the production of
membranes, the principal fatty acids utilized are unsaturated,
oleic acids and palmitoleic acids. Previous work has demonstrated
that oleic acid stabilizes the proto-oncogene β-catenin in kidney
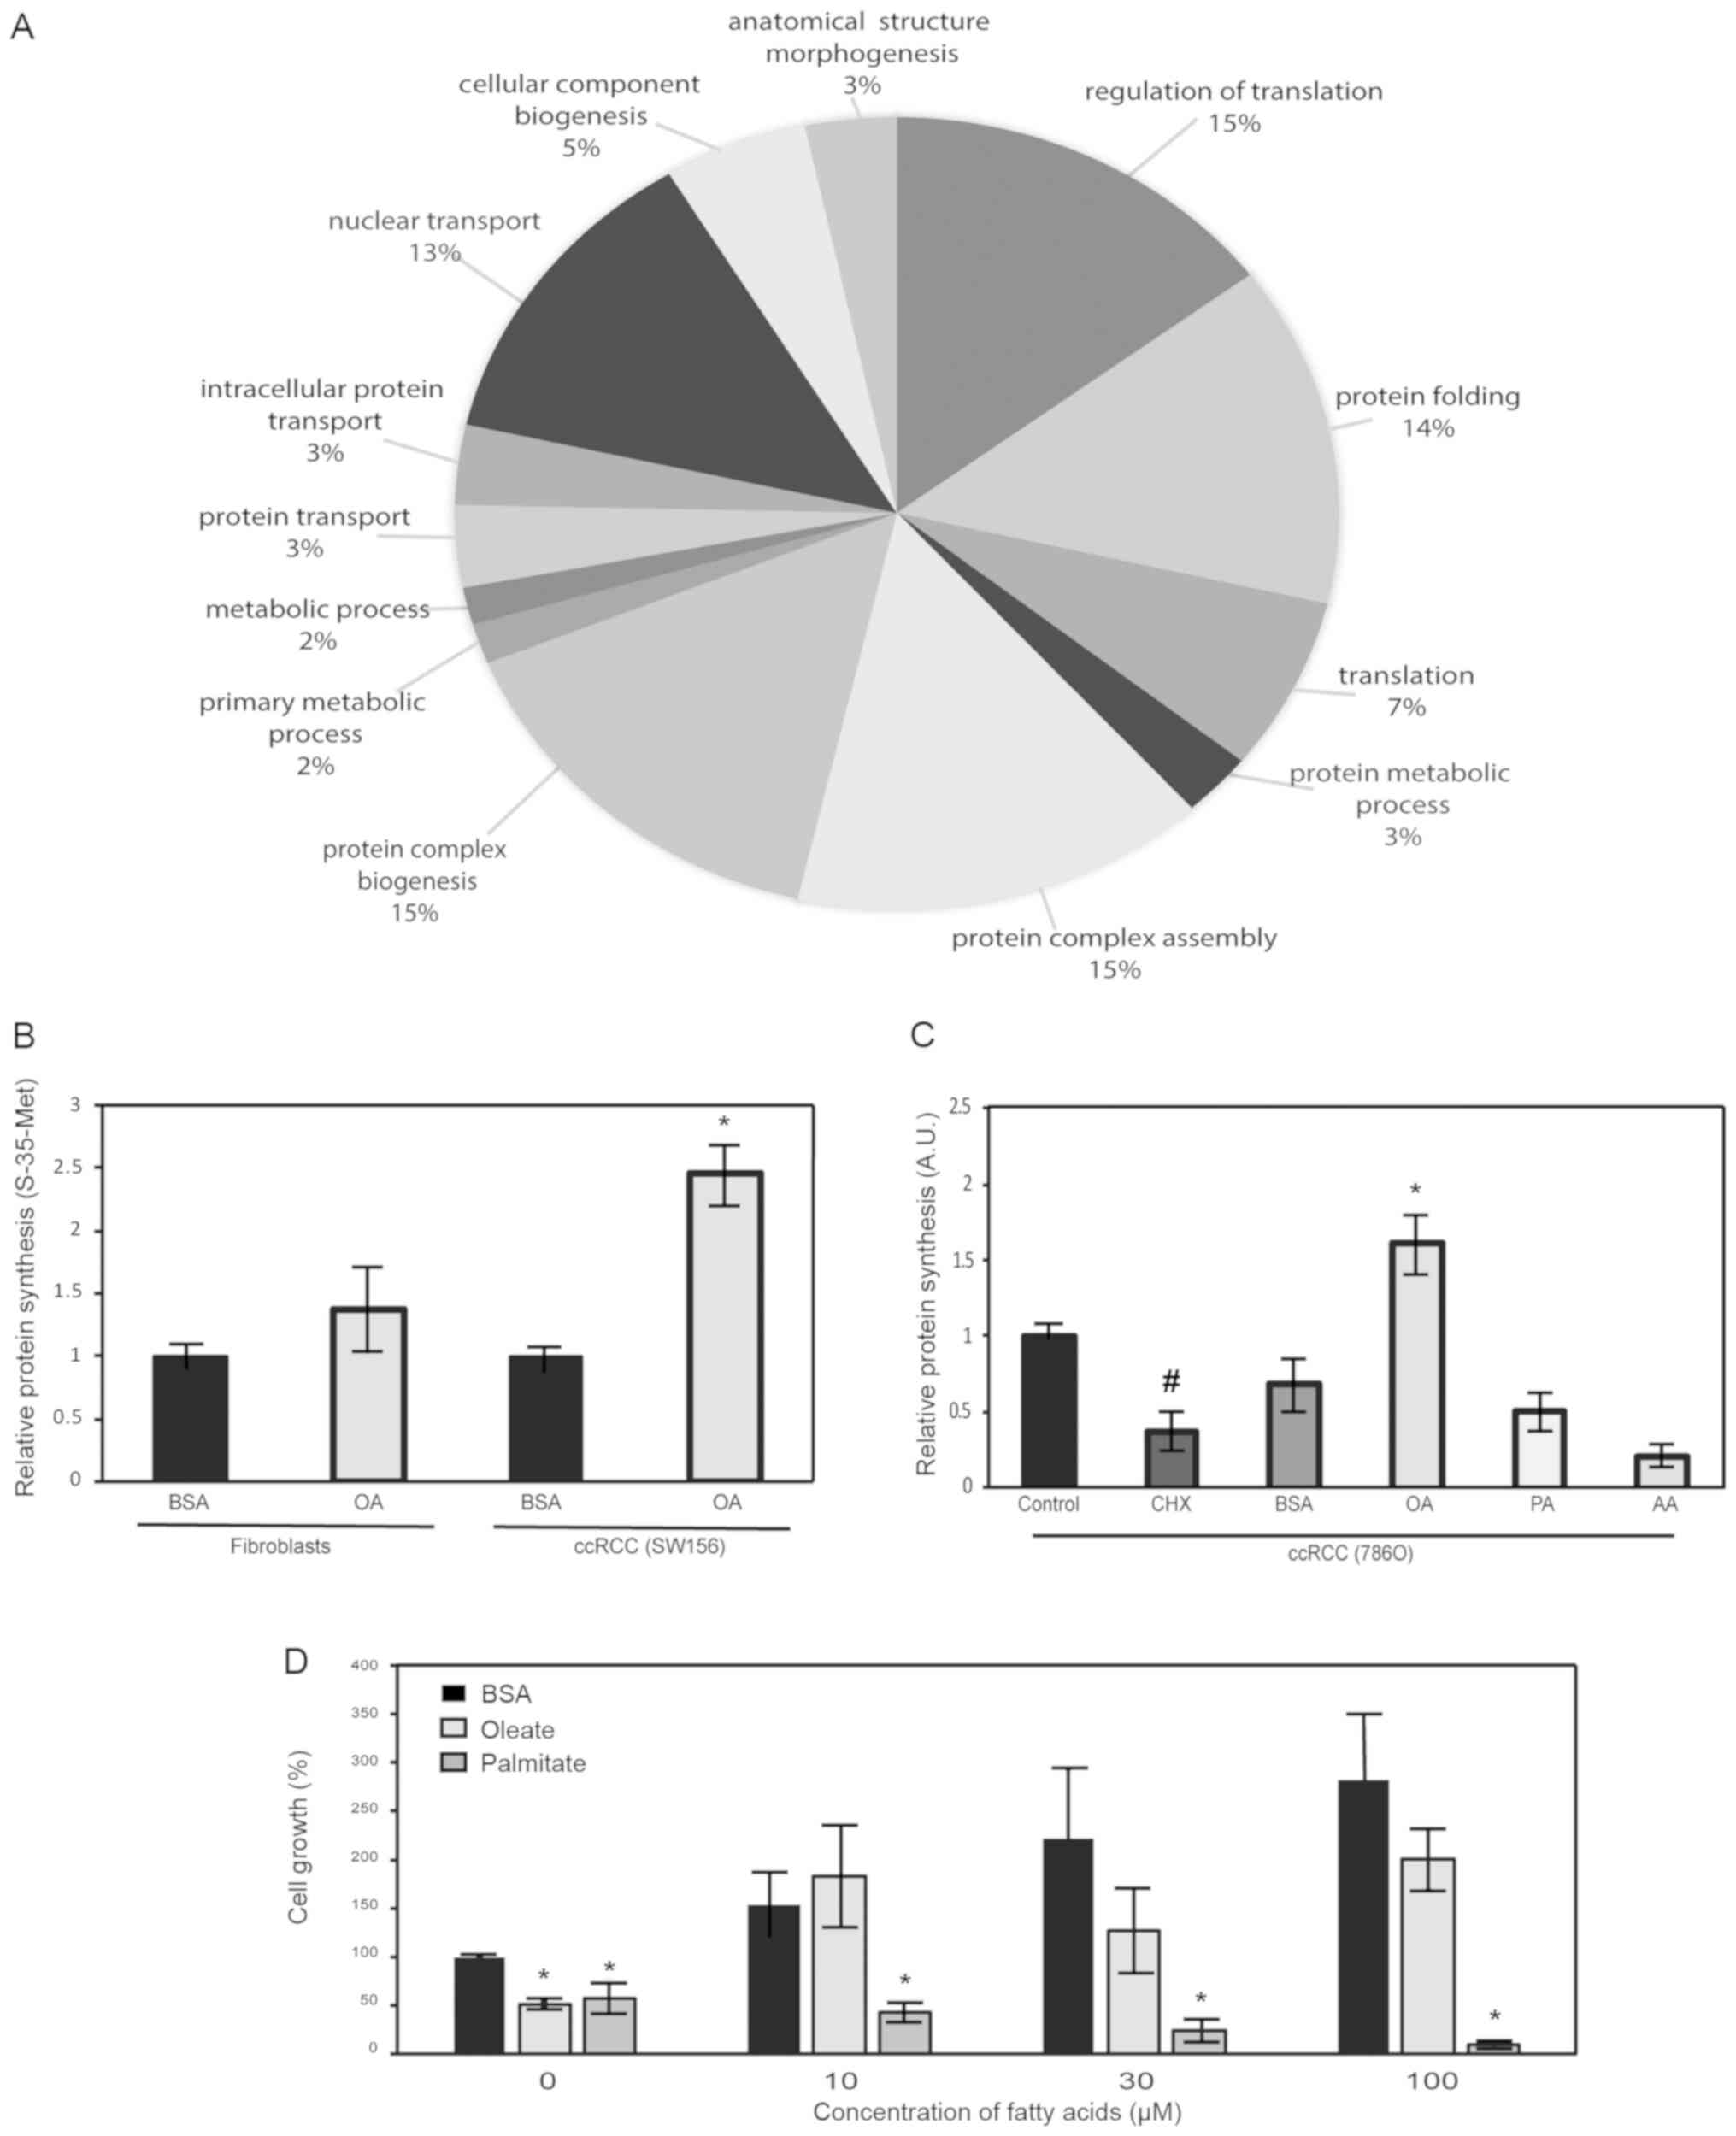
cancer cells (10). To identify
other potential fatty-acid stabilized proteins, we performed
proteomic analysis on cells following lipid depletion and
replenishment with unsaturated fatty acids. Proteins were grouped
into categories based on biological processes using PantherDB Gene
Ontology Software. Several of the enrichment groupings were related
to protein biosynthetic mechanisms (Fig.
1A). To confirm these data, we conducted protein synthesis
analysis using either incorporation of radiolabeled-methionine or
incorporation of puromycin-analogs into growing peptide chains in
kidney cancer cells. In radiolabeling experiments we used ccRCC
cell line, SW156, and non-tumorigenic human fibroblasts as
controls. Results showed that the presence of MUFAs led to
increased protein synthesis only in ccRCC cells (Fig. 1B). Next, we briefly treated an
additional ccRCC cell line, 786-O, with both saturated and
unsaturated fatty acids, and measured subsequent protein
production. In the presence of oleic acid, protein synthesis was
increased while in the presence of other fatty acids, such as
saturated palmitic acid, protein production was unchanged or
inhibited (Fig. 1C). To determine
other relevant biological effects of MUFA in our model of ccRCC, we
performed proliferation assays on oleate-exposed cells following
overnight lipid deprivation with media containing SCD1 inhibitors.
The results indicate that lipid replenishment with different
concentrations of oleate, led to a remarkable increase in cell
growth, which is likely related to increased protein synthesis
observed in previous experiments (Fig.
1D).
MUFA increases YB-1 protein expression
in ccRCC
Data from the proteomics analysis indicated an
enrichment of proteins involved in protein synthesis. Therefore, we
searched through the proteins in our dataset to identify proteins
that could potentially regulate translation and/or protein
synthesis. The top protein candidate was YB-1, which could promote
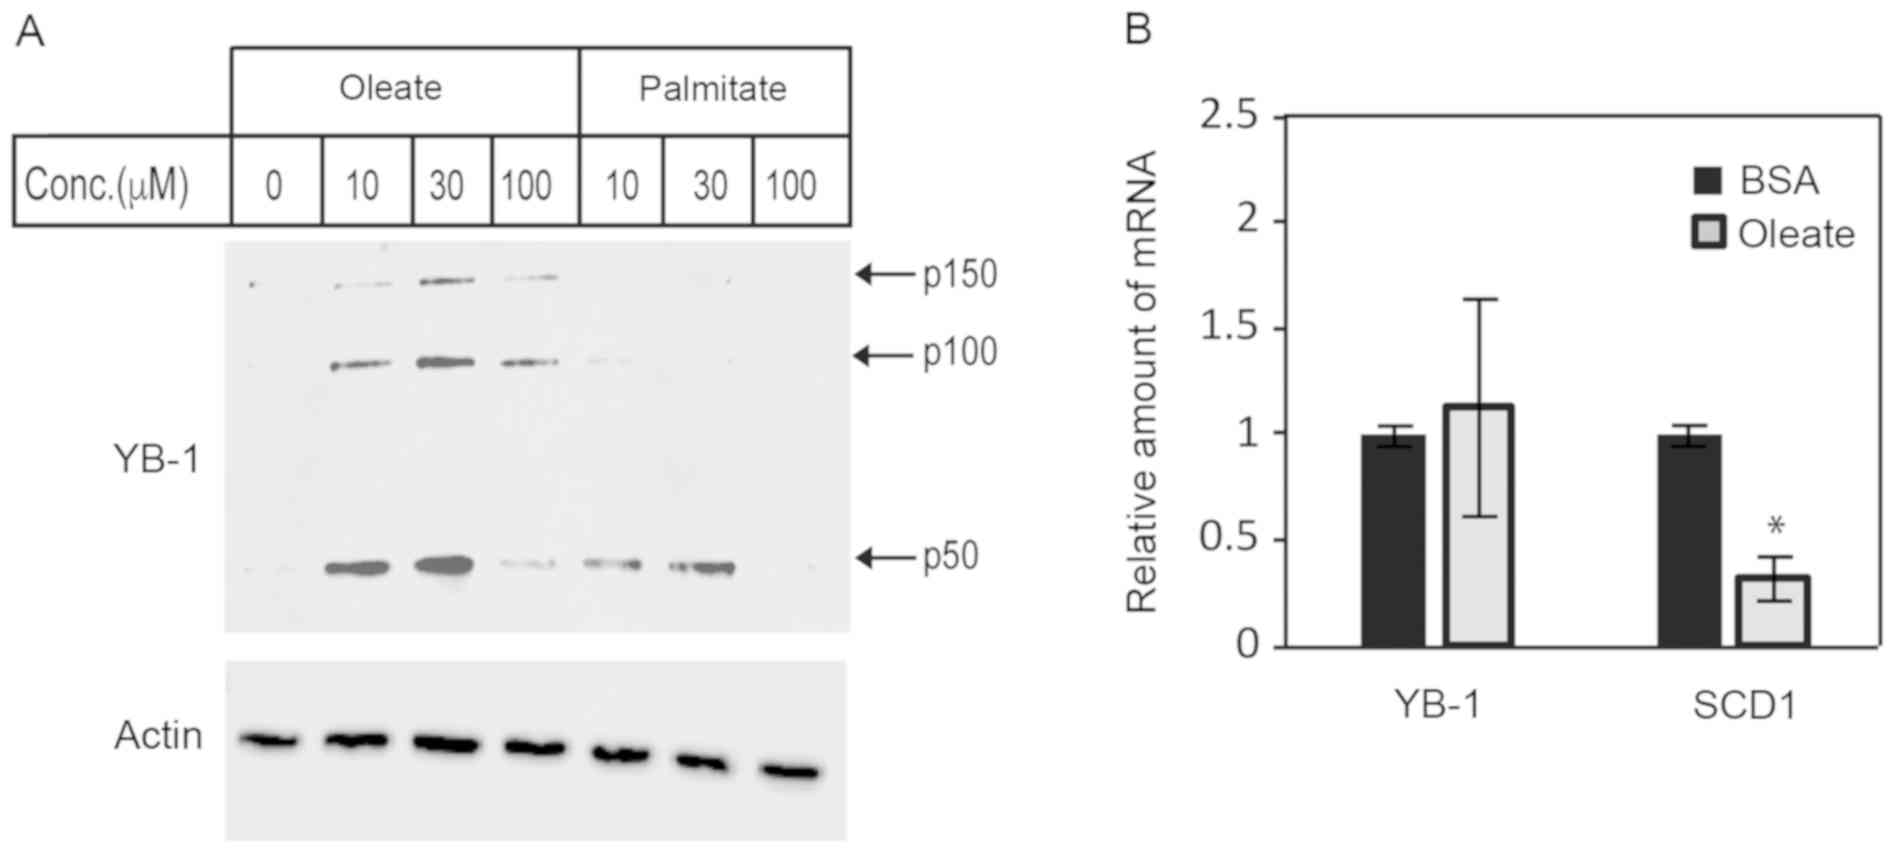
and suppress translation of target transcripts. To confirm that
YB-1 was sensitive to the cellular levels of unsaturated fatty
acid, we measured intracellular levels of YB-1 in lipid-deprived
ccRCC cells following brief exposure to varying concentrations of
saturated and unsaturated fatty acids. The presence of fatty acids
increased the level of 50 kDa monomeric, YB-1 (p50) (Fig. 2A). However, the notable decrease of
YB-1 in cells treated with 100 µM oleate was likely related to YB-1
packing into exosomes as described by others (43), while decrease of YB-1 in
palmitate-treated cells was likely due to lipotoxicity (44). Interestingly, we observed a
significant enrichment in high molecular weight forms of YB-1 (p100
and p150) with oleate-treated, but not palmitate-treated samples
(Fig. 2A). This high molecular
weight YB-1, which had been previously demonstrated to be the
result of transglutaminase activity in activated fibroblasts, has
decreased RNA-binding capacity compared to the YB-1 p50 monomer
(34). As done in studies by Willis
et al, we confirmed that endogenous transglutaminase
activity in ccRCC cells was involved, to some extent, in YB-1
oligomerization by treating cultured cells with transglutaminase
inhibitor, cystamine prior to immunoblot analysis (data not shown)
(34) . To determine whether the
changes in abundance of YB-1 protein was due to increased
transcription, we performed real-time quantitative PCR (qPCR) on
oleate-treated ccRCC cells. We analyzed SCD1 mRNA as well,
to determine if there was any negative feedback on oleic acid
production during our treatment. When cells were treated with
oleate-BSA, YB1 mRNA did not change, which suggested that
YB1 was not a lipid-responsive gene (Fig. 2B, left). However, there was a
significant decrease in SCD1 mRNA in the presence of
oleate-BSA which confirmed the presence of intact negative feedback
regulation in the lipogenic pathway as expected (Fig. 2B).
Overexpression of YB-1 decreases
expression of SCD1 in ccRCC
While the level of MUFA appeared to affect YB-1
protein expression and oligomerization, the consequence remained
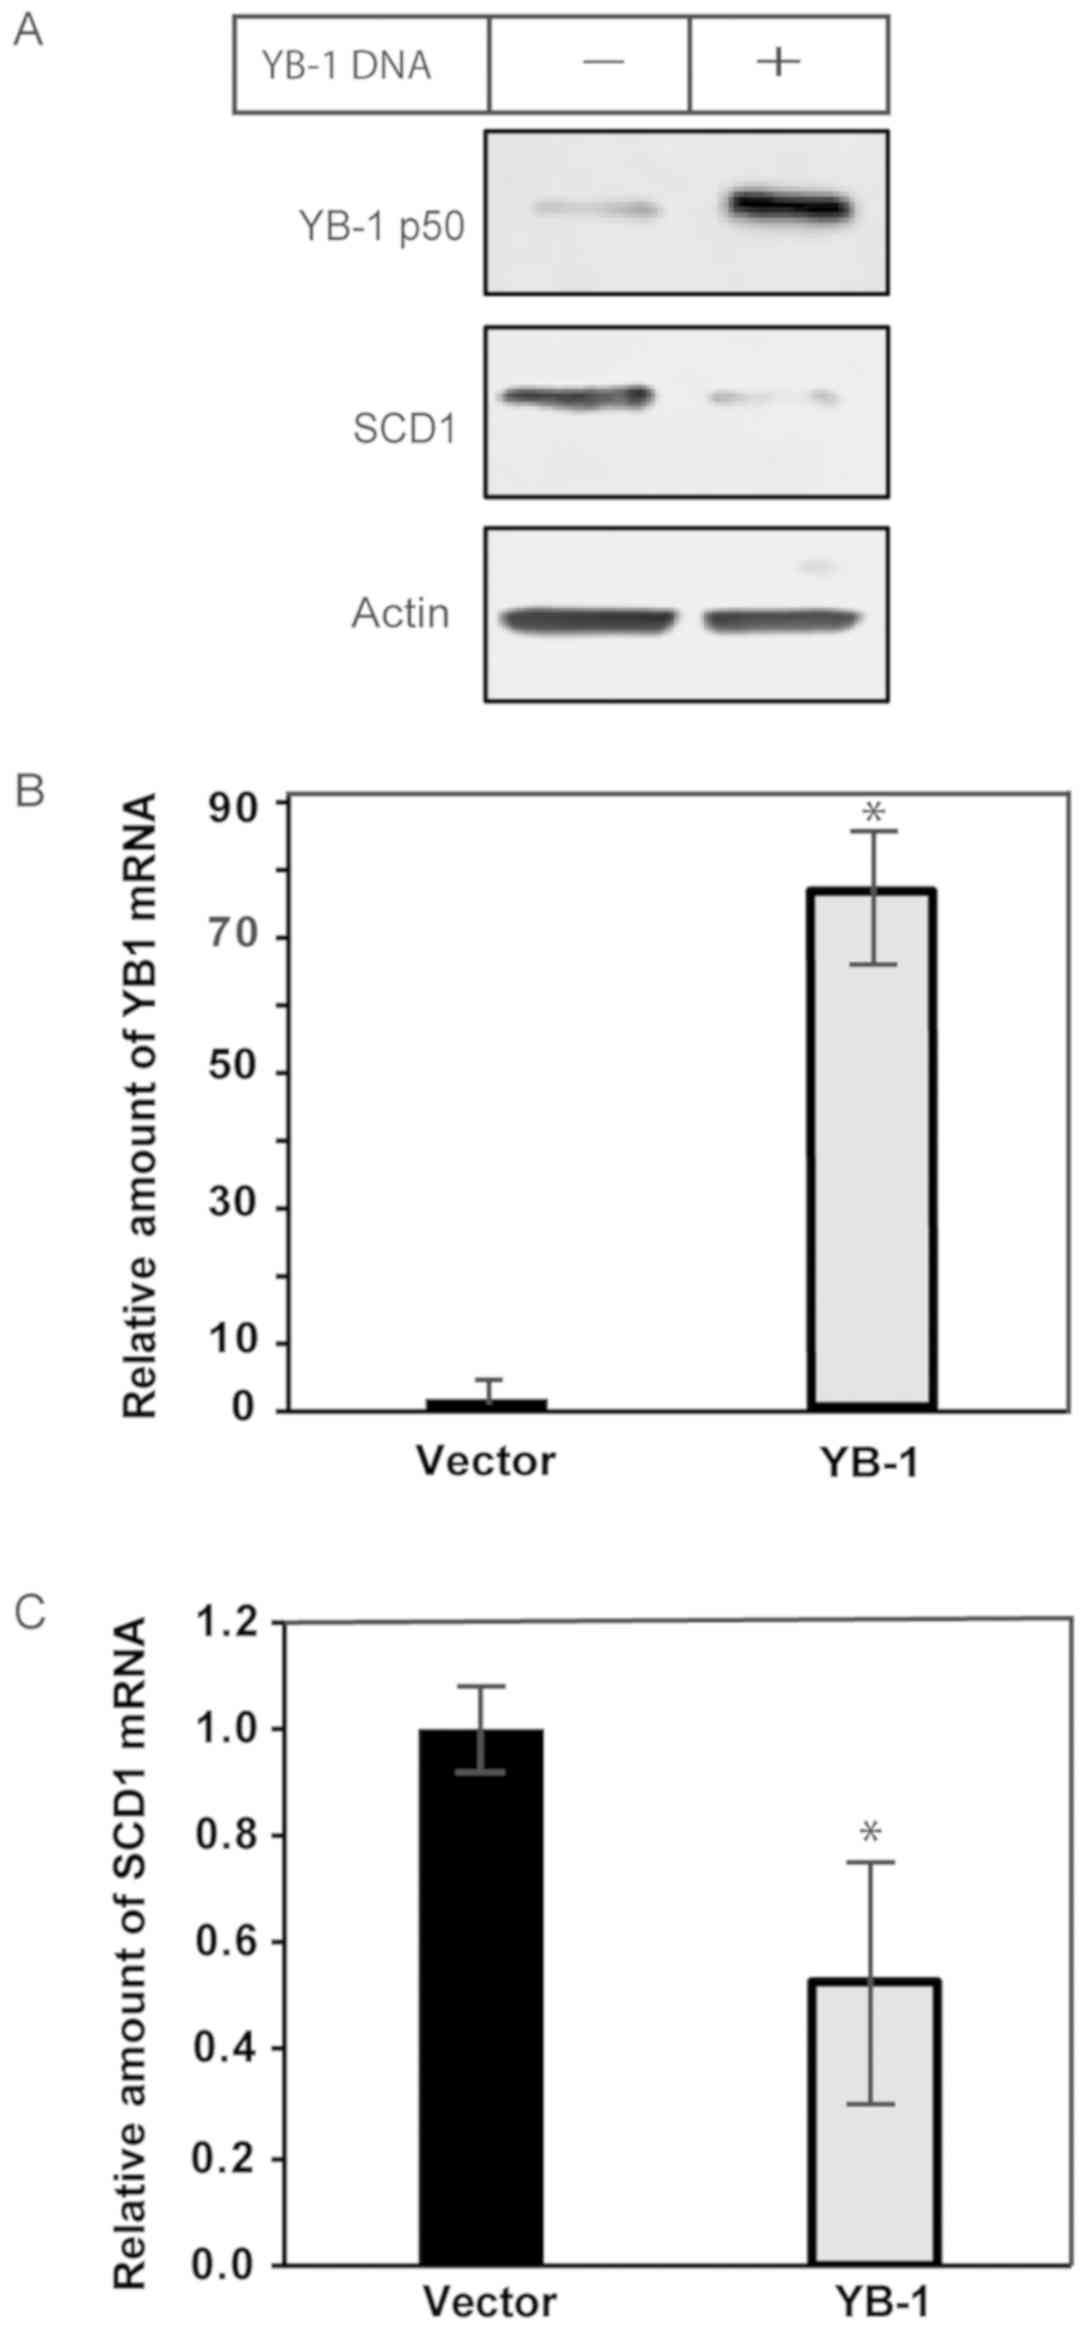
unclear. We sought to determine if there was a relationship between
YB-1 and SCD1. Thus, we overexpressed YB-1 in ccRCC cells using
plasmid DNA, and then measured the effects on SCD1 mRNA and
protein. Following transfection with YB-1, there was a decrease in
SCD1 protein, as determined by immunoblot analysis (Fig. 3A). We confirmed the results of the
protein analysis using qPCR, which had also shown a significant
decrease in SCD1 mRNA in YB-1-transfected cells compared to
controls (Fig. 3B and C). Taken
together, the data illustrate that YB-1 is involved in suppressing
the expression of SCD1 mRNA, however it did not indicate
whether this was due to a direct or indirect effect on
transcription or stability of SCD1 mRNA.
Knockdown of YB-1 increases expression
of SCD1 in ccRCC
Analysis of mRNA following transfection showed that
increased YB-1 expression inhibits expression of SCD1 mRNA
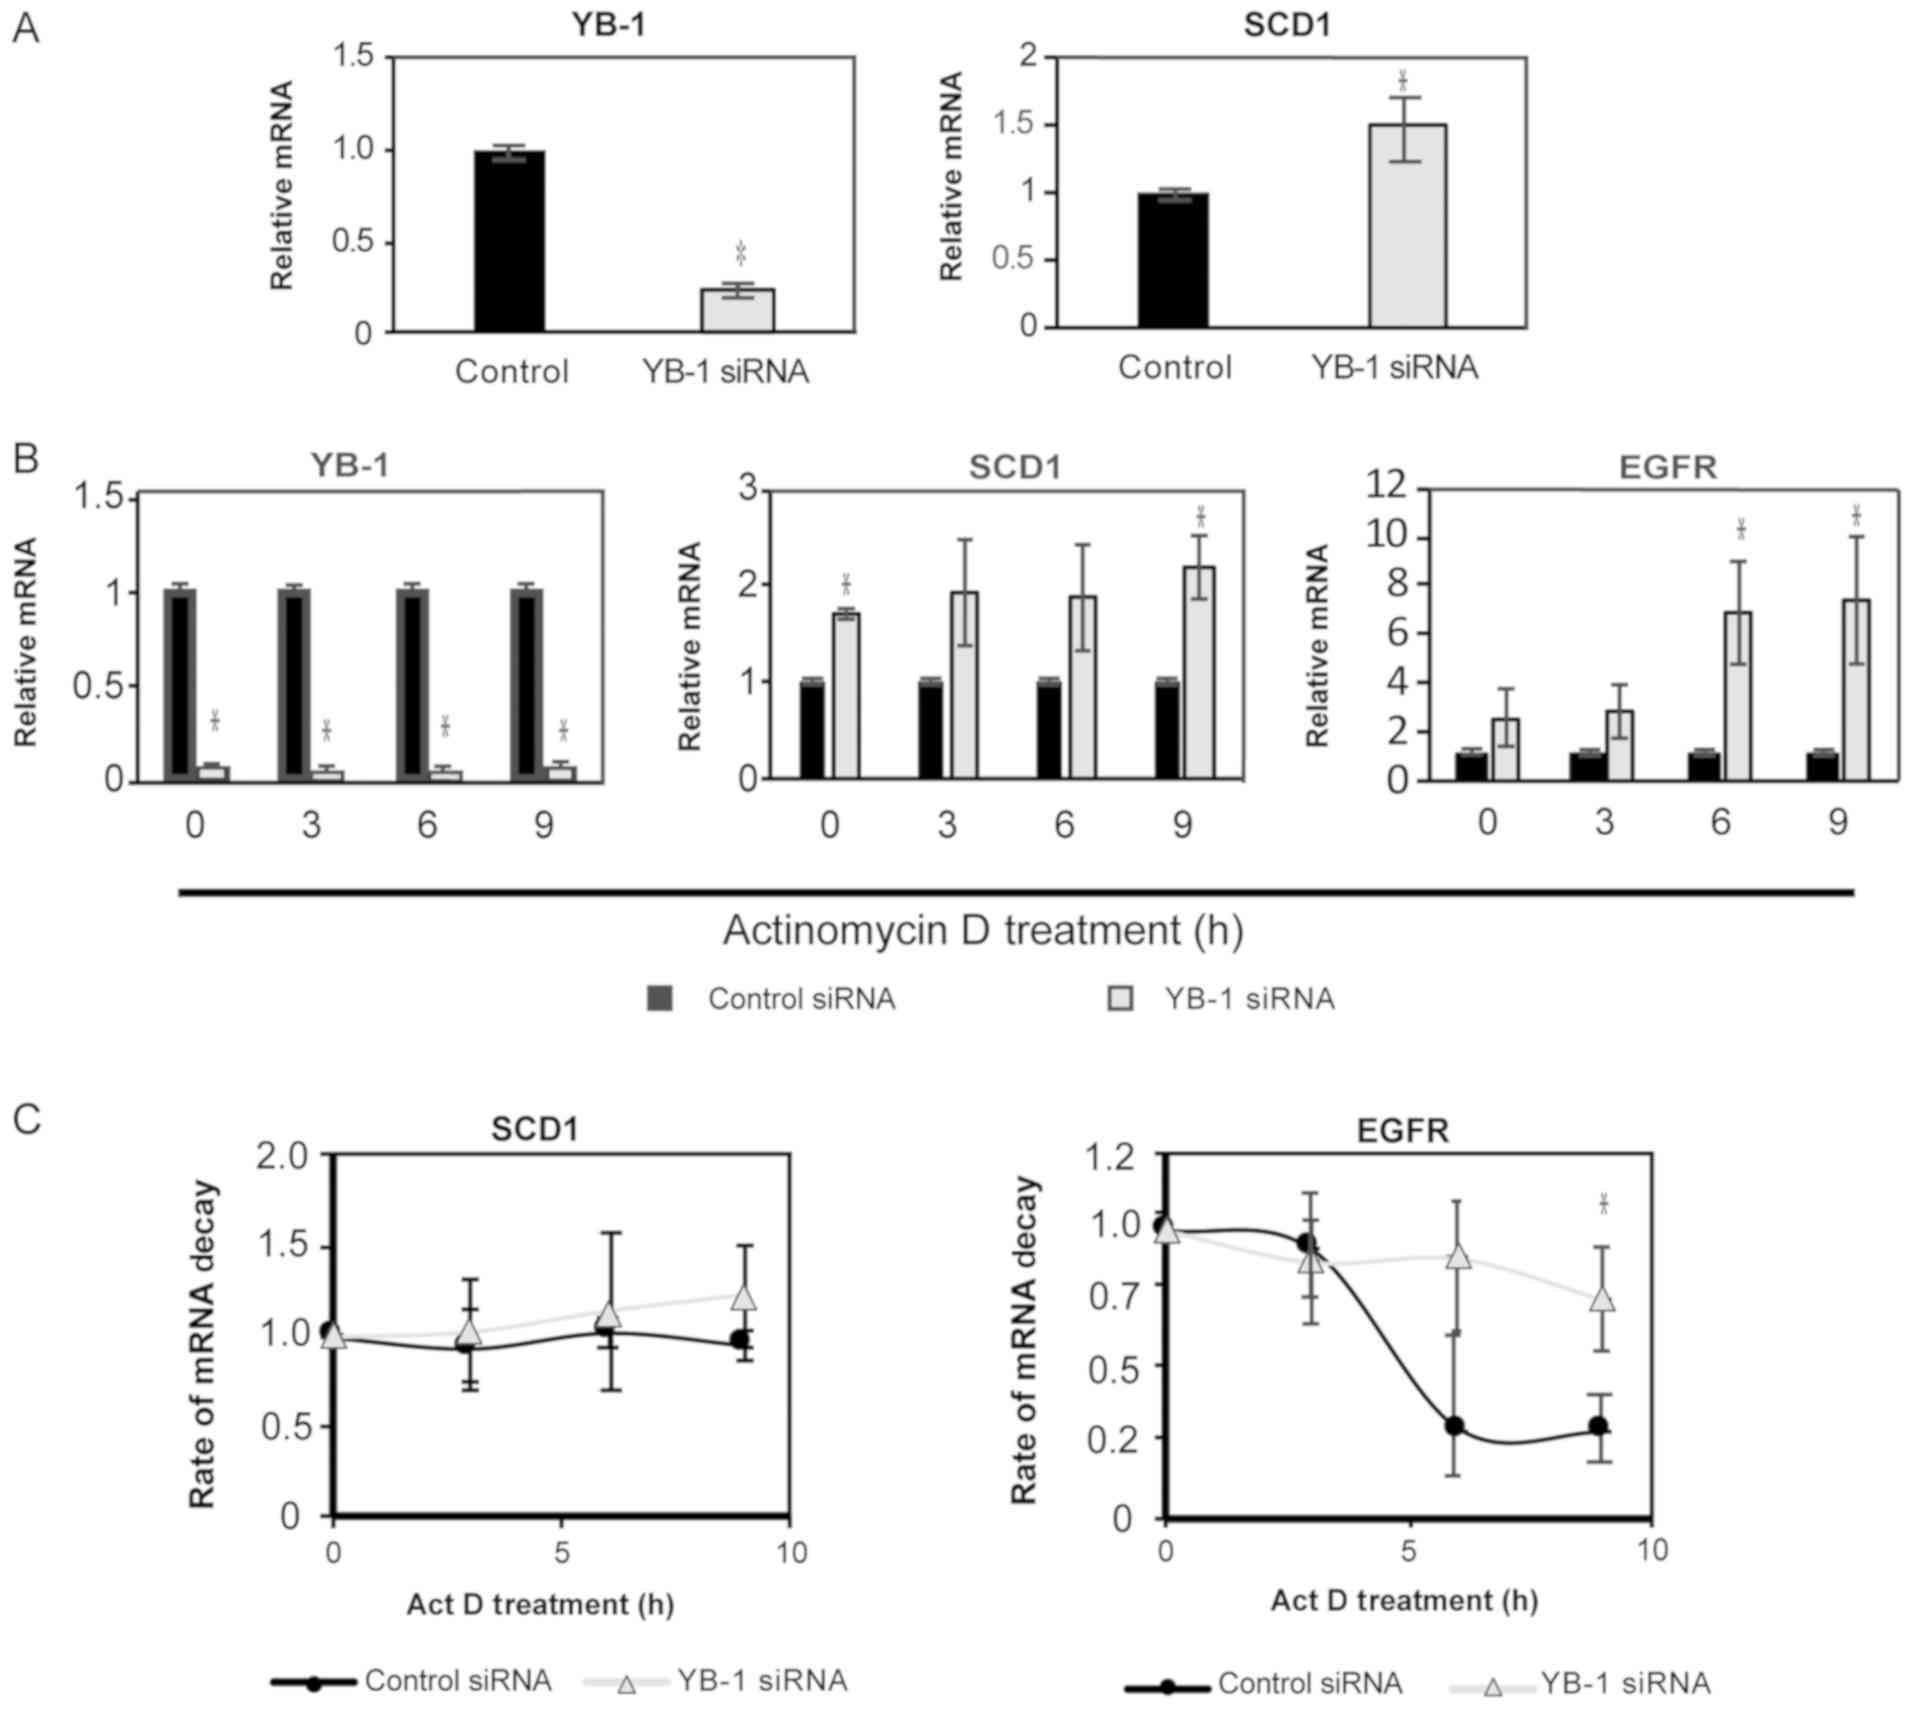
in ccRCC. To determine whether this was dependent on inhibition of
transcription or decreased mRNA stability, we first looked to
decrease cellular levels of YB-1 using RNA interference. Cells were
transfected with anti-sense YB1 oligos for 48 h and then
total mRNA was isolated for qPCR analysis. A substantial level of
knockdown was confirmed by qPCR (Fig.
4A, right panel). We also observed a corresponding increase in
SCD1 mRNA, that agreed with our previous observations
(Fig. 4A, left panel). To measure
the effect of YB-1 on the stability of SCD1 mRNA, we looked
at RNA decay rates in cells with YB1 knocked-down. First,
total mRNA was assessed over a 9-h time course following treatment
with the transcription inhibitor, Actinomycin D. Transcripts for
YB1 remained significantly diminished compared to control at
each time point (Fig. 4B). Levels of
SCD1 mRNA increased with YB1 knockdown, while the
assay control gene, epidermal growth factor receptor (EGFR)
showed an increase in mRNA compared to control at each time point
(Fig. 4B). To determine the effects
of YB-1 on transcript stability, we analyzed the mRNA levels at
each timepoint relative to t=0. Transcripts for SCD1 did not
appear to change over time, while EGFR, a normally
high-turnover transcript, decreased over time as expected in
control transfected cells (45)
(Fig. 4C). This demonstrated that
SCD1 is a relatively stable transcript, even when YB-1 is
decreased (Fig. 4C). This indicates
that decreasing YB-1 does not affect SCD1 translation, but
does lead to increased transcription of SCD1 mRNA, which can
lead to the increased production of MUFA in cancer cells.
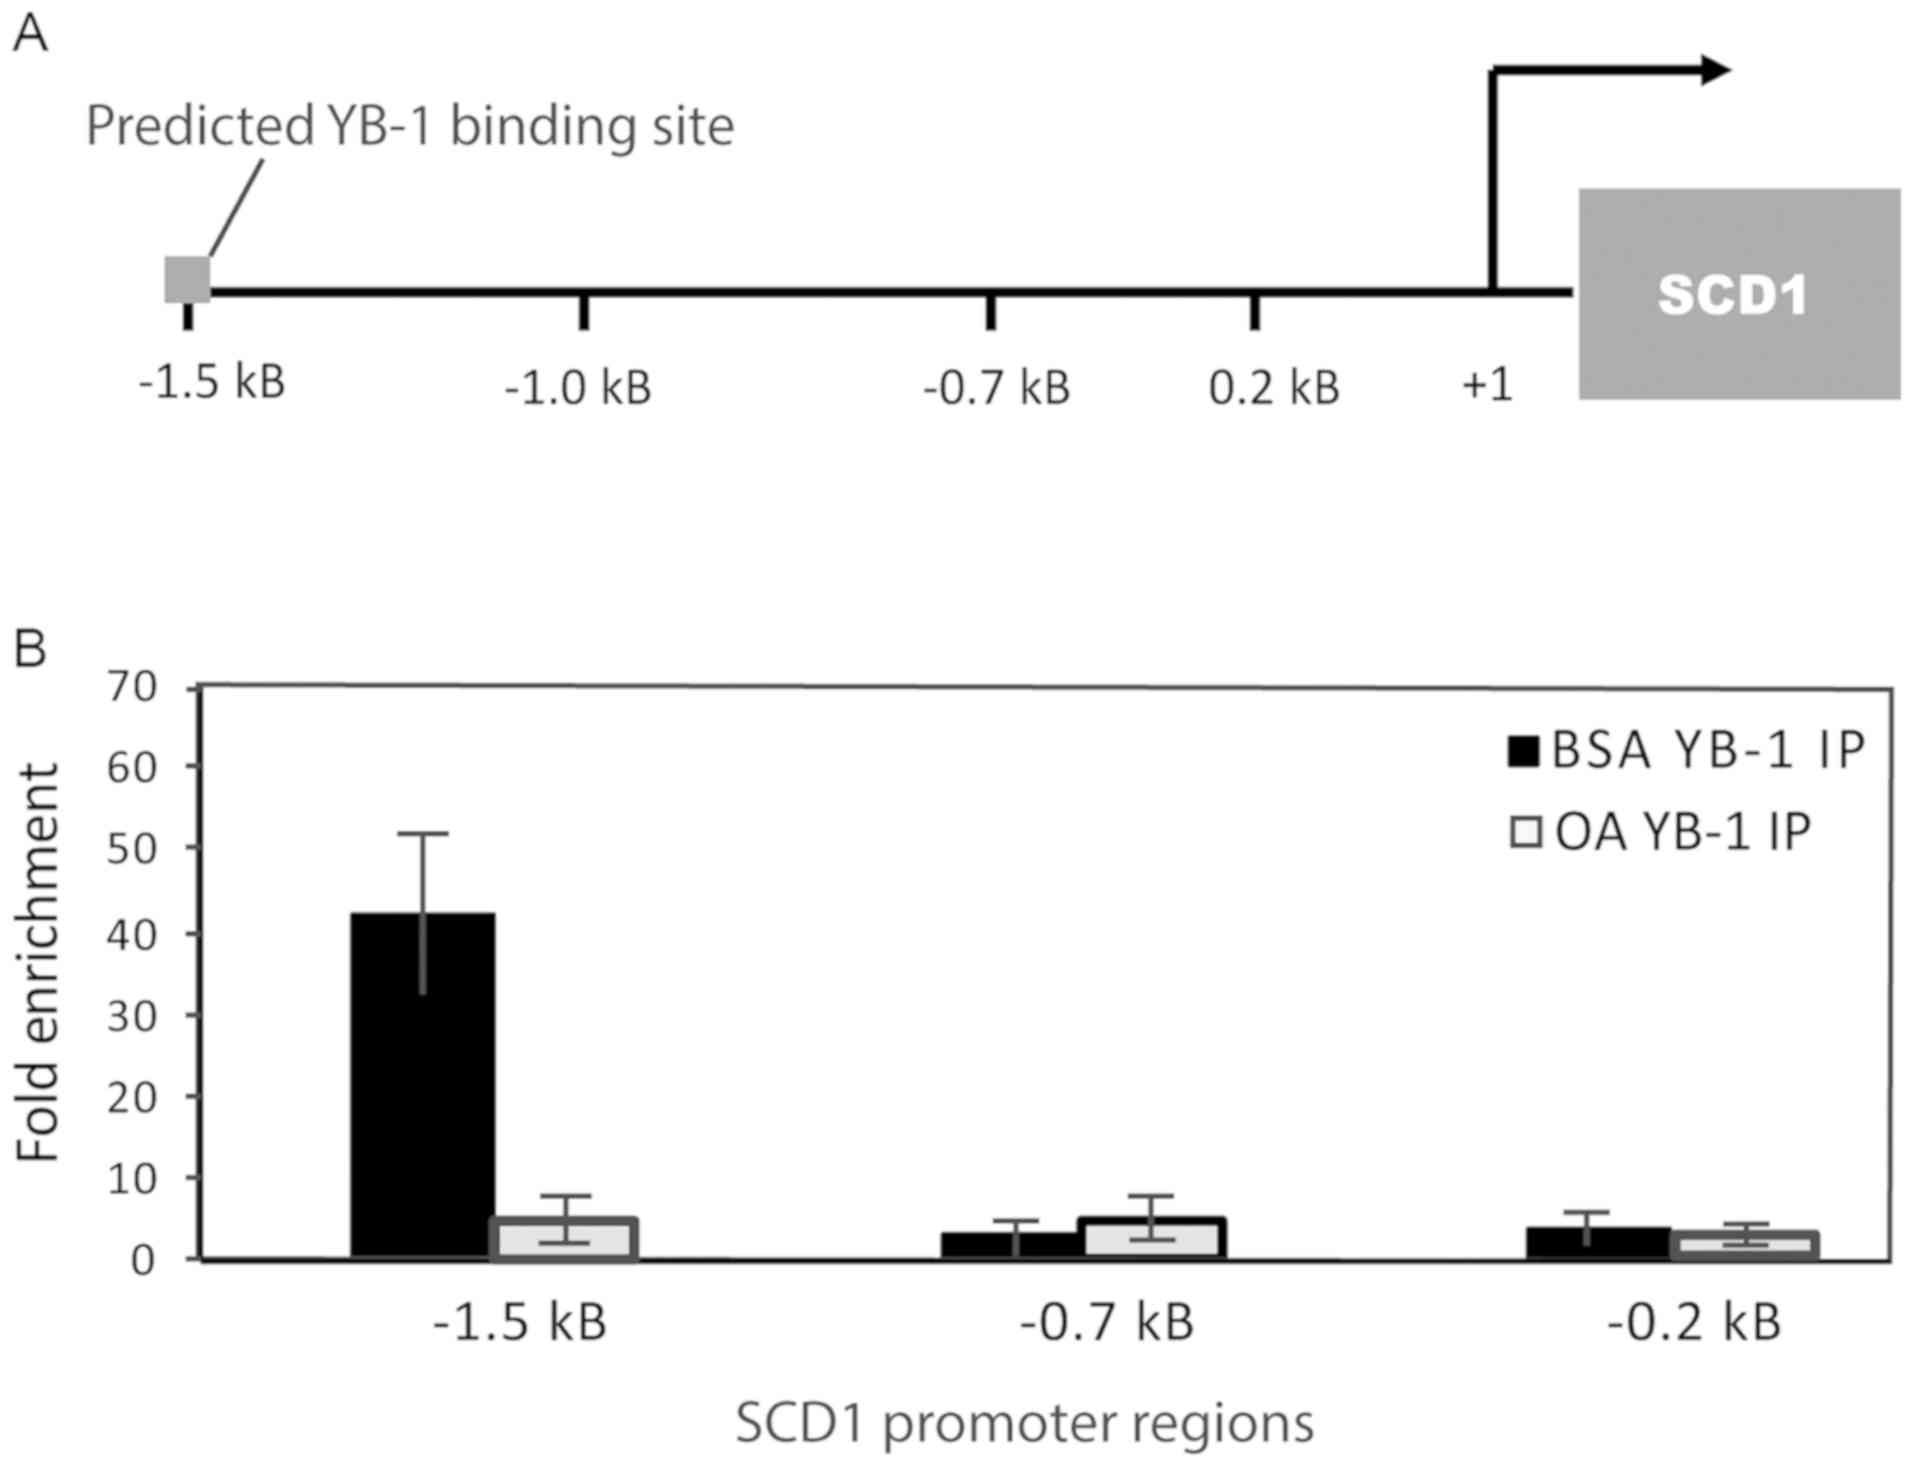
To further demonstrate that YB-1 influenced the
transcription of SCD1, we decided to show the effect of MUFA
on YB-1 binding to the SCD1 promoter. To identify potential
binding sites and aid in the design of chromatin
immunoprecipitation (ChIP) primers for the SCD1 gene
promoter, we utilized the 8th release of JASPAR, the open access
transcription factor binding profile database (46). We designed three sets of primers that
covered roughly 2 kilobases (2 kB) of the upstream region of
SCD1, with one set of primers flanking the JASPAR predicted
YB-1 binding site (Fig. 5A). 786-O
cells were deprived of lipids and replenished with oleate-BSA or
BSA alone as previously described, before being prepared for
chromatin immunoprecipitation quantitative PCR (ChIP-qPCR) analysis
as described in the methods section. Following immunoprecipitation,
YB-1 was highly enriched at the predicted binding site compared to
IgG control, with lower levels of signal observed along the
SCD1 gene promoter. When cells were replenished with 100 µM
oleate-BSA, YB-1-associated DNA is noticeably decreased (Fig. 5B). These data all together suggest
that YB-1 binding to SCD1 promoter is sensitive to the level
of MUFA in the cell and indicates a potential feedback mechanism
between YB-1 and fatty acid levels in ccRCC.
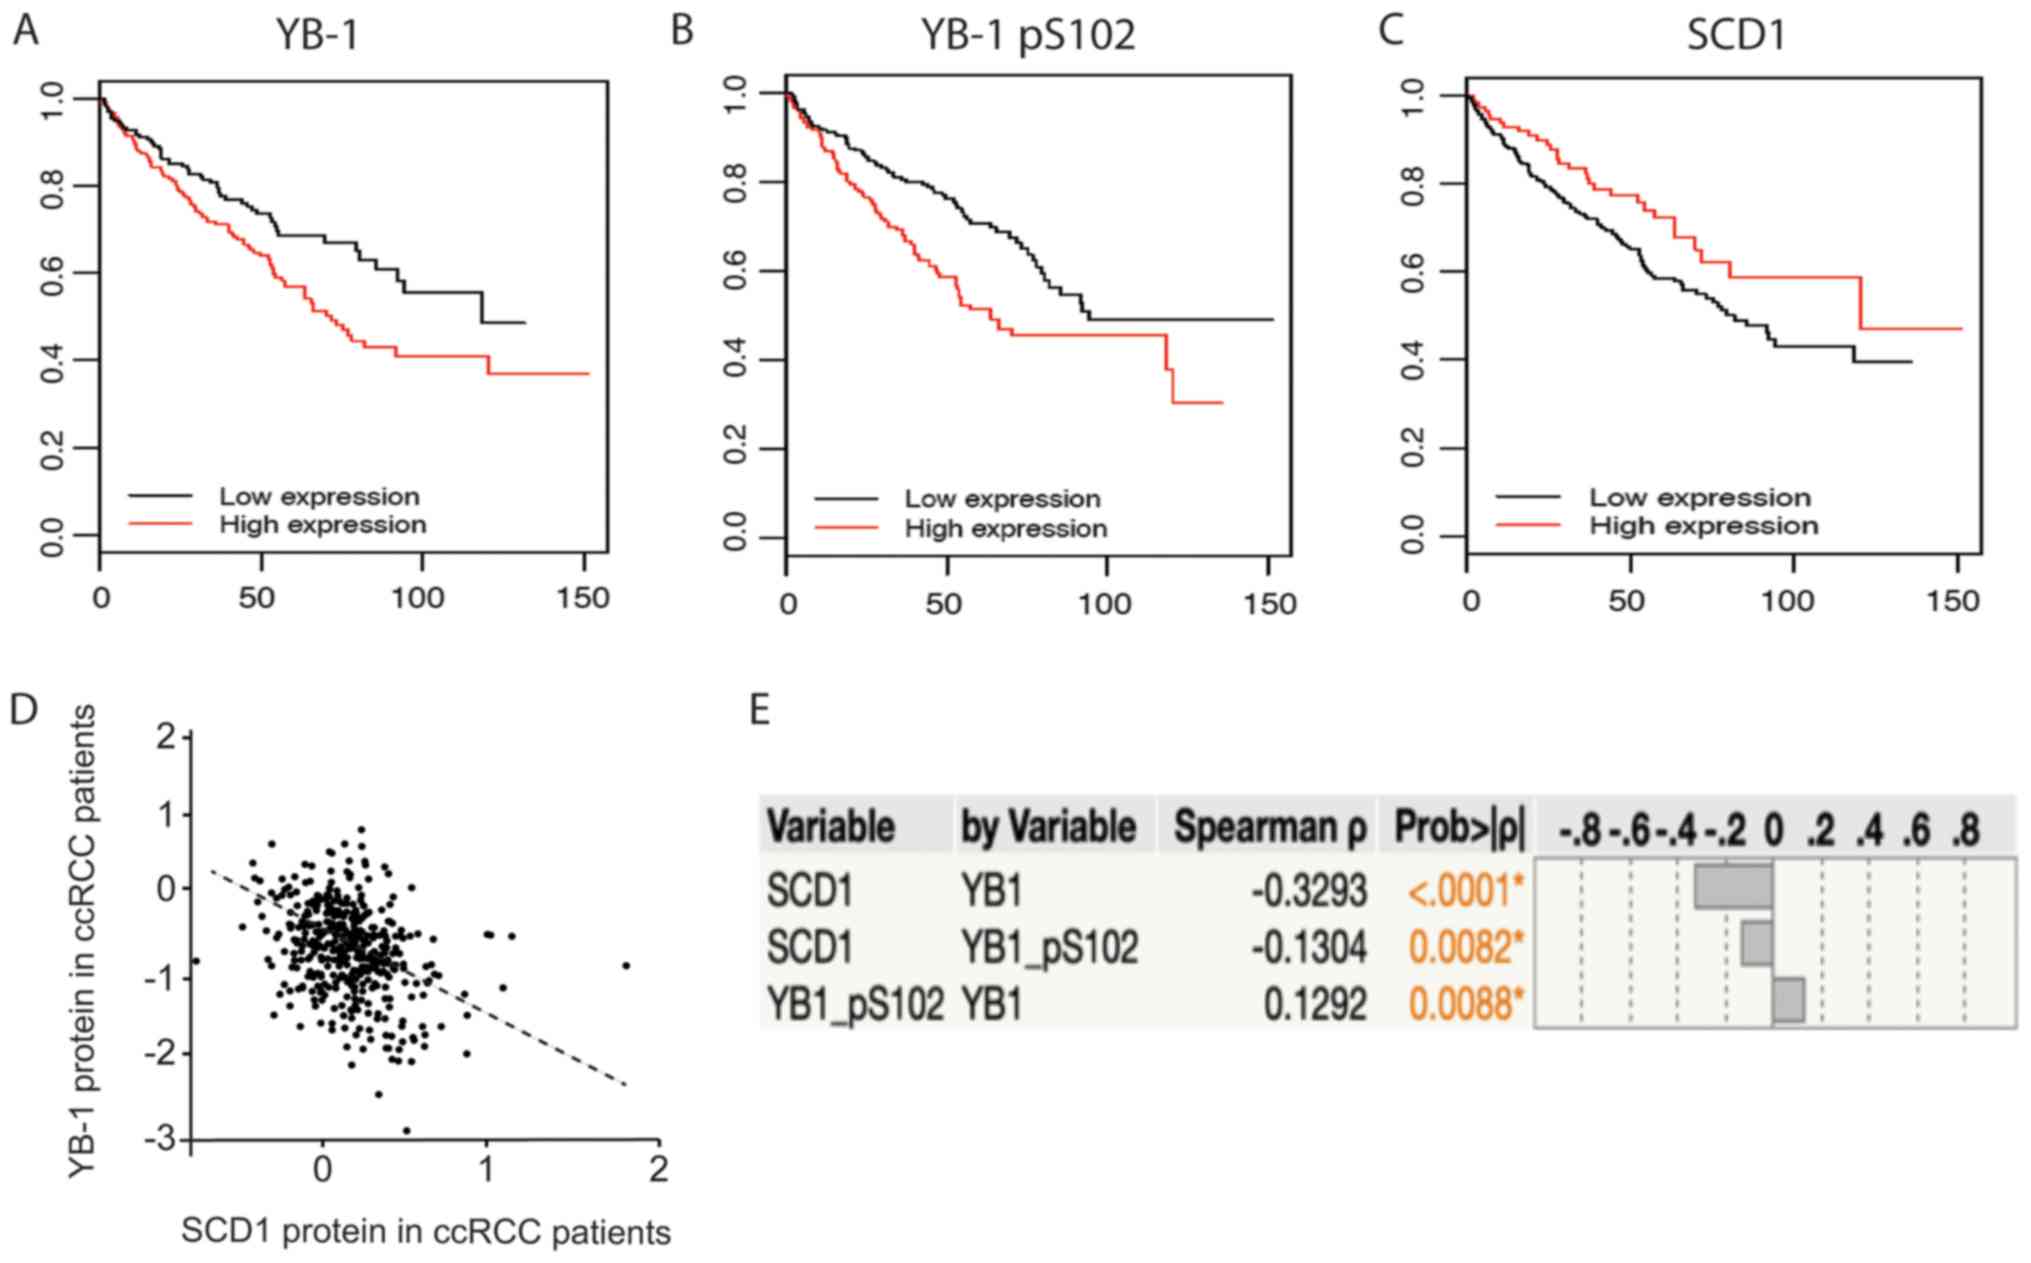
YB-1 protein is negatively correlated
with survival, but SCD1 improves survival
Given that YB-1 and SCD1 have documented roles in
cancer, we next sought to explore the consequences of differential
expression of each protein in ccRCC patients. To accomplish this,
we downloaded ccRCC (KIRC) patient datasets from The Cancer Genome
Atlas (47). We then sorted patients
based on the availability of protein expression (reverse-phase
protein arrays, RPPA) and clinical data. We determined the
association between patient overall survival (OS) and each protein
of interest using univariable Cox proportional Hazard models. The
results of the analysis showed a strong association between each of
the proteins and OS (P-value <0.05) (Table II). YB-1, and its phosphorylated
form (pS102-YB-1), were both negatively associated with OS (i.e.
high expression is associated with decreased survival time), the
hazard ratio for YB-1 was 1.96 (95% CI: 1.33, 2.88) and the hazard
ratio for pS102-YB-1 was 1.77 (95% CI: 1.36, 2.3). Conversely, high
expression of SCD1 was strongly associated with improved OS, hazard
ratio of 0.23 (95% CI: 0.09, 0.55). Kaplan Meir plots were
generated to graphically depict these results (Fig. 6A-C). We next explored the
relationship between SCD1 and YB-1, by analyzing the strength of
the correlation between the expression of each protein in the
patient data. The correlation that was observed was consistent with
our molecular studies, and showed a strong negative correlation
between SCD1 and YB-1 (Fig. 6D and
E). Thus, the expression of YB-1 protein in patients has a
negative impact on SCD1 expression which may contribute to
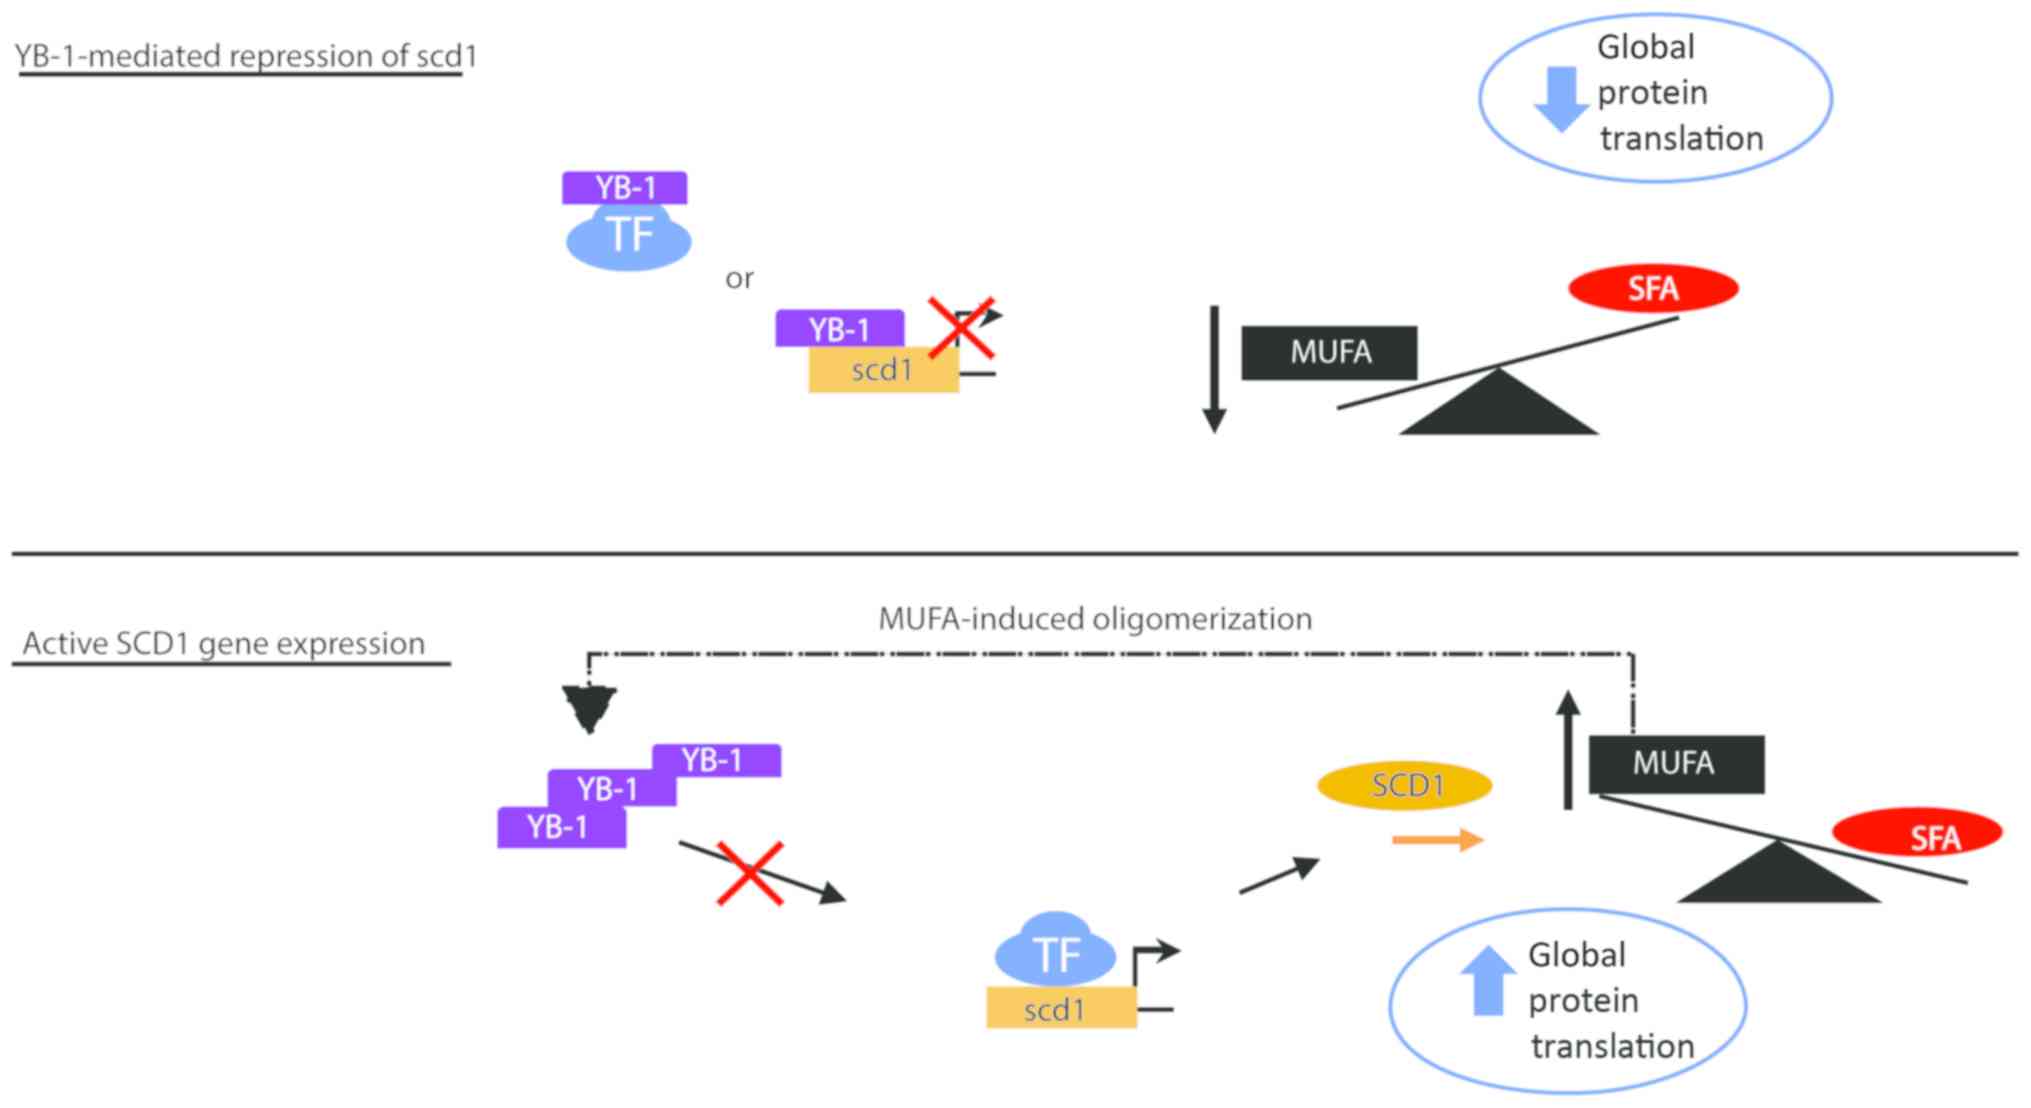
decreased patient survival. To explain how this may work
physiologically, we developed a graphical model (Fig. 7). In the model, we predict that SCD1
expression is negatively affected by YB-1. In our model, increases
in YB-1 protein leads to a decrease in SCD1 mRNA synthesis
and subsequently decreases cellular levels of MUFA. Conversely in
our model, increased SCD1 results in increased cellular MUFA which
functions to increase YB-1 oligomerization. Oligomerization of YB-1
presumably dampens the inhibitory effect of YB-1 on SCD1, through
an undefined mechanism, resulting in increased levels of
SCD1 mRNA transcripts.
| Table II.Summary of univariable associations
with overall survival in patients with ccRCC. |
Table II.
Summary of univariable associations
with overall survival in patients with ccRCC.
| Marker | Hazard ratio | Lower 0.95 CI | Upper 0.95 CI | P-value |
|---|
| YB-1 | 1.96 | 1.33 | 2.88 | 0.0006 |
| YB-1 pS102 | 1.77 | 1.36 | 2.3 | 0.00002 |
| SCD1 | 0.23 | 0.09 | 0.55 | 0.0009 |
Discussion
In the present study, we present data indicating
that YB-1 is a negative regulator of SCD1 in clear cell Renal
Carcinoma (ccRCC). CcRCC is often laden with additional fat stored
in the cytosol. Historically, the presence of increased fatty acids
was thought to contribute to patient resistance to treatment
(48). We began our work by
investigating how increased fatty acids supported differential
protein expression in cancer cells. We were able to demonstrate
that the presence of monounsaturated fatty acid is associated with
increased overall level of protein synthesis in different ccRCC
cell lines compared to non-tumorigenic cells. This mechanism of
increased protein expression was categorically different from that
demonstrated in previous studies, where protein degradation was
inhibited by the presence of MUFA (10).
Further, we showed that YB-1, an oncogene that is
associated with aggressive tumor growth and poor overall survival
in patients, was sensitive to the presence of monounsaturated fat.
Because we saw little shift in the levels of YB1 mRNA in the
presence of MUFA, we suspected that YB-1 protein synthesis was
increased under lipid depletion/replenishment conditions.
Interestingly, we were able to show that YB-1
expression caused a decrease in the expression of SCD1, independent
of MUFA treatment. Furthermore, we confirmed the directionality of
this relationship by illustrating that YB1 knockdown
resulted in increased levels of SCD1 mRNA. It was determined
that SCD1 mRNA was stable even in the absence of YB-1, which
ruled out alterations in mRNA stability or direct changes in
translation. In absence of YB-1, EGFR mRNA also showed some
interesting trends in our study, however it was only included as a
known control for mRNA turnover, the relationship between YB-1 and
EGFR will be investigated in future studies. Prompted by the
effects of YB-1 knockdown on SCD1 mRNA levels, we sought to
analyze interactions between YB-1 and SCD1 DNA. Chromatin
immunoprecipitation data suggest that the SCD1 transcription
is likely inhibited by YB-1 protein occupying a region 1.5 kB
upstream of the SCD1 transcription start site, in the
absence of MUFA. This indicates that YB-1 behaves as a negative
regulator of SCD1 transcription when fatty acids levels are
below a certain threshold.
Finally, as YB-1 has been demonstrated to drive
cancer growth in patients, we became interested in identifying
correlations in expression between YB-1 and SCD1 protein in renal
cancer patients. Our bioinformatic analysis of several hundred
patients' records, confirmed our in vitro findings to show
that YB-1 is negatively associated with SCD1 at the protein level.
However, the most interesting finding was that SCD1 had a largely
positive association with patient survival. Meaning that in our
patient population, individuals whose tumors had increased levels
of SCD1 protein had a statistically significant increase in 5-year
survival compared to patients with less tumor associated SCD1
protein. While this may conflict with previous cancer studies
looking at SCD1 mRNA levels and limited immunohistochemical
assessments, this agrees with previous studies in yeast, nematodes,
and human cells that demonstrated a general benefit to cellular
health and longevity in the presence of MUFAs, such as oleate
(8,23,25,49,50). To
the best of our knowledge, this is the first report that implicates
YB-1 as a regulator of lipogenic genes. Furthermore, this is one of
the first reports to suggest that SCD1 expression may antagonize
the development of more aggressive cancer phenotypes in patients. A
similar study of SCD1 in CML also questions the only role of SCD1
as an oncogene, and demonstrates its potential as a tumor
suppressor (51). Based on our
findings, it appears that investigating the potential benefit of
measuring YB-1 and SCD1 gene expression in patients should be
considered, while implementation of any SCD1-targeted therapies
should be done with considerable precaution.
Acknowledgements
The authors would like to acknowledge the support of
Ms. Jara McLaren (Simmons Laboratory, UMN Medical School) for
providing an early review of the literature regarding function and
localization of YB-1 in the context of cancer; Mrs. Barbara Perslin
(Department of Biomedical Sciences, UMN Medical School) for
administrative support in the ordering of supplies and reagents; Dr
Benjamin Clarke (UMN Medical School) for providing the tissue
culture facilities for the work done for this manuscript; Mrs.
Shannon RedBrook (Clarke Lab) for technical support regarding use
of the Clarke laboratory tissue culture facility; and Dr Jean Regal
(Department of Biomedical Sciences, UMN Medical School) for
orchestrating critical staff support to the project.
Funding
This work was supported by the Whiteside Institute
for Clinical Research and by the National Institutes of Health's
National Center for Advancing Translational Sciences (grant no.
UL1TR002494). The content is solely the responsibility of the
authors and does not necessarily represent the official views of
the National Institutes of Health's National Center for Advancing
Translational Sciences.
Availability of data and materials
The datasets used and/or analyzed during the present
study are available from the corresponding author on reasonable
request.
Authors' contributions
EJ, SF, BC, KR, TC, RM, LB and GES designed studies
and analyzed data. EJ and GES wrote the manuscript. EJ, SF, BC, KR,
TC, RGM, LB and GES performed experiments. GES supervised the
entire study. All authors have read and approved the final
manuscript.
Ethics approval and consent to
participate
Not applicable.
Patient consent for publication
Not applicable.
Competing interests
The authors declare that they have no competing
interests.
References
|
1
|
Noone AM, Cronin KA, Altekruse SF,
Howlader N, Lewis DR, Petkov VI and Penberthy L: Cancer incidence
and survival trends by subtype using data from the surveillance
epidemiology and end results program, 1992–2013. Cancer Epidemiol
Biomarkers Prev. 26:632–641. 2017. View Article : Google Scholar : PubMed/NCBI
|
|
2
|
Wang H, Zhang Y, Lu Y, Song J, Huang M,
Zhang J and Huang Y: The role of stearoyl-coenzyme A desaturase 1
in clear cell renal cell carcinoma. Tumour Biol. 37:479–489. 2016.
View Article : Google Scholar : PubMed/NCBI
|
|
3
|
Zaidi N, Lupien L, Kuemmerle NB, Kinlaw
WB, Swinnen JV and Smans K: Lipogenesis and lipolysis: The pathways
exploited by the cancer cells to acquire fatty acids. Prog Lipid
Res. 52:585–589. 2013. View Article : Google Scholar : PubMed/NCBI
|
|
4
|
Ameer F, Scandiuzzi L, Hasnain S,
Kalbacher H and Zaidi N: De novo lipogenesis in health and disease.
Metabolism. 63:895–902. 2014. View Article : Google Scholar : PubMed/NCBI
|
|
5
|
Vriens K, Christen S, Parik S, Broekaert
D, Yoshinaga K, Talebi A, Dehairs J, Escalona-Noguero C, Schmieder
R, Cornfield T, et al: Evidence for an alternative fatty acid
desaturation pathway increasing cancer plasticity. Nature.
566:403–406. 2019. View Article : Google Scholar : PubMed/NCBI
|
|
6
|
Iwamoto H, Abe M, Yang Y, Cui D, Seki T,
Nakamura M, Hosaka K, Lim S, Wu J, He X, et al: Cancer lipid
metabolism confers antiangiogenic drug resistance. Cell Metab.
28:104–117. 2018. View Article : Google Scholar : PubMed/NCBI
|
|
7
|
Ntambi JM: Regulation of stearoyl-CoA
desaturase by polyunsaturated fatty acids and cholesterol. J Lipid
Res. 40:1549–1558. 1999.PubMed/NCBI
|
|
8
|
Falvella FS, Pascale RM, Gariboldi M,
Manenti G, De Miglio MR, Simile MM, Dragani TA and Feo F:
Stearoyl-CoA desaturase 1 (Scd1) gene overexpression is associated
with genetic predisposition to hepatocarcinogenesis in mice and
rats. Carcinogenesis. 23:1933–1936. 2002. View Article : Google Scholar : PubMed/NCBI
|
|
9
|
von Roemeling CA, Marlow LA, Pinkerton AB,
Crist A, Miller J, Tun HW, Smallridge RC and Copland JA: Aberrant
lipid metabolism in anaplastic thyroid carcinoma reveals stearoyl
CoA desaturase 1 as a novel therapeutic target. J Clin Endocrinol
Metab. 100:E697–E709. 2015. View Article : Google Scholar : PubMed/NCBI
|
|
10
|
Kim H, Rodriguez-Navas C, Kollipara RK,
Kapur P, Pedrosa I, Brugarolas J, Kittler R and Ye J: Unsaturated
fatty acids stimulate tumor growth through stabilization of
beta-catenin. Cell Rep. 13:495–503. 2015. View Article : Google Scholar : PubMed/NCBI
|
|
11
|
Soto-Guzman A, Navarro-Tito N,
Castro-Sanchez L, Martinez-Orozco R and Salazar EP: Oleic acid
promotes MMP-9 secretion and invasion in breast cancer cells. Clin
Exp Metastasis. 27:505–515. 2010. View Article : Google Scholar : PubMed/NCBI
|
|
12
|
von Roemeling CA and Copland JA: Targeting
lipid metabolism for the treatment of anaplastic thyroid carcinoma.
Expert Opin Ther Targets. 20:159–166. 2016. View Article : Google Scholar : PubMed/NCBI
|
|
13
|
Igal RA: Stearoyl-CoA desaturase-1: A
novel key player in the mechanisms of cell proliferation,
programmed cell death and transformation to cancer. Carcinogenesis.
31:1509–1515. 2010. View Article : Google Scholar : PubMed/NCBI
|
|
14
|
Roongta UV, Pabalan JG, Wang X, Ryseck RP,
Fargnoli J, Henley BJ, Yang WP, Zhu J, Madireddi MT, Lawrence RM,
et al: Cancer cell dependence on unsaturated fatty acids implicates
stearoyl-CoA desaturase as a target for cancer therapy. Mol Cancer
Res. 9:1551–1561. 2011. View Article : Google Scholar : PubMed/NCBI
|
|
15
|
Tosi MR, Fini G, Tinti A, Reggiani A and
Tugnoli V: Molecular characterization of human healthy and
neoplastic cerebral and renal tissues by in vitro (1)H NMR
spectroscopy (review). Int J Mol Med. 9:299–310. 2002.PubMed/NCBI
|
|
16
|
Tugnoli V, Reggiani A, Beghelli R,
Tomaselli V, Trinchero A and Tosi MR: Magnetic resonance
spectroscopy and high performance liquid chromatography of
neoplastic human renal tissues. Anticancer Res. 23:1541–1548.
2003.PubMed/NCBI
|
|
17
|
Tugnoli V, Bottura G, Fini G, Reggiani A,
Tinti A, Trinchero A and Tosi MR: 1H-NMR and 13C-NMR lipid profiles
of human renal tissues. Biopolymers. 72:86–95. 2003. View Article : Google Scholar : PubMed/NCBI
|
|
18
|
Mukherjee A, Kenny HA and Lengyel E:
Unsaturated fatty acids maintain cancer cell stemness. Cell Stem
Cell. 20:291–292. 2017. View Article : Google Scholar : PubMed/NCBI
|
|
19
|
Li J, Condello S, Thomes-Pepin J, Ma X,
Xia Y, Hurley TD, Matei D and Cheng JX: Lipid desaturation is a
metabolic marker and therapeutic target of ovarian cancer stem
cells. Cell Stem Cell. 20:303–314.e5. 2017. View Article : Google Scholar : PubMed/NCBI
|
|
20
|
Kawahara I, Mori T, Goto K, Fujii K,
Ohmori H, Kishi S, Fujiwara-Tani R and Kuniyasu H: Fatty acids
induce stemness in the stromal cells of a CT26 mouse tumor model.
Pathobiology. 84:237–242. 2017. View Article : Google Scholar : PubMed/NCBI
|
|
21
|
Parrales A, Ranjan A and Iwakuma T:
Unsaturated fatty acids regulate stemness of ovarian cancer cells
through NF-κB. Stem Cell Investig. 4:492017. View Article : Google Scholar : PubMed/NCBI
|
|
22
|
Del Río LF, Gutiérrez-Casado E,
Varela-López A and Villalba JM: Olive oil and the hallmarks of
aging. Molecules. 21:1632016. View Article : Google Scholar : PubMed/NCBI
|
|
23
|
Imanikia S, Sheng M, Castro C, Griffin JL
and Taylor RC: XBP-1 remodels lipid metabolism to extend longevity.
Cell Rep. 28:581–589.e4. 2019. View Article : Google Scholar : PubMed/NCBI
|
|
24
|
Giacosa A, Barale R, Bavaresco L, Faliva
MA, Gerbi V, La Vecchia C, Negri E, Opizzi A, Perna S, Pezzotti M
and Rondanelli M: Mediterranean way of drinking and longevity. Crit
Rev Food Sci Nutr. 56:635–640. 2016. View Article : Google Scholar : PubMed/NCBI
|
|
25
|
Goudeau J, Bellemin S, Toselli-Mollereau
E, Shamalnasab M, Chen Y and Aguilaniu H: Fatty acid desaturation
links germ cell loss to longevity through NHR-80/HNF4 in C.
elegans. PLoS Biol. 9:e10005992011. View Article : Google Scholar : PubMed/NCBI
|
|
26
|
Schaffer JE: Lipotoxicity: When tissues
overeat. Curr Opin Lipidol. 14:281–287. 2003. View Article : Google Scholar : PubMed/NCBI
|
|
27
|
Schaffer JE: Lipotoxicity: Many roads to
cell dysfunction and cell death: Introduction to a thematic review
series. J Lipid Res. 57:1327–1328. 2016. View Article : Google Scholar : PubMed/NCBI
|
|
28
|
Noto A, Raffa S, De Vitis C, Roscilli G,
Malpicci D, Coluccia P, Di Napoli A, Ricci A, Giovagnoli MR,
Aurisicchio L, et al: Stearoyl-CoA desaturase-1 is a key factor for
lung cancer-initiating cells. Cell Death Dis. 4:e9472013.
View Article : Google Scholar : PubMed/NCBI
|
|
29
|
Mason P, Liang B, Li L, Fremgen T, Murphy
E, Quinn A, Madden SL, Biemann HP, Wang B, Cohen A, et al: SCD1
inhibition causes cancer cell death by depleting mono-unsaturated
fatty acids. PLoS One. 7:e338232012. View Article : Google Scholar : PubMed/NCBI
|
|
30
|
Hess D, Chisholm JW and Igal RA:
Inhibition of stearoylCoA desaturase activity blocks cell cycle
progression and induces programmed cell death in lung cancer cells.
PLoS One. 5:e113942010. View Article : Google Scholar : PubMed/NCBI
|
|
31
|
Kleene KC: Y-box proteins combine
versatile cold shock domains and arginine-rich motifs (ARMs) for
pleiotropic functions in RNA biology. Biochem J. 475:2769–2784.
2018. View Article : Google Scholar : PubMed/NCBI
|
|
32
|
Lyons SM, Achorn C, Kedersha NL, Anderson
PJ and Ivanov P: YB-1 regulates tiRNA-induced stress granule
formation but not translational repression. Nucleic Acids Res.
44:6949–6960. 2016. View Article : Google Scholar : PubMed/NCBI
|
|
33
|
Somasekharan SP, El-Naggar A, Leprivier G,
Cheng H, Hajee S, Grunewald TGP, Zhang F, Ng T, Delattre O,
Evdokimova V, et al: YB-1 regulates stress granule formation and
tumor progression by translationally activating G3BP1. J Cell Biol.
208:913–929. 2015. View Article : Google Scholar : PubMed/NCBI
|
|
34
|
Willis WL, Hariharan S, David JJ and
Strauch AR: Transglutaminase-2 mediates calcium-regulated
crosslinking of the Y-Box 1 (YB-1) translation-regulatory protein
in TGFβ1-activated myofibroblasts. J Cell Biochem. 114:2753–2769.
2013. View Article : Google Scholar : PubMed/NCBI
|
|
35
|
Zhang A, Liu X, Cogan JG, Fuerst MD,
Polikandriotis JA, Kelm RJ Jr and Strauch AR: YB-1 coordinates
vascular smooth muscle α-actin gene activation by transforming
growth factor β1 and thrombin during differentiation of human
pulmonary myofibroblasts. Mol Biol Cell. 16:4931–4940. 2005.
View Article : Google Scholar : PubMed/NCBI
|
|
36
|
Miao X, Wu Y, Wang Y, Zhu X, Yin H, He Y,
Li C, Liu Y, Lu X, Chen Y, et al: Y-box-binding protein-1 (YB-1)
promotes cell proliferation, adhesion and drug resistance in
diffuse large B-cell lymphoma. Exp Cell Res. 346:157–166. 2016.
View Article : Google Scholar : PubMed/NCBI
|
|
37
|
Heumann A, Kaya Ö, Burdelski C, Hube-Magg
C, Kluth M, Lang DS, Simon R, Beyer B, Thederan I, Sauter G, et al:
Up regulation and nuclear translocation of Y-box binding protein 1
(YB-1) is linked to poor prognosis in ERG-negative prostate cancer.
Sci Rep. 7:20562017. View Article : Google Scholar : PubMed/NCBI
|
|
38
|
Ha B, Lee EB, Cui J, Kim Y and Jang HH:
YB-1 overexpression promotes a TGF-β1-induced
epithelial-mesenchymal transition via Akt activation. Biochem
Biophys Res Commun. 458:347–351. 2015. View Article : Google Scholar : PubMed/NCBI
|
|
39
|
Wu SL, Fu X, Huang J, Jia TT, Zong FY, Mu
SR, Zhu H, Yan Y, Qiu S, Wu Q, et al: Genome-wide analysis of
YB-1-RNA interactions reveals a novel role of YB-1 in miRNA
processing in glioblastoma multiforme. Nucleic Acids Res.
43:8516–8528. 2015. View Article : Google Scholar : PubMed/NCBI
|
|
40
|
Wei WJ, Mu SR, Heiner M, Fu X, Cao LJ,
Gong XF, Bindereif A and Hui J: YB-1 binds to CAUC motifs and
stimulates exon inclusion by enhancing the recruitment of U2AF to
weak polypyrimidine tracts. Nucleic Acids Res. 40:8622–8636. 2012.
View Article : Google Scholar : PubMed/NCBI
|
|
41
|
Dolfini D and Mantovani R: Targeting the
Y/CCAAT box in cancer: YB-1 (YBX1) or NF-Y. Cell Death Differ.
20:676–685. 2013. View Article : Google Scholar : PubMed/NCBI
|
|
42
|
Livak KJ and Schmittgen TD: Analysis of
relative gene expression data using real-time quantitative PCR and
the 2(-Delta Delta C(T)) method. Methods. 25:402–408. 2001.
View Article : Google Scholar : PubMed/NCBI
|
|
43
|
Shurtleff MJ, Temoche-Diaz MM, Karfilis
KV, Ri S and Schekman R: Y-box protein 1 is required to sort
microRNAs into exosomes in cells and in a cell-free reaction.
Elife. 5:e192762016. View Article : Google Scholar : PubMed/NCBI
|
|
44
|
Peter A, Weigert C, Staiger H, Rittig K,
Cegan A, Lutz P, Machicao F, Häring HU and Schleicher E: Induction
of stearoyl-CoA desaturase protects human arterial endothelial
cells against lipotoxicity. Am J Physiol Endocrinol Metab.
295:E339–E349. 2008. View Article : Google Scholar : PubMed/NCBI
|
|
45
|
Yuan Z, Shin J, Wilson A, Goel S, Ling YH,
Ahmed N, Dopeso H, Jhawer M, Nasser S, Montagna C, et al: An A13
repeat within the 3-untranslated region of epidermal growth factor
receptor (EGFR) is frequently mutated in microsatellite instability
colon cancers and is associated with increased EGFR expression.
Cancer Res. 69:7811–7818. 2009. View Article : Google Scholar : PubMed/NCBI
|
|
46
|
Khan A, Fornes O, Stigliani A, Gheorghe M,
Castro-Mondragon JA, van der Lee R, Bessy A, Chèneby J, Kulkarni
SR, Tan G, et al: JASPAR 2018: Update of the open-access database
of transcription factor binding profiles and its web framework.
Nucleic Acids Res. 46:D260–D266. 2018. View Article : Google Scholar : PubMed/NCBI
|
|
47
|
Li J, Lu Y, Akbani R, Ju Z, Roebuck PL,
Liu W, Yang JY, Broom BM, Verhaak RGW, Kane DW, et al: TCPA: A
resource for cancer functional proteomics data. Nat Methods.
10:1046–1047. 2013. View Article : Google Scholar : PubMed/NCBI
|
|
48
|
Pisanu ME, Noto A, De Vitis C, Morrone S,
Scognamiglio G, Botti G, Venuta F, Diso D, Jakopin Z, Padula F, et
al: Blockade of Stearoyl-CoA-desaturase 1 activity reverts
resistance to cisplatin in lung cancer stem cells. Cancer Lett.
406:93–104. 2017. View Article : Google Scholar : PubMed/NCBI
|
|
49
|
Horikawa M, Nomura T, Hashimoto T and
Sakamoto K: Elongation and desaturation of fatty acids are critical
in growth, lipid metabolism and ontogeny of caenorhabditis elegans.
J Biochem. 144:149–158. 2008. View Article : Google Scholar : PubMed/NCBI
|
|
50
|
von Roemeling CA, Marlow LA, Wei JJ,
Cooper SJ, Caulfield TR, Wu K, Tan WW, Tun HW and Copland JA:
Stearoyl-CoA desaturase 1 is a novel molecular therapeutic target
for clear cell renal cell carcinoma. Clin Cancer Res. 19:2368–2380.
2013. View Article : Google Scholar : PubMed/NCBI
|
|
51
|
Zhang H, Li H, Ho N, Li D and Li S: Scd1
plays a tumor-suppressive role in survival of leukemia stem cells
and the development of chronic myeloid leukemia. Mol Cell Biol.
32:1776–1787. 2012. View Article : Google Scholar : PubMed/NCBI
|