Introduction
In recent years we have witnessed an increasing
trend in the incidence of thyroid nodules (1). However, only about 5 to 15% of the
nodules are malignant. The optimal imaging method is a common
diagnostic tool in thyroid diseases. The accuracy of optimal
imaging method in the diagnosis of thyroid diseases needs further
improvement. These improvements include improving the sonographic
features of both benign and malignant thyroid nodules (2,3).
Ultrasound elastography (USE) is a novel technology
to qualitatively or quantitatively, measure the stiffness of the
tissue that can offer valuable diagnostic information. This method
is considered a promising tool in differential diagnostic of benign
and malignant nodules. USE can be generally divided into two
categories: Strain elastography and shear wave elastography (SWE).
The former which emerged earlier needs an external force to
generate tissue strain and has been proven to be helpful in the
diagnosis of lesions in many organs such as the liver, breast and
thyroid (4–7). This technology largely depends on the
operator's experience which includes an interobserver
reproducibility effect. SWE, which we used in this study, is a
real-time elastography to measure the stiffness of the tissue
qualitatively and quantitatively (8,9). This is
because the external force applied in SWE is generated by the sound
pulse of the SWE system, and thus it has good reliability and
repeatability.
Recently, SWE is the focus of elastography research
which has demonstrated higher performances in diagnosing breast and
thyroid lesions compared with conventional US and other existing
elastography used in prior studies. However, the clinical
application of SWE in thyroid lesions remains controversial
(10–13). On the other hand, a recent study
(14) demonstrated that the lesion
elasticity (stiffness) is effected by the compression put on the
probe although which is not necessary. That was similarly found in
our study. We found that the discrepancy in the optimized
algorithm, difference value and ratio value between nodules and
thyroid parenchyma acquired in the same frame of elastographic
images, was much smaller than that of conventional elasticity
indices (EIs).
The aim of the present study was to evaluate the
reproducibility and accuracy of the optimized algorithm of SWE in
differentiating benign and malignant solid thyroid nodules.
Patients and methods
Patients
From April 2016 to April 2017, 263 solid thyroid
nodules in 248 patients (76 males and 152 females) were collected
at the Sichuan Academy of Medical Sciences and Sichuan Provincial
People's Hospital, University of Electronic Science and Technology
of China. These solid thyroid nodules underwent conventional US and
SWE by an operator with 8 years of experience in thyroid US
examination and one year experience in SWE. The second operator
with less experience in both methods conducted SWE immediately
after the former one and was blind to previous results. Then all
the patients were scheduled for ultrasound-guided fine-needle
aspiration (FNA). Nodules with malignant or suspicious
cytopathology received surgery and part of the benign nodules
(n=54) received surgery as well. Twenty of the 263 nodules were
excluded due to unqualified cytopathologic results. The study was
approved by the Ethics Committee of Sichuan Academy of Medical
Sciences and Sichuan Provincial People's Hospital, China. Patients
who participated in this research, signed the informed consent and
had complete clinical data.
Conventional US examination
Conventional US was performed using a 4–15 MHz
linear transducer (SuperLinear™SL 15-4) on the AIXPLORER system
(Aixplorer, SuperSonic Imagine, Aix-en-Provence). This provided
real-time assessment of tissues stiffness with the SWE color map
qualitatively and elasticity modulus (Young's modulus)
quantitatively. Patients were positioned in a supine position with
their necks bend back slightly over a pillow. The nodule size,
depth (distance from the skin), location (isthmus or not) and
calcification (yes or no) were observed and recorded by the first
operator. Only the solid nodules with the size <30 mm and depth
<25 mm and without macrocalcification were included in this
study.
SWE examination
After receiving conventional US examination,
patients underwent SWE in the same position by the same operator
using the same transducer. Subsequently, SWE mode was activated and
the region of interest (ROI) was applied on the longitudinal view
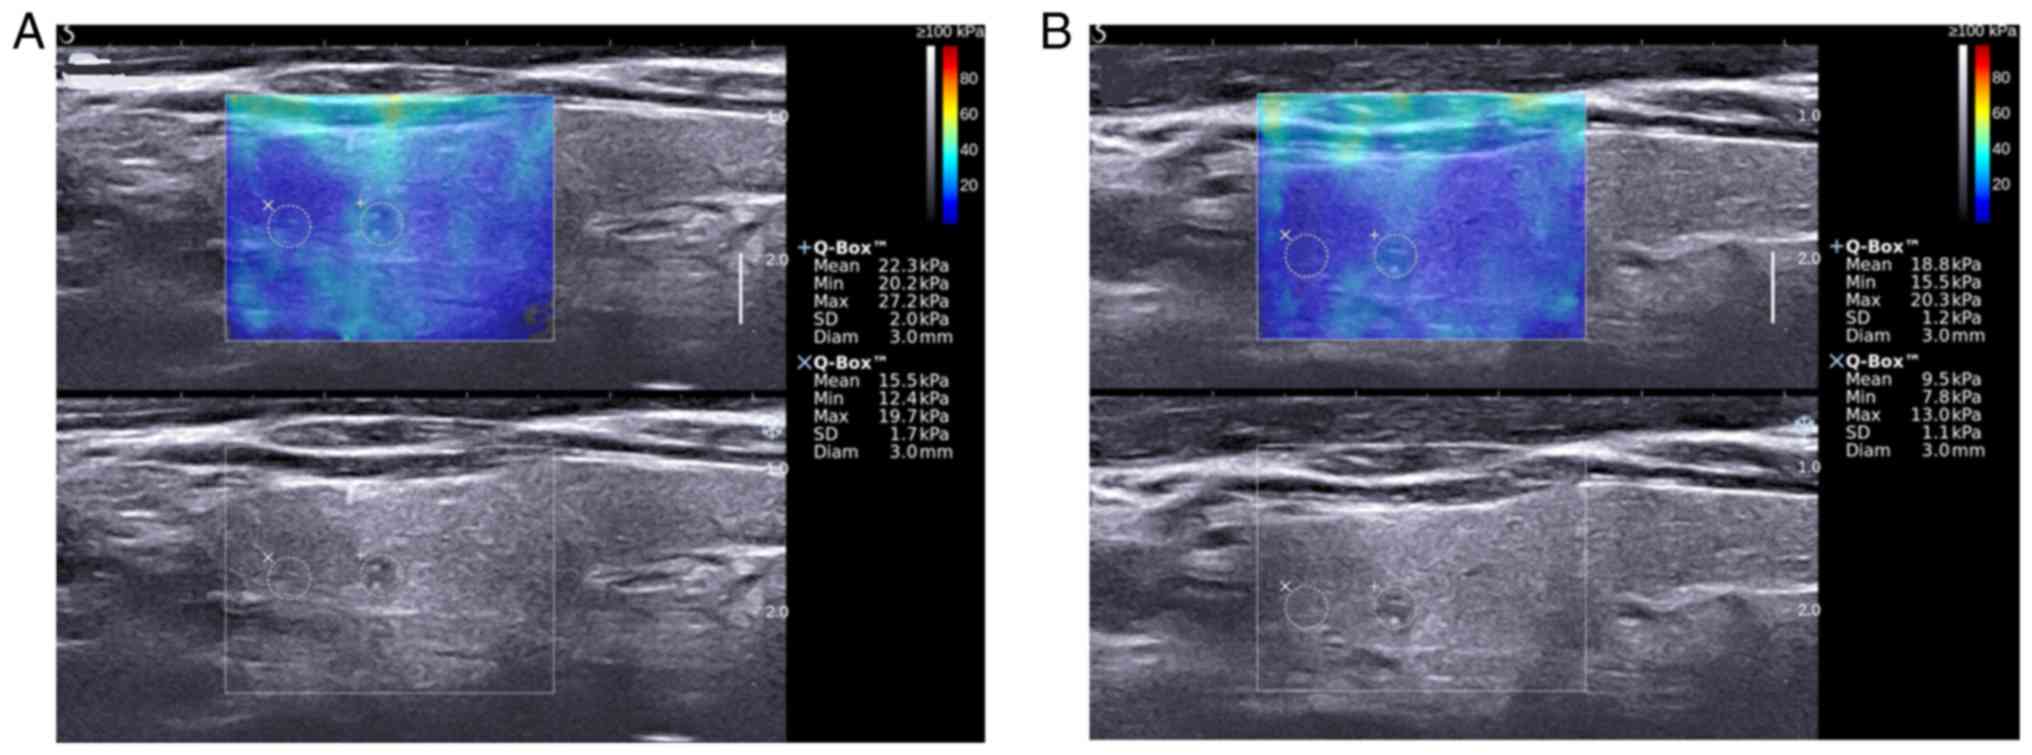
of the nodule with maximum diameter (Fig. 1). ROI was the SWE color map box in
which the blue area to red area represented lowest stiffness region
to highest stiffness region with Young's modulus ranging from 0–140
kPa and the target nodule and surrounding thyroid parenchyma was
included. The probe was held for about 5 sec on the patient's neck
without applying any pressure with adequate amount of transducer
gel on the skin above the nodule in order to stabilize the SWE
images. Subsequently, the best frame with a reasonable color map
covering the target region without filling defect of the saved
images was selected to measure the mean, minimum and maximum
(showed as Emean, Emin and Emax on the AIXPLORER system) of
elasticity indices of the nodule (recorded as EIs, including MEAN,
MIN and MAX) and thyroid parenchyma (recorded as EInorm, including
MEANnorm, MINnorm and MAXnorm) by two circular sampling volume
(Q-Box™) respectively. The first Q-Box™ was placed in the target
nodule with a size equal to the size of the whole nodule while the
tissues outside the nodule were not included (eg. strap muscles,
trachea). The second Q-Box™ with the same size of 2 mm was placed
in the surrounding thyroid parenchyma. The EI and EInorm were
measured and recorded for three times and before each measurement,
the transducer was removed and reapplied. The average value of
three measurements for EI and EInorm was recorded as EIavg
(including MEANavg, MINavg and MAXavg) and EInorm_avg (including
MEANnorm_avg, MINnorm_avg and MAXnorm_avg), respectively. The
second operator repeated SWE examination immediately after the
first operator and was blind to previous results.
Optimized algorithm
The optimized algorithm was the difference in the
value of elasticity modulus between the nodule and surrounding
thyroid parenchyma in the same frame of SWE images (EId=EI-EInorm,
including MEANd, MINd and MAXd and EId_avg=EIavg-EInorm_avg,
including MEANd_avg, MINd_avg and MAXd_avg) and the ratio value of
elasticity modulus between the nodule and surrounding thyroid
parenchyma measured in the same frame of SWE images (EIr=EI/EInorm,
including MEANr, MINr and MAXr and EIr_avg=EIavg/EInorm_avg,
including MEANr_avg, MINr_avg and MAXr_avg).
Statistical analysis
All the data were analyzed using SPSS statistical
software (IBM Corp.) version 19.0. The intraclass correlation
coefficients (ICCs) were calculated to measure the reliability of
using a one-way analysis of variance (ANOVA). The ICCs of EId and
EIr calculated by the first observer were measured for
intraobserver reliability. The EId_avg and EIr_avg calculated by
both observers were measured for interobserver reliability. An ICC
of 0–0.49 indicates poor reliability; 0.50–0.74 indicates moderate
reliability; 0.75–1.00 indicates excellent reliability based on the
criteria (15). Receiver-operating
characteristic (ROC) analyses were performed to evaluate the
diagnostic performances of conventional SWE parameters and
optimized algorithm parameters and the areas under the ROC curves
(AUCs) were calculated to determine the best diagnostic cut-off
value for each parameter. In addition, the optimal SWE parameter
and its corresponding sensitivity, specificity, accuracy, positive
predictive value (PPV) and negative predictive value (NPV) were
calculated.
Results
Two hundred and forty-eight patients (age range,
5–85 years; mean age: 43.18 years) with 243 solid nodules were
included in this study (Table I).
The mean size of the nodules was 9.83±5.15 mm (range, 2.90–29.50
mm). The benign nodules (n=121) including nodular goiter (n=44),
adenoma (n=4), focal thyroiditis (n=35), and other benign
hyperplastic nodule (n=38) were confirmed by qualified FNA cytology
tests or surgery. All of the malignant nodules (n=122) were
confirmed as papillary thyroid carcinoma (PTC) by surgery.
 | Table I.Characteristics of the 243 thyroid
solid nodules. |
Table I.
Characteristics of the 243 thyroid
solid nodules.
| Characteristics | Benign (n) | Malignant (n) |
|---|
| Total no. of
nodules | 121 | 122 |
| Size (mm) |
|
|
| ≤10 | 87 | 63 |
|
10-20 | 28 | 53 |
|
>20 | 6 | 6 |
| Depth (mm) |
|
|
| ≤10 | 64 | 75 |
|
10-20 | 57 | 46 |
|
>20 | 0 | 1 |
| Location |
|
|
|
Isthmus | 19 | 33 |
| Not
isthmus | 102 | 89 |
| Calcification |
|
|
|
Yes | 53 | 74 |
| No | 88 | 48 |
Intraobserver reproducibility of the
optimized algorithm for 243 solid thyroid nodules
The intraobserver reliability of the optimized
algorithm for benign nodules was nearly perfect for MEANd, MAXd,
MEANr, MINr and MAXr with ICC>0.80 and MINd was substantial with
ICC=0.77 (Table II). For malignant
nodules, the reliability was nearly perfect for all parameters with
ICC>0.80. As for all 243 nodules, the reliability was nearly
perfect for all parameters with ICC>0.80.
| Table II.Intraobserver reliability of the
optimized algorithm measurements for 243 solid thyroid nodules for
the first operator. |
Table II.
Intraobserver reliability of the
optimized algorithm measurements for 243 solid thyroid nodules for
the first operator.
|
| Benign | Malignant | Total |
|---|
|
|
|
|
|
|---|
| Parameters | ICC | 95% CI | ICC | 95% CI | ICC | 95% CI |
|---|
| MEANda | 0.91 | 0.88–0.94 | 0.91 | 0.88–0.94 | 0.93 | 0.92–0.95 |
| MINdb | 0.77 | 0.69–0.84 | 0.88 | 0.84–0.91 | 0.86 | 0.83–0.89 |
| MAXdc | 0.94 | 0.92–0.96 | 0.89 | 0.85–0.92 | 0.92 | 0.91–0.94 |
| MEANrd | 0.87 | 0.83–0.91 | 0.89 | 0.85–0.92 | 0.91 | 0.89–0.93 |
| MINre | 0.81 | 0.74–0.86 | 0.91 | 0.88–0.94 | 0.90 | 0.87–0.92 |
| MAXrf | 0.90 | 0.87–0.93 | 0.86 | 0.82–0.90 | 0.91 | 0.88–0.92 |
Interobserver reproducibility of the
optimized algorithm for 243 solid thyroid nodules
In the benign nodules, the interobserver agreement
for MEANd_avg, MAXd_avg, MEANr_avg and MAXr_avg was nearly perfect
with ICC>0.80 and was substantial for MINd_avg and MINr_avg with
ICC=0.72 and 0.71, respectively (Table
III). In the malignant nodules, it was nearly perfect for all
parameters with ICC>0.80. As for all 243 nodules, the
interobserver agreement was nearly perfect for MEANd_avg, MAXd_avg,
MEANr_avg and MAXr_avg with ICC>0.80 and was substantial for
MINd_avg and MINr_avg with ICC=0.78 and 0.79, respectively.
| Table III.Interobserver reliability of the
optimized algorithm measurements for 243 solid thyroid nodules. |
Table III.
Interobserver reliability of the
optimized algorithm measurements for 243 solid thyroid nodules.
|
| Benign | Malignant | Total |
|---|
|
|
|
|
|
|---|
| Parameters | ICC | 95% CI | ICC | 95% CI | ICC | 95% CI |
|---|
|
MEANd_avga | 0.86 | 0.81–0.90 | 0.90 | 0.86–0.93 | 0.91 | 0.89–0.93 |
|
MINd_avgb | 0.72 | 0.62–0.80 | 0.79 | 0.71–0.84 | 0.78 | 0.72–0.82 |
|
MAXd_avgc | 0.89 | 0.85–0.92 | 0.89 | 0.84–0.92 | 0.91 | 0.89–0.93 |
|
MEANr_avgd | 0.80 | 0.72–0.86 | 0.86 | 0.80–0.90 | 0.87 | 0.83–0.90 |
|
MINr_avge | 0.71 | 0.61–0.79 | 0.80 | 0.73–0.86 | 0.79 | 0.74–0.83 |
|
MAXr_avgf | 0.83 | 0.77–0.88 | 0.79 | 0.71–0.85 | 0.84 | 0.80–0.87 |
Accuracy of the optimized
algorithm
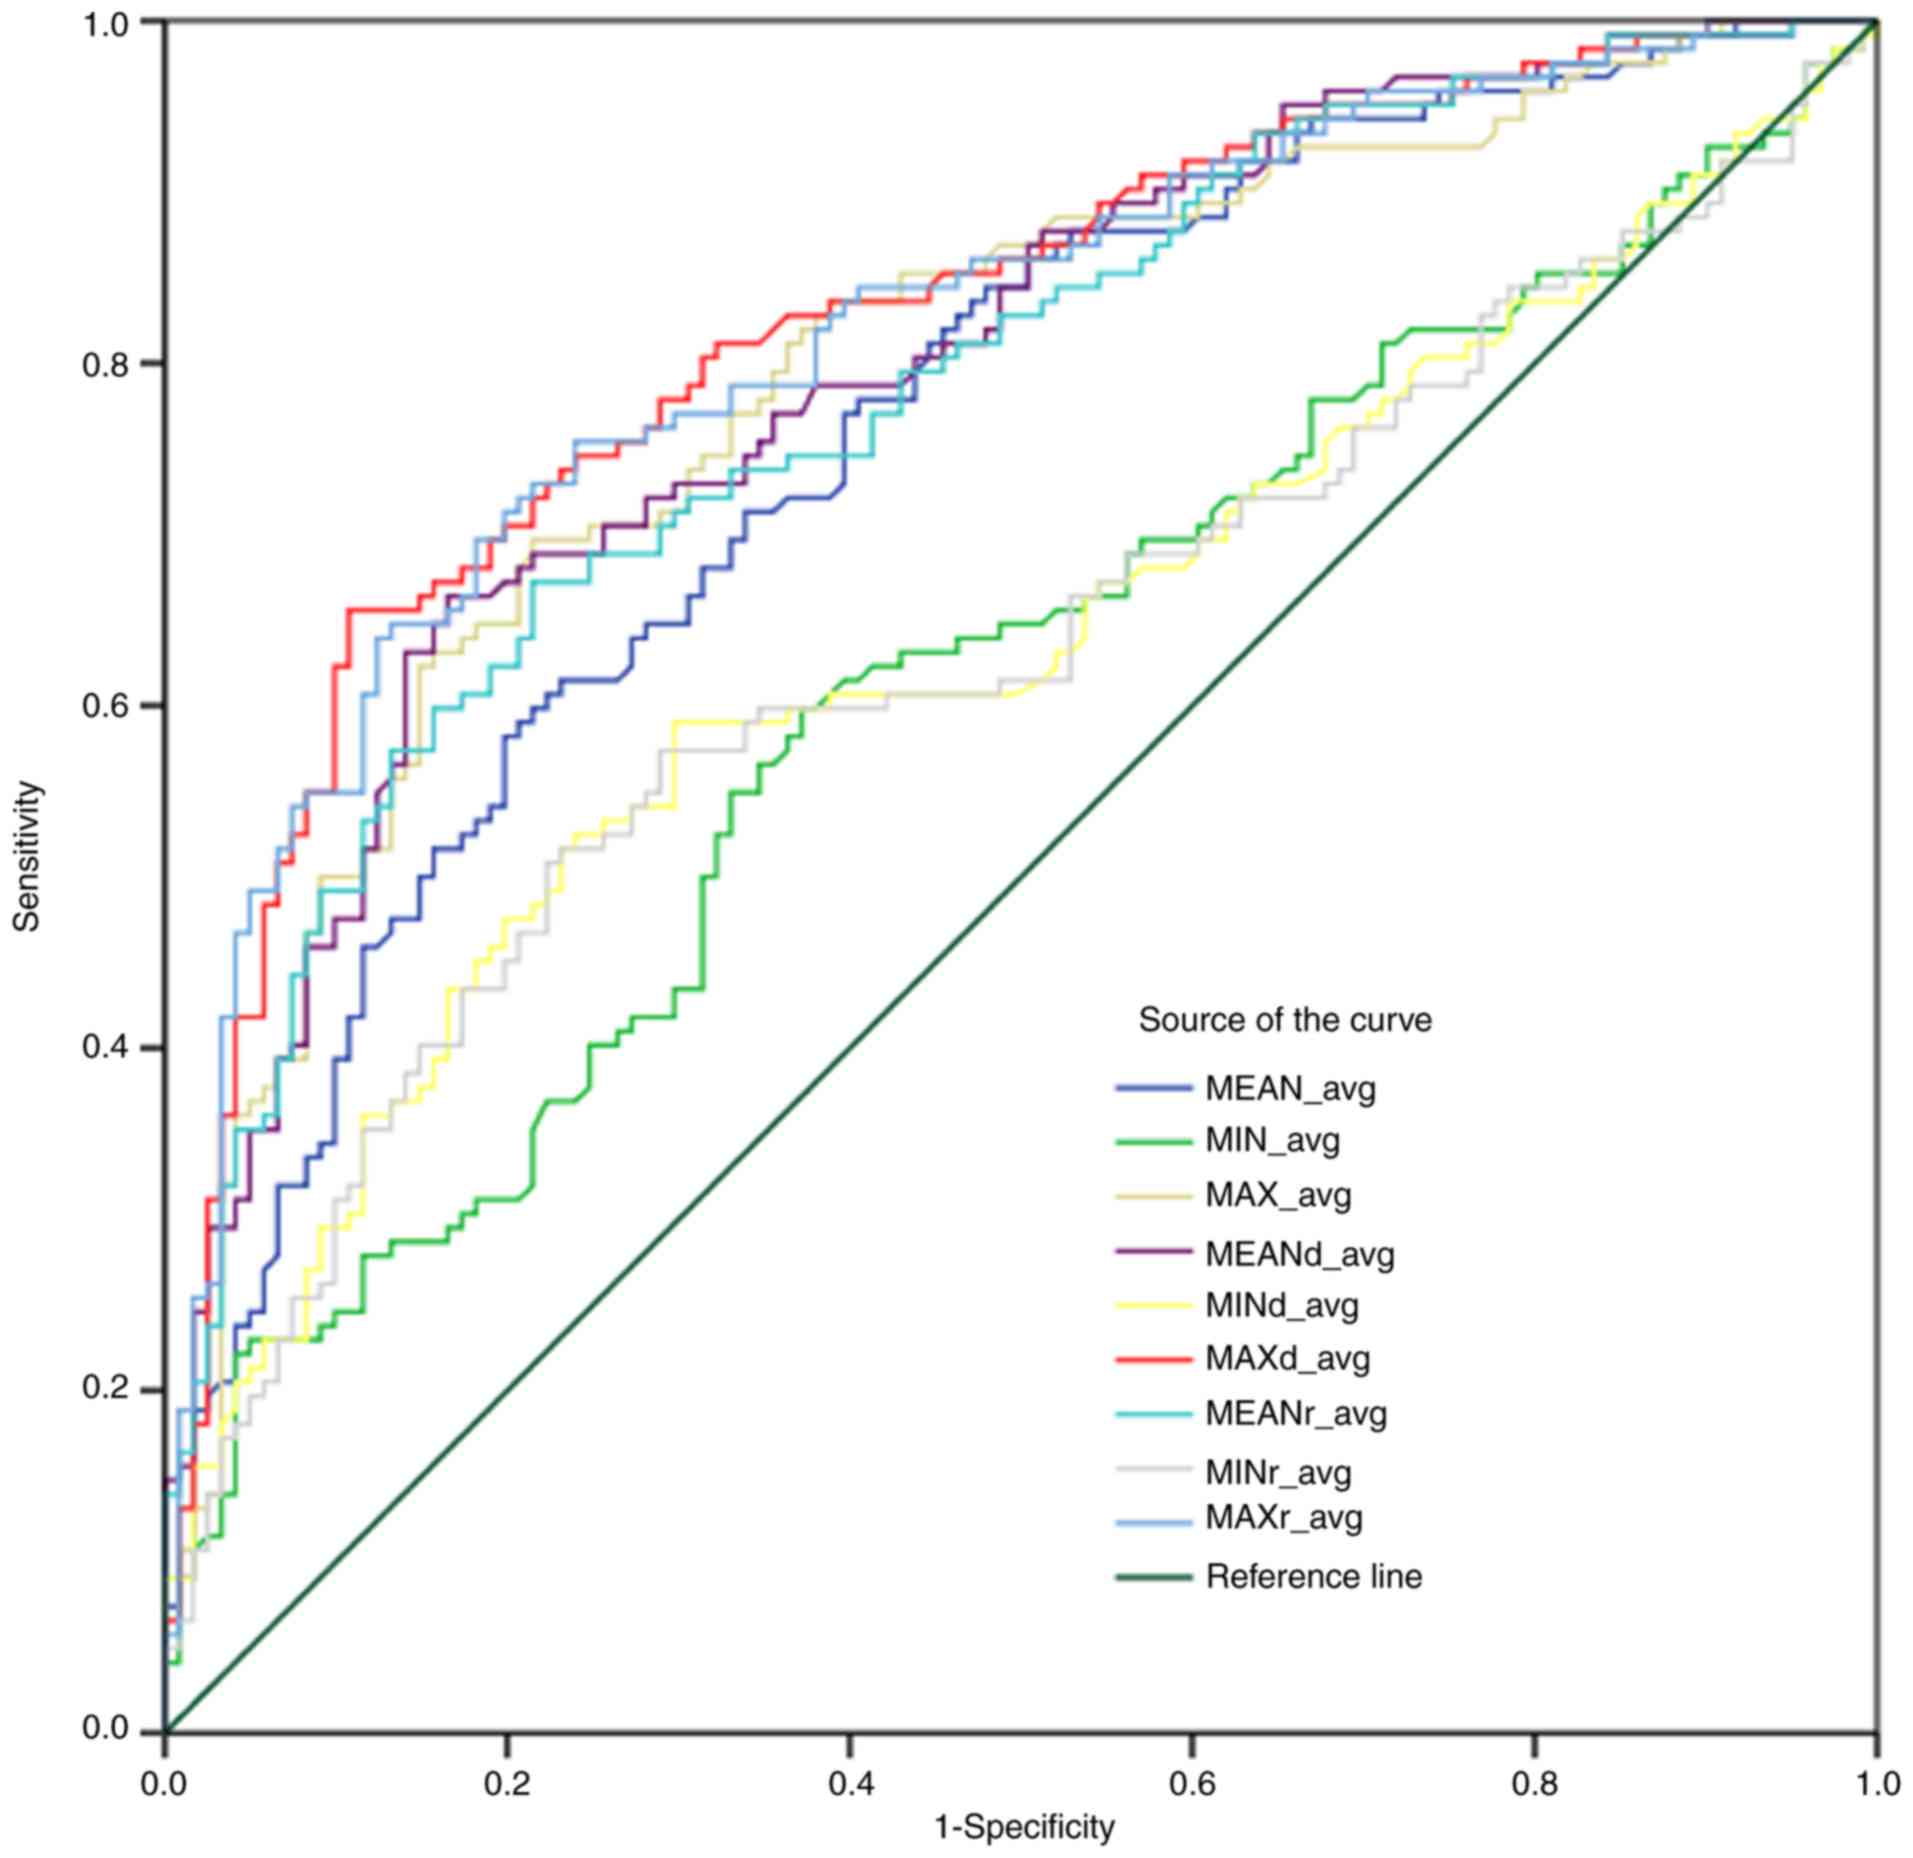
The ROC curves for parameters in the optimized
algorithm is shown in Fig. 2. This
suggested that the MAXd_avg had more sensitivity and specificity
compared with others in predicting malignant nodules with the
cut-off value of 32.95 kPa and the sensitivity, specificity,
accuracy, PPV and NPV were 65.57, 89.26, 77.37, 86.02 and 72.0,
respectively (Table IV).
| Table IV.Comparison of the diagnostic
performances of conventional SWE and optimized algorithm
parameters. |
Table IV.
Comparison of the diagnostic
performances of conventional SWE and optimized algorithm
parameters.
| Parameters | Cut-off value | Sensitivity
(%) | Specificity
(%) | Accuracy (%) | PPV (%) | NPV (%) | AUC (95% CI) |
|---|
|
MEAN_avga | 38.85 kPa | 58.20 | 80.17 | 69.14 | 74.74 | 65.54 | 0.76
(0.70–0.82) |
|
MIN_avgb | 18.11 kPa | 59.84 | 62.81 | 61.32 | 61.86 | 60.80 | 0.61
(0.54–0.68) |
|
MAX_avgc | 61.55 kPa | 69.67 | 78.51 | 74.07 | 76.58 | 71.97 | 0.79
(0.74–0.85) |
|
MEANd_avgd | 14.30 kPa | 66.39 | 83.47 | 74.90 | 81.20 | 71.13 | 0.80
(0.74–0.85) |
|
MINd_avge | 1.93 kPa | 59.02 | 70.25 | 64.61 | 66.67 | 62.96 | 0.63
(0.56–0.70) |
|
MAXd_avgf | 32.95 kPa | 65.57 | 89.26 | 77.37 | 86.02 | 72.0 | 0.82
(0.77–0.87) |
|
MEANr_avgg | 1.61 | 67.21 | 78.51 | 72.84 | 75.93 | 70.37 | 0.78
(0.73–0.84) |
|
MINr_avgh | 1.22 | 50.82 | 77.69 | 64.20 | 69.66 | 61.04 | 0.63
(0.56–0.70) |
|
MAXr_avgi | 2.15 | 63.93 | 87.60 | 75.72 | 83.87 | 70.67 | 0.82
(0.76–0.87) |
Discussion
Previous studies have demonstrated that the size,
location and presence of calcification of thyroid nodules have a
certain impact on their elasticity modulus (16). Another research study also indicated
that partially cystic nodules had higher elasticity modules than
solid ones in both shear wave elastography (SWE) and strain
elastography although the cause remains unknown (16,17). In
addition, it was reported by Cengic et al (18) that the success rate of fine-needle
aspiration (FNA) was lower and total biopsy time of FNA was longer
in predominantly cystic nodules than that in predominantly solid
ones. Furthermore, Gu et al (19) and Chan et al (20) reported that the risk of being
malignant in solid or predominantly solid thyroid nodules was
higher than that in the cystic or predominantly cystic nodules.
Thus, the cases studied in the present report were all solid
thyroid nodules and the main focus was the difficulty in
differentiating between benign and malignant thyroid nodules.
Bhatia et al (17) and Szczepanek-Parulska et al
(16) reported that the size of a
nodule has a positive correlation with its elasticity modulus. In
addition, researchers analyzed 382 nodules with size ≥4 cm and
found that the incidence of a clinically significant thyroid
carcinoma nodule was 22%. Using these findings, they recommended
that all nodules with a size ≥4 cm should be considered for either
thyroid lobectomy or total thyroidectomy (21). Thus, an overlarge nodule appears to
be an independent risk factor of thyroid carcinoma which is of
little clinical significance for SWE examination and should be
treated with more aggressive treatments. All nodules studied in our
study were smaller than 30 mm.
Prior reports on SWE for breast, liver and other
organs disclosed that when the lesion is too deep, the accuracy of
measurement decreases and the false-positive rate of elastography
increases (22–25). Therefore, the depth of nodule was
less than 25 mm.
Almost every report published on this subject was
unanimous on the verdict that calcification has a significant
effect on elasticity. The elasticity modulus of a nodule can
increase remarkably if both microcalcification and
macrocalcification are present. Consequently, some researchers
(16) considered that thyroid
nodules with macrocalcification would not be appropriate for SWE
examination (26). Thus, in our
study the nodules with macrocalcification (size >2 mm) were
excluded.
The conventional SWE parameters presents a great
reliability in measurements of thyroid nodules and the optimized
algorithm used in our study showed a similar performance.
Intraclass correlation coefficients of EId and EIr of the first
operator were almost perfect for all benign and malignant nodules
(ICC>0.75 for each). ICCs between two operators for MEANd_avg,
MEANr_avg, MAXd_avg and MAXr_avg were almost perfect (ICC>0.8
for each). This can be explained by the following facts: First,
with the first sampling volume (the first Q-Box™) covering the
entire target nodule in optimized algorithm, there could be no
error on the choices of maximum elasticity region by different
operators. Veyrieres et al (11) examined 297 thyroid nodules (35 of
which were malignant nodules) using shear-wave elastography on the
AIXPLORER system and found that the sensitivity of diagnosing
malignant nodules was 80% and the specificity was 90.5% with the
optimal cut-off value (65 kPa) on the most stiffness region of the
nodule. Kim et al (13)
analyzed 99 nodules with the same cut-off value (65 kPa) using the
same method for sampling, but its sensitivity and specificity of
diagnosis was much lower (76.1 and 64.1%). Although Bhatia et
al (27) and Liu et al
(28) used the same sampling method
(2 mm size of Q-Box™) with a similar cut-off value (42.1 and 39.3
kPa) to predict malignancy, they discovered that their diagnostic
performances were not quite consistent. This was due to the
different proportions of pathologic results and their sampling
volume (Q-Box™) that only covered the hardest region of the nodule.
Secondly, in the present report, we report that each time we
operated SWE, the compression on the transducer would significantly
affect the measurement results (Fig.
1). Lam et al (14)
pointed out that when the precompression increased by 22–30%, the
elasticity modulus of thyroid parenchyma, benign hyperplastic
nodule (BHN) and papillary thyroid carcinoma (PTC) would increase
simultaneously but differently (10.8, 24.6 and 75.4 kPa). In
addition, no matter how much precompression was exerted, there was
a significant difference between the difference value of PTC vs.
parenchyma and BNH vs. parenchyma, which was consistent with our
results. We concluded that the optimized algorithm used in our
study was able to avoid the influence of compression and had a high
rate of reproducibility. Moreover, the MAXd variables in the
optimization algorithm had a specificity of 89.26%, which could
exclude nodules that did not need fine-needle aspiration (FNA),
thus avoiding invasive examination and waste of medical
resources.
Shear-wave elastography (SWE) has been proven to be
useful in differential diagnosis of thyroid nodules. In most
previous studies, the diagnostic performance of the mean elasticity
of the nodule (Emean) was slightly higher than that of the minimum
elasticity (Emin) and maximum elasticity (Emax). Duan et al
(29) reported that AUC of Emean
(0.789) was greater than that of Emin (0.703) and Emax (0.701).
However, the results of our study demonstrated that neither the AUC
value of Emean of the nodule (MEAN_avg) nor the AUC value of
MEANd_avg and MEANr_avg (0.76, 0.80 and 0.78) was higher than that
of MAX_avg, MAXd_avg and MAXr_avg (0.79, 0.82 and 0.82) (Table IV), which was different from
previous studies. This difference may be due to the following
reasons. First, in previous studies, the sampling volume, the size
of which was fixed at 2 mm, was placed in the most stiffest part of
the target nodule and the mean elasticity modulus was close to the
highest modulus of the entire nodule which was similar as the max
elasticity modulus of the entire nodule measured by the method of
our study. The difference in the MEAN or MEANavg in our study was
influenced by the homogeneity of the nodule. Secondly, the
diagnostic performance was also affected by the composition of the
cases, such as pathology results, size, depth and other factors
which would affect specificity, accuracy and PPV of MAXd_avg
(cut-off value = 32.95 kPa) in the optimized algorithm was higher
than either the conventional SWE indices or other indices in the
optimized algorithm.
We acknowledge that the present study had several
limitations. First, the placement of sampling volume for thyroid
parenchyma was certainly influenced by the subjective factors.
Secondly, the influence of chronic thyroiditis on elasticity
(30–32) is still considered a controversial
issue. However, there were no separate analyses on cases with
subacute thyroiditis or Hashimoto thyroiditis which were included
in this study. Thirdly, previous research (10) has confirmed that the elasticity
modulus varies from different pathologic subtypes. However, all the
malignant nodules in this study were PTC. Due to the insufficient
data on specific pathological subtypes, they were not compared with
variables in the optimization algorithm, which deserves further
attention. In addition, it can be seen from previous studies that
the size, depth and location of nodules are the significant
influencing factors that have not been grouped and studied in our
research.
In conclusion, the optimized algorithm of SWE
elastography showed good reproducibility and better performance in
diagnosing solid thyroid nodules than conventional SWE and the best
elasticity indices in optimized algorithm was MAXd, the difference
value of elasticity modulus between the nodule and surrounding
thyroid parenchyma. However, the size, depth, location and
calcification of the nodule had an important impact on SWE
performance. Therefore, the conditions in which the optimized
algorithm will work better requires further study.
Acknowledgements
Not applicable.
Funding
No funding was received.
Availability of data and materials
The datasets used and/or analyzed during the current
study are available from the corresponding author on reasonable
request.
Authors' contributions
HW designed the study and drafted the manuscript. YL
and WD were responsible for the collection and analysis of the
experimental data. QC and JC performed the conventional US
examinations and revised the manuscript critically for important
intellectual content. All authors read and approved the final
manuscript.
Ethics approval and consent to
participate
The study was approved by the Ethics Committee of
Sichuan Academy of Medical Sciences and Sichuan Provincial People's
Hospital, China. Patients who participated in this research, signed
the informed consent and had complete clinical data.
Patient consent for publication
Not applicable.
Competing interests
The authors declare that they have no competing
interests.
Glossary
Abbreviations
Abbreviations:
|
USE
|
ultrasound elastography
|
|
SWE
|
shear wave elastography
|
|
FNA
|
fine-needle aspiration
|
|
ICC
|
intraclass correlation
coefficients
|
|
PTC
|
papillary thyroid carcinoma
|
|
BHN
|
benign hyperplastic nodule
|
|
ROC curve
|
receiver-operating characteristic
curve
|
|
AUC
|
areas under the ROC curve
|
|
kPa
|
kilopascal
|
|
EI & EInorm
|
elasticity indices (of the nodule and
thyroid parenchyma)
|
|
EId & EIr
|
EI-EInorm & EI/EInorm difference
value and ratio value of elasticity indices between nodule and
surrounding thyroid parenchyma
|
|
EIavg & EInorm_avg
|
average value of three measurements
for EI & EInorm
|
|
EId_avg & EIr_avg
|
average value of three measurements
for EId & EIr
|
References
|
1
|
Stanicić J, Prpić M, Jukić T, Borić M and
Kusić Z: Thyroid nodularity-true epidemic or improved diagnostics.
Acta Clin Croat. 48:413–418. 2009.PubMed/NCBI
|
|
2
|
American Thyroid Association (ATA)
Guidelines Taskforce on Thyroid Nodules and Differentiated Thyroid
Cancer, ; Cooper DS, Doherty GM, Haugen BR, Kloos RT, Lee SL,
Mandel SJ, Mazzaferri EL, McIver B, Pacini F, et al: Revised
American Thyroid Association management guidelines for patients
with thyroid nodules and differentiated thyroid cancer. Thyroid.
19:1167–1214. 2009. View Article : Google Scholar : PubMed/NCBI
|
|
3
|
Guth S, Theune U, Aberle J, Galach A and
Bamberger CM: Very high prevalence of thyroid nodules detected by
high frequency (13 MHz) ultrasound examination. Eur J Clin Invest.
39:699–706. 2009. View Article : Google Scholar : PubMed/NCBI
|
|
4
|
Baker JA, Kornguth PJ, Soo MS, Walsh R and
Mengoni P: Sonography of solid breast lesions: Observer variability
of lesion description and assessment. AJR Am J Roentgenol.
172:1621–1625. 1999. View Article : Google Scholar : PubMed/NCBI
|
|
5
|
Lyshchik A, Higashi T, Asato R, Tanaka S,
Ito J, Mai JJ, Pellot-Barakat C, Insana MF, Brill AB, Saga T, et
al: Thyroid gland tumor diagnosis at US elastography. Radiology.
237:202–211. 2005. View Article : Google Scholar : PubMed/NCBI
|
|
6
|
Itoh A, Ueno E, Tohno E, Kamma H,
Takahashi H, Shiina T, Yamakawa M and Matsumura T: Breast disease:
Clinical application of US elastography for diagnosis. Radiology.
239:341–350. 2006. View Article : Google Scholar : PubMed/NCBI
|
|
7
|
Chang JM, Moon WK, Cho N and Kim SJ:
Breast mass evaluation: Factors influencing the quality of US
elastography. Radiology. 259:59–64. 2011. View Article : Google Scholar : PubMed/NCBI
|
|
8
|
Bercoff J, Tanter M and Fink M: Supersonic
shear imaging: A new technique for soft tissue elasticity mapping.
IEEE Trans Ultrason Ferroelectr Freq Control. 51:396–409. 2004.
View Article : Google Scholar : PubMed/NCBI
|
|
9
|
Tanter M, Bercoff J, Athanasiou A,
Deffieux T, Gennisson JL, Montaldo G, Muller M, Tardivon A and Fink
M: Quantitative assessment of breast lesion viscoelasticity:
Initial clinical results using supersonic shear imaging. Ultrasound
Med Biol. 34:1373–1386. 2008. View Article : Google Scholar : PubMed/NCBI
|
|
10
|
Sebag F, Vaillant-Lombard J, Berbis J,
Griset V, Henry JF, Petit P and Oliver C: Shear wave elastography:
A new ultrasound imaging mode for the differential diagnosis of
benign and malignant thyroid nodules. J Clin Endocrinol Metab.
95:5281–5288. 2010. View Article : Google Scholar : PubMed/NCBI
|
|
11
|
Veyrieres JB, Albarel F, Lombard JV,
Berbis J, Sebag F, Oliver C and Petit P: A threshold value in shear
wave elastography to rule out malignant thyroid nodules: A reality?
Eur J Radiol. 81:3965–3972. 2012. View Article : Google Scholar : PubMed/NCBI
|
|
12
|
Lin P, Chen M, Liu B, Wang S and Li X:
Diagnostic performance of shear wave elastography in the
identification of malignant thyroid nodules: A meta-analysis. Eur
Radiol. 24:2729–2738. 2014. View Article : Google Scholar : PubMed/NCBI
|
|
13
|
Kim H, Kim JA, Son EJ and Youk JH:
Quantitative assessment of shear-wave ultrasound elastography in
thyroid nodules: Diagnostic performance for predicting malignancy.
Eur Radiol. 23:2532–2537. 2013. View Article : Google Scholar : PubMed/NCBI
|
|
14
|
Lam AC, Pang SW, Ahuja AT and Bhatia KS:
The influence of precompression on elasticity of thyroid nodules
estimated by ultrasound shear wave elastography. Eur Radiol.
26:2845–2852. 2016. View Article : Google Scholar : PubMed/NCBI
|
|
15
|
Pan XP and Ni ZZ: Application of
intraclass correlation coefficient to reliability assessment. Hua
Xi Yi Ke Da Xue Xue Bao. 30:62–63. 1999.(In Chinese). PubMed/NCBI
|
|
16
|
Szczepanek-Parulska E, Woliński K,
Stangierski A, Gurgul E and Ruchała M: Biochemical and
ultrasonographic parameters influencing thyroid nodules elasticity.
Endocrine. 47:519–527. 2014. View Article : Google Scholar : PubMed/NCBI
|
|
17
|
Bhatia KS, Rasalkar DP, Lee YP, Wong KT,
King AD, Yuen HY and Ahuja AT: Cystic change in thyroid nodules: A
confounding factor for real-time qualitative thyroid ultrasound
elastography. Clin Radiol. 66:799–807. 2011. View Article : Google Scholar : PubMed/NCBI
|
|
18
|
Cengic I, Tureli D, Altas H, Ozden F,
Bugdayci O and Aribal E: Effects of nodule characteristics on
sampling number and duration of thyroid fine-needle aspiration
biopsy: Size does not matter, but cystic degeneration ratio does.
Acta Radiol. 58:286–291. 2016. View Article : Google Scholar : PubMed/NCBI
|
|
19
|
Gu WJ, Zhao L, Zhu XX, Tang Z, Luo Y, Wang
F, Yang G, Jin Z and Du J: Retrospective analysis of sonographic
features in 2453 thyroid nodules. Chin J Endocrinol Metab.
29:548–552. 2013.
|
|
20
|
Chan BK, Desser TS, Mc Dougall IR, Weigel
RJ and Jeffrey RB Jr: Common and uncommon sonographic features of
papillary thyroid carcinoma. J Ultrasound Med. 22:1083–1090. 2013.
View Article : Google Scholar
|
|
21
|
Wharry LI, McCoy KL, Stang MT, Armstrong
MJ, LeBeau SO, Tublin ME, Sholosh B, Silbermann A, Ohori NP,
Nikiforov YE, et al: Thyroid nodules (≥4 cm): Can ultrasound and
cytology reliably exclude cancer? World J Surg. 38:614–621. 2014.
View Article : Google Scholar : PubMed/NCBI
|
|
22
|
Yamanaka N, Kaminuma C, Taketomi-Takahashi
A and Tsushima Y: Reliable measurement by virtual touch tissue
quantification with acoustic radiation force impulse imaging
phantom study. J Ultrasound Med. 31:1239–1244. 2012. View Article : Google Scholar : PubMed/NCBI
|
|
23
|
Potthoff A, Attia D, Pischke S, Kirschner
J, Mederacke I, Wedemeyer H, Manns MP, Gebel MJ and Rifai K:
Influence of different frequencies and insertion depths on the
diagnostic accuracy of liver elastography by acoustic radiation
force impulse imaging (ARFI). Eur J Radiol. 82:1207–1212. 2013.
View Article : Google Scholar : PubMed/NCBI
|
|
24
|
Wang CZ, Zheng J, Huang ZP, Xiao Y, Song
D, Zeng J, Zheng HR and Zheng RQ: Influence of measurement depth on
the stiffness assessment of healthy liver with real-time shear wave
elastography. Ultrasound Med Biol. 40:461–469. 2014. View Article : Google Scholar : PubMed/NCBI
|
|
25
|
Yoon JH, Jung HK, Lee JT and Ko KH:
Shear-wave elastography in the diagnosis of solid breast masses:
What leads to false-negative or false-positive results? Eur Radiol.
23:2432–2440. 2013. View Article : Google Scholar : PubMed/NCBI
|
|
26
|
Barr RG, Memo R and Schaub CR: Shear wave
ultrasound elastography of the prostate: Initial results.
Ultrasound Q. 28:13–20. 2012. View Article : Google Scholar : PubMed/NCBI
|
|
27
|
Bhatia KSS, Lee YYP, Yuen EHY and Ahuja
AT: Ultrasound elastography in the head and neck. Part II. Accuracy
for malignancy. Cancer Imaging. 13:260–276. 2013. View Article : Google Scholar : PubMed/NCBI
|
|
28
|
Liu B, Liang J, Zheng Y, Xie X, Huang G,
Zhou L, Wang W and Lu M: Two-dimensional shear wave elastography as
promising diagnostic tool for predicting malignant thyroid nodules:
A prospective single-centre experience. Eur Radiol. 25:624–634.
2015. View Article : Google Scholar : PubMed/NCBI
|
|
29
|
Duan SB, Yu J, Li X, Han ZY, Zhai HY and
Liang P: Diagnostic value of two-dimensional shear wave
elastography in papillary thyroid microcarcinoma. Onco Targets
Ther. 9:1311–1317. 2016.PubMed/NCBI
|
|
30
|
Ruchala M, Szczepanek-Parulska E, Zybek A,
Moczko J, Czarnywojtek A, Kaminski G and Sowinski J: The role of
sonoelastography in acute, subacute and chronic thyroiditis: A
novel application of the method. Eur J Endocrinol. 166:425–432.
2012. View Article : Google Scholar : PubMed/NCBI
|
|
31
|
Magri F, Chytiris S, Capelli V, Alessi S,
Nalon E, Rotondi M, Cassibba S, Calliada F and Chiovato L: Shear
wave elastography in the diagnosis of thyroid nodules: Feasibility
in the case of coexistent chronic autoimmune Hashimoto's
thyroiditis. Clin Endocrinol (Oxf). 76:137–141. 2012. View Article : Google Scholar : PubMed/NCBI
|
|
32
|
Hong YR, Wu YL, Luo ZY, Wu NB and Liu XM:
Impact of nodular size on the predictive values of gray-scale,
color-Doppler ultrasound, and sonoelastography for assessment of
thyroid nodules. J Zhejiang Univ Sci B. 13:707–716. 2012.
View Article : Google Scholar : PubMed/NCBI
|