Introduction
Philadelphia chromosome-positive acute lymphoblastic leukemia (Ph+ ALL) is an aggressive leukemia accounting for 20–30% of ALL in adults and up to 50% of ALL in patients >50 years of age (1,2). Before 2001, the advent of tyrosine kinase inhibitors (TKIs), the prognosis of Ph+ ALL was poor, with a median disease-free survival and overall survival time of 6 and 9 months, respectively, and allogeneic hematopoietic stem cell transplantation (HSCT) is the only cure for Ph+ LL (3,4). The treatment and outcome of Ph+ ALL has markedly improved due to the introduction of TKIs, which induce higher remission rates, enable increased eligibility for curative HSCT (5–9) and enable much improved survival rates in elderly patients (10). At present, TKIs combined with chemotherapy are the standard first-line induction therapy for newly diagnosed Ph+ ALL. The TKIs approved for first-line therapy for Ph+ leukemia include imatinib (6–9) and dasatinib (11,12). The induction regimens containing chemotherapy plus a TKI, such as either imatinib (5–9) or dasatinib (11,12), lead to a >90% complete response rate in newly diagnosed patients with Ph+ ALL and improved disease-free survival and overall survival, including in elderly patients (10). Compared with imatinib, dasatinib induces a more sustained minimal residual disease, but it is also aggravated by more toxicity, such as pleural and cardiac effusion, pulmonary hypertension, hemorrhage and severe infection (13–16). These toxic effects and side effects may lead to the interruption of treatment, thus affecting the disease control effect. It is worth noting that the T315I mutation in ABL kinase has been detected in >70% of relapsed patients treated with dasatinib as a first-line treatment, which brings great challenges for later treatment (17,18). If combining another therapeutic agent with imatinib can enhance the efficacy of imatinib without increasing its side effects, such a strategy will benefit more patients.
P53 is involved in the anti-proliferative effect of imatinib, and the P53 level determines the sensitivity of BCR-ABL-expressing cells to imatinib (19). In Ph+ ALL cells, TKI treatment leads to the inactivation of the P53 signaling pathway via BCL6 upregulation, which enables leukemia cells to survive TKI treatment (20). The combination of TKIs with the P53 reactivation agent Nutlin-3a exhibited a marked effect in reducing the cell viability of a Ph+ cell line compared with that of cells treated with the TKI treatment alone (21). Tanshinone IIA (1,6,6-trimethyl-6,7,8,9-tetrahydrophenanthro[1,2-b]furan-10,11-dione), one of the phytochemical compounds isolated from the Chinese medicinal herb Red Sage (Salvia miltiorrhiza), has a molecular formula of C19H18O3 and a molecular mass of 294.344420 g/mol (www.organchem.csdb.cn). Tanshinone IIA has diverse biological properties, including antioxidative, antiangiogenic and anti-inflammatory activities (22,23). Tanshinone IIA has been demonstrated to have anticancer activities in various types of cancer, including leukemia (24–29), and can activate P53 (30). Notably, tanshinone IIA is a cardioprotective agent (30–33). Therefore, it was hypothesized that tanshinone IIA enhances the anti-leukemia effect of imatinib in Ph+ ALL by activating P53. In this way, imatinib can achieve effects similar to those of dasatinib without increasing the toxic effects and side effects, especially the cardiovascular side effects. Our previous study revealed that MDM2 inhibitor nutlin-3 plus tanshinone IIA combined with imatinib quickly and effectively inhibits activation of the ALT-MDM2 signaling pathway mediated by imatinib and relieves the inhibition of the p53 signaling pathway, thereby enhancing the anti-leukemia effect of imatinib in Ph+ ALL cells (34). Different from nutlin3 inhibitors, which are still in the preclinical research stage (35), tanshinone IIA has been widely used in clinical practice and has good pharmacological safety (36). Therefore, compared with the three-drug combination of tanshinone IIA, nutlin3 inhibitor and imatinib, the two-drug combination of tanshinone IIA and imatinib in the treatment of Ph+ALL may enter the clinic faster.
In view of the p53-activating and cardioprotective effects of tanshinone IIA, the present study investigated the potential therapeutic effect of reactivating the p53 signaling pathway by combined treatment with tanshinone IIA and imatinib in Ph+ ALL.
Materials and methods
Antibodies and chemicals
Tanshinone IIA was purchased from Shanghai Shifeng Biological Technology Co., Ltd. (www.shifengbiol.com). The 20 mM stock solution of tanshinone IIA in DMSO was stored at −20°C. The tanshinone IIA (sulfotanshinone sodium injection; 20 mg/ml) used in the in vivo experiment was obtained from SPH NO. 1 Biochemical & Pharmaceutical Co., Ltd. (http://www.sbpc.com.cn). The antibodies against phosphorylated (p-)ABL (Tyr245), p-STAT5 (Tyr694), p-MEK1/2 (ser217/221), p-AKT (ser473), AKT, GAPDH, cleaved-PARP, ABL, STAT5, MEK1/2 and BCL2 were obtained from Cell Signaling Technology, Inc. The antibodies against P53, MDM2 proto-oncogene (MDM2) and p-MDM2 (ser166) were purchased from Santa Cruz Biotechnology, Inc. The antibody against BAX was purchased from Affymetrix eBioscience. The antibody against p21 was purchased from Medical & Biological Laboratories Co., Ltd. The antibody against MCL1 apoptosis regulator, BCL2 family member (MCL1) was purchased from OriGene Technologies, Inc. The monoclonal antibody against human CD19 was purchased from Gene Tech Biotechnology Co., Ltd. MTT was obtained from Sigma-Aldrich; Merck KGaA. The Annexin V-FITC apoptosis detection kit was obtained from Nanjing KeyGen Biotech Co., Ltd. Iscove's Modified Dulbecco's Medium (IMDM), penicillin/streptomycin and FBS were obtained from Hyclone; Cytiva.
Cell lines and mice
The SUP-B15 cell line (American Type Culture Collection) is a human Ph+ ALL cell line expressing P190-BCR/ABL with wild-type p53. The SUP-B15/RI (imatinib-resistant SUP-B15) cell line was generated from parental SUP-B15 cells by gradually increasing the concentration of imatinib in the culture medium from 0.1 to 10 mM within half a year. Gene sequence analysis demonstrated that there was no p53 mutation in the SUP-B15/RI cell line. At 2 weeks after the withdrawal of imatinib, the SUP-B15/RI cells were used in experiments. The SUP-B15 and SUP-B15/RI cells were cultured in IMDM supplemented with 10% FBS, 1% penicillin-streptomycin and 2 mM L-glutamine and incubated at 37°C with 5% CO2.
All female NOD/SCID mice aged 5–6 weeks used in the present study were purchased from Beijing Vital River Laboratory Animal Technology Co., Ltd. The mice were bred in a pathogen-free environment at the Experimental Animal Center of West China Hospital, Sichuan University (Chengdu, China). All animal procedures were approved by the Institutional Animal Care and Use Committee of the Sichuan University West China Hospital (Chengdu, China).
Normal human peripheral blood mononuclear cells (PBMCs) were obtained from the blood of three healthy donors. The three adult donors were all from Chengdu, China, including two men and one woman. The blood samples were collected on June 6, 2018. The inclusion criteria for specimen collection was a normal complete blood count. The collection and use of human specimens was approved by the Biomedical Ethics Committee of West China Hospital (Chengdu, China) and written informed consent was provided. The mononuclear cells were isolated by density centrifugation (800 × g for 20 min at room temperature (Ficoll-Hypaque).
Cell viability assay
Cell viability was measured using the MTT assay. A total of 1×10⁴ cells were incubated for 72 h at 37°C in a 96-well plate with different drugs in a final volume of 100 µl. The control cells were treated with 0.1% DMSO. Thereafter, 20 µl MTT at a concentration of 5 mg/ml in PBS was added to each well, and the cells were incubated for 4 h at 37°C. Subsequently, 100 µl of an SDS-isobutanol-HCl solution was added, and the cells were incubated overnight at room temperature. After the incubation, the optical density (OD) was measured at a wavelength of 570 nm using a Quant MQX200 Microplate Spectrophotometer (BioTek Instruments, Inc.). A blank control without cells was included to determine the background absorbance. The cellular viability was calculated as the percentage of viable cells relative to the control using the following formula: OD (experimental samples)-OD (blank)/OD (control)-OD (blank) ×100%. All experiments were performed in triplicate.
Apoptosis analysis by flow cytometry
The cells were treated with different drugs for 48 h, and 1×10⁵ cells were harvested, washed with PBS and resuspended in 100 µl binding buffer. Then, 5 µl of Annexin V-FITC was added, and after 10 min of incubation, 5 µl PI was added. Subsequently, the cells were incubated for 15 min at room temperature in the dark. Finally, 400 µl binding buffer was added. The stained cells were analyzed using a Cytomics FC500 flow cytometer (Beckman Coulter, Inc.) equipped with the CXP software version 2.1 (Beckman Coulter, Inc.). A total of 10,000 events were recorded for each analysis.
Western blot analysis
Whole cell extracts were prepared in RIPA lysis buffer (20 mM Tris, pH 7.4; 250 mM NaCl; 2 mM EDTA, pH 8.0; 0.1% Triton-X100; 0.01 mg/ml aprotinin; 0.005 mg/ml leupeptin; 0.4 mM PMSF; 4 mM NaVO4), and extracts containing 40 µg/lane of protein were loaded onto a 6–15% sodium dodecyl sulfate-polyacrylamide gel. After electrophoresis, the proteins were electrotransferred to a nitrocellulose membrane. The membrane was incubated with primary antibody (1:1,000 vol/vol) overnight at 4°C, washed and incubated with HRP-conjugated secondary antibody (1:5,000 vol/vol) for 1 h at room temperature. Finally, the signals were detected using the ECL detection system and film (Bio-Rad Laboratories, Inc.) according to the manufacturer's protocols.
Reverse transcription-quantitative PCR (RT-qPCR) analysis
qPCR was performed on a CFX96TM Real-Time PCR system according to the manufacturer's protocol. The RNA of 2×10⁶ cells were prepared using RNAzol® RT (Molecular Research Center, Inc., http://mrcgene.lookchem.com). A total of 2 µg of RNA was converted into cDNA using the Thermo Scientific RevertAid First Strand cDNA Synthesis kit (Thermo Fisher Scientific, Inc.), according to the manufacturer's instructions. The expression of genes was assessed using the KAPA SYBR® FAST qPCR kit Master Mix (2×) Universal (Kapa Biosystems; Roche Diagnostics) with GAPDH as an internal control. The RT-qPCR reaction mixture contained 10 µl of 2× SYBR-Green qPCR Master Mix, 2 µl of cDNA, 0.5 µl of forward primer, 0.5 µl of reverse primer and 7 µl double distilled water, at a final volume of 20 µl. The reaction were performed at 94°C for 2 min, then 40 cycles of 94°C for 30 sec, 60°C for 30 sec and 72°C for 30 sec. The following primers were used: P53 forward, 5′-GTGCGTGTTTGTGCCTGTCCT−3′ and reverse, 5′-CAGTGCTCGCTTAGTGCTCCCT-3′; MDM2 forward 5′-GGCAGGGGAGAGTGATACAGA−3′ and reverse, 5′-GAAGCCAATTCTCACGAAGGG−3′; BAX forward 5′-CCTTTTGCTTCAGGGTTTCA-3′ and reverse, 5′-TCCATGTTACTGTCCAGTTCGT-3′; and P21 forward, 5′-TGTCCGTCAGAACCCATGC-3′ and reverse, 5′-AAAGTCGAAGTTCCATCGCTC−3′; GAPDH forward, 5′-AGGTCGGTGTGAACGGATTTG−3′ and reverse, 5′-GGGGTCGTTGATGGCAACA-3′. Relative expression levels were calculated using the 2−∆∆Cq method (37).
Immunofluorescence localization of the P53 protein
The localization of the P53 protein was evaluated using immunofluorescence. A total of 1×10⁵ cells were grown in 6-well plates and treated with the indicated drugs for 48 h at 37°C. After incubation, the cells were collected and washed twice with PBS, fixed with 4% paraformaldehyde for 15 min at room temperature, and permeabilized with 0.25% Triton X-100 diluted in PBS for 10 min. The cells were blocked with PBS with 0.1% Tween-20 (PBST) containing 1% bovine serum albumin (Abcam) for 30 min at room temperature and then incubated with mouse monoclonal anti-P53 antibody (Santa Cruz Biotechnology; cat. no. sc-126) (1:100 vol/vol diluted in PBST + 1% bovine serum albumin) overnight at 4°C. After washing, the cells were incubated with donkey anti-Mouse IgG (H+L) ReadyProbes™ Secondary Antibody, Alexa Fluor 594 (cat. no. R37115; Thermo Fisher Scientific, Inc.) (1:1,000 diluted in PBST + 1% bovine serum albumin; Thermo Fisher Scientific, Inc.) at room temperature for 1 h. After washing, the nuclei were counterstained with DAPI in glycerin jelly at room temperature for 5 min, after which the cells were dropped onto glass slides and cover slipped. The images were obtained using a fully automatic fluorescent microscope (Zeiss AxioImager Z2; Carl Zeiss AG) with the ZEN lite software version 2.3 (Carl Zeis AG).
In vivo study
Female NOD/SCID mice aged 5–6 weeks (20–25 g) were irradiated at a dose of 200 cGY on day 1 and then intravenously injected with 1×10⁷ SUP-B15 cells via the tail vein. After 7 days, the mice were injected intraperitoneally with 10 mg/kg/day imatinib (n=5), 30 mg/kg/day tanshinone IIA (sulfotanshinone sodium injection) (n=5) or both drugs (n=5) for a period of 14 days. At 1 week after the drug treatments were stopped, the mice were sacrificed by cervical dislocation, and bone marrow samples were obtained, and the RNA of bone marrow was prepared using RNAzol® RT (MRC). The reverse transcription was performed using the Thermo Scientific RevertAid First Strand cDNA Synthesis kit (Thermo Fisher Scientific, Inc.). The changes in BCR/ABL gene expression was analyzed using semi-quantitative RT-PCR with GAPDH as an internal control. The RT-PCR reaction mixture contained 10 µl Taq mixture, 3 µl of cDNA, 1 µl of sense and anti-sense primer and 5 µl RNA-free water in a final volume of 20 µl. The primer sequences for BCR/ABL were forward 5′-CCGGAGTTTTGAGGATTGCGGA-3′ and reverse 5′-TTGGAGTTCCAACGAGCGGC-3′. For GAPDH forward, 5′-AGGTCGGTGTGAACGGATTTG−3′ and reverse, 5′-GGGGTCGTTGATGGCAACA-3′. The reaction was performed at 94°C for 2 min, 94°C for 30 cycles of 30 sec each, 56°C for 30 sec, 72°C for 35 sec and a final extension at 72°C for 10 min. The PCR products (10 µl) were analyzed by electrophoresis on 2% agarose gel, photographed and quantified by densitometric scanning. The spleens were also collected and fixed in 10% formalin for 24 h and then buried in paraffin. Paraffin tissue was made into 5 µm thick slice, after xylene dewaxification, ethanol hydration, thermal antigen repair, the slice was blocked in PBS with 0.2% Triton X-100 containing 3% bovine serum albumin (Abcam) for 1 h at room temperature, then incubated with mouse monoclonal antibody against human CD19 (1:200 vol/vol) overnight at 4°C, washed and incubated with HRP-conjugated secondary antibody (1:500 vol/vol) for 1 h at room temperature. CD19-positive cells in the spleen were observed under using a light microscope (Olympus, BX53). During the whole experiment, the body weight, activity, diet and drinking water of mice were evaluated every day to roughly assess the adverse drug reactions.
Statistical analysis
All data are presented as the mean ± standard deviation of three independent experiments unless otherwise indicated. Statistical analysis was performed using one-way ANOVA with Bonferroni's corrected paired t-test for post hoc pairwise comparisons. All of the statistical analyses were performed using the IBM SPSS 24.0 software (IBM Corp.). P<0.05 was considered to indicate a statistically significant difference.
Results
Tanshinone IIA potentiates the cytotoxic and apoptosis-inducing effects of imatinib in Ph+ ALL cell lines
In the first step of the experiment, the present study examined the cytotoxic effects of imatinib alone or in combination with tanshinone IIA on SUP-B15 and SUP-B15/RI cells. The IC50 value of imatinib at 72 h in SUP-B15 cells was 1.34±0.24 µM, and when imatinib was combined with 1, 2 and 4 µM tanshinone IIA, its IC50 decreased to 0.67±0.14, 0.09±0.04 and 0.03±0.10, respectively. The IC50 value of imatinib at 72 h in the SUP-B15/RI cells was 23.76±5.44 µM, and when imatinib was combined with 2, 4 and 8 µM tanshinone IIA, it decreased to 18.51±3.72, 3.12±1.03 and 0.98±0.35 µM, respectively. As presented Fig. 1, in SUP-B15 and SUP-B15/RI cells, tanshinone IIA enhanced the imatinib-induced reduction in cell viability. Imatinib and tanshinone IIA alone or in combination had minimal cytotoxic effects on normal human PBMCs (Fig. S1). 1 µM AKT inhibitor MK-2206 (Beyotime Institute of Biotechnology) did not significantly weaken the cytotoxic effects of tanshinone IIA and imatinib (Fig. S2).
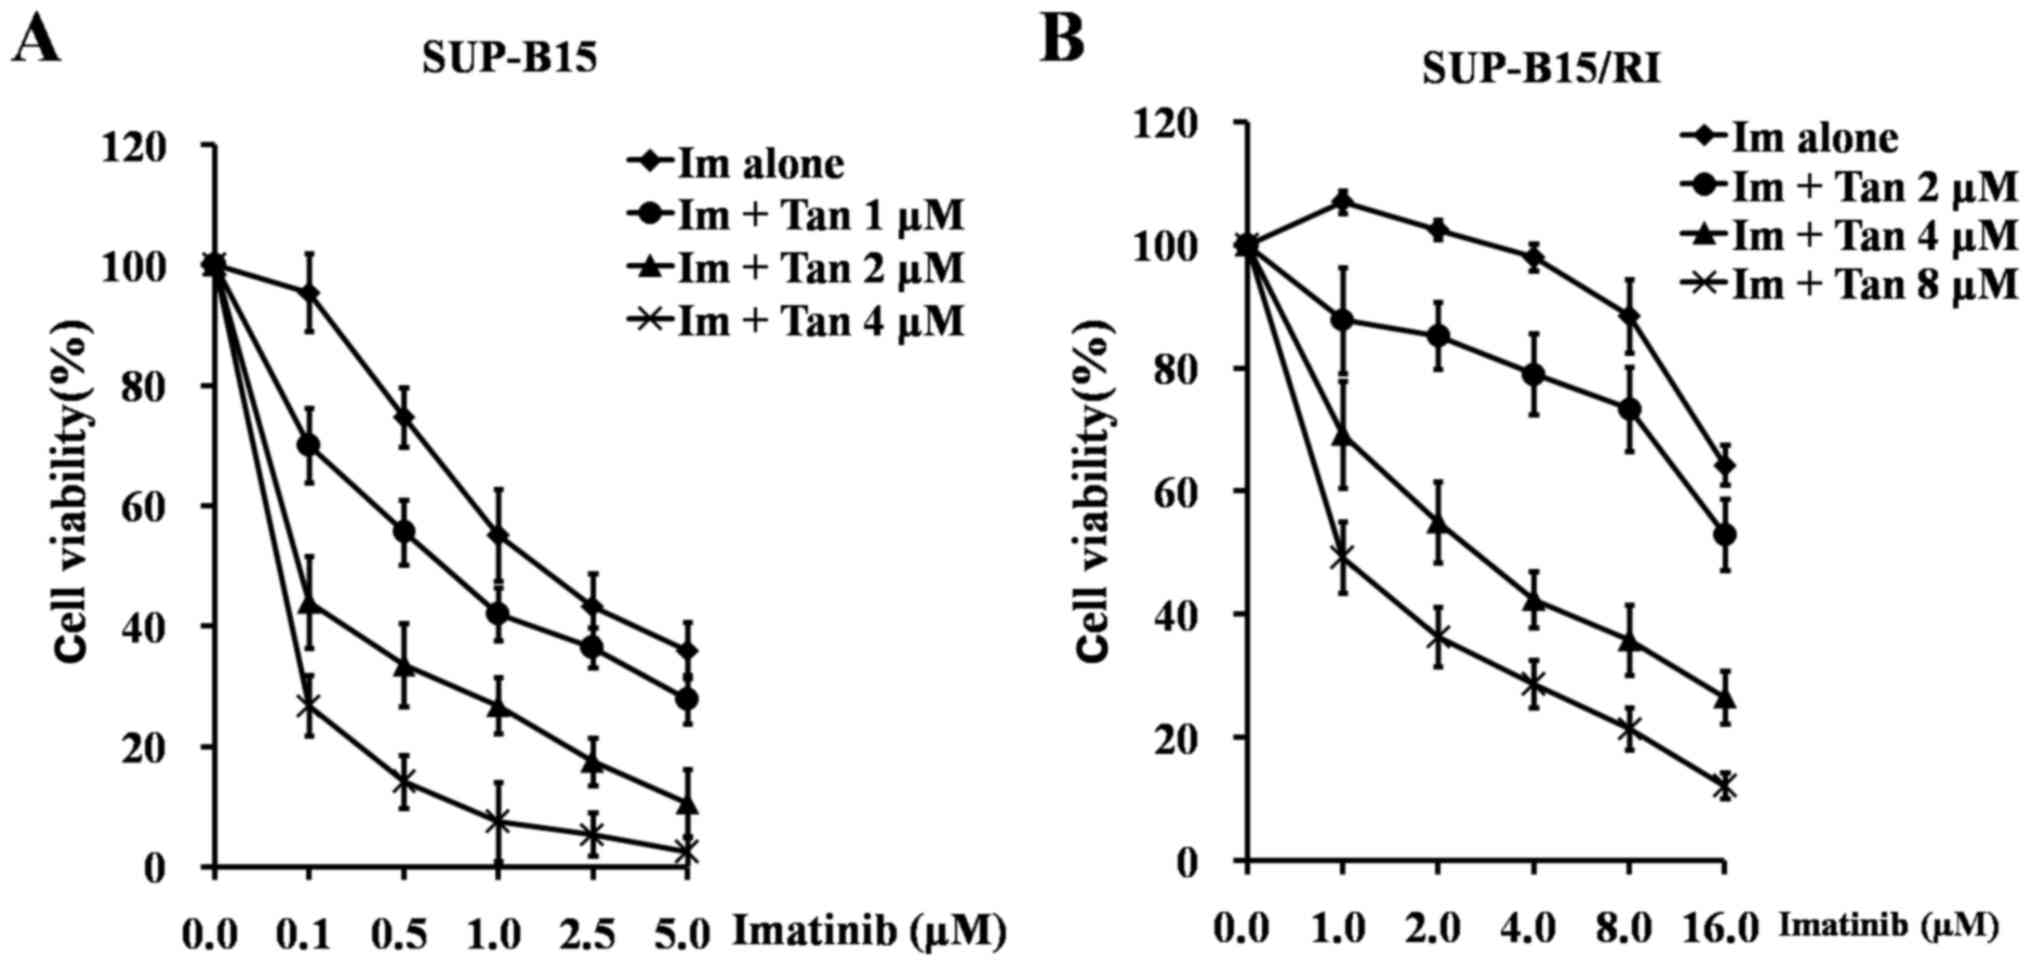 |
Figure 1.
Tan potentiates the cytotoxic effect of Im in Philadelphia chromosome-positive acute lymphoblastic leukemia cell lines. (A) SUP-B15 and (B) SUP-B15/RI cells were incubated with serial concentrations of Im alone (0.0, 0.1, 0.5, 1.0, 2.5 and 5 µM for SUP-B15 cells and 0.0, 1, 2, 4, 6, 8 and 16 µM for the SUP-B15/RI cells) or in combination with Tan (0.0, 1, 2 and 4 µM for SUP-B15 cells and 0.0, 2, 4 and 8 µM for SUP-B15/RI cells) for 72 h with 0.1% DMSO treatment as the control. At the end of the incubation, the cell viability was determined using the MTT assay. Im, imatinib; Tan, tanshinone IIA.
|
Subsequently, the present study examined the effect of imatinib alone or in combination with tanshinone IIA on apoptosis in SUP-B15 and SUP-B15/RI cells using flow cytometry. As shown in Fig. 2, in SUP-B15 cells, the percentage of apoptotic cells was 4.05±3.66% in the control group and this increased to 16.56±2.45 and 19.96±2.76% following treatment with 2 µM imatinib and 4 µM tanshinone IIA, respectively, for 48 h. After cotreatment with 2 µM imatinib and 4 µM tanshinone IIA for 48 h, the percentage of apoptotic cells increased to 45.04±5.74%, which was significantly higher than that of the cells receiving the single drug treatment. In SUP-B15/RI cells, 48 h of treatment with 10 µM imatinib had no apoptotic induction effect, with a percentage of apoptotic cells of 6.36±2.87% (5.37±1.20% in the control group). Treatment with 8 µM tanshinone IIA for 48 h still had a certain apoptosis induction effect, resulting in a percentage of apoptotic cells of 14.26±2.69%. However, when 10 µM imatinib was combined with 8 µM tanshinone IIA, the percentage of apoptotic cells increased to 35.56±4.01%, which was significantly higher than that of cells receiving either monotherapy.
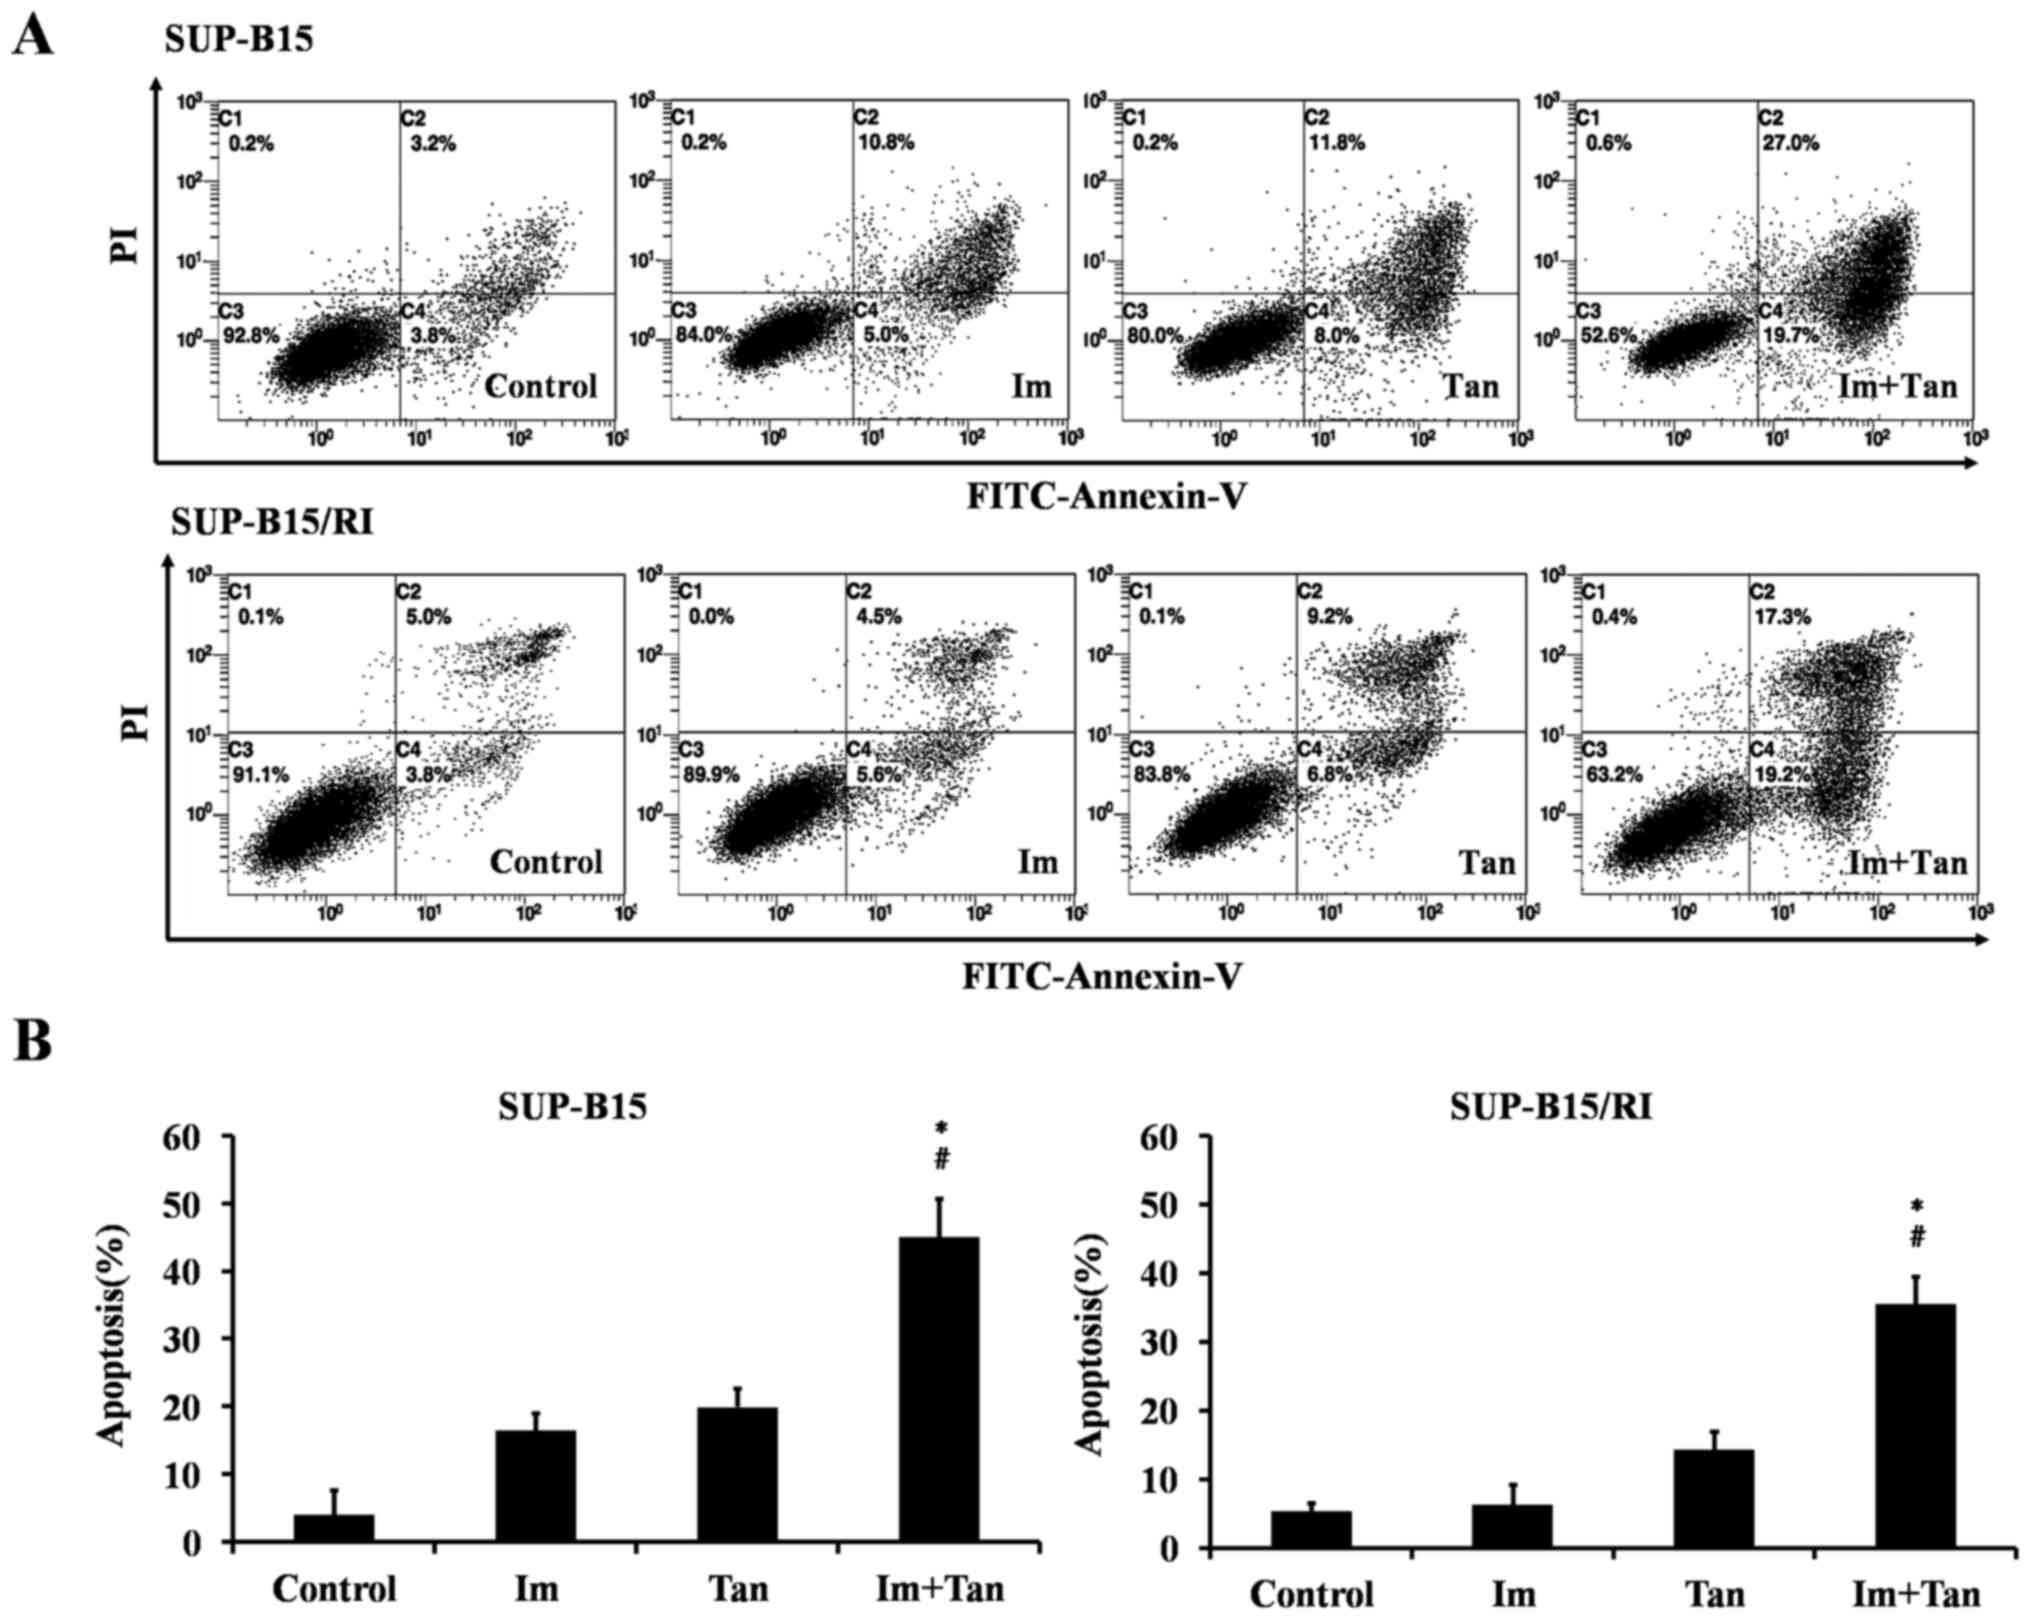 |
Figure 2.
Tan potentiates the apoptosis-inducing effect of Im in Philadelphia chromosome-positive acute lymphoblastic leukemia cell lines. (A) SUP-B15 cells were treated with 0.1% DMSO (control), 2 µM Im, 4 µM Tan or the combination of 2 µM Im and 4 µM Tan for 48 h. (B) SUP-B15/RI cells were treated with 0.1% DMSO (control), 10 µM Im, 8 µM Tan or the combination of 10 µM Im and 8 µM Tan for 48 h. At the end of the treatment, the cells were collected, and apoptosis was examined by flow cytometry using the Annexin V-FITC/PI apoptosis detection kit. The data are presented as the mean ± SD of three independent experiments. The significance of the differences was determined using one-way ANOVA and a Bonferroni post hoc test. *P<0.05 vs. Im; #P<0.05 vs. Tan. Im, imatinib; Tan, tanshinone IIA.
|
The aforementioned results indicated that tanshinone IIA enhanced the cytotoxic and apoptosis-inducing effects of imatinib in Ph+ ALL cell lines.
Tanshinone IIA combined with imatinib reactivates the P53 signaling pathway in Ph+ ALL cell lines
The inactivation of the P53 signaling pathway is involved in the sensitivity of Ph+ ALL cells to TKIs, including imatinib (19), while tanshinone IIA activates the P53 signaling pathway (30). Therefore, it was hypothesized that tanshinone IIA enhanced the efficacy of imatinib in Ph+ ALL cells by reactivating the p53 signaling pathway. The hypothesis was investigated by examining the effects of tanshinone IIA combined with imatinib on p53 and its main transcriptional targets BAX and p21 at the mRNA and protein levels. Furthermore, the major factor for the posttranslational regulation of p53 is MDM2, a specific E3 ubiquitin ligase responsible for p53 degradation (38). Therefore, the present study also examined the effect of tanshinone IIA combined with imatinib on MDM2. In addition, the activation of the P53 signaling pathway depends not only on the protein abundance of P53 but also on the localization of P53 in cells (39). Therefore, the present study also examined the effect of tanshinone IIA combined with imatinib on the localization of p53 in cells.
The present study first examined the effects of the drugs on the mRNA expression levels of p53, BAX, p21 and MDM2 using RT-qPCR analysis. As shown in Fig. 3A, in the SUP-B15 cells, imatinib alone upregulated MDM2 (1.39-fold vs. control at 48 h) and downregulated p53, BAX and p21 (0.80, 0.50 and 0.56-fold vs. control at 48 h, respectively). The expression levels of p53 and p21 were upregulated by tanshinone IIA monotherapy for 24 h (1.85 and 2.60-fold vs. control), which had little effect on the expression levels of MDM2 and BAX (1.11 and 1.10-fold vs. control), and the upregulation of p53 and p21 was further enhanced after 48 h of treatment (2.62 and 5.60-fold vs. control). The expression levels of MDM2 and BAX were also upregulated (1.69 and 1.82-fold vs. control). Compared with tanshinone IIA alone, imatinib combined with tanshinone IIA was more effective in upregulating the expression levels of p53, p21, MDM2 and Bax (2.84, 6.29, 2.24 and 1.88-fold vs. control at 48 h, respectively). As shown in Fig. 3B, in SUP-B15/RI cells, imatinib alone slightly upregulated MDM2 (1.11-fold vs. control at 48h), inhibited p53 expression (0.95-fold vs. control at 48 h), slightly upregulated BAX expression (1.11-fold vs. control at 48 h), inhibited p21 expression (0.92-fold vs. control at 48 h). Tanshinone monotherapy upregulated the expression levels of p53 (1.60-fold vs. control), p21 (2.83-fold vs. control) and BAX (2.31-fold vs. control) at 48 h, and slightly upregulated the expression levels of MDM2 (1.24-fold vs. control) at 48 h. Imatinib combined with tanshinone IIA was more effective than either individual drug in upregulating the expression levels of p53, BAX and p21 at 48 h, mildly inhibiting MDM2 expression at 24 h, and slightly upregulating MDM2 expression at 48 h. The aforementioned data indicated that imatinib combined with tanshinone IIA activated the p53 signaling pathway at the transcriptional level more efficiently than the imatinib monotherapy.
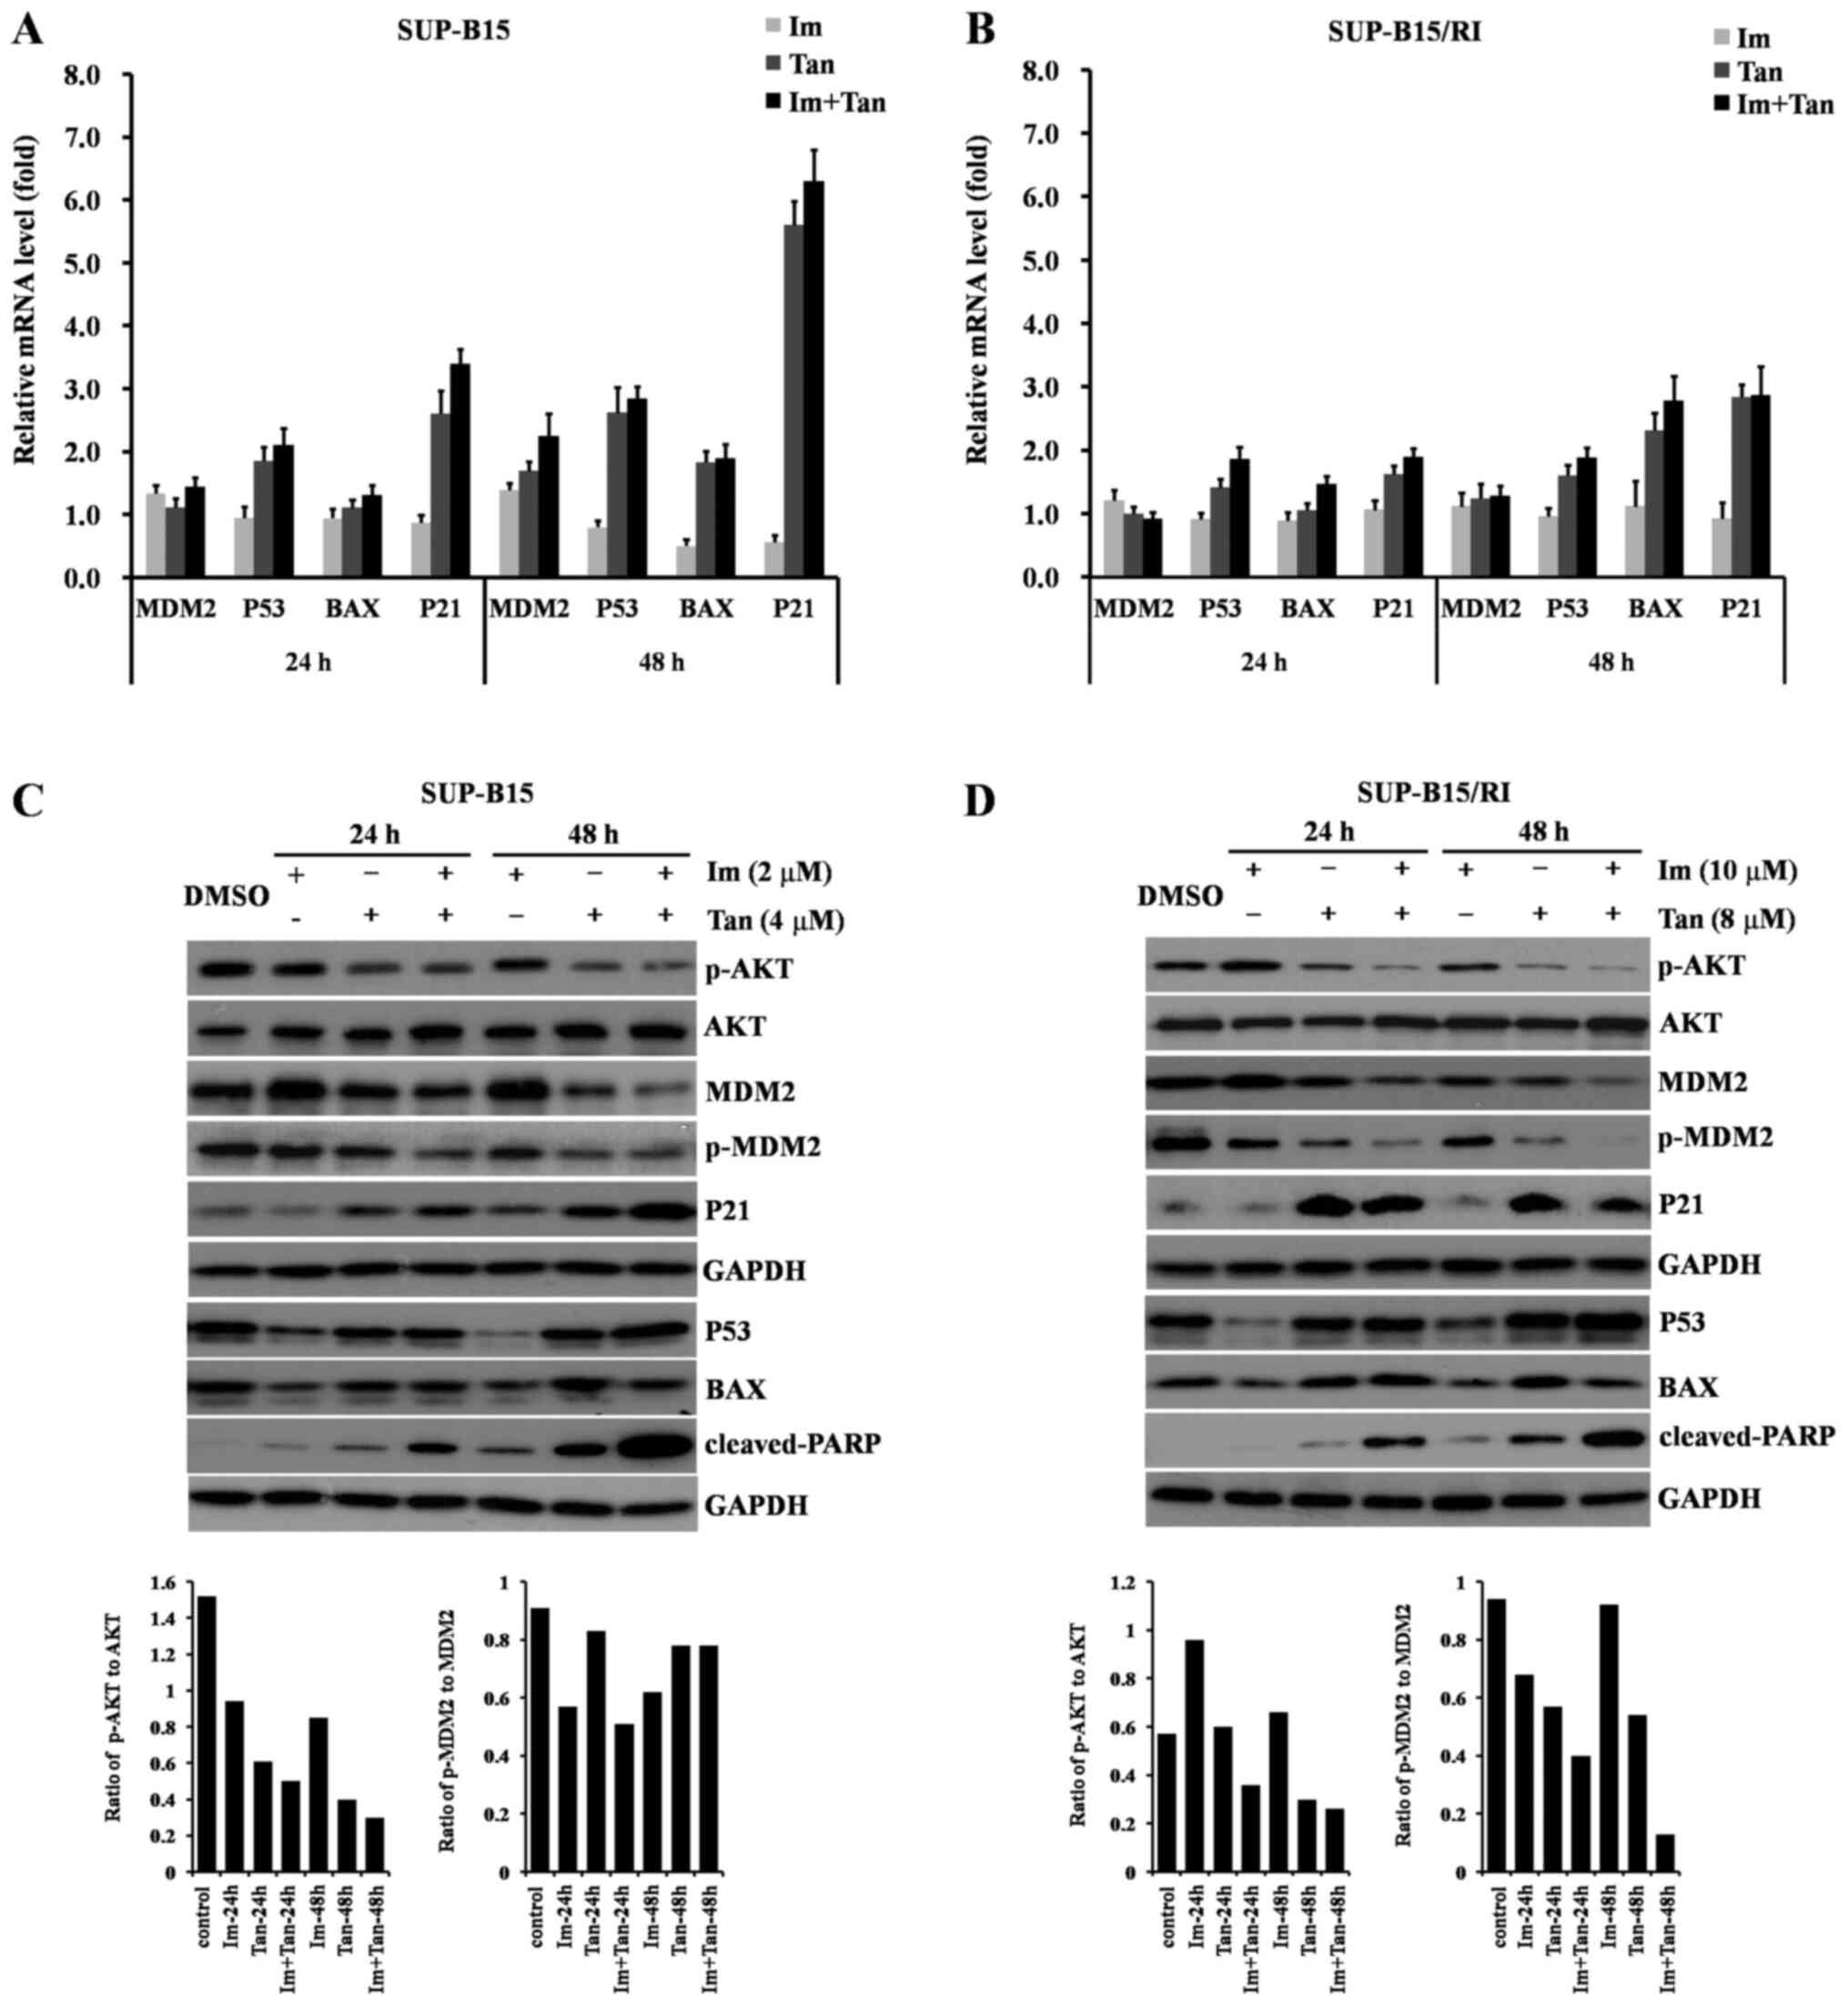 |
Figure 3.
Tan combined with Im reactivates the P53 signaling pathway in Philadelphia chromosome-positive acute lymphoblastic leukemia cell lines. SUP-B15 cells were treated with 0.1% DMSO (control), 2 µM Im, 4 µM Tan or the combination of 2 µM Im and 4 µM Tan for 24 and 48 h. SUP-B15/RI cells were treated with 0.1% DMSO (control), 10 µM Im, 8 µM Tan or the combination of 10 µM Im and 8 µM Tan for 24 and 48 h. At the end of the treatments, the cells were collected for the subsequent experiment. (A) Relative quantification of p53, MDM2, BAX and p21 mRNA in SUP-B15 cells was performed by reverse transcription-quantitative PCR. (B) Relative quantification of p53, MDM2, BAX and p21 mRNA in SUP-B15/RI cells was performed by reverse transcription-quantitative PCR. The data are presented as the mean ± SD of three different experiments with respect to the control, which was set to 1. (C) Total protein lysates were subjected to western blot analysis for p-AKT, AKT, MDM2, p-MDM2, P53, BAX, p21 and cleaved-PARP in SUP-B15 cells using the corresponding antibodies. (D) Total protein lysates were subjected to western blot analysis for p-AKT, AKT, MDM2, p-MDM2, P53, BAX, p21 and cleaved-PARP in SUP-B15/RI cells using the corresponding antibodies. One representative western blot is presented. GAPDH was used as the loading control. Im, imatinib; MDM2, MDM2 proto-oncogene; p-, phosphorylated; PARP, poly (ADP-ribose) polymerase; Tan, tanshinone IIA.
|
The present study next examined the effects of the drugs on the protein expression levels of P53, BAX, P21 and MDM2 using western blotting. As shown in Fig. 3C, in the SUP-B15 cells, imatinib alone inhibited P53, BAX and P21 expression, which indicated that imatinib inhibited the P53 signaling pathway. Tanshinone IIA had little effect on P53 expression but upregulated the expression levels of BAX and P21. Imatinib combined with tanshinone IIA overcame the imatinib-mediated inhibition of P53 and induced a higher degree of apoptosis than either individual drug, as demonstrated by the high expression levels of cleaved-poly (ADP-ribose) polymerase. MDM2 is responsible for P53 degradation and acts as an important negative regulator of P53. Phosphorylated AKT (Ser473) is involved in the regulation of MDM2 by phosphorylation on serine 166 (35). The present study next examined the effects of these drugs on MDM2 and the phosphorylation of MDM2 (Ser166) and AKT (Ser473). The data revealed that imatinib monotherapy upregulated MDM2 expression and had no inhibitory effect on phosphorylated MDM2 (Ser166) or phosphorylated AKT (Ser473). Tanshinone IIA downregulated MDM2 expression and inhibited phosphorylated AKT (Ser473) and phosphorylated MDM2 (Ser166). Imatinib combined with tanshinone IIA retained the inhibitory effect of tanshinone IIA on MDM2 and the phosphorylation of MDM2 (Ser166) and AKT (Ser473). As shown in Fig. 3D, in SUP-B15/RI cells, the effects of imatinib and tanshinone II alone or in combination on the AKT-MDM2-p53 signaling pathway were similar to those in SUP-B15 cells, imatinib combined with tanshinone IIA cooperatively upregulated P53, P21 by inhibiting AKT and MDM2, eventually increasing cleaved-poly (ADP-ribose) polymerase.
The transcriptional activity of P53 depends on its localization in the cell, and only P53 located in the nucleus can exert transcriptional activity (39). Therefore, the present study finally examined the effects of the drugs on the intracellular localization of P53. P53 localization was examined using immunofluorescence microscopy. As shown in Fig. 4A and B, imatinib had little effect on the localization of P53 in the cells. Tanshinone IIA alone had no significant effect on P53 protein levels or intracellular localization. Only imatinib combined with tanshinone IIA both upregulated P53 protein levels and increased p53 localization in the nucleus.
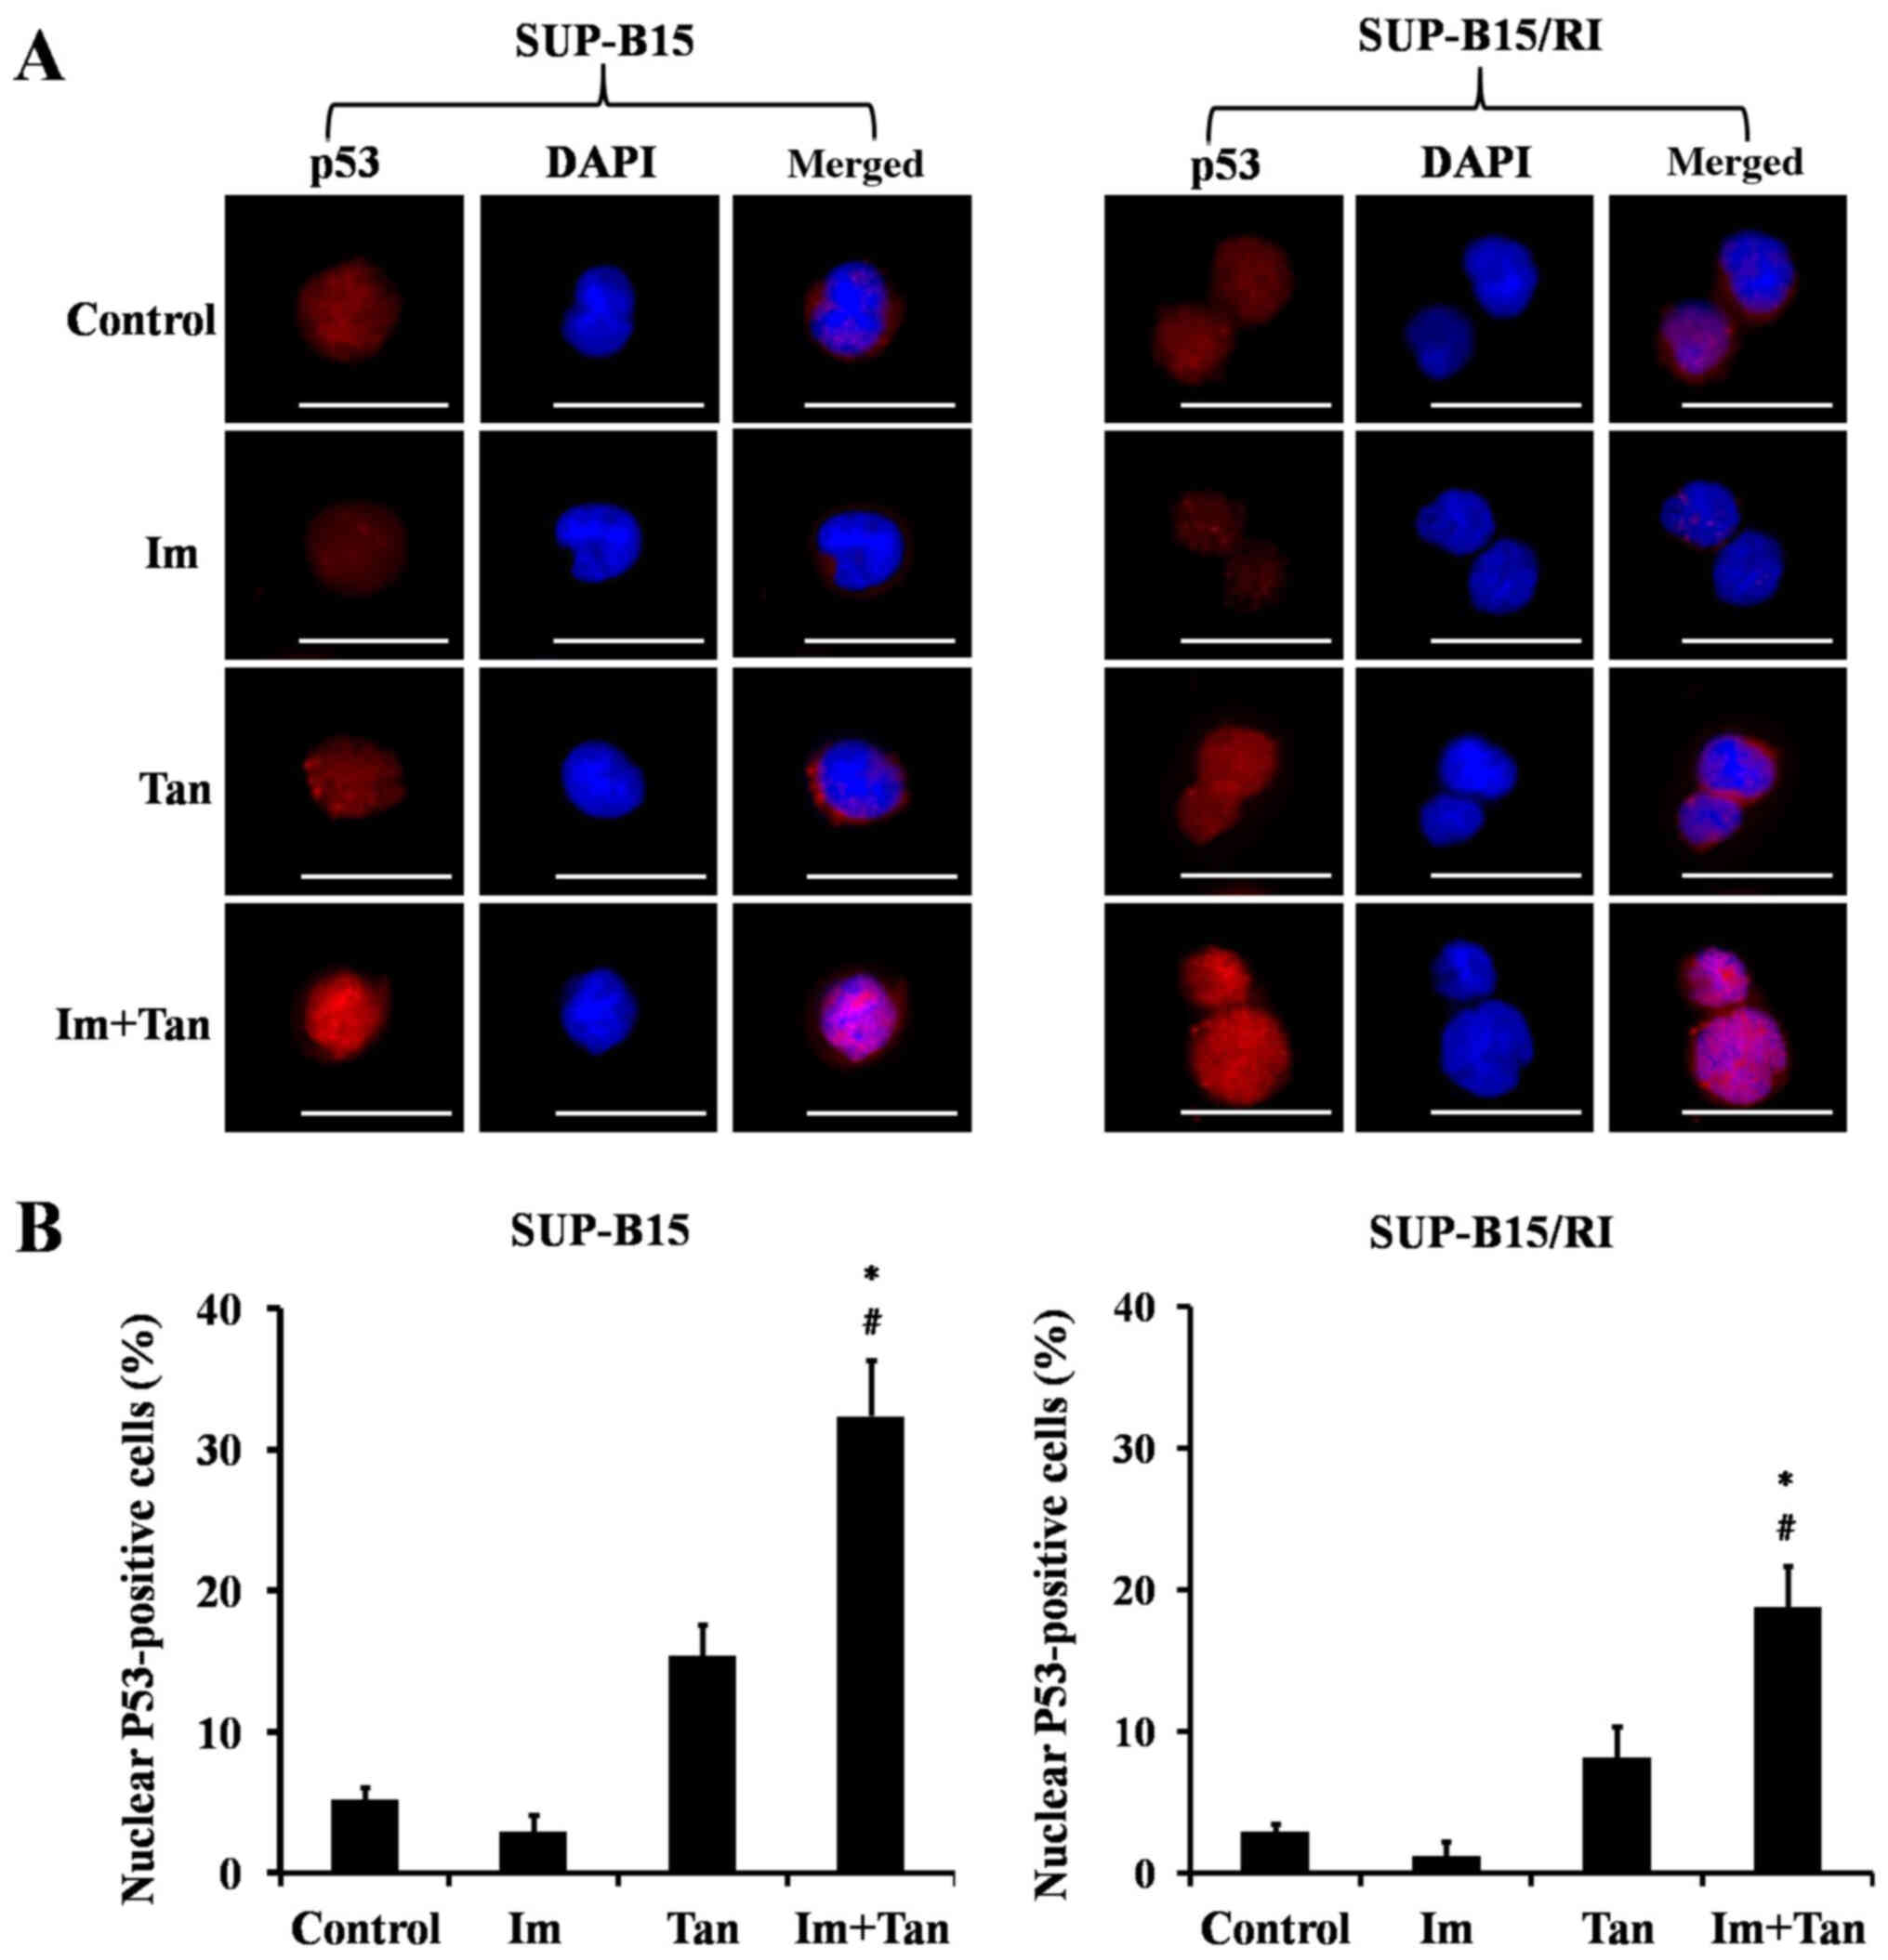 |
Figure 4.
Tan combined with Im increases P53 localization in the nucleus. SUP-B15 cells were treated with 0.1% DMSO (control), 2 µM Im, 4 µM Tan or the combination of 2 µM Im and 4 µM Tan for 48 h. SUP-B15/RI cells were treated with 0.1% DMSO (control), 10 µM Im, 8 µM Tan or the combination of 10 µM Im and 8 µM Tan for 48 h. At the end of the treatments, the cells were stained for p53 (red) and the nuclei were counterstained with DAPI (blue). (A) Localization of p53 in the cells is indicated in the merged image. Scale bar, 20 µm. (B) Cells with p53 nuclear positivity were quantified by counting a total of 100 cells (magnification, ×400) for each treatment. The data are presented as the mean ± SD of five independent fields. The significance of the differences was determined using one-way ANOVA with a Bonferroni post hoc test. *P<0.05 vs. Im; #P<0.05 vs. Tan. Im, imatinib; Tan, tanshinone IIA.
|
Effects of tanshinone IIA and imatinib on BCR/ABL signaling and apoptosis regulatory proteins in Ph+ ALL cell lines
BCR/ABL kinase is the trigger of Ph+ ALL, and apoptosis regulatory proteins determine the fate of cells (40). The present study examined the effects of imatinib and tanshinone IIA on BCR/ABL signaling and the apoptosis regulatory proteins MCL1 and BCL2. As shown in Fig. 5A and B, compared with control group, imatinib alone inhibited the phosphorylation of BCR/ABL and its downstream kinases STAT5 and MEK, tanshinone IIA alone had no inhibitory effects on BCR/ABL, STAT5 and MEK, and compared with control imatinib, the addition of tanshinone IIA did not affect the inhibitory effect of imatinib on BCR/ABL signaling.
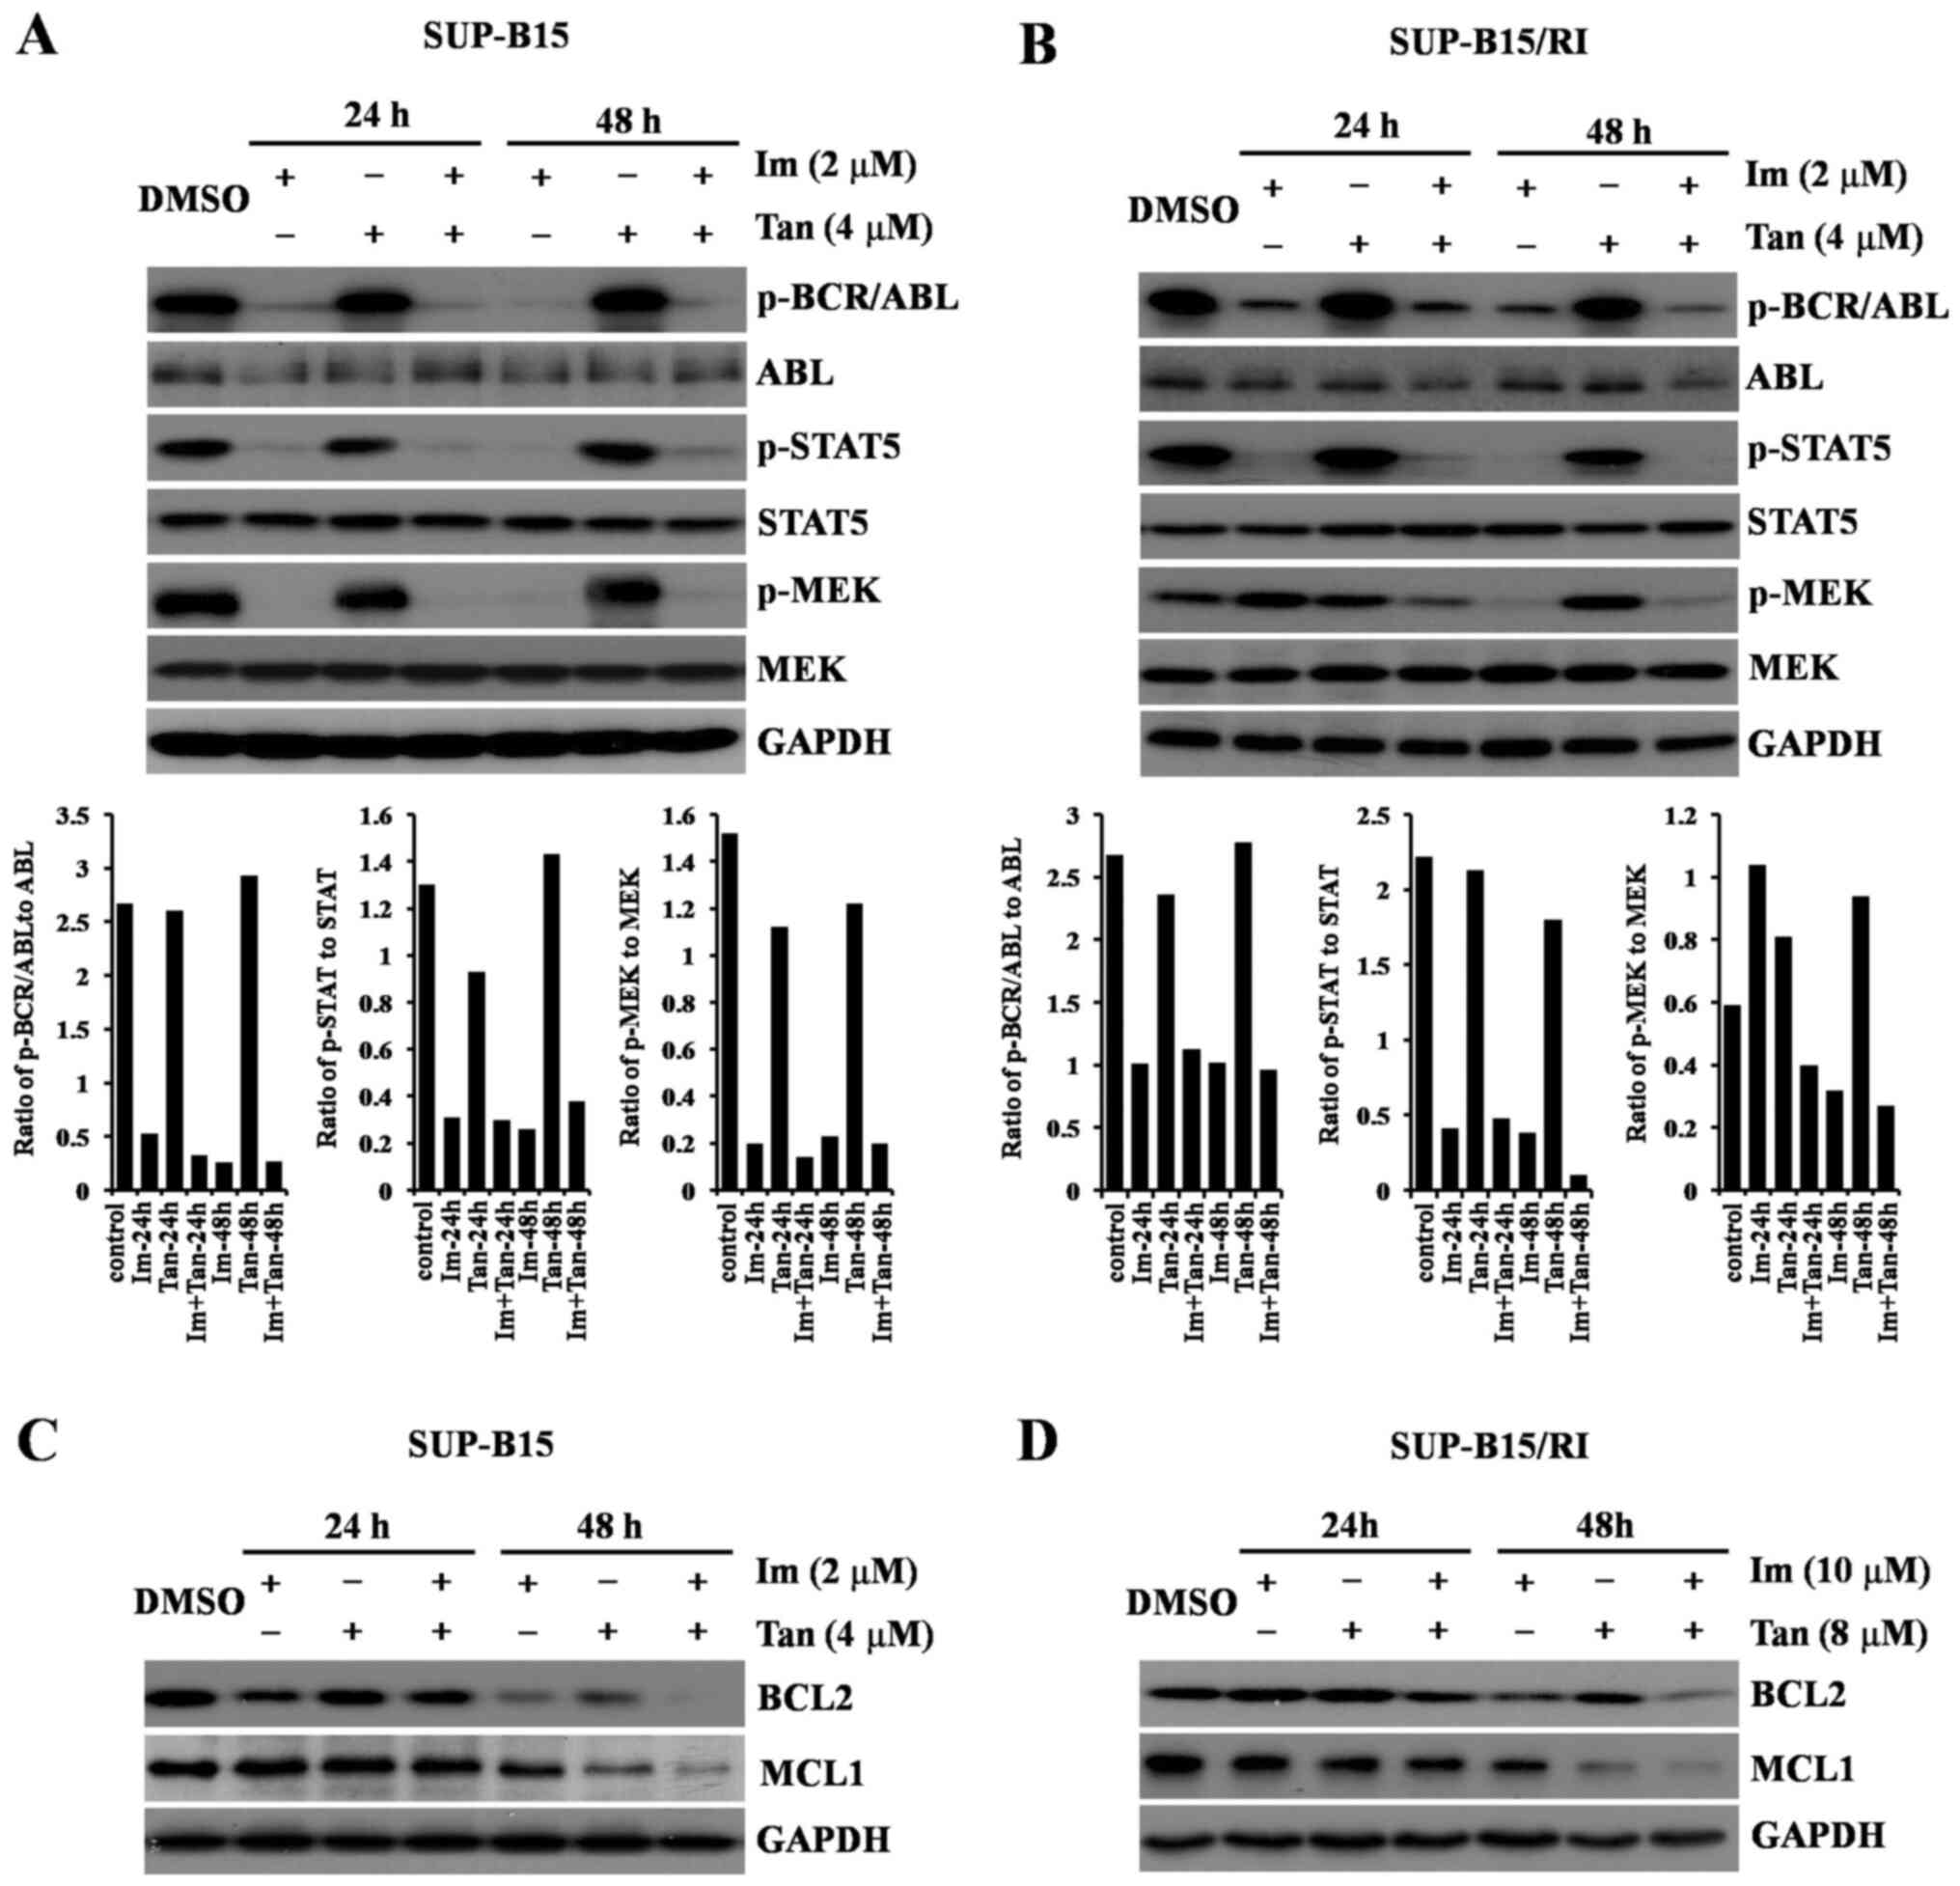 |
Figure 5.
Effects of Tan and Im on BCR/ABL signaling and apoptosis-regulatory proteins in Philadelphia chromosome-positive acute lymphoblastic leukemia. SUP-B15 cells were treated with 0.1% DMSO (control), 2 µM Im, 4 µM Tan or the combination of 2 µM Im and 4 µM Tan for 24 and 48 h. SUP-B15/RI cells were treated with 0.1% DMSO (control), 10 µM Im, 8 µM Tan or the combination of 10 µM Im and 8 µM Tan for 24 h and 48 h. At the end of the treatments, the cells were collected, and the total proteins were extracted for western blot analysis using the corresponding antibodies. One representative western blot is presented. GAPDH was used as the loading control. (A) Effects of Tan and Im on the activation of BCR/ABL, STAT5 and MEK in SUP-B15 cells. (B) Effects of Tan and Im on the activation of BCR/ABL, STAT5 and MEK in SUP-B15/RI cells. (C) Effects of Tan and Im on the anti-apoptotic proteins BCL2 and MCL1 in SUP-B15. (D) Effects of Tan and Im on the anti-apoptotic proteins BCL2 and MCL1 in SUP-B15/RI. Im, imatinib; MCL1, MCL1 apoptosis regulator, BCL2 family member; p-, phosphorylated; Tan, tanshinone IIA.
|
The effects of imatinib and tanshinone IIA on the pro-apoptotic protein BAX have been examined in the present study of their effects on the P53 signaling pathway. These experiments were not repeated here. The present study examined the effects of imatinib and tanshinone IIA on the anti-apoptotic proteins MCL1 and BCL2. As shown in Fig. 5C and D, 24 h of treatment with imatinib, tanshinone IIA monotherapy or both drugs combined had no significant effect on the expression levels of MCL1 or BCL2. Treatment with imatinib and tanshinone IIA monotherapy for 48 h downregulated BCL2, and imatinib inhibited BCL2 more strongly than tanshinone IIA, while tanshinone IIA enhanced the imatinib-mediated downregulation of BCL2. Regarding MCL1 expression, 48 h of treatment with imatinib alone had no effect, 48 h of treatment with tanshinone IIA downregulated its expression, and 48 h of treatment with a combination of tanshinone IIA and imatinib downregulated its expression with a stronger effect than that of tanshinone IIA monotherapy.
Tanshinone IIA combined with imatinib inhibits the proliferation of Ph+ ALL cells in vivo
The present study investigated the antileukemic effects and mechanisms of the combination of imatinib and tanshinone IIA on Ph+ ALL cells in vitro, and it next investigated its efficacy in vivo using the mouse Ph+ ALL model. As shown in Fig. 6, treatment with imatinib, tanshinone IIA or both drugs combined reduced the swelling of the spleen; however, compared with monotherapy, the combination treatment of tanshinone II and imatinib more effectively decreased BCR/ABL gene expression in the bone marrow (Fig. 6B) and the number of CD19-positive cells in spleen (Fig. 6C), which indicated a reduction in the leukemia burden in the bone marrow and spleen.
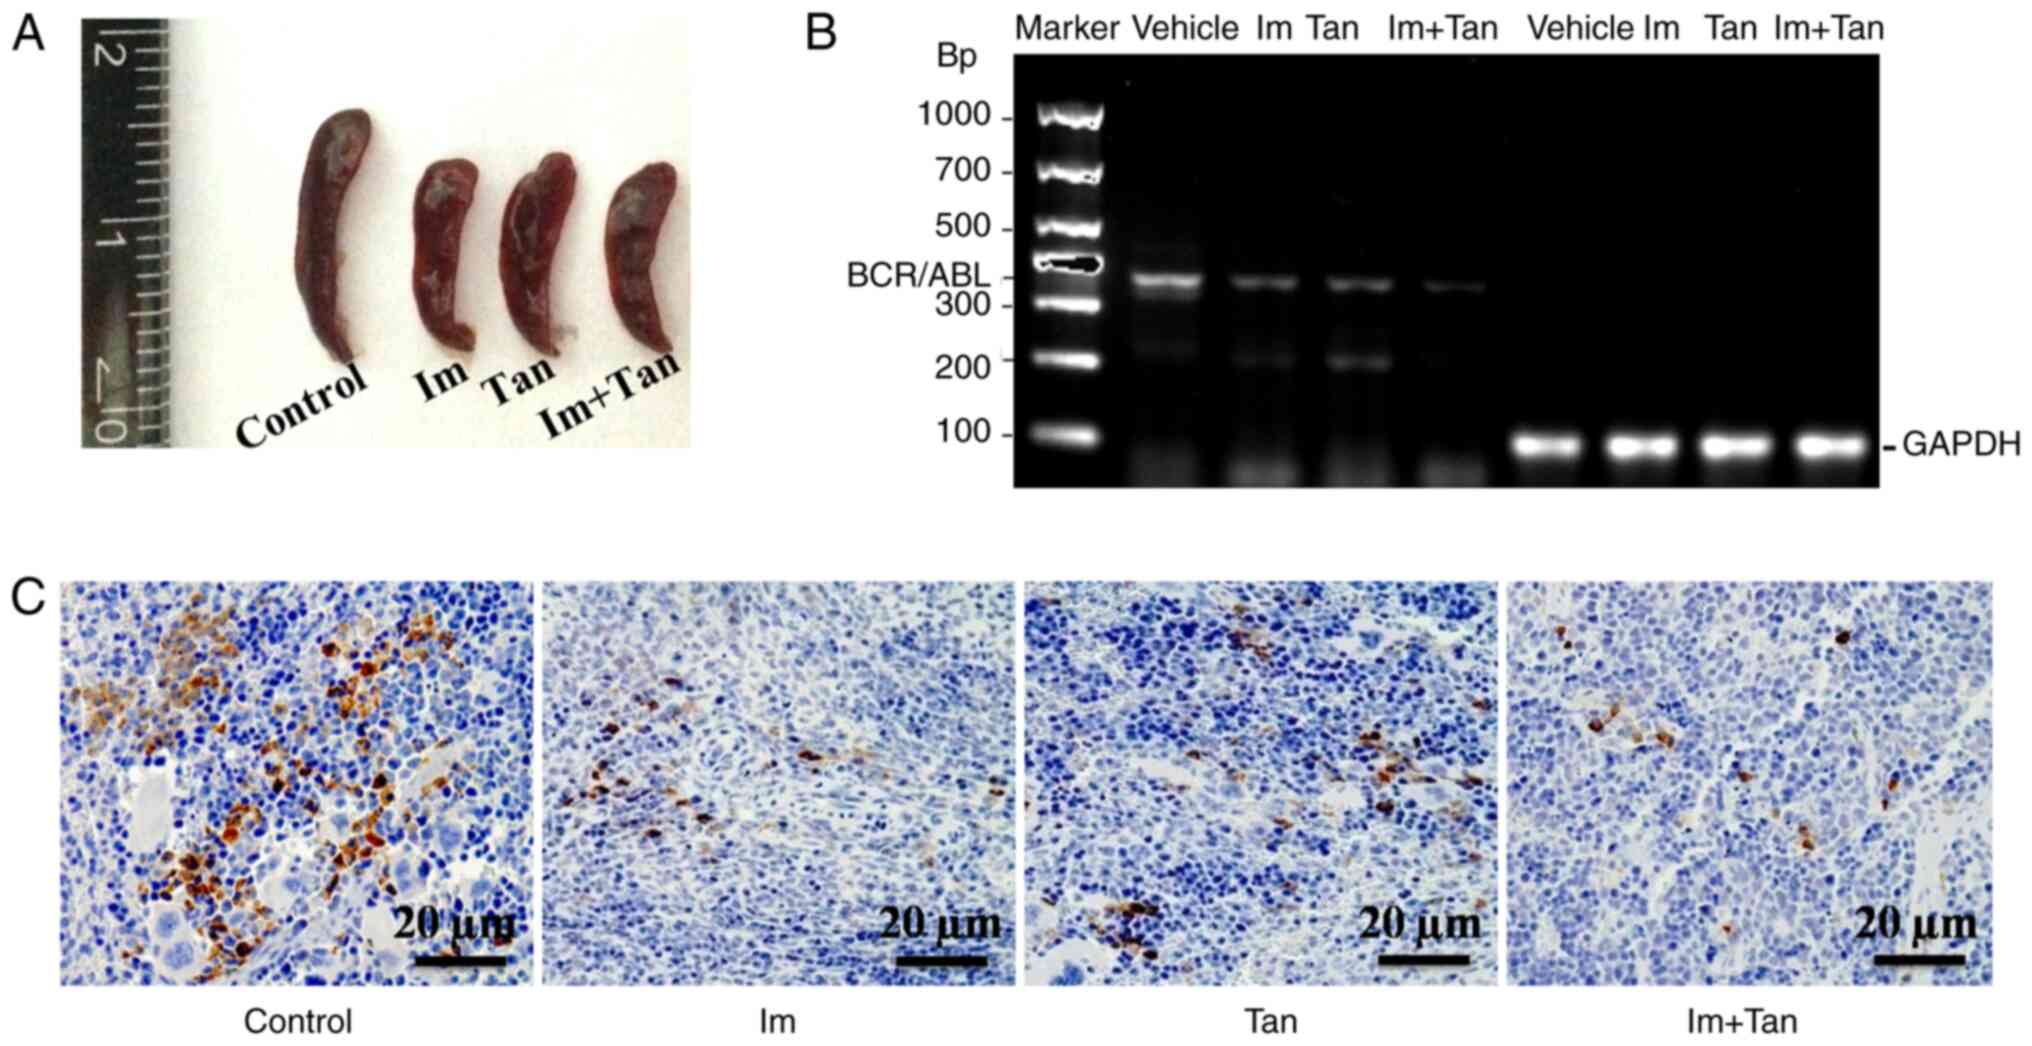 |
Figure 6.
In vivo antileukemic effect of Tan combined with Im in Philadelphia chromosome-positive acute lymphoblastic leukemia xenograft mice. SUP-B15 cell xenograft mice were injected intraperitoneally with 10 mg/kg/day Im, 30 mg/kg/day Tan or the combination of Im and Tan for a 14-day period. At 1 week after the treatments ended, the mice were sacrificed, and spleen and bone marrow samples were obtained. (A) Spleen size in different treatment groups. (B) BCR/ABL gene expression in bone marrow was detected using semi-quantitative PCR analysis. (C) CD19-positive cells in the spleen were detected using an immunohistochemical assay. Scale bar, 20 µm. Im, imatinib; Tan, tanshinone IIA.
|
Discussion
TKIs improve the prognosis of patients with Ph+ ALL. At present, the standard first-line treatment approach for Ph+ ALL is based on the use of a TKI with or without chemotherapy and followed by consolidation therapy, and imatinib or dasatinib are the preferred agents for the treatment of Ph+ ALL (5–12,17). Compared with imatinib treatment, dasatinib treatment can induce faster and deeper remission but has more toxic effects and side effects, including pulmonary hypertension, pleural effusion and hemorrhage (13–15). These toxic effects and side effects often lead to treatment interruption and subsequently affect the efficacy of the treatment (16). Therefore, it was hypothesized that the combination of imatinib with a certain drug could enhance the efficacy of imatinib without enhancing the toxicity or side effects of imatinib. In the present study, it was revealed that the combination of tanshinone IIA with imatinib enhanced the anti-leukemic effect of imatinib in vitro and in vivo. Mechanistically, the combination of tanshinone IIA with imatinib inhibited AKT/MDM2, reactivated the P53 signaling pathway and downregulated the anti-apoptotic proteins MCL1 and BCL2, leading to cell apoptosis. It has been reported that TKIs cannot effectively inhibit the activation of the AKT signaling pathway (41,42) or mediate the transcriptional inactivation of the P53 signaling pathway (20). These characteristics of TKIs affect their efficacy and even induce drug resistance. The present results demonstrated that imatinib inhibited the P53 signaling pathway at the mRNA and protein levels. In addition, imatinib upregulated MDM2 expression at the mRNA and protein levels. MDM2, an E3 ubiquitin ligase, specifically mediates the ubiquitination and degradation of P53, thus adjusting the depth and duration of P53 activation, and is the most important negative regulator of P53 (37). Imatinib upregulated the expression levels of MDM2, thus accelerating the degradation of P53, thereby inhibiting the P53 signaling pathway at the post-translational level. In contrast to imatinib, tanshinone IIA upregulated the P53 signaling pathway at the mRNA level but had no significant effect on the P53 signaling pathway at the protein level. The effect of tanshinone IIA on MDM2 was also different from that of imatinib. Tanshinone IIA upregulated MDM2 expression at the mRNA level but inhibited MDM2 expression at the protein level, suggesting that tanshinone IIA inhibited MDM2 expression at the post-transcriptional level. Since tanshinone IIA inhibited MDM2 protein expression, it thereby reduced MDM2-mediated P53 degradation and activated the P53 signaling pathway. When tanshinone IIA was combined with imatinib, the upregulating effect of tanshinone IIA on P53 at the mRNA level was enhanced, and the inhibitory effect of tanshinone IIA on MDM2 protein expression was also enhanced; however, the specific mechanism was not clear. The final result was that tanshinone IIA combined with imatinib synergistically activated the P53 signaling pathway and synergistically induced apoptosis. Consistent with the literature (41,42), imatinib had no inhibitory effect on the activation of AKT by phosphorylation on serine 473 in Ph+ ALL cells, while tanshinone IIA inhibited the activation of AKT by phosphorylation on serine 473 in Ph+ ALL cells. When tanshinone IIA was combined with imatinib, the inhibitory effect of tanshinone IIA on the activation of AKT by phosphorylation on serine 473 was enhanced. Phosphorylated AKT (Ser473) is responsible for phosphorylating MDM2 (ser166) (40). Phosphorylated MDM2 (ser166) is more likely to enter the nucleus than non-phosphorylated MDM2 and thus exports p53 from the nucleus to the cytoplasm and mediates its ubiquitination and degradation more effectively than MDM2 (43). The present results revealed that tanshinone IIA combined with imatinib not only synergistically inhibited MDM2 protein expression but also inhibited the phosphorylation of MDM2 (ser166) by synergistically inhibiting the phosphorylation of AKT (Ser473), thereby more effectively inhibiting MDM2-induced degradation of P53 and thus activating the P53 signaling pathway more effectively. The present data demonstrated that tanshinone IIA combined with imatinib overcame the inhibition of the P53 signaling pathway induced by treatment with imatinib alone and retained and enhanced the ability of tanshinone IIA to activate the p53 signaling pathway. Based on the aforementioned results, it was concluded that the synergistic regulation of the AKT-MDM2-P53 signaling pathway is an important mechanism in the enhancement of the anti-leukemic effects of imatinib by tanshinone IIA.
BCR/ABL signaling is essential for Ph+ ALL cells, and TKIs exert antileukemic effects by targeting the inhibition of BCR/ABL signaling. The present results demonstrated that tanshinone IIA had no inhibitory effect on BCR/ABL signaling but the combination of tanshinone II and imatinib did not weaken the inhibitory effect of imatinib on BCR/ABL signaling. Therefore, tanshinone II did not impair the anti-leukemic efficacy of imatinib. Apoptosis regulatory proteins determine the fate of cells under stress. Imatinib alone inhibited the expression of the pro-apoptotic protein BAX, had a weak inhibitory effect on the anti-apoptotic protein BCL2 and had no effect on the anti-apoptotic protein MCL1. Therefore, the apoptotic induction effect of imatinib was weak. Tanshinone IIA combined with imatinib not only overcame the defect of imatinib alone by inhibiting BAX but also synergistically inhibited BCL2 and MCL1, thus enhancing the apoptotic induction effect. Further in vivo experiments also revealed that tanshinone IIA enhanced the anti-leukemic effect of imatinib, and notably, tanshinone IIA did not increase the toxic side effects of imatinib in vivo.
Our previous study revealed that MDM2 inhibitor nutlin-3 plus tanshinone IIA combined with imatinib quickly and effectively inhibited the activation of the ALT-MDM2 signaling pathway mediated by imatinib and relieved the inhibition of the p53 signaling pathway, thereby enhancing the anti-leukemia effect of imatinib in Ph+ ALL cells (41). Compared with nutlin-3 plus tanshinone IIA combined with imatinib, the anti-leukemia effect of tanshinone IIA combined with imatinib was slower in speed and lower in intensity. Nutlin-3 plus tanshinone IIA combined with imatinib induced 70.5±5.2% SUP-B15 cell apoptosis at 24 h, while tanshinone IIA combined with imatinib only induced 45.04±5.74% SUP-B15 cell apoptosis at 48 h. Although the anti-leukemia effect of tanshinone IIA combined with imatinib was relatively slower and lower than that of nutlin-3 plus tanshinone IIA combined with imatinib, tanshinone IIA has been widely used in clinical practice and has good pharmacological safety. Tanshinone IIA combined with imatinib can be quickly applied to the clinic to benefit patients, while the research of nutlin3 inhibitors is still mainly in preclinical research stages, and its safety in humans requires a long time to verify. Therefore, it will take a long time for it to enter clinical application.
In conclusion, the present study demonstrated that tanshinone IIA enhanced the efficacy of imatinib in Ph+ ALL cells in vitro and in vivo. These findings, coupled with the known pharmacological safety of tanshinone IIA and especially its cardioprotective effect, provide a compelling case for using a combination of imatinib with tanshinone IIA to treat patients with Ph+ ALL.
Supplementary Material
Supporting Data
Acknowledgements
Not applicable.
Funding
The present study was supported by grants from the National Natural Science Foundation of China (grant no. 81400123) and the Foundation of Institutes of Health Department of Sichuan Province (grant no. JH2014080).
Availability of data and materials
All data generated or analyzed during this study are included in this published article.
Authors' contributions
YG designed the experiments, coordinated the study, and drafted the manuscript. FFW conducted the experiments. BX and HBM were involved in the data analysis, and confirmed the authenticity of all the raw data and drafted the initial manuscript. YPG conceived the study and participated in designing the experiments and helped to draft the manuscript. All authors read and approved the final manuscript.
Ethics approval and consent to participate
All animal procedures were approved by the Institutional Animal Care and Use Committee of the Sichuan University West China Hospital (Chengdu, China). The collection and use of human specimens was approved by the Biomedical Ethics Committee of West China Hospital (Chengdu, China; 2019 Trial (114) and written informed consent was provided prior to the study start.
Patient consent for publication
Not applicable.
Competing interests
The authors declare that they have no competing interests.
References
|
1
|
Secker-Walker LM, Craig JM, Hawkins JM and Hoffbrand AV: Philadelphia positive acute lymphoblastic leukemia in adults: Age distribution, BCR breakpoint and prognostic significance. Leukemia. 5:196–199. 1991.PubMed/NCBI
|
|
2
|
Burmeister T, Schwartz S, Bartram CR, Gökbuget N, Hoelzer D and Thiel E; GMALL study group, : Patients' age and BCR-ABL frequency in adult B-precursor ALL: A retrospective analysis from the GMALL study group. Blood. 112:918–919. 2008. View Article : Google Scholar : PubMed/NCBI
|
|
3
|
Preti HA, O'Brien S, Giralt S, Beran M, Pierce S and Kantarjian HM: Philadelphia-chromosome-positive adult acute lymphocytic leukemia: Characteristics, treatment results, and prognosis in 41 patients. Am J Med. 97:60–65. 1994. View Article : Google Scholar : PubMed/NCBI
|
|
4
|
Dombret H, Gabert J, Boiron JM, Rigal-Huguet F, Blaise D, Thomas X, Delannoy A, Buzyn A, Bilhou-Nabera C, Cayuela JM, et al: Outcome of treatment in adults with Philadelphia chromosome-positive acute lymphoblastic leukemia-results of the prospective multicenter LALA-94 trial. Blood. 100:2357–2366. 2002. View Article : Google Scholar : PubMed/NCBI
|
|
5
|
Wassmann B, Pfeifer H, Goekbuget N, Beelen DW, Beck J, Stelljes M, Bornhäuser M, Reichle A, Perz J, Haas R, et al: Alternating versus concurrent schedules of imatinib and chemotherapy as front-line therapy for Philadelphia-positive acute lymphoblastic leukemia (Ph+ALL). Blood. 108:1469–1477. 2006. View Article : Google Scholar : PubMed/NCBI
|
|
6
|
Yanada M, Takeuchi J, Sugiura I, Akiyama H, Usui N, Yagasaki F, Kobayashi T, Ueda Y, Takeuchi M, Miyawaki S, et al: High complete remission rate and promising outcome by combination of imatinib and chemotherapy for newly diagnosed BCR-ABL-positive acute lymphoblastic leukemia: A phase II study by the Japan adult leukemia study group. J Clin Oncol. 24:460–466. 2006. View Article : Google Scholar : PubMed/NCBI
|
|
7
|
Bassan R, Rossi G, Pogliani EM, Di Bona E, Angelucci E, Cavattoni I, Lambertenghi-Deliliers G, Mannelli F, Levis A, Ciceri F, et al: Chemotherapy-phased imatinib pulses improve long-term outcome of adult patients with Philadelphia chromosome-positive acute lymphoblastic leukemia: Northern Italy leukemia group protocol 09/00. J Clin Oncol. 28:3644–3652. 2010. View Article : Google Scholar : PubMed/NCBI
|
|
8
|
Tanguy-Schmidt A, Rousselot P, Chalandon Y, Cayuela JM, Hayette S, Vekemans MC, Escoffre M, Huguet F, Réa D, Delannoy A, et al: Long-term follow-up of the imatinib GRAAPH-2003 study in newly diagnosed patients with de novo Philadelphia chromosome-positive acute lymphoblastic leukemia: A GRAALL study. Biol Blood Marrow Transplant. 19:150–155. 2013. View Article : Google Scholar : PubMed/NCBI
|
|
9
|
Fielding AK, Rowe JM, Buck G, Foroni L, Gerrard G, Litzow MR, Lazarus H, Luger SM, Marks DI, McMillan AK, et al: UKALLXII/ECOG2993: Addition of imatinib to a standard treatment regimen enhances long-term outcomes in Philadelphia positive acute lymphoblastic leukemia. Blood. 123:843–850. 2014. View Article : Google Scholar : PubMed/NCBI
|
|
10
|
Vignetti M, Fazi P, Cimino G, Martinelli G, Di Raimondo F, Ferrara F, Meloni G, Ambrosetti A, Quarta G, Pagano L, et al: Imatinib plus steroids induces complete remissions and prolonged survival in elderly Philadelphia chromosome-positive patients with acute lymphoblastic leukemia without additional chemotherapy: Results of the gruppo italiano malattie ematologiche dell'adulto (GIMEMA) LAL0201-B protocol. Blood. 109:3676–3678. 2007. View Article : Google Scholar : PubMed/NCBI
|
|
11
|
Ravandi F, O'Brien S, Thomas D, Faderl S, Jones D, Garris R, Dara S, Jorgensen J, Kebriaei P, Champlin R, et al: First report of phase 2 study of dasatinib with hyper-CVAD for the frontline treatment of patients with Philadelphia chromosome-positive (Ph+) acute lymphoblastic leukemia. Blood. 116:2070–2077. 2010. View Article : Google Scholar : PubMed/NCBI
|
|
12
|
Foà R, Vitale A, Vignetti M, Meloni G, Guarini A, De Propris MS, Elia L, Paoloni F, Fazi P, Cimino G, et al: Dasatinib as first-line treatment for adult patients with Philadelphia chromosome-positive acute lymphoblastic leukemia. Blood. 118:6521–6528. 2011. View Article : Google Scholar : PubMed/NCBI
|
|
13
|
Groarke JD, Cheng S and Moslehi J: Cancer-drug discovery and cardiovascular surveillance. N Engl J Med. 369:1779–1781. 2013. View Article : Google Scholar : PubMed/NCBI
|
|
14
|
Montani D, Bergot E, Günther S, Savale L, Bergeron A, Bourdin A, Bouvaist H, Canuet M, Pison C, Macro M, et al: Pulmonary arterial hypertension in patients treated by dasatinib. Circulation. 125:2128–2137. 2012. View Article : Google Scholar : PubMed/NCBI
|
|
15
|
Guignabert C, Phan C, Seferian A, Huertas A, Tu L, Thuillet R, Sattler C, Le Hiress M, Tamura Y, Jutant EM, et al: Dasatinib induces lung vascular toxicity and predisposes to pulmonary hypertension. J Clin Invest. 126:3207–3218. 2016. View Article : Google Scholar : PubMed/NCBI
|
|
16
|
Steegmann JL, Baccarani M, Breccia M, Casado LF, García-Gutiérrez V, Hochhaus A, Kim DW, Kim TD, Khoury HJ, Le Coutre P, et al: European LeukemiaNet recommendations for the management and avoidance of adverse events of treatment in chronic myeloid leukaemia. Leukemia. 30:1648–1671. 2016. View Article : Google Scholar : PubMed/NCBI
|
|
17
|
For R, Vitale A, Guarini A, De Propris MS, Elia L, Cimino G, Luppi M, Castagnola C, Sica S, Nieddu R, et al: Line treatment of adult ph+ acute lymphoblastic leukemia (ALL) patients: Final results of the GIMEMA LAL1205 study. Blood. 112:3052008. View Article : Google Scholar
|
|
18
|
Rousselot P, Coudé MM, Gokbuget N, Gambacorti Passerini C, Hayette S, Cayuela JM, Huguet F, Leguay T, Chevallier P, Salanoubat C, et al: Dasatinib and low-intensity chemotherapy in elderly patients with Philadelphia chromosome-positive ALL. Blood. 128:774–782. 2016. View Article : Google Scholar : PubMed/NCBI
|
|
19
|
Wendel HG, de Stanchina E, Cepero E, Ray S, Emig M, Fridman JS, Veach DR, Bornmann WG, Clarkson B, McCombie WR, et al: Loss of p53 impedes the antileukemic response to BCR-ABL inhibition. Proc Natl Acad Sci USA. 103:7444–7449. 2006. View Article : Google Scholar : PubMed/NCBI
|
|
20
|
Duy C, Hurtz C, Shojaee S, Cerchietti L, Geng H, Swaminathan S, Klemm L, Kweon SM, Nahar R, Braig M, et al: BCL6 enables Ph+ acute lymphoblastic leukaemia cells to survive BCR-ABL1 kinase inhibition. Nature. 473:384–388. 2011. View Article : Google Scholar : PubMed/NCBI
|
|
21
|
Trino S, Iacobucci I, Erriquez D, Laurenzana I, De Luca L, Ferrari A, Ghelli Luserna Di Rorà A, Papayannidis C, Derenzini E, Simonetti G, et al: Targeting the p53-MDM2 interaction by the small-molecule MDM2 antagonist Nutlin-3a: A new challenged target therapy in adult Philadelphia positive acute lymphoblastic leukemia patients. Oncotarget. 7:12951–12961. 2016. View Article : Google Scholar : PubMed/NCBI
|
|
22
|
Jang SI, Jeong SI, Kim KJ, Kim HJ, Yu HH, Park R, Kim HM and You YO: Tanshinone IIA from Salvia miltiorrhiza inhibits inducible nitric oxide synthase expression and production of TNF-alpha, IL-1beta and IL-6 in activated RAW 264.7 cells. Planta Med. 69:1057–1059. 2003. View Article : Google Scholar : PubMed/NCBI
|
|
23
|
Tsai MY, Yang RC, Wu HT, Pang JH and Huang ST: Anti-angiogenic effect of tanshinone IIA involves inhibition of matrix invasion and modification of MMP-2/TIMP-2 secretion in vascular endothelial cells. Cancer Lett. 310:198–206. 2011. View Article : Google Scholar : PubMed/NCBI
|
|
24
|
Ding L, Wang S, Wang W, Lv P, Zhao D, Chen F, Meng T, Dong L and Qi L: Tanshinone IIA affects autophagy and apoptosis of glioma cells by inhibiting phosphatidylinositol 3-kinase/Akt/mammalian target of rapamycin signaling pathway. Pharmacology. 99:188–195. 2017. View Article : Google Scholar : PubMed/NCBI
|
|
25
|
Munagala R, Aqil F, Jeyabalan J and Gupta RC: Tanshinone IIA inhibits viral oncogene expression leading to apoptosis and inhibition of cervical cancer. Cancer Lett. 356:536–456. 2015. View Article : Google Scholar : PubMed/NCBI
|
|
26
|
Su CC and Chiu TL: Tanshinone IIA decreases the protein expression of EGFR, and IGFR blocking the PI3K/Akt/mTOR pathway in gastric carcinoma AGS cells both in vitro and in vivo. Oncol Rep. 36:1173–1179. 2016. View Article : Google Scholar : PubMed/NCBI
|
|
27
|
Wang L, Zhou GB, Liu P, Song JH, Liang Y, Yan XJ, Xu F, Wang BS, Mao JH, Shen ZX, et al: Dissection of mechanisms of Chinese medicinal formula Realgar-Indigo naturalis as an effective treatment for promyelocytic leukemia. Proc Natl Acad Sci USA. 105:4826–4831. 2008. View Article : Google Scholar : PubMed/NCBI
|
|
28
|
Shan YF, Shen X, Xie YK, Chen JC, Shi HQ, Yu ZP, Song QT, Zhou MT and Zhang QY: Inhibitory effects of tanshinone II-A on invasion and metastasis of human colon carcinoma cells. Acta Pharmacol Sin. 30:1537–1542. 2009. View Article : Google Scholar : PubMed/NCBI
|
|
29
|
Yu T, Zhou Z, Mu Y, de Lima Lopes G and Luo KQ: A novel anti-cancer agent, acetyltanshinone IIA, inhibits oestrogen receptor positive breast cancer cell growth by down-regulating the oestrogen receptor. Cancer Lett. 346:94–103. 2014. View Article : Google Scholar : PubMed/NCBI
|
|
30
|
Zhang Y, Zhang S and Chen X: Tanshinone IIA protects against cardiac fibrosis through inhibition of β-tubulin expression. J Biol Regul Homeost Agents. 32:1451–1455. 2018.PubMed/NCBI
|
|
31
|
Yu ML, Li SM, Gao X, Li JG, Xu H and Chen KJ: Sodium tanshinone II A sulfonate for coronary heart disease: A systematic review of randomized controlled trials. Chin J Integr Med. 26:219–226. 2020. View Article : Google Scholar : PubMed/NCBI
|
|
32
|
Meng ZJ, Wang C, Meng LT, Bao BH, Wu JH and Hu YQ: Sodium tanshinone IIA sulfonate attenuates cardiac dysfunction and improves survival of rats with cecal ligation and puncture-induced sepsis. Chin J Nat Med. 16:846–855. 2018.PubMed/NCBI
|
|
33
|
He Z, Sun C, Xu Y and Cheng D: Reduction of atrial fibrillation by tanshinone IIA in chronic heart failure. Biomed Pharmacother. 84:1760–1767. 2016. View Article : Google Scholar : PubMed/NCBI
|
|
34
|
Guo Y, Li Y, Xiang B, Huang XO, Ma HB, Wang FF and Gong YP: Nutlin-3 plus tanshinone IIA exhibits synergetic anti-leukemia effect with imatinib by reactivating p53 and inhibiting the AKT/mTOR pathway in Ph+ ALL. Biochem J. 474:4153–4170. 2017. View Article : Google Scholar : PubMed/NCBI
|
|
35
|
Khoo KH, Verma CS and Lane DP: Drugging the p53 pathway: Understanding the route to clinical efficacy. Nat Rev Drug Discov. 13:217–236. 2014. View Article : Google Scholar : PubMed/NCBI
|
|
36
|
Guo R, Li L, Su J, Li S, Duncan SE, Liu Z and Fan G: Pharmacological activity and mechanism of tanshinone IIA in related diseases. Drug Des Devel Ther Nov. 14:4735–4748. 2020. View Article : Google Scholar : PubMed/NCBI
|
|
37
|
Livak KJ and Schmittgen TD: Analysis of relative gene expression data using real-time quantitative PCR and the 2(-Delta Delta C(T)) method. Methods. 25:402–408. 2001. View Article : Google Scholar : PubMed/NCBI
|
|
38
|
Mayo LD and Donner DB: A phosphatidylinositol 3-kinase/Akt pathway promotes translocation of Mdm2 from the cytoplasm to the nucleus. Proc Natl Acad Sci USA. 98:11598–11603. 2001. View Article : Google Scholar : PubMed/NCBI
|
|
39
|
Giaccia AJ and Kastan MB: The complexity of p53 modulation: Emerging patterns from divergent signal. Genes Dev. 12:2973–2983. 1998. View Article : Google Scholar : PubMed/NCBI
|
|
40
|
Cory S and Adams JM: The Bcl2 family: Regulators of the cellular life-or-death switch. Nat Rev Cancer. 2:647–656. 2002. View Article : Google Scholar : PubMed/NCBI
|
|
41
|
Burchert A, Wang Y, Cai D, von Bubnoff N, Paschka P, Müller-Brüsselbach S, Ottmann OG, Duyster J, Hochhaus A and Neubauer A: Compensatory PI3-kinase/Akt/mTor activation regulates imatinib resistance development. Leukemia. 19:1774–1782. 2005. View Article : Google Scholar : PubMed/NCBI
|
|
42
|
Quentmeier H1, Eberth S, Romani J, Zaborski M and Drexler HG: BCR-ABL1-independent PI3Kinase activation causing imatinib-resistance. J Hematol Oncol. 4:62011. View Article : Google Scholar : PubMed/NCBI
|
|
43
|
Moll UM and Petrenko O: The MDM2-p53 interaction. Mol Cancer Res. 1:1001–1008. 2003.PubMed/NCBI
|


