Introduction
The nuclear membrane is a phospholipid bilayer composed of outer and inner nuclear membranes, and the former is connected to endoplasmic reticula (1). Beneath the inner nuclear membrane, the nuclear lamina meshwork structure is formed to give the nucleus strength and elasticity (2). The nuclear lamina is composed of intermediate filaments (Lamin A, B or C) (3). It has been reported that nuclear shape abnormalities are more frequently observed in mouse embryonic fibroblasts featuring Lamin A deletion than those featuring deletion of Lamin B or C (4). Therefore, it is suggested that Lamin A plays a particularly important role in maintaining nuclear morphology. In addition to Lamin A, the inner nuclear membrane-localized transmembrane protein, emerin (5) and linker of nucleoskeleton and cytoskeleton complex, which links nuclear lamina to the cytoskeleton (2), are involved in maintaining the nuclear morphology (1). Clinically, Emery-Dreifuss muscular dystrophy is caused by mutations of Lamin A/C or emerin (5). Lammerding et al (6) reported that mouse embryonic fibroblasts featuring Lamin A/C or emerin deletion exhibit enlarged nuclei, irregular nuclear membranes and increased apoptosis due to their inability to withstand mechanical stimulation, explaining myocyte damage in Emery-Dreifuss muscular dystrophy.
Nuclear morphological anomalies are important findings for the pathological diagnosis of malignancy, and the nuclear morphological characteristics of cancer vary based on subtype (2). For example, in lung biopsies, the nuclear morphology of small-cell carcinoma is easily changed and destroyed (7). In addition, it has been reported that Lamin A expression is defective in small-cell lung cancer cell lines (8), and this structural change in the nuclear membrane may contribute to nuclear fragility (7).
Most ovarian cancers are epithelial tumors, and there are four major histological subtypes, serous carcinoma (SCa), clear cell carcinoma (CCCa), endometrioid carcinoma (EMCa) and mucinous carcinoma (MUCa) (9). SCas are divided into high-grade serous carcinoma (HGSCa) and low-grade serous carcinoma, whereby most SCa lesions are HGSCa (10). Marked nuclear atypia is observed in HGSCa, and nuclear atypia is also observed in CCCa (11). Although Capo-chichi et al observed decreased Lamin A/C or emerin expression in ovarian cancer tissues, they did not specify the tumor subtypes in the manuscript (12). Ovarian cancer cell lines display an abnormal nuclear shape when Lamin A/C or emerin expression is suppressed by small interfering (si)RNA (12,13). Furthermore, it has been reported that downregulated Lamin A expression, but not Lamin C, in ovarian cancer tissues, including SCa and non-SCa, is associated with cancer metastasis and poor prognosis (14). Thus, it is suggested that Lamin A has a more important role compared with Lamin C in ovarian carcinogenesis. However, the correlation between nuclear atypia and Lamin A or emerin expression in each histological subtype remains unknown.
The present study performed computer-assisted image analysis (CAIA) to assess the correlation between nuclear morphology and Lamin A and emerin expression in 140 ovarian cancer specimens, covering all four subtypes.
Materials and methods
Ovarian cancer cases
A total of 140 formalin-fixed [neutral buffered formalin solution containing 3.7% formaldehyde at room temperature (RT) for 24–48 h], paraffin-embedded (FFPE) tissues were collected from patients with ovarian cancer following surgical resection at Gunma University Hospital between January 2005 and December 2018. FFPE tissues were stored at RT until subsequent experimentation. Cancer specimens were selected using the electronic health record. The clinicopathological characteristics of the patients included in the present study are summarized in Table I. The cases were classified as per the tumor-node-metastasis classification (8th edition) and International Federation of Gynecology and Obstetrics (FIGO) classification for staging ovarian cancer (2014) (15).
 |
Table I.
Clinicopathological characteristics of patients in the present study.
|
Table I.
Clinicopathological characteristics of patients in the present study.
| |
Subtype |
| |
|
| Characteristic |
High grade serous carcinoma (n=38) |
Clear cell serous carcinoma (n=63) |
Endometrioid carcinoma (n=25) |
Mucinous carcinoma carcinoma (n=14) |
| Mean age ± SD, years |
60.4±8.6 |
56.2±7.6 |
50.9±12.8 |
44.9±16.2 |
| FIGO stage |
|
|
|
|
| I |
5 |
48 |
19 |
12 |
| II |
5 |
7 |
5 |
1 |
| III |
24 |
7 |
1 |
1 |
| IV |
4 |
1 |
0 |
0 |
| Tumor progress level |
|
|
|
|
| pTX |
0 |
0 |
0 |
0 |
| pT0 |
0 |
0 |
0 |
0 |
| pT1 |
5 |
49 |
19 |
12 |
| pT2 |
7 |
7 |
6 |
1 |
| pT3 |
26 |
7 |
0 |
1 |
| Regional lymph nodes |
|
|
|
|
| pNX |
20 |
11 |
7 |
5 |
| pN0 |
12 |
48 |
17 |
8 |
| pN1 |
6 |
4 |
1 |
1 |
| Distant metastasis |
|
|
|
|
| MX |
23 |
37 |
15 |
6 |
| M0 |
11 |
25 |
10 |
8 |
| M1 |
4 |
1 |
0 |
0 |
The present study was approved by the Gunma University Ethical Review Board for Medical Research Involving Human Subjects (Maebashi, Japan; approval no. HS2019-49).
Hematoxylin and eosin (H&E) staining
FFPE sections (4-µm-thick) were prepared, deparaffinized in xylene for 5 min (three times) and hydrophilized with 100% ethanol for 1 min (twice), 95% ethanol for 1 min and 70% ethanol for 1 min, followed by rinsing under running water for 1 min. The specimens were subsequently stained with hematoxylin solution (New Hematoxylin Type M; cat no. 30141; Muto Pure Chemicals Co., Ltd.) for 10 min at RT. The specimens were washed under running water for 10 min and subsequently stained with eosin solution (New Eosin Type M; cat. no. 32081; Muto Pure Chemicals Co., Ltd.) for 3 min at RT. The specimens were rinsed in water, dehydrated in 70, 95 and 100% ethanol for 30 sec (twice), and suspended in xylene for 5 min (three times). The specimens were mounted with mounting medium (Malinol; cat. no. 20093; Muto Pure Chemicals Co., Ltd.) and covered with cover glass. The specimens were observed under an optical microscope (BX-51 optical microscope; Olympus Corporation) to classify the four histological subtypes of ovarian cancer.
Immunohistochemical staining
FFPE sections (4-µm-thick) were prepared, deparaffinized and hydrophilized as aforementioned. The specimens were rinsed under running water for 1 min, followed by distilled water (DW). Primary antibodies against: Estrogen receptor α (Erα; 1:400; clone SP-1; rabbit monoclonal; cat. no. ab16660; Abcam), cytokeratin 20 (CK20; 1:400; clone Ks 20.8; mouse monoclonal; cat. no. ab854; Abcam), hepatocyte nuclear factor-1-β (HNF-1β; 1:500; clone CL0374; mouse monoclonal; cat. no. ab236759; Abcam), vimentin (VIM; 1:500; clone V9; mouse monoclonal; cat. no. ab8069; Abcam), Wilms tumor (WT-1; 1:100; clone 6F-H2; mouse monoclonal; cat. no. ab233984; Abcam), anti-Lamin A (1:500; clone 133A2; mouse monoclonal; cat. no. ab8980; Abcam) and anti-emerin (1:500; clone CL0201; mouse monoclonal; cat. no. NBP2-52876; Novus Biologicals, LLC) were used for immunohistochemical staining. For antigen retrieval for ERα, CK20, HNF-1β, VIM, Lamin A and emerin, the specimens were placed in an electric pot containing 200-fold diluted Immunosaver in DW at RT (Nisshin EM Co., Ltd.). The specimens were subsequently heated in the electric pot to 98°C, incubated for 40 min and left inside the electric pot for 30 min. The specimens were washed in PBS for 5 min (three times). For antigen retrieval for WT-1, the specimens were placed in an electric pot containing Tris-EDTA buffer (pH 9.0; Abcam) at RT. The specimens were subsequently heated in the electric pot to 98°C and incubated for 40 min. Subsequently, 200 ml of heated antigen retrieval solution were poured into a heat-resistant container on the bench, the specimens were placed in the container and incubated for 60 min for gradual cooling. Specimens were rinsed under running water for 1 min and washed with PBS for 5 min. Following antigen retrieval, antibody staining was performed using an automated immunostainer (Histostainer 36A; Nichirei Biosciences). To block endogenous peroxidase, specimens were treated with hydrogen peroxide water in the Histostainer (code, 715242; Nichirei Bioscience) for 5 min at RT. After washing in PBS (code, 715224; Nichirei Bioscience), the specimens were incubated with 2% goat serum in PBS for 15 min at RT. The specimens were incubated with primary antibodies (clone SP-1, clone Ks 20.8, clone CL0374, clone V9, clone 6F-H2, clone 133A2, and clone CL0201) for 60 min at RT. After washing with PBS, specimens were incubated with peroxidase-labeled polymer conjugated mouse IgG polyclonal antibody in the Histostainer [Histofine Simple Stain MAX-PO(M), code, 724132; Nichirei Bioscience] or peroxidase-labeled polymer conjugated rabbit IgG polyclonal antibody [Histofine Simple Stain MAX-PO(R), code, 724142; Nichirei Bioscience], which were pre-diluted for concentration of use, for 30 min at RT. Development was performed using the DAB Substrate kit (code, 725191; Nichirei Bioscience) for 10 min, and nuclear staining was performed using Meyer Hematoxylin (code, 715081; Nichirei Bioscience) for 1 min at RT. After washing with DW, the specimens were removed from the immunostainer, dehydrated, permeated and mounted for observation under an optical microscope (Olympus BX51; Olympus Corporation).
Evaluation of histological subtype
H&E stained and immunohistochemically stained specimens (ERα, WT-1, HNF-1β, VIM and CK20) were used to determine the histological subtype of the tumor. Initially, two pathologists (MS and HI) independently determined the histological subtype. Cases where the two pathologists disagreed were evaluated by a third pathologist (HY), and the histological subtype determined by the three pathologists was used as the final histological subtype for grouping in the present study.
Feulgen staining
Specimens were deparaffinized and hydrophilized as aforementioned and subsequently washed with DW. After rinsing the specimens with 5N HCl (Wako Pure Chemicals) for 1 min at RT, they were incubated with prewarmed 5N HCl in a water bath at 30°C for 40 min to remove the purine bases of DNA. Specimens were rinsed with cold Schiff reagent (cat. no. 40932; Muto Pure Chemicals) twice for 2 min each, followed by staining with cold Schiff reagent for 90 min at RT. To stop the reaction, specimens were treated with sulfurous acid solution (cat. no. 40941; Muto Pure Chemicals) twice for 2 min each, followed by washing under running water for 5 min. The specimens were dehydrated, permeated and mounted for observation (Olympus BX51; Olympus Corporation).
Whole-slide imaging
Whole-slide images of anti-Lamin A antibody-, anti-emerin antibody- and Feulgen-stained specimens were taken using a Virtual Slide Scanner (Nano Zoomer-SQ; C13140-01; Hamamatsu Photonics K.K.). The scanning conditions were as follows: Objective lens, 20× N.A. 0.75; scan mode, 40×; maximum capture size, 26×76 mm; pixel size, 0.23 µm/pixel; light source, light emitting diode; image storage format, JPEG; and focus mode, auto focus mode.
CAIA
For CAIA of Feulgen-stained specimens, five randomly selected 40× fields of whole-slide images were saved as TIFF files, which were processed using Irfanview (ver. 4.28; http://www.irfanview.com) and Slide converter (3DHISTECH; ver. 1.14) for image conversion. Image analysis was performed using the Quant center module of Panoramic viewer (3DHISTECH). First, the annotation function was used to specify the tumor area. Subsequently, the images were analyzed under different conditions depending on the depth of nuclear color. Details of the analysis conditions are summarized in Table SI. The individually recognized nuclear areas were evaluated manually, and aggregated nuclei, nuclear areas containing non-nuclear regions, partially recognized nuclei, and nuclei that were not recognized as whole nuclei due to their localization in image borders were manually excluded from the data analysis. A brief overview of the data elimination process is presented in Fig. S1. Thus, an area correctly recognized as a single nucleus was selected for data analysis. The datasets obtained by the software represent the area, perimeter and shape factor of the nucleus. Shape factor was calculated using the following formula: Shape factor = 4 × PI × area/(perimeter)2. The value ranged from 0–1, where 1 indicated a precise circle (16). Given that the micrometers per pixel processed by the slide converter were 0.504 for both the x- and y-axes, and TIFF files of whole-slide images were 101,000 mm2/2,010,624 pixels, the data obtained by the Quant center module were adjusted by dividing the area data (nuclear area) of the Quant center module by 5.056739267 and the length data (nuclear perimeter) of the module by 2.248719473. A schematic explanation of the process for exact nuclear area and perimeter calculation is presented in Fig. S2.
To analyze Lamin A- and emerin-stained specimens, five randomly selected 40× fields of whole-slide images were saved as JPEG files, which were analyzed using the nuclear membrane staining-specific software e-Nucmem (ver. 1.4; E-path Co. Ltd.; http://e-pathjp.com) to identify positive (nuclear membrane staining was recognized as positive) and negative staining (nuclei stained with hematoxylin).
The settings for Lamin A were as follows: Positive nuclear membrane staining intensity, level 5 (range, 0–20); negative nuclear membrane staining intensity, level 0 (range, 0–20); minimum nuclear area, 300 pixels and nuclear membrane staining width, 162 (range, 0–255). The settings for emerin were as follows: Positive nuclear membrane staining intensity, level 5; negative nuclear membrane staining intensity, level 4; minimum nuclear area, 300 pixels and nuclear membrane staining width, 162. After measuring the whole area, the tumor area was selected using the annotation function, and the data of the tumor area alone were collected.
Statistical analysis
All statistical analyses were performed using JMP Pro ver. 15 software (SAS Institute, Inc.). For correlation analysis, linear regression analysis was performed. Correlation coefficients (R) were categorized as follows: 0.200–0.399, weak correlation; 0.400–0.699, moderate correlation and ≥0.7, strong correlation (17). The Steel-Dwass test was used for nonparametric multiple pairwise comparisons between two groups for four histological types. For the Steel-Dwass test, P-values were calculated using the optimal asymptotic test. Welch's dispersion analysis was used to compare patient age based on tumor subtypes. Fisher's exact test was used to compare FIGO stage based on tumor subtypes. P<0.05 was considered to indicate a statistically significant difference.
Results
Histological classification and clinicopathological characteristics of ovarian cancer lesions
Ovarian cancer tissue specimens from 140 patients were assessed via H&E staining in combination with immunohistochemical staining to determine the histological subtype. The histological classification of the 140 specimens was as follows: 38 cases of HGSCa, 63 cases of CCCa, 25 cases of EMCa and 14 cases of MUCa. As summarized in Table I, the age at the time of surgery was 60.4±8.6 years for HGSCa, 56.2±7.6 years for CCCa, 50.9±12.8 years for EMCa and 44.9±16.2 years for MUCa. Given that the Welch's dispersion analysis revealed significant differences among the four groups (P=0.0012), the non-parametric Steel-Dwass test was used for multiple pairwise comparisons. The results demonstrated that patients with HGSCa were significantly older than those with EMCa or MUCa (P=0.0259 and P=0.0099, respectively), and that patients with CCCa were significantly older than those with MUCa (P=0.0298) (Fig. 1).
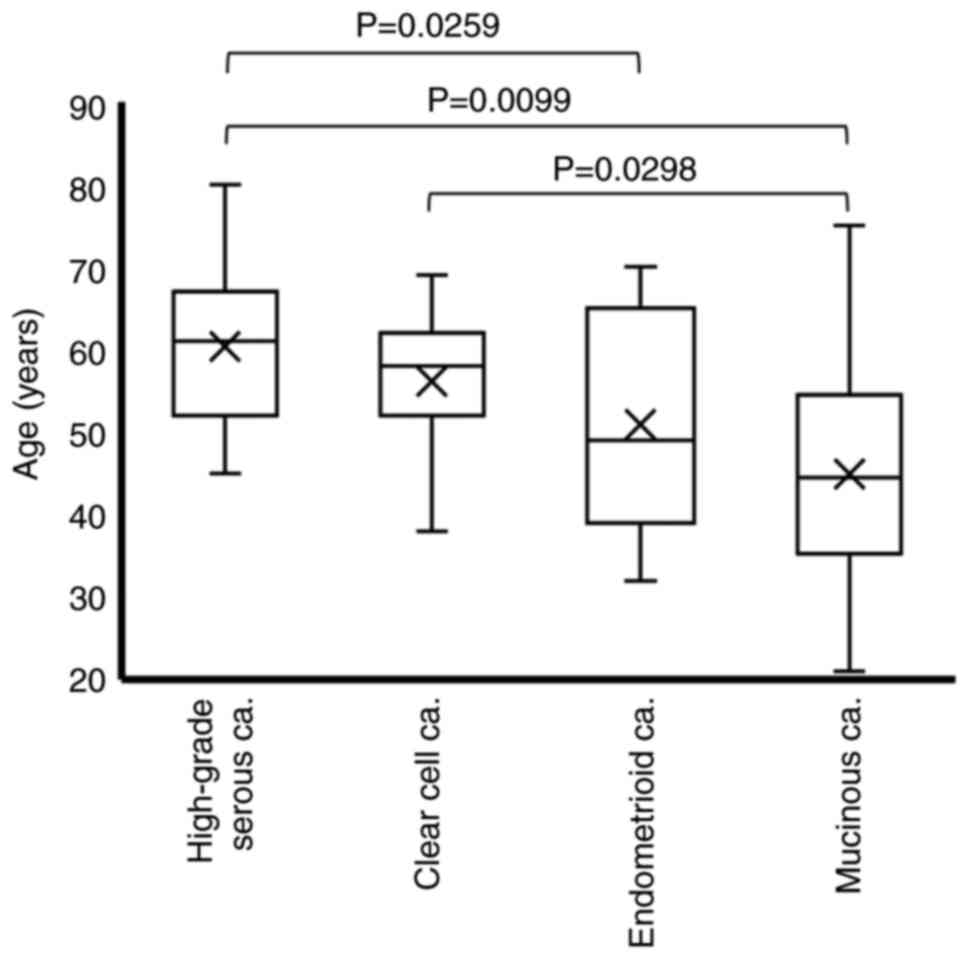 |
Figure 1.
Age distribution according to the histological subtype. Differences in age among the histological subtypes were analyzed via the Steel-Dwass test. ‘X’ indicates mean values and boxes with horizontal lines indicate medians with interquartile ranges. Error bars indicate maximum and minimum values. P-values were calculated using the optimal asymptotic test. ca, carcinoma.
|
The FIGO stage is presented in Table I. Stages III+IV were predominant in HGSCa, whereas stages I–II were predominant in the other tumor subtypes. Therefore, the patients with each tumor subtype were divided into low (FIGO I+II) and high (FIGO III+IV) groups, and a Fisher's exact test was performed. There was a statistically significant difference among the four tumor subtypes (P<0.0001; Table II). Taken together, these results suggest that the predominant FIGO stage is significantly different between HGSCa and the other tumor subtypes. Therefore, the present study analyzed patients by FIGO stage (low vs. high) and tumor subtype.
|
Table II.
Comparison of FIGO stage by tumor subtype.
|
Table II.
Comparison of FIGO stage by tumor subtype.
| Subtype |
Stage I+II n (%) |
Stage III+IV n (%) |
P-value |
Total n (%) |
| High-grade serous carcinoma |
10 (26.32) |
28 (73.68) |
P<0.0001 |
38 (100.00) |
| Clear cell carcinoma |
55 (87.30) |
8 (12.70) |
|
63 (100.00) |
| Endometrioid carcinoma |
24 (96.00) |
1 (4.00) |
|
25 (100.00) |
| Mucinous carcinoma |
13 (92.86) |
1 (7.14) |
|
14 (100.00) |
| Total |
102 (72.86) |
38 (27.14) |
|
140 (100.00) |
Nuclear area and perimeter are larger in CCCa and nuclear size variation is more prominent in HGSCa and CCCa
CAIA was performed for Feulgen-stained specimens to evaluate nuclear morphology according to tumor subtype. In the Feulgen-stained specimens, the nucleus was stained pink (Fig. 2). The present study examined whether nuclear morphology differed between low and high FIGO stages for each tumor subtype. Although it was not possible to compare nuclear morphological factors based on the FIGO stage in EMCa and MUCa due to the small number of patients with a high FIGO stage, there was no significant difference in nuclear morphology based on FIGO stage in HGSCa and CCCa (Table SII). The comparison of nuclear morphological factors as per tumor subtype is presented in Fig. 3. Practically, the mean nuclear area was 54.87±10.47 µm2 in HGSCa, 59.96±12.38 µm2 in CCCa, 49.52±6.29 µm2 in EMCa and 52.96±11.82 µm2 in MUCa (Fig. 3). There was a significant difference between EMCa and CCCa (P=0.0009), but no significant differences were observed among the other tumor subtypes (P-values are not shown). The mean nuclear perimeter was 31.75±3.70 µm in HGSCa, 33.01±4.20 µm in CCCa, 30.56±2.69 µm in EMCa and 30.85±2.96 µm in MUCa (Fig. 3). There was no significant difference among the other tumor subtypes (P-values are not shown). The mean nuclear shape factor was 0.68±0.06 in HGSCa, 0.68±0.05 in CCCa, 0.67±0.06 in EMCa, and 0.69±0.05 in MUCa, and there was no significant difference among the subtypes (P-values are not shown).
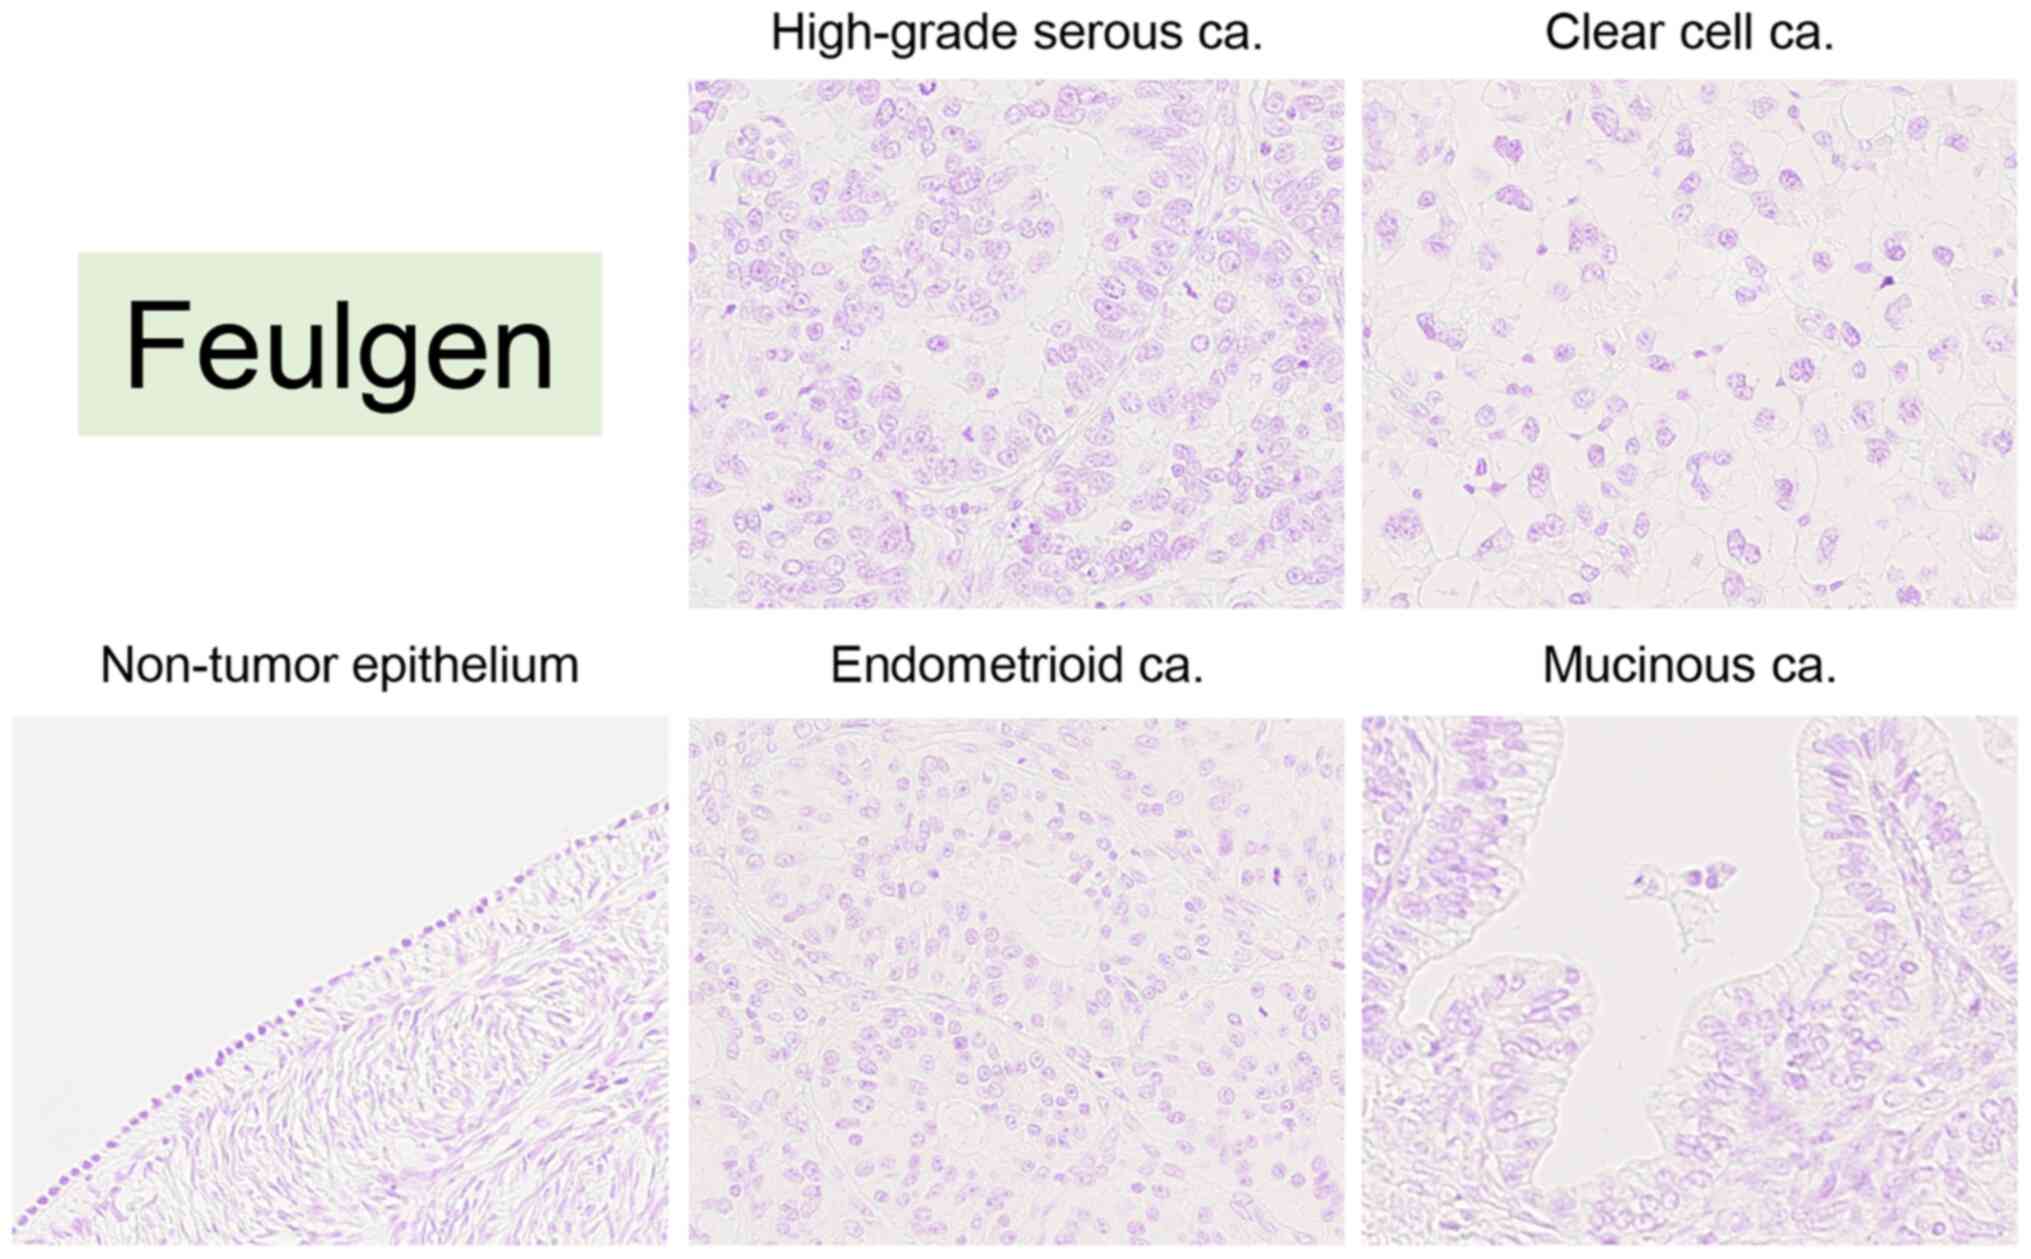 |
Figure 2.
Representative images of Feulgen staining in non-tumor ovarian epithelium (case #36), high-grade serous carcinoma (case #6), clear cell carcinoma (case #72), endometrioid carcinoma (case #126) and mucinous carcinoma (case #133). All images were saved as JPEG files from virtual slide data (magnification, ×40). ca, carcinoma.
|
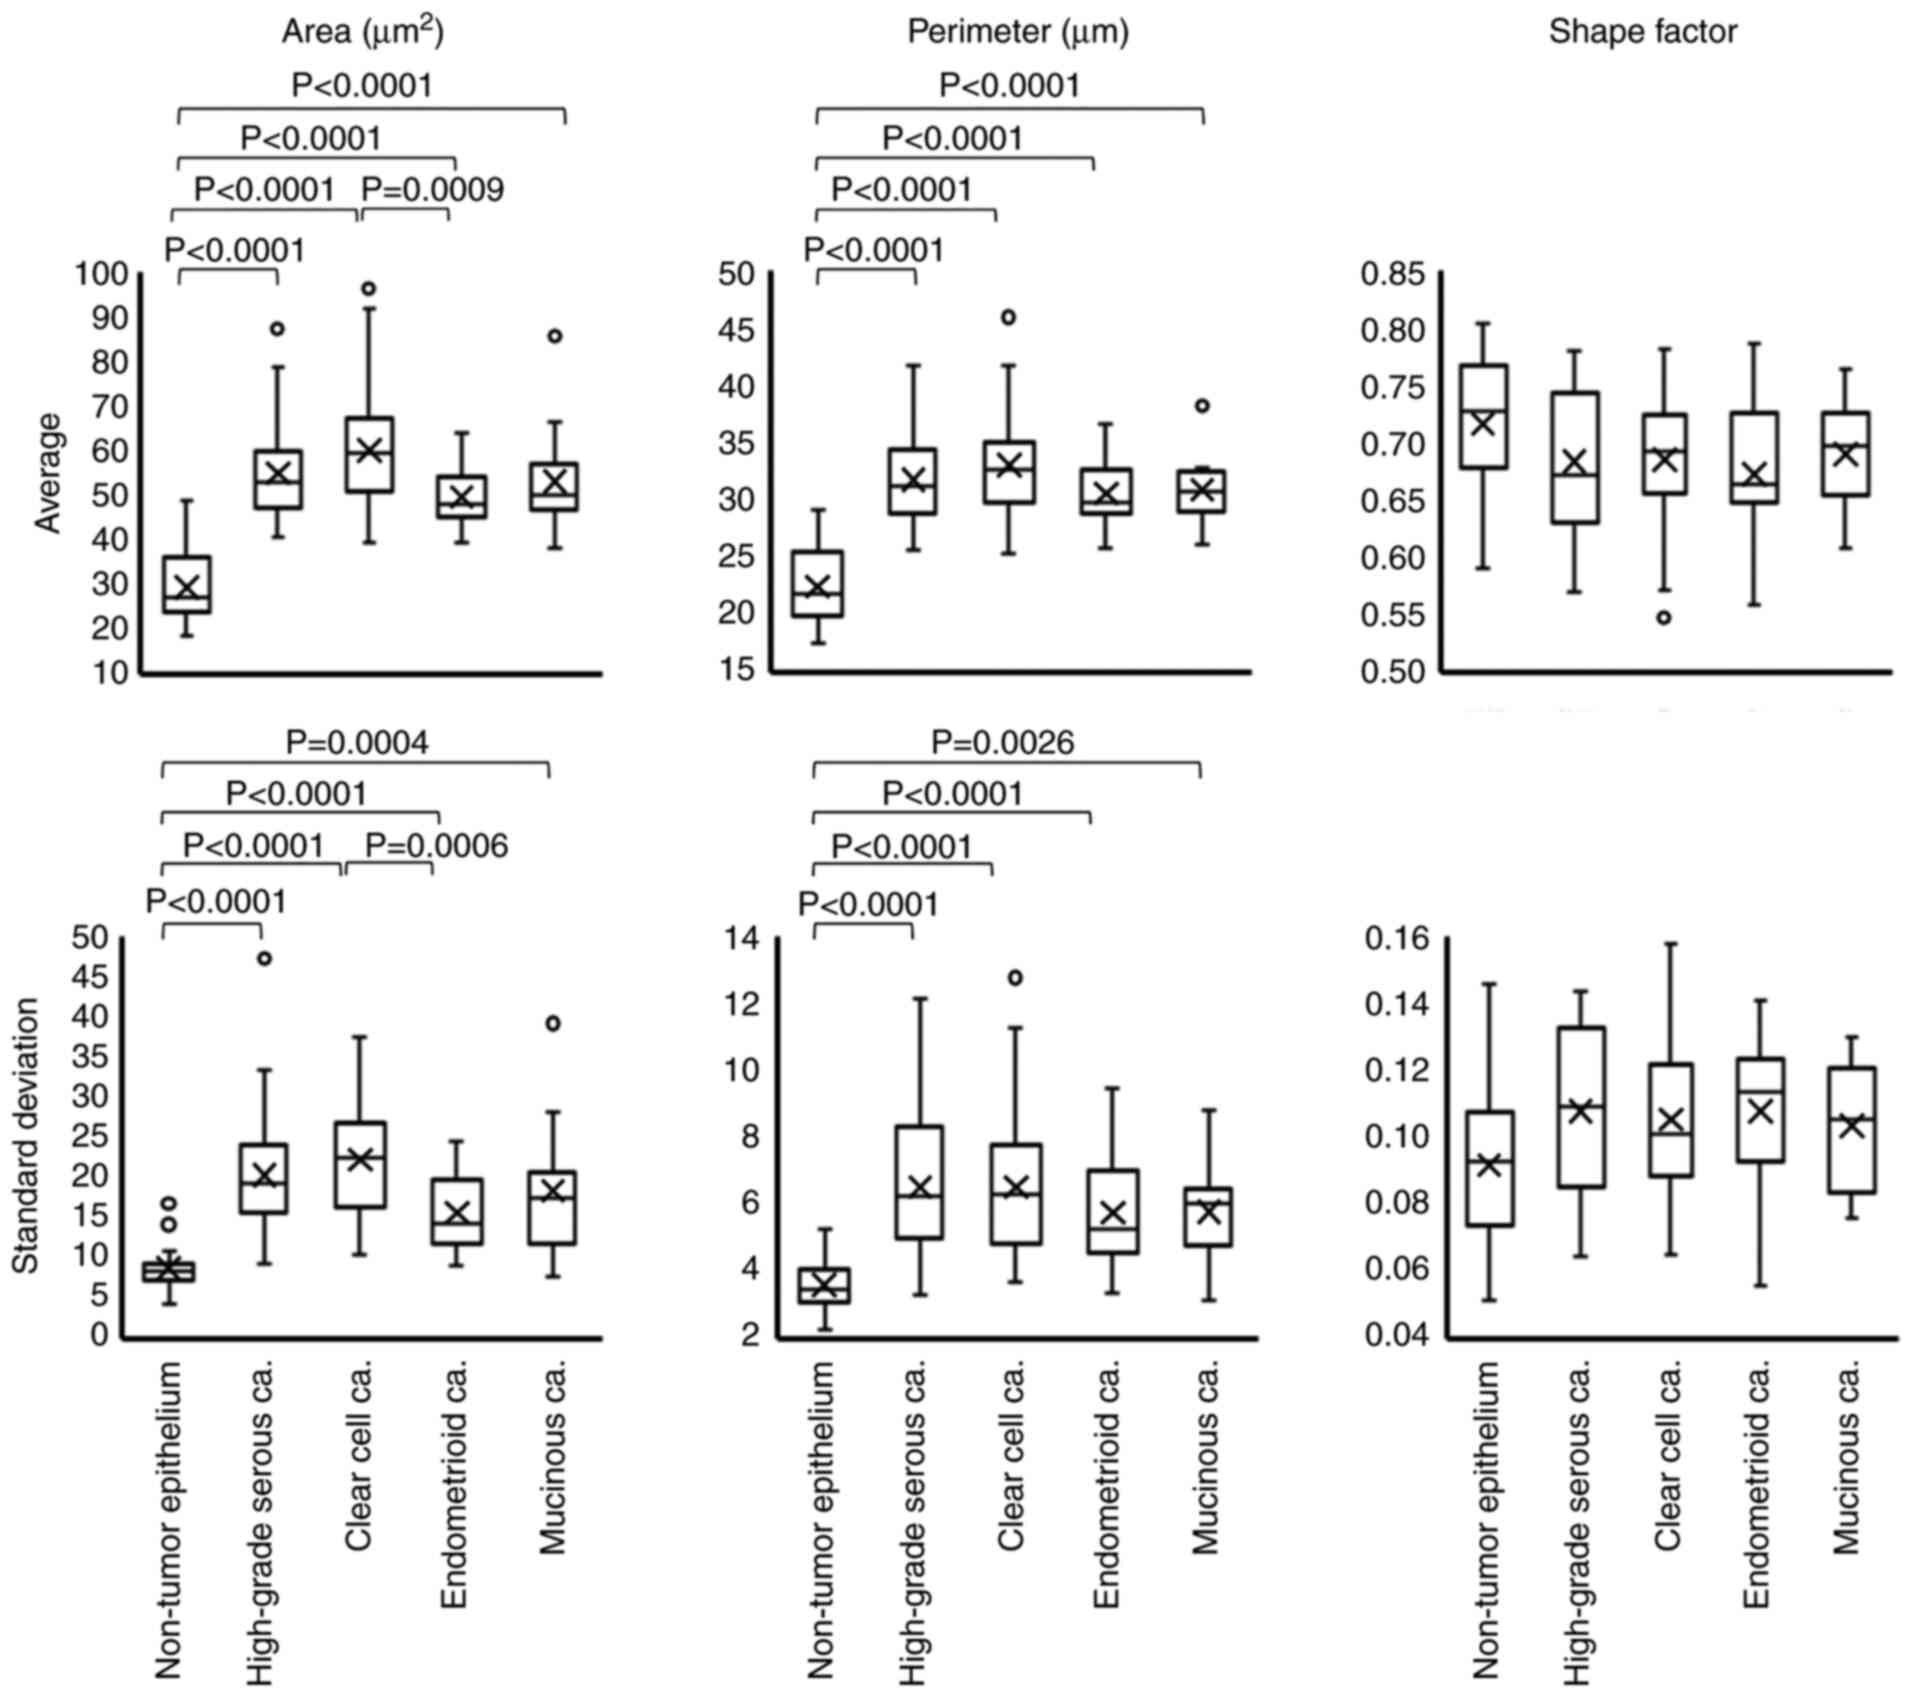 |
Figure 3.
Box plot of nuclear morphological parameters in each histological subtype. The examined nuclear morphological parameters were nuclear area, perimeter and shape factor. Differences in each factor among the histological subtypes were statistically analyzed via the Steel-Dwass test. ‘X’ indicates mean values and boxes with horizontal lines indicate medians with interquartile ranges. Error bars indicate maximum and minimum values. Circles indicate outliers. P-values were calculated using the optimal asymptotic test. ca, carcinoma.
|
Non-tumor ovarian surface epithelium (NTOSE) was also analyzed, which were present in 18/140 evaluated specimens. As presented in Fig. 3, all four tumor subtypes exhibited statistically significant differences in nuclear area and perimeter from those of NTOSE. The nuclear size variation was assessed using the SD of each factor. The SD of the nuclear area was 20.27±7.46 µm2 in HGSCa, 22.25±7.44 µm2 in CCCa, 15.59±4.52 µm2 in EMCa and 18.36±7.84 µm2 in MUCa (Fig. 3). There was a significant difference between CCCa and EMCa (P=0.0006) (Fig. 3). The SD of the nuclear perimeter was 6.51±2.00 µm in HGSCa, 6.52±1.94 µm in CCCa, 5.74±1.62 µm in EMCa and 5.79±1.55 µm in MUCa (Fig. 3), and there were no significant differences among the subtypes (P-values are not shown). The SD of nuclear shape factor was 0.11±0.03 in HGSCa, 0.11±0.02 in CCCa, 0.11±0.02 in EMCa and 0.10±0.02 in MUCa, and there were no significant differences among the subtypes (P-values are not shown).
Comparison of the NTOSE revealed statistically significant differences in the SD of nuclear area and of the perimeter of NTOSE among the four tumor subtypes (Fig. 3). Collectively, these results suggest that nuclear morphology is not affected by stage, and the nuclei were smaller in EMCa and larger in CCCa. In addition, the nuclear size variation was inconspicuous in EMCa but conspicuous in CCCa. Furthermore, these results suggest that the nuclei of all tumor cells are larger than those of NTOSE.
Correlation between nuclear shape factor and nuclear area or perimeter among tumor subtypes
The correlations between nuclear shape factor and nuclear area or perimeter were analyzed among the tumor subtypes. The results of linear regression analysis are presented in Fig. 4 and Table III. Nuclear shape factor was negatively correlated with nuclear area in HGSCa (R=−0.3451), CCCa (R=−0.4223) and EMCa (R=−0.2852), whereas the correlation was positive in MUCa (R=0.2207). In addition, nuclear shape factor was negatively correlated with nuclear perimeter in HGSCa (R=−0.7101), CCCa (R=−0.7041) and EMCa (R=−0.7477), but there was no significant correlation in MUCa (R=−0.1599).
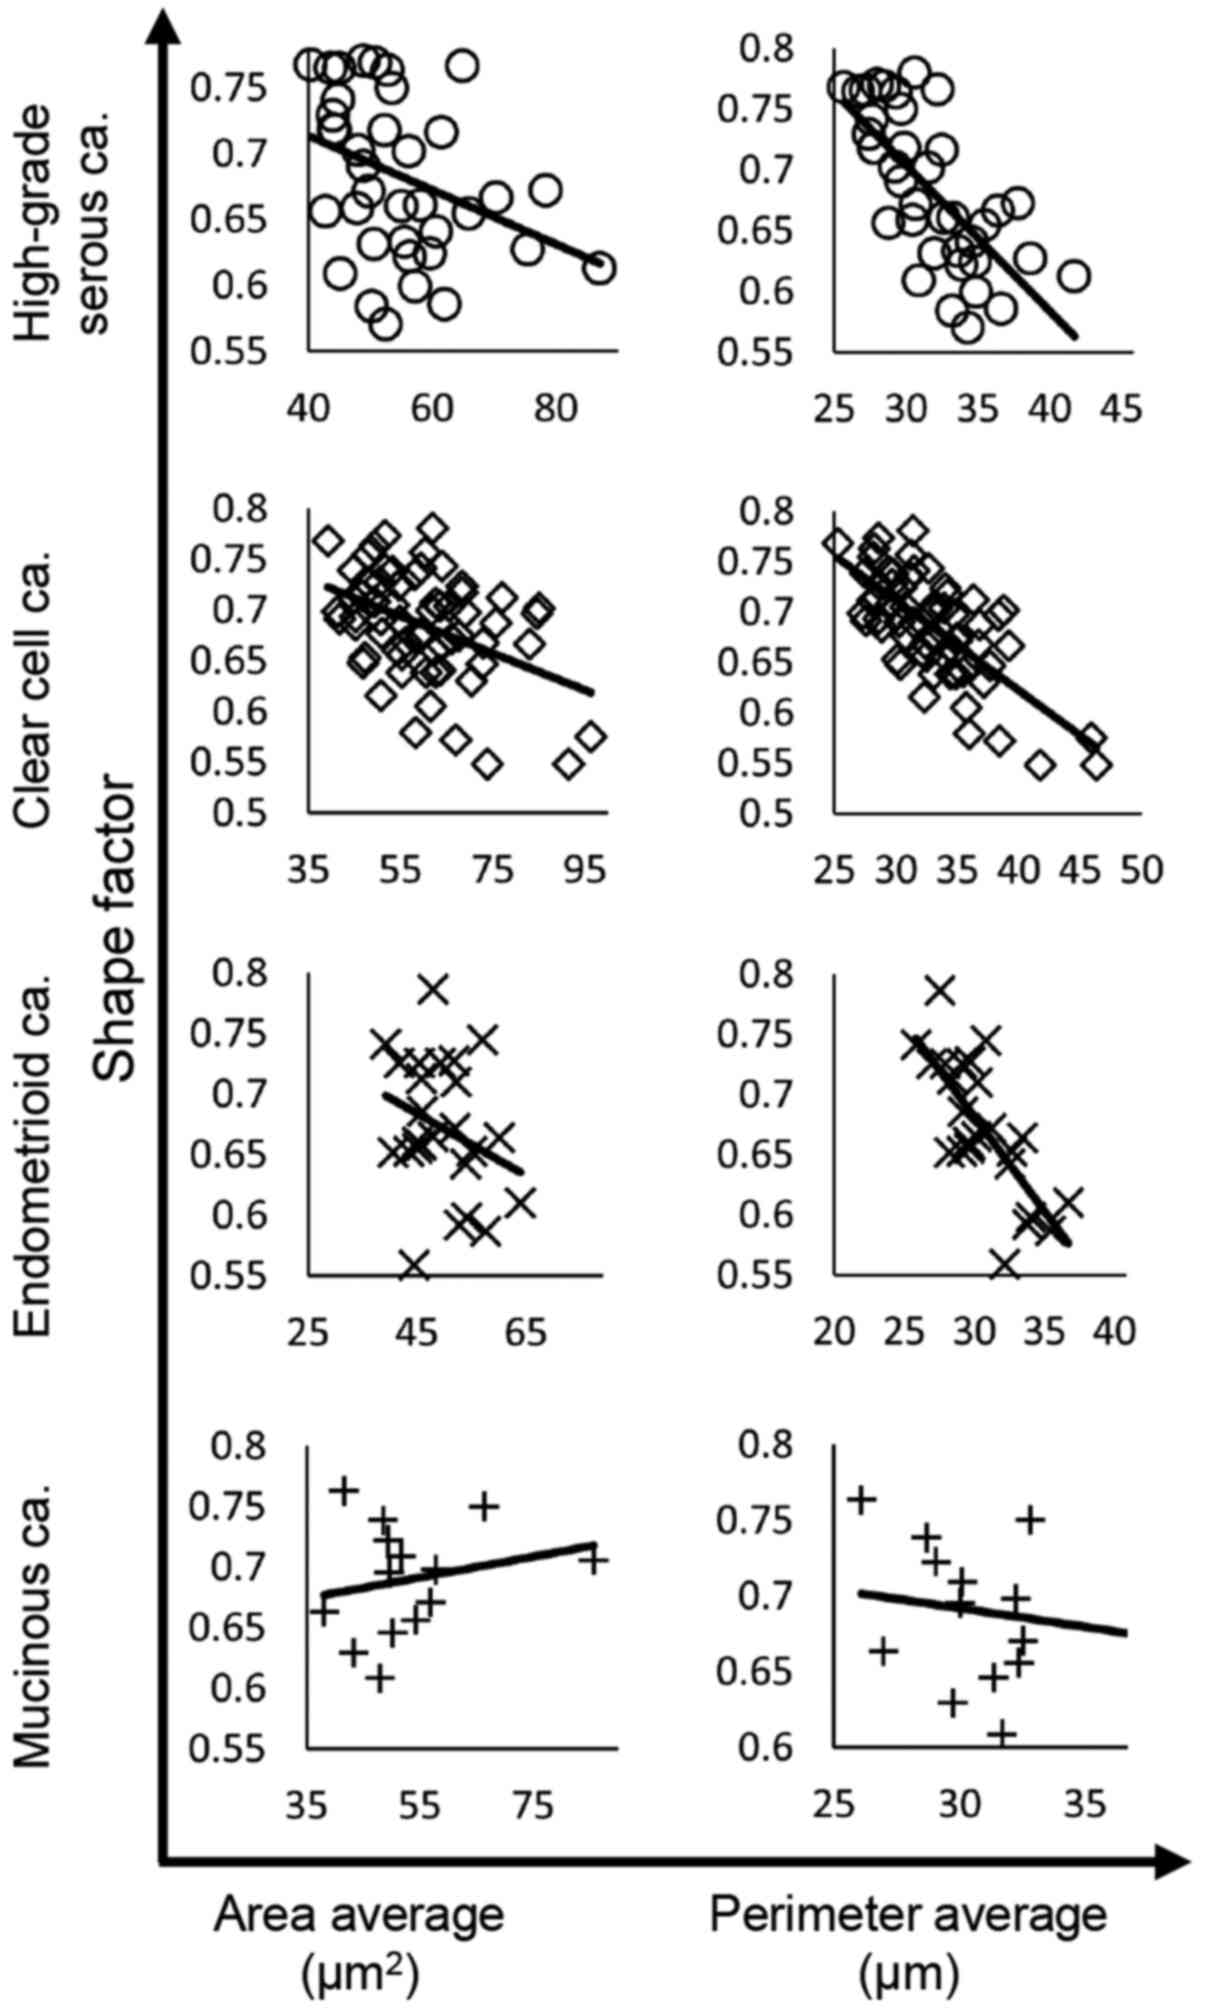 |
Figure 4.
Correlations between nuclear shape factor and nuclear area or perimeter in each histological subtype. The regression line is shown in all graphs. ca, carcinoma.
|
|
Table III.
Correlation between nuclear shape factor and nuclear area or perimeter according to histological subtype.
|
Table III.
Correlation between nuclear shape factor and nuclear area or perimeter according to histological subtype.
| |
Correlation with shape factor |
| |
|
| Subtype |
Area |
Perimeter |
| High-grade serous carcinoma |
−0.3451a |
−0.7101a |
| Clear cell carcinoma |
−0.4223a |
−0.7041a |
| Endometrioid carcinoma |
−0.2852a |
−0.7477a |
| Mucinous carcinoma |
0.2207a |
−0.1599 |
Taken together, these results suggest that the nuclear shape becomes disordered as the nucleus grows in HGSCa, CCCa and EMCa.
Lamin A expression is significantly lower in HGSCa, CCCa and EMCa compared with MUCa, and emerin expression is significantly lower in CCCa and EMCa compared with HGSCa and MUCa
The features of both Lamin A and emerin expression were assessed in 4 tumor subtypes and NTOSE. Before detecting the expression levels of both Lamin A and emerin, localization of the molecules was determined. The results of the present study confirmed that these molecules were localized in the nuclear membrane of cells in any tumor subtypes and NTOSE. Representative lamin A and emerin staining pattern was showed in Fig. 5. The present study investigated whether Lamin A and emerin expression differed between low and high FIGO stages in each tumor subtype. Although it was not possible to compare Lamin A and emerin expression by FIGO stage in EMCa and MUCa due to the small number of patients with high FIGO stages, there was no significant differences between their expression as per FIGO stage in HGSCa and CCCa (Table SIII).
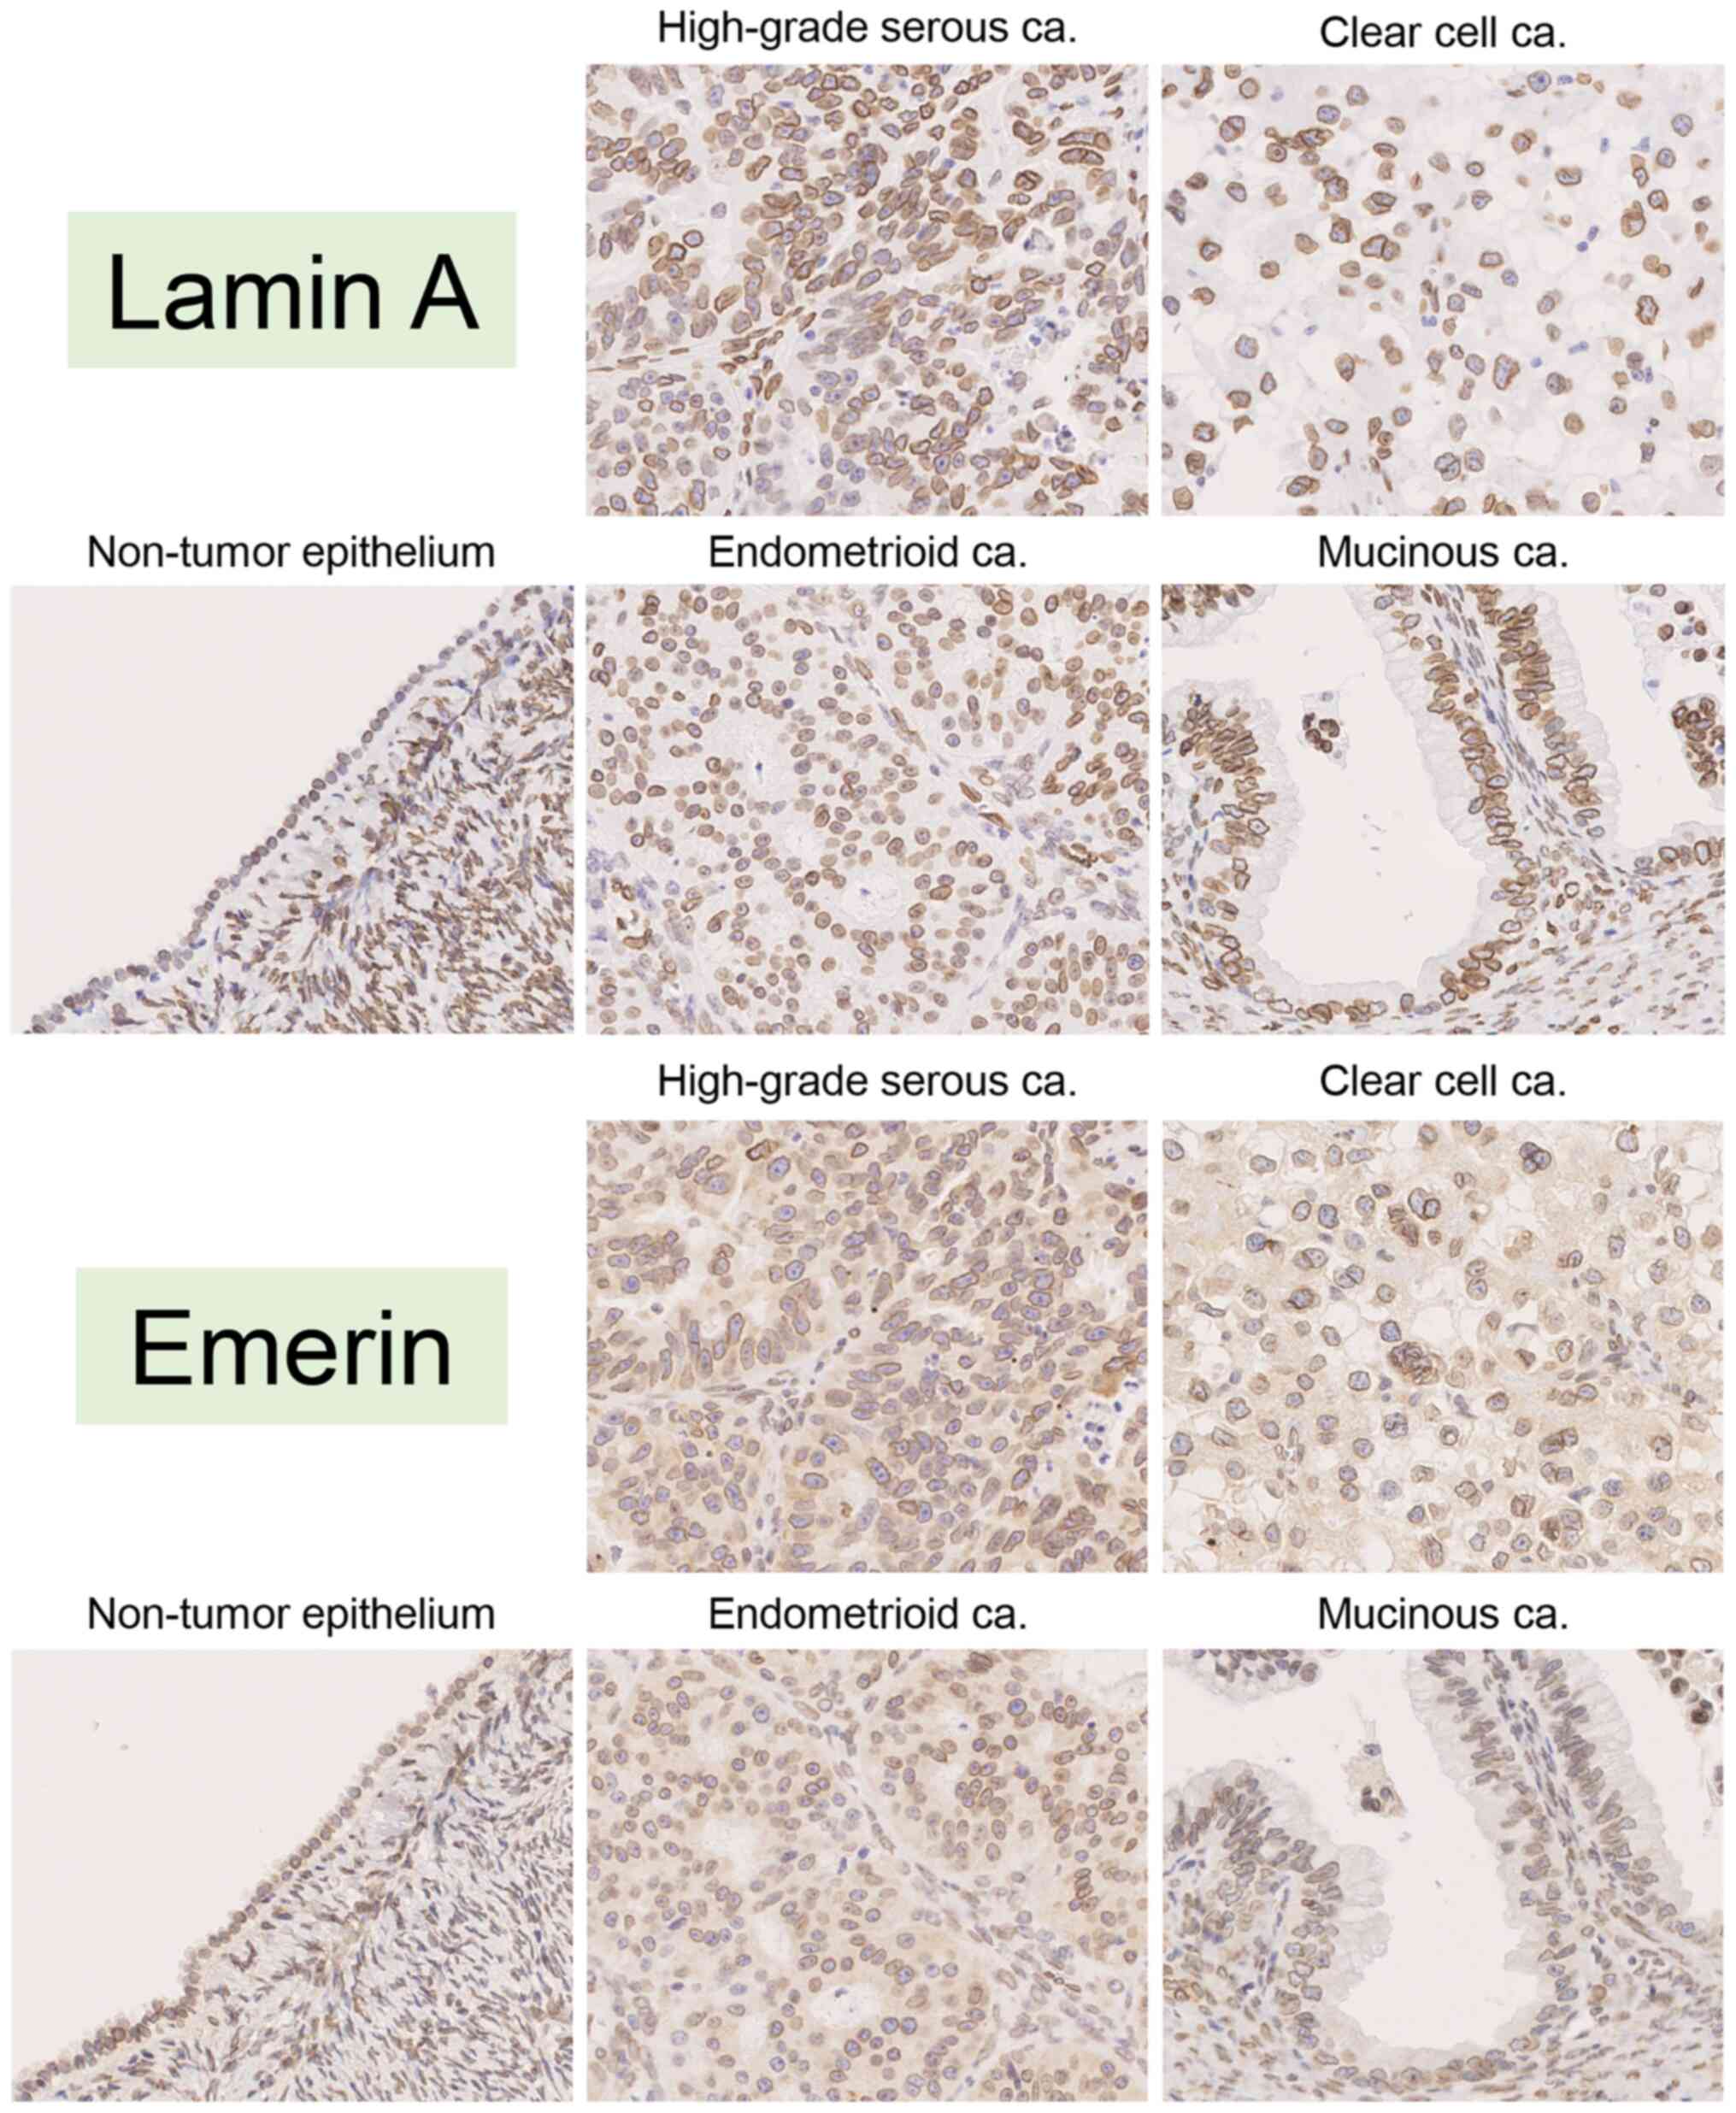 |
Figure 5.
Representative images of immunohistochemical staining for Lamin A and emerin in non-tumor ovarian epithelium (case #36), high-grade serous carcinoma (case #6), clear cell carcinoma (case #72), endometrioid carcinoma (case #126) and mucinous carcinoma (case #133). All images were saved as JPEG files from virtual slide data (magnification, ×40). ca, carcinoma.
|
Comparison of nuclear Lamin A and emerin expression among the tumor subtypes is presented in Fig. 6A and B. Practically, the percentage of Lamin A-positive nuclei was 58.50±26.00% in HGSCa, 49.09±23.45% in CCCa, 57.28±23.46% in EMCa and 88.17±11.55% in MUCa. The rate of nuclear Lamin A staining was significantly lower in HGSCa, CCCa and EMCa compared with MUCa (P<0.0001, P<0.0001 and P=0.0004, respectively; Fig. 6A). Conversely, the percentage of emerin-positive nuclei was 54.78±27.26% in HGSCa, 27.82±25.12% in CCCa, 29.69±27.18% in EMCa and 55.80±26.03% in MUCa. Furthermore, the rate of nuclear emerin staining was significantly lower in CCCa and EMCa compared with HGSCa and MUCa (HGSCa vs. CCCa, P<0.0001; HGSCa vs. EMCa, P=0.0073; CCCa vs. MUCa, P=0.0041 and EMCa vs. MUCa, P=0.0342; Fig. 6B).
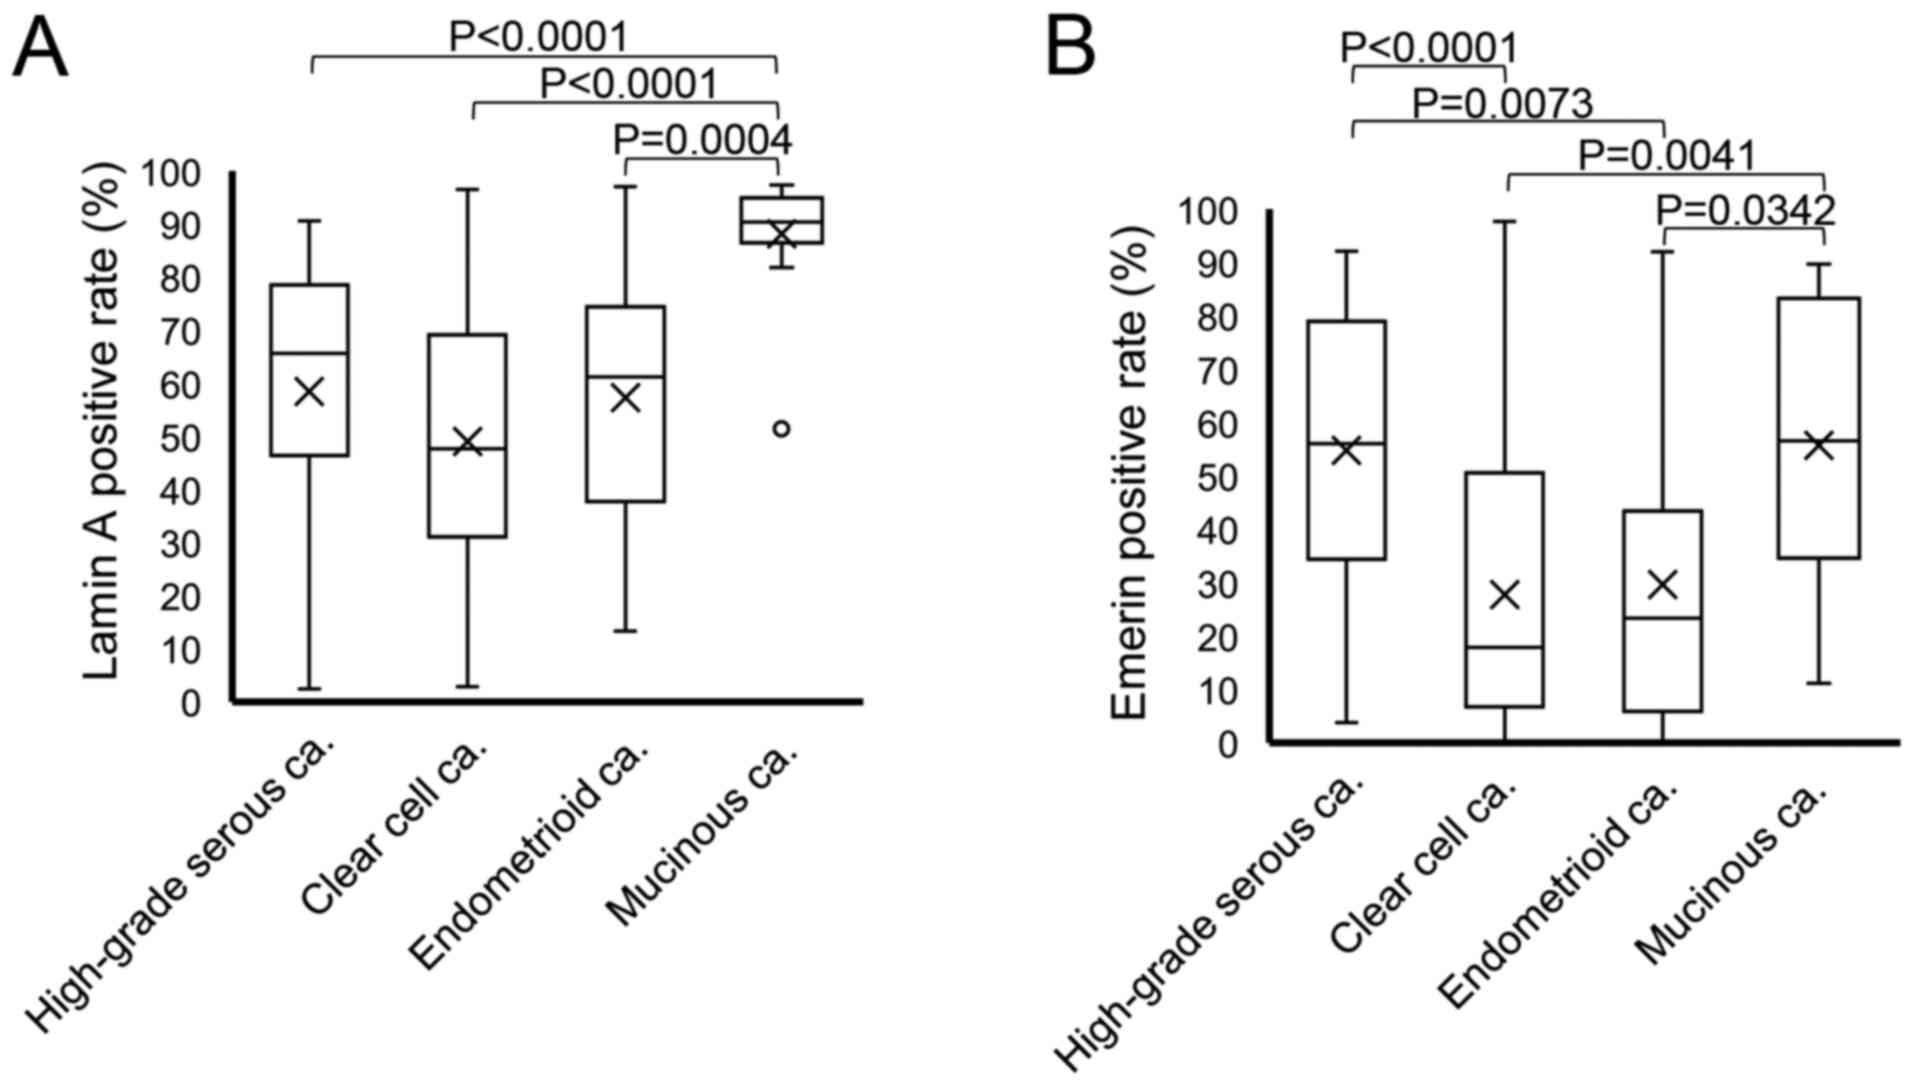 |
Figure 6.
Box plot of positivity for nuclear envelope proteins in each histological subtype. The rates of (A) Lamin A and (B) emerin positivity were compared among the histological subtypes via the Steel-Dwass test. ‘X’ indicates mean values and boxes with horizontal lines indicate medians with interquartile ranges. Error bars indicate the maximum and minimum values. Circles indicate outliers. P-values were calculated using the optimal asymptotic test. ca, carcinoma.
|
The presented study assessed the correlation between the rates of nuclear Lamin A and emerin staining. The results of linear regression analysis are presented in Fig. 7. The rates of Lamin A and emerin positivity were positively correlated in HGSCa (R=0.4507), CCCa (R=0.5275) and EMCa (R=0.5970) but there was no correlation in MUCa (R=0.1139).
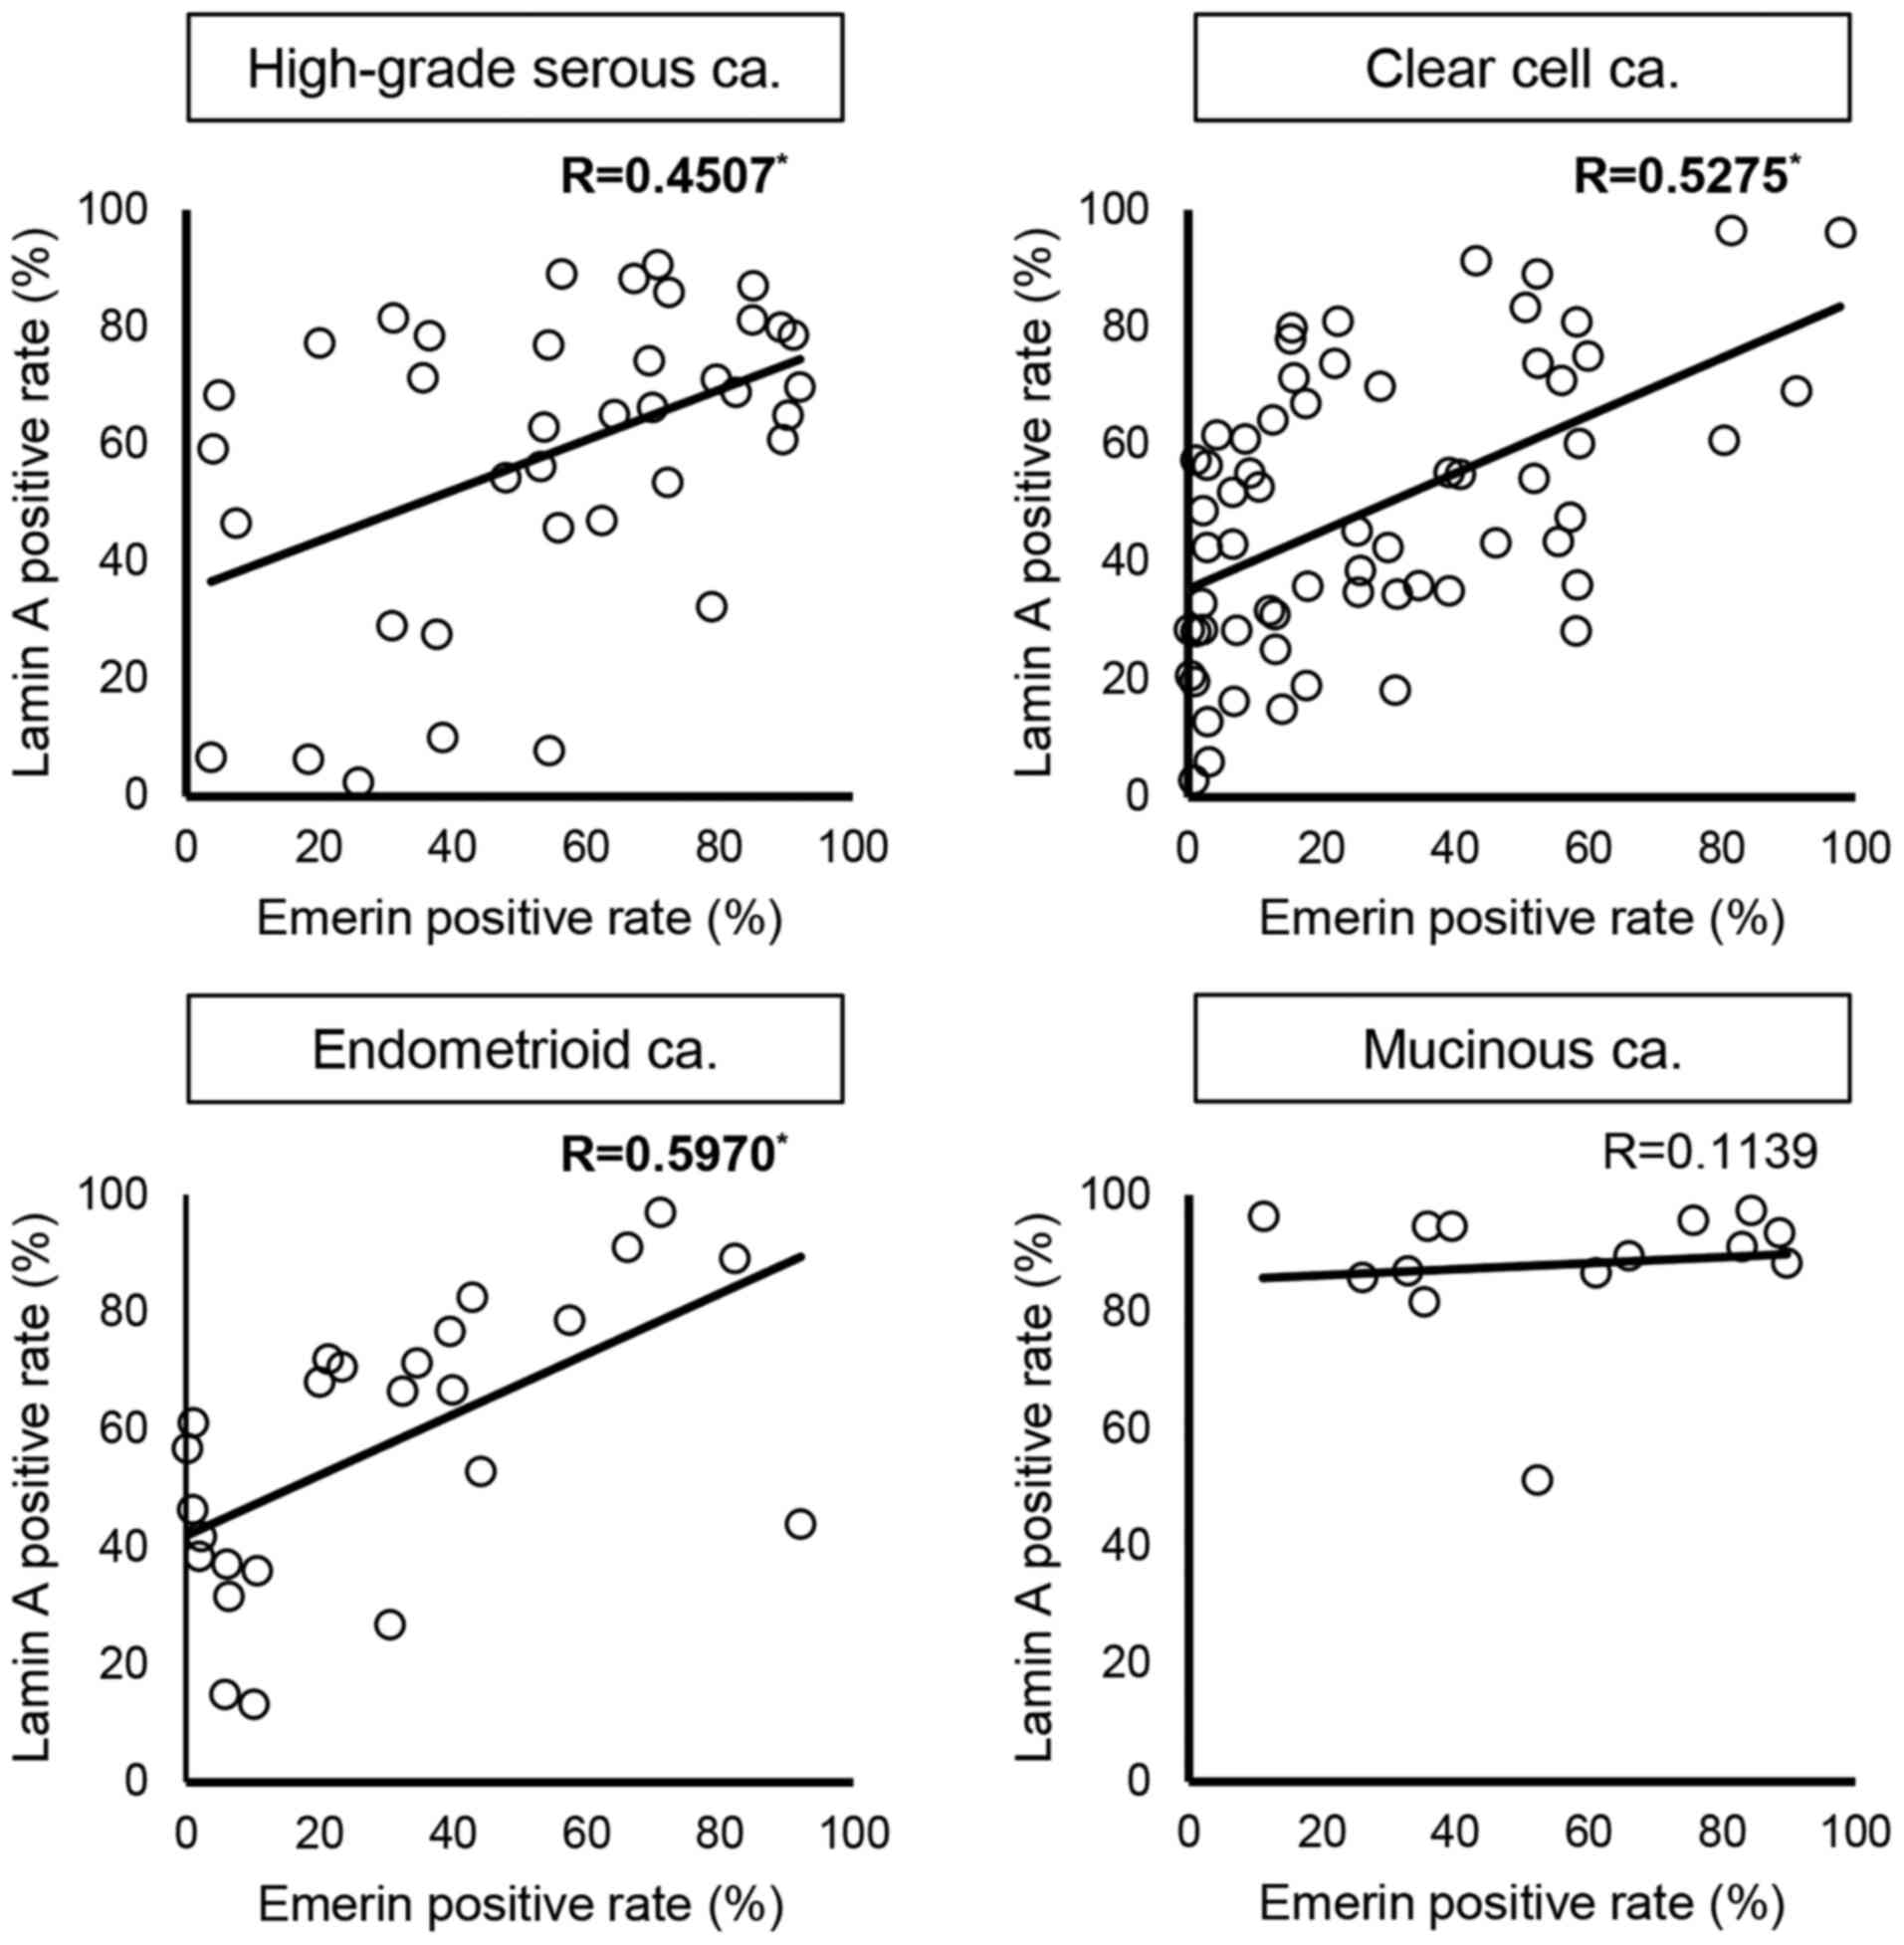 |
Figure 7.
Correlation between Lamin A and emerin positivity in each histological subtype. The regression line and ‘R’ are presented in each figure. Values with statistically significant correlations are highlighted in bold with asterisks. R is categorized as follows: 0.200–0.399, weak correlation; 0.400–0.699, moderate correlation and ≥0.7, strong correlation. R, correlation coefficient; ca. carcinoma.
|
Collectively, these results suggest that the rate of nuclear Lamin A or emerin staining is not affected by stage, and their expression varies according to tumor subtype in ovarian cancer.
Despite the synchronized Lamin A and emerin expression patterns, Lamin A is more strongly correlated with nuclear morphology compared with emerin in CCCa and EMCa
The present study further investigated the correlation between the rates of nuclear Lamin A and emerin positivity and nuclear morphology in the four tumor subtypes. The correlation of the rates of Lamin A or emerin positivity with nuclear area, perimeter, and shape factor in each tumor subtype were analyzed via linear regression analysis. The results of the analysis are presented in Fig. 8A for Lamin A and Fig. 8B for emerin. Practically, the correlation data of Fig. 8 are summarized in Table IV. In HGSCa, the rate of Lamin A positivity was negatively correlated with nuclear shape factor (R=−0.2079; Fig. 8 and Table IV). In CCCa, the rate of Lamin A positivity was positively correlated with nuclear area and perimeter (R=0.2855 and 0.2409, respectively; Fig. 8 and Table IV). The rate of Lamin A-positive nuclei was positively correlated with nuclear area and perimeter (R=0.2858 and 0.4054, respectively) and negatively correlated with nuclear shape factor (R=−0.3707) in EMCa; Fig. 8 and Table IV). In MUCa, the rate of Lamin A positivity was correlated with nuclear perimeter (R=0.2370; Fig. 8 and Table IV). Conversely, the rate of emerin-positive nuclei was only positively correlated with nuclear shape factor in HGSCa (R=0.2673), and with nuclear area in CCCa (R=0.3310; Fig. 8 and Table IV).
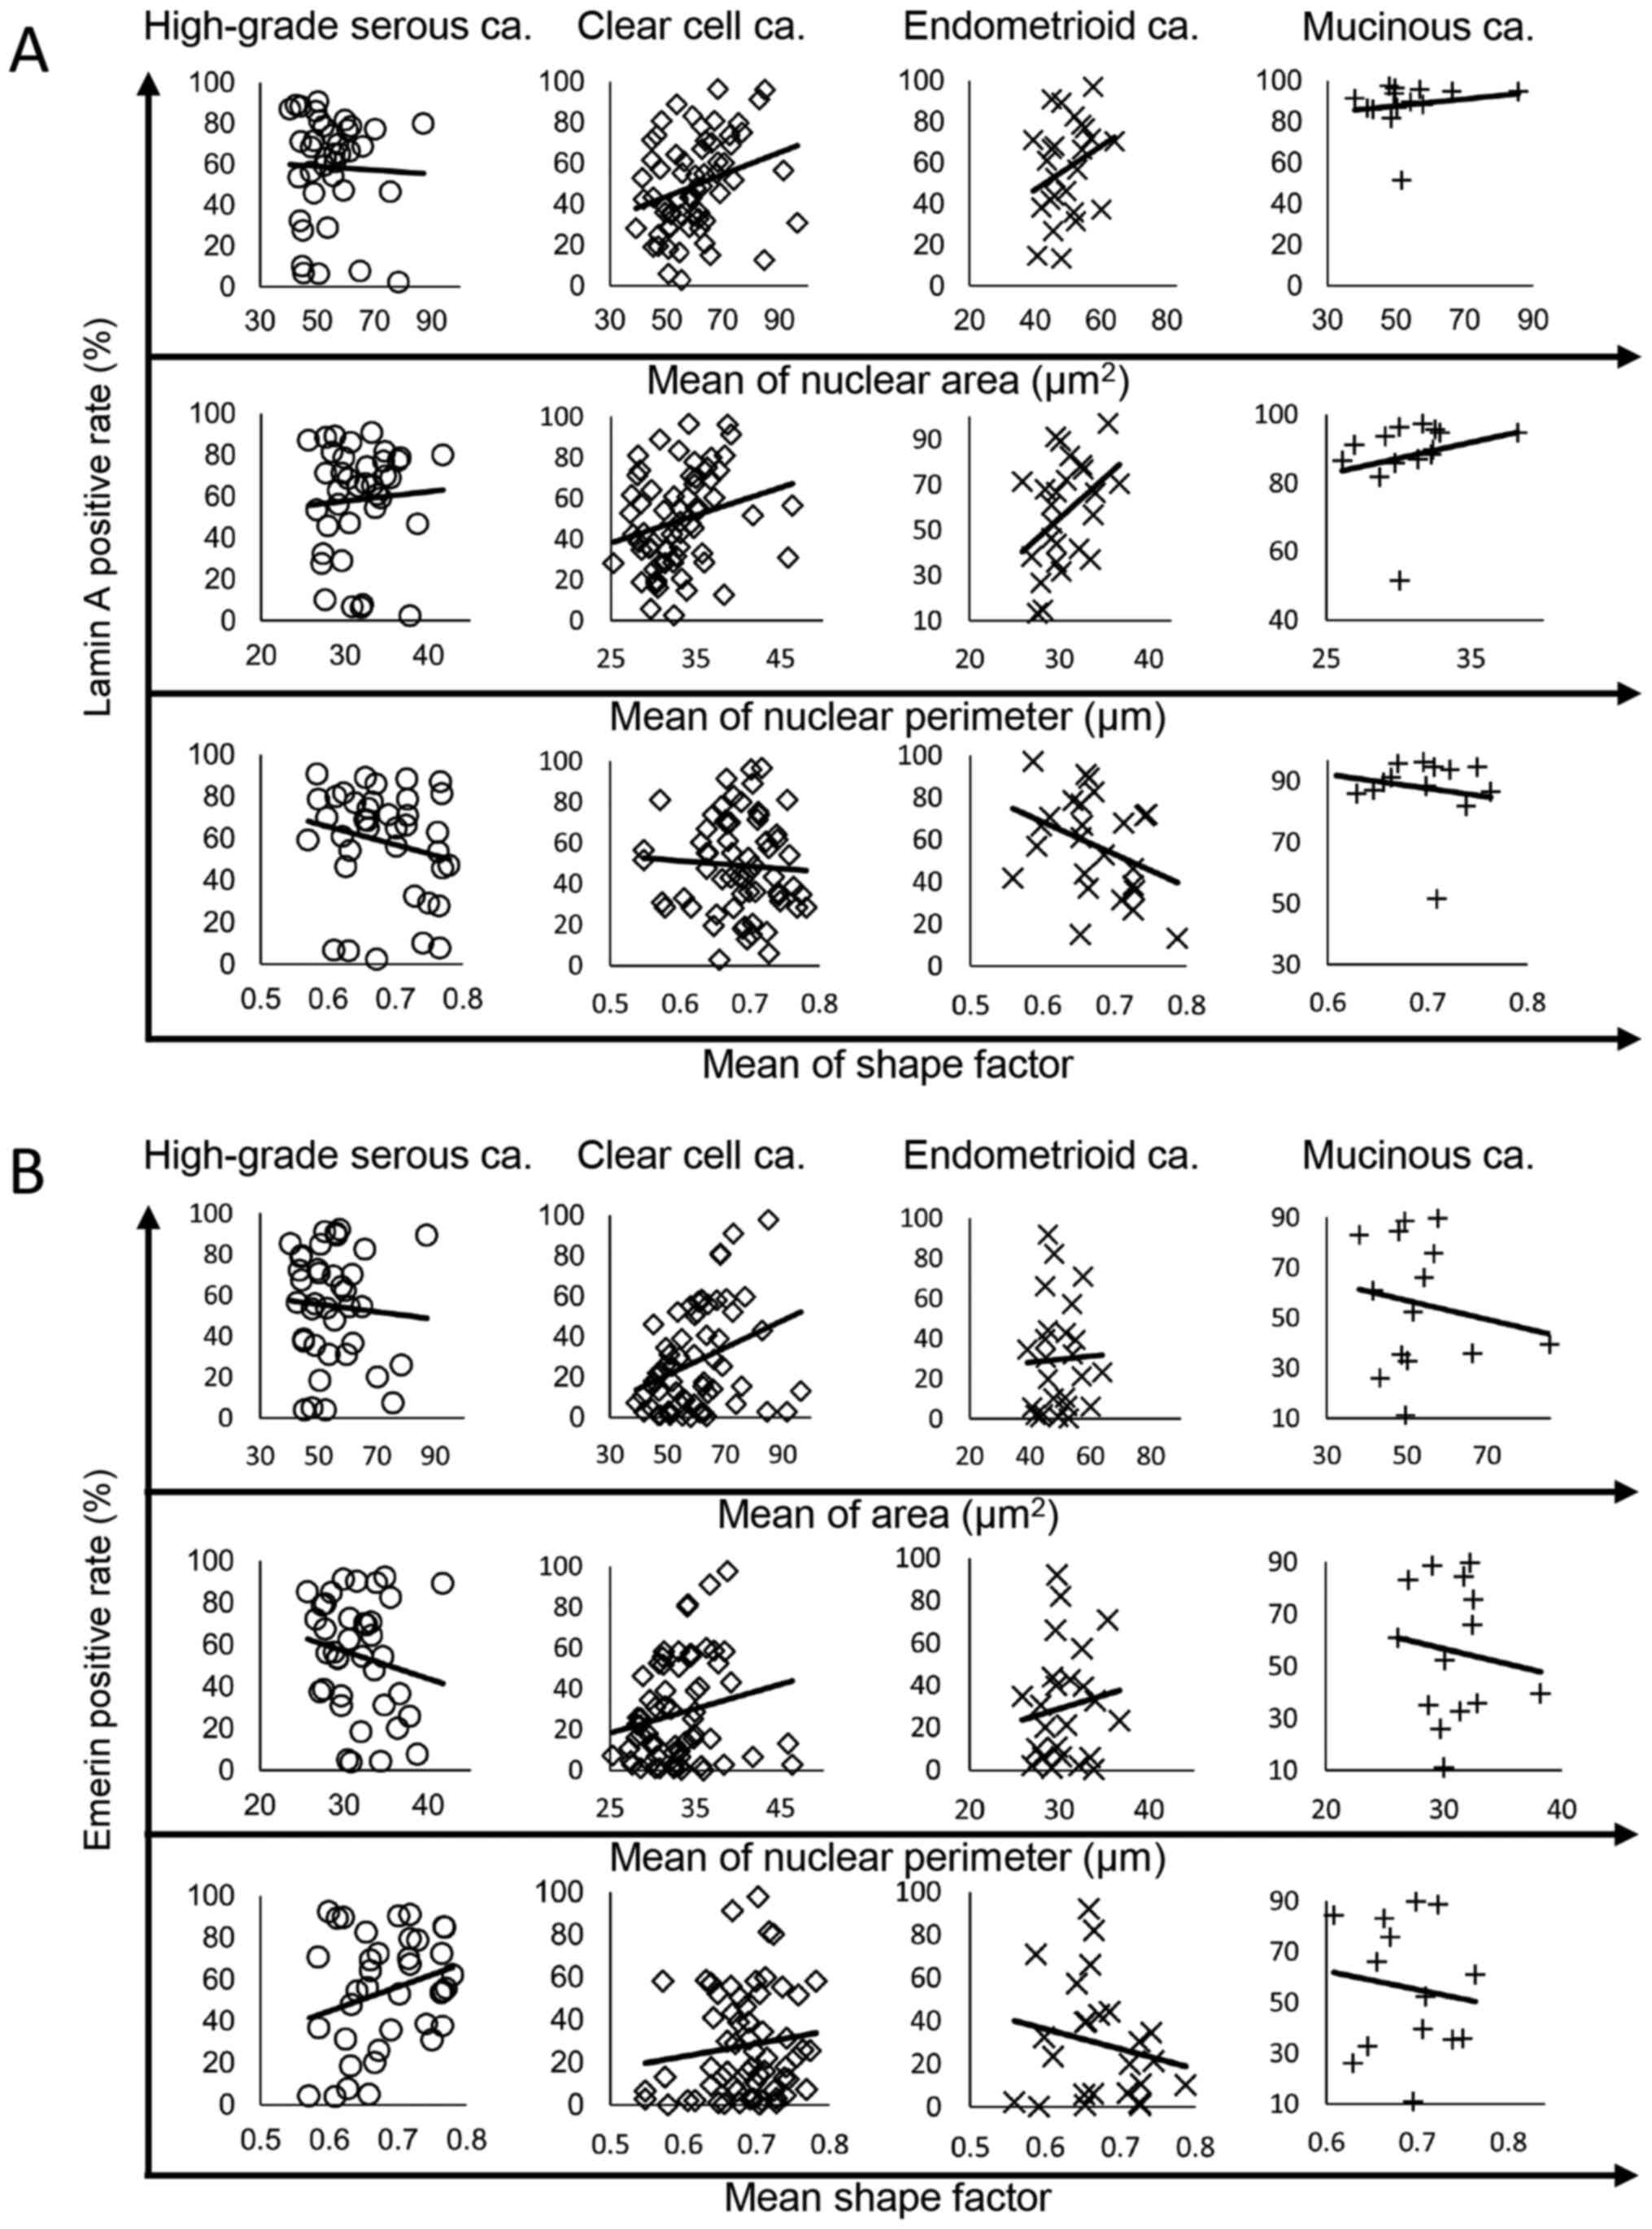 |
Figure 8.
Correlations between the rate of nuclear envelope protein expression, nuclear area, perimeter and shape factor according to histological subtype. The regression line is for the rates of (A) Lamin A and (B) emerin positivity. ca, carcinoma.
|
|
Table IV.
Correlation between nuclear envelope protein expression and nuclear morphological parameters according to histological subtype.
|
Table IV.
Correlation between nuclear envelope protein expression and nuclear morphological parameters according to histological subtype.
| |
Histological subtype |
| |
|
| Variable |
High-grade serous carcinoma |
Clear cell carcinoma |
Endometrioid carcinoma |
Mucinous carcinoma |
| Lamin A |
|
|
|
|
| Area |
−0.0391 |
0.2855a |
0.2858a |
0.1765 |
| Perimeter |
0.0678 |
0.2409a |
0.4054a |
0.2370a |
| Shape factor |
−0.2079a |
−0.0618 |
−0.3707a |
−0.1825 |
| Emerin |
|
|
|
|
| Area |
−0.0716 |
0.3310a |
0.0326 |
−0.1694 |
| Perimeter |
−0.1783 |
0.1996 |
0.1266 |
−0.1226 |
| Shape factor |
0.2673a |
0.1282 |
−0.1933 |
−0.1292 |
The statistical comparison of Lamin A and emerin expression levels between the tumor and NTOSE according to tumor subtype was not possible due to the low number of specimens with NTOSE in each tumor subtype. Thus, the present study compared the percentage of areas expressing Lamin A or emerin between the tumor and NTOSE in the same specimen (Table V). Among the 18 cases that were analyzed, there was a concordance of increase and decrease patterns of tumor cells compared with NTOSE between Lamin A and emerin in 15 cases (83.33%). Notably, all four MUCa cases exhibited an increase in the percentage of areas expressing Lamin A and emerin in the tumor area compared with NTOSE in the same specimen; however, further analysis is required to verify this result, as this was only found in four MUCa cases from a total of 14.
|
Table V.
Comparison of lamin A and emerin expression between the nontumor ovarian surface epithelium and tumor cells in the same case.
|
Table V.
Comparison of lamin A and emerin expression between the nontumor ovarian surface epithelium and tumor cells in the same case.
| |
|
Lamin A, % |
Emerin, % |
Percentage expression compared with NTOSE |
Concordance of Lamin A and emerin expression patterns |
| |
|
|
|
|
|
| Tumor subtype |
Case number |
NTOSE |
Cancer cells |
NTOSE |
Cancer cells |
Lamin A |
Emerin |
Concordance |
| HGSCa |
22 |
42.05 |
68.84 |
35.23 |
82.51 |
↑ |
↑ |
Observed |
| |
24 |
89.66 |
27.61 |
66.27 |
37.69 |
↓ |
↓ |
Observed |
| |
30 |
69.47 |
66.26 |
54.36 |
69.95 |
↓ |
↑ |
Not observed |
| |
35 |
70.51 |
81.21 |
69.44 |
84.95 |
↑ |
↑ |
Observed |
| |
36 |
59.2 |
2.35 |
67.44 |
25.85 |
↓ |
↓ |
Observed |
| CCCa |
41 |
43.01 |
18.18 |
23.58 |
31.03 |
↓ |
↑ |
Not observed |
| |
46 |
17.58 |
28.49 |
14.15 |
2.12 |
↑ |
↓ |
Not observed |
| |
50 |
36.97 |
43.01 |
1.11 |
6.71 |
↑ |
↑ |
Observed |
| |
52 |
86.72 |
70.95 |
87.5 |
55.95 |
↓ |
↓ |
Observed |
| |
54 |
64.36 |
28.46 |
1.16 |
0.15 |
↓ |
↓ |
Observed |
| |
91 |
79.17 |
31.74 |
15.52 |
12.23 |
↓ |
↓ |
Observed |
| |
94 |
88.21 |
96.49 |
80.12 |
81.35 |
↑ |
↑ |
Observed |
| EMCa |
106 |
96.95 |
52.87 |
96.43 |
44.12 |
↓ |
↓ |
Observed |
| |
111 |
82.47 |
70.67 |
54.35 |
23.31 |
↓ |
↓ |
Observed |
| MUCa |
128 |
12.5 |
89.6 |
4.00 |
66.00 |
↑ |
↑ |
Observed |
| |
132 |
28.89 |
86.65 |
36.18 |
61.00 |
↑ |
↑ |
Observed |
| |
137 |
60.71 |
81.78 |
28.57 |
35.26 |
↑ |
↑ |
Observed |
| |
138 |
33.72 |
94.65 |
25.35 |
39.48 |
↑ |
↑ |
Observed |
Taken together, these results suggest that Lamin A more strongly influences nuclear morphological changes compared with emerin in ovarian carcinoma, although increase and decrease patterns of Lamin A and emerin expression are usually in concordance.
Discussion
In the present study, patients with HGSCa were significantly older compared with the other subtypes. Peres et al reported that the age at diagnosis of epithelial ovarian cancer for the four histological types in 28,118 patients was as follows: 61.2±11.6 years in HGSCa, 55.7±10.9 years in CCCa, 54.2±12.3 years in EMCa and 53.5±14.9 years in MUCa (10). Similarly, Rambau et al (18) reported that the age at diagnosis of epithelial ovarian cancer in 6,525 patients was as follows: 59.7±10.7 years in HGSCa, 56.0±11.4 years in CCCa, 54.8±12.0 years in EMCa and 54.5±14.8 years in MUCa. Therefore, the age distribution of patients in the present study was similar to previously reported data.
In the present study, stage III or IV tumor was predominant in HGSCa, whereas low stage (stages I or II) was popular in the other tumor subtypes. Regarding the FIGO stage distribution of the four tumor subtypes, Köbel et al (19) reported that high-stage HGSCa accounts for ~80% of all cases, with the remaining subtypes account for ~20%. Rambau et al (18) recorded the proportion of high-stage ovarian cancer for each tumor subtype as follows: 80.5% in HGSCa, 21.8% in CCCa, 16.5% in EMCa and 19.1% in MUCa. Thus, the proportion of high-stage cancer for each subtype in the present study was similar to previously reported data. Although it is believed that serous ovarian cancer originates from the ovarian surface epithelium, recent data suggest that the most HGSCa lesions originate from the distal portion of the fallopian tube (20). In addition, Köbel et al (19) suggested that serous carcinoma tumor cells that arise in the fallopian tube tend to detach easily, permitting their early dissemination to the peritoneal cavity.
In terms of nuclear size variation, the present study used standard deviation of nuclear area or nuclear perimeter. The results demonstrated that not only HGSCa, but also another tumor subtypes showed significant differences to NTOSE. With regards to the 4 tumor subtypes, statistically significant differences were observed in the standard deviation of nuclear areas between CCCa and EMCa. In the literature, HGSCa exhibits large-sized, strongly atypical and highly variable nuclei, which are often observed as bizarre mononuclei with significant pleomorphism, with a >3-fold variation in nuclear size (21–25). Based on previous findings, the important characteristics of HGSCa cell nuclei are >3-fold size variation and disordered shapes. Conversely, in EMCa cells, the nuclei are usually round to oval, and nuclear atypia is mild to moderate (26), although the nuclear size has not been described. In CCCa cells, the nuclei are enlarged (11,27), but monomorphic and nuclear size variation is partially observed (27) or uncommon (11). A previous study reported no significant differences in nuclear size between MUCa and SCa (28). Conversely, Rodríguez and Prat (29) reported variation in the degree of nuclear atypia in MUCa; however, there was no clear description of nuclear size variation in MUCa. In the present study, nuclear size variation, which was inconspicuous in EMCa, was evident in HGSCa and CCCa based on the comparison of maximum nuclear size (data not shown). Thus, nuclear variation should be more strongly emphasized in CCCa compared with that previously described in the literature. No study thus far has investigated nuclear size variation in MUCa; however, the results of the present study demonstrated that nuclear size variation was less severe in MUCa compared with HGSCa and CCCa, but stronger than EMCa. These results suggest that CAIA may provide new insights on the nuclear findings of ovarian epithelial cancers compared with other techniques, and these results may be useful for evaluating histological or cytological specimens to provide differential diagnoses in daily practice.
The present data obtained by examining clinical samples revealed that the correlation between the rate of nuclear Lamin A positivity and nuclear morphology differed in ovarian tumor subtypes. Previous studies have reported that Lamin A suppression by siRNA results in increased nuclear size in two primary human breast epithelial cell types (30), and that decreased Lamin A expression increases nuclear area in murine embryonic fibroblasts (31). Furthermore, Capo-chichi et al (12) reported that the suppression of Lamin A/C expression in primary human ovarian epithelial cells resulted in larger nuclei and atypical nuclear morphology. Collectively, these findings suggest that decreased Lamin A expression increases nuclear size. Conversely, Smith et al (32) reported that the nuclear volume decreased following suppression of Lamin A expression with retinoic acid treatment in mouse embryonic stem cells. Jevtić et al (33) observed that overexpression of Lamin A in normal human lung fibroblasts and HeLa cells, resulted in larger nuclei, whereas suppression of Lamin A by siRNA in HeLa cells resulted in reduced nuclear size. These reports suggest that Lamin A suppression contributes to the reduction of nuclear size. Thus, alteration of Lamin A expression can alter nuclear size or morphology by cell type. The results of the present study demonstrated that even for tumors originating in the same tissue, the role of Lamin A in nuclear morphology differs among ovarian tumor subtype.
Liddane et al (34) reported that breast cancer cell lines with low emerin expression have smaller nuclear areas than those with high emerin expression, and that the nuclear area of these cells increases following transfection with GFP-emerin plasmids. Conversely, Lammerding et al (6) reported that when emerin expression is suppressed in mouse embryo fibroblasts, the nuclear area of these cells increases. Smith et al (32) reported that emerin suppression in embryonal stem cell does not result in significant changes in nuclear morphology. Thus, these reports suggest that the changes in nuclear morphology following emerin suppression are cell type specific. The results of the present study demonstrated that nuclear emerin positivity, unlike that of Lamin A, was rarely correlated with nuclear morphological factors. Therefore, emerin may have a weaker effect on nuclear morphology than Lamin A, although their molecular expression patterns were synchronized. The more dominant contribution of Lamin A to nuclear morphology was also reported in cultured cell lines (6,32). However, the contribution of Lamin A and emerin to nuclear morphology had not been previously evaluated using clinical samples. In this aspect, the results of the present study are novel and significant for considering the contributions of Lamin A and emerin to nuclear morphological maintenance in vivo.
In conclusion, among the four tumor subtypes examined in the present study, only MUCa exhibited a unique Lamin A expression pattern. However, no study thus far has investigated the association between Lamin A and carcinogenesis in MUCa. Thus, further studies are required to validate the results presented here. The limitation of the present study is that it only examined 2 representative nuclear membrane/lamina molecules (Lamin A and emerin). Thus, prospective studies will aim to analyze other nuclear membrane/lamina proteins for alteration of nuclear morphological change in clinical samples, as well as performing in vitro studies.
Supplementary Material
Supporting Data
Acknowledgements
The authors of the present study would like to thank Ms Misa Fujimori, Mr Shunichi Moriya and Ms Tamaki Hiroe (Laboratory of Histopathology and Cytopathology, Department of Laboratory Sciences, Gunma University Graduate School of Health Sciences), for sectioning some of the specimens.
Funding
The present study was supported by a research fund from Gunma University and by JSPS KAKENHI (grant no. JP21K09533).
Availability of data and materials
The datasets used and/or analyzed during the current study are available from the corresponding author on reasonable request.
Authors' contributions
SW collected clinical data; performed H&E staining, immunohistochemistry for CK20, ERα, HNF1-β, WT-1, vimentin, Lamin A and emerin; performed CAIA of Lamin A, emerin images and part of Feulgen-stained images; prepared figures and tables, as well as statistical analysis and drafted the initial manuscript. SK performed sectioning of specimens, staining of Feulgen specimens, digital data acquisition of Feulgen specimens and performed a part of image analysis of Feulgen-stained images. MH collected clinical data and performed specimen sectioning and Feulgen staining. YN performed sectioning of specimens and acquired digital images of Lamin A and emerin. NI and AI revised clinical data and advised experimental design as a gynecologist and reviewed the manuscript. HI confirmed pathological diagnosis of samples via H&E staining and CK20, ERα, HNF1-β, WT-1 and vimentin, as the second pathologist. HY confirmed pathological diagnosis as the third pathologist and reviewed the manuscript. MS determined experimental design and performed the experiments as principle investigator; confirmed pathological diagnosis as the first pathologist; performed a part of image analysis of Lamin A, emerin and Feulgen-stained images, performed statistical analysis; prepared figures and tables; and drafted the initial manuscript. SW and MS confirmed the authenticity of all the raw data. All authors have read and approved the final manuscript.
Ethics approval and consent to participate
The present study was approved by Gunma University Ethical Review Board for Medical Research Involving Human Subjects (Maebashi, Japan; approval no. HS2019-49). Informed consent for this study was obtained via a method according to ‘Ethical Guidelines for Medical and Health Research Involving Human Subjects’ established by the Ministry of Education, Culture, Sports, Science and Technology and Ministry of Health, Labor and Welfare in Japan. As the present study used FFPE samples as secondary usage after diagnostic purposes, instead of obtaining informed consent from each patient, a notification for the present study was published on the Gunma University Hospital website, which outlined the research plan, patient information to be used in this study, the storage period and storage methods of samples and contact information, and guaranteed free withdrawal.
Patient consent for publication
Not applicable.
Competing interests
The authors declare that they have no competing interests.
References
|
1
|
Chow KH, Factor RE and Ullman KS: The nuclear envelope environment and its cancer connections. Nat Rev Cancer. 12:196–209. 2012. View Article : Google Scholar : PubMed/NCBI
|
|
2
|
Fischer EG: Nuclear morphology and the biology of cancer cells. Acta Cytol. 64:511–519. 2020. View Article : Google Scholar : PubMed/NCBI
|
|
3
|
Burla R, La Torre M, Maccaroni K, Verni F, Giunta S and Saggio I: Interplay of the nuclear envelope with chromatin in physiology and pathology. Nucleus. 11:205–218. 2020. View Article : Google Scholar : PubMed/NCBI
|
|
4
|
Lammerding J, Fong LG, Ji JY, Reue K, Stewart CL, Young SG and Lee RT: Lamins A and C but not lamin B1 regulate nuclear mechanics. J Biol Chem. 281:25768–25780. 2006. View Article : Google Scholar : PubMed/NCBI
|
|
5
|
Koch AJ and Holaska JM: Emerin in health and disease. Semin Cell Dev Biol. 29:95–106. 2014. View Article : Google Scholar : PubMed/NCBI
|
|
6
|
Lammerding J, Hsiao J, Schulze PC, Kozlov S, Stewart CL and Lee RT: Abnormal nuclear shape and impaired mechanotransduction in emerin-deficient cells. J Cell Biol. 170:781–791. 2005. View Article : Google Scholar : PubMed/NCBI
|
|
7
|
Zink D, Fischer AH and Nickerson JA: Nuclear structure in cancer cells. Nat Rev Cancer. 4:677–687. 2004. View Article : Google Scholar : PubMed/NCBI
|
|
8
|
Broers JL, Raymond Y, Rot MK, Kuijpers H, Wagenaar SS and Ramaekers FC: Nuclear A-type lamins are differentially expressed in human lung cancer subtypes. Am J Pathol. 143:211–220. 1993.PubMed/NCBI
|
|
9
|
Machida H, Matsuo K, Yamagami W, Ebina Y, Kobayashi Y, Tabata T, Kanauchi M, Nagase S, Enomoto T and Mikami M: Trends and characteristics of epithelial ovarian cancer in Japan between 2002 and 2015: A JSGO-JSOG joint study. Gynecol Oncol. 153:589–596. 2019. View Article : Google Scholar : PubMed/NCBI
|
|
10
|
Peres LC, Cushing-Haugen KL, Köbel M, Harris HR, Berchuck A, Rossing MA, Schildkraut JM and Doherty JA: Invasive epithelial ovarian cancer survival by histotype and disease stage. J Natl Cancer Inst. 111:60–68. 2019. View Article : Google Scholar : PubMed/NCBI
|
|
11
|
Soslow RA: Histologic subtypes of ovarian carcinoma: An overview. Int J Gynecol Pathol. 27:161–174. 2008.PubMed/NCBI
|
|
12
|
Capo-chichi CD, Cai KQ, Simpkins F, Ganjei-Azar P, Godwin AK and Xu XX: Nuclear envelope structural defects cause chromosomal numerical instability and aneuploidy in ovarian cancer. BMC Med. 9:282011. View Article : Google Scholar : PubMed/NCBI
|
|
13
|
Capo-chichi CD, Cai KQ, Testa JR, Godwin AK and Xu XX: Loss of GATA6 leads to nuclear deformation and aneuploidy in ovarian cancer. Mol Cell Biol. 29:4766–4777. 2009. View Article : Google Scholar : PubMed/NCBI
|
|
14
|
Gong G, Chen P, Li L, Tan H, Zhou J, Zhou Y, Yang X and Wu X: Loss of lamin A but not lamin C expression in epithelial ovarian cancer cells is associated with metastasis and poor prognosis. Pathol Res Pract. 211:175–182. 2015. View Article : Google Scholar : PubMed/NCBI
|
|
15
|
Denny L: Ovarian fallopian tube, and primary peritoneal carcinoma. TNM Classification of Malignant Tumours. Brierley J, Gospodarowicz M and Wittekinnd C: Wiley Blackwell; Chichester: pp. 179–184. 2017
|
|
16
|
Varga VS, Ficsor L, Kamarás V, Jónás V, Virág T, Tulassay Z and Molnár B: Automated multichannel fluorescent whole slide imaging and its application for cytometry. Cytometry A. 75:1020–1030. 2009. View Article : Google Scholar : PubMed/NCBI
|
|
17
|
Guilford J: Correlation. In: Fundamental Statistics in Psychology and Education. Morgan C: McGraw-Hill Book Company; New York, NY: pp. 152–173. 1950
|
|
18
|
Rambau PF, Vierkant RA, Intermaggio MP, Kelemen LE, Goodman MT, Herpel E, Pharoah PD, Kommoss S, Jimenez-Linan M, Karlan BY, et al AOCS Group, : Association of p16 expression with prognosis varies across ovarian carcinoma histotypes: An Ovarian Tumor Tissue Analysis consortium study. J Pathol Clin Res. 4:250–261. 2018. View Article : Google Scholar : PubMed/NCBI
|
|
19
|
Köbel M, Kalloger SE, Huntsman DG, Santos JL, Swenerton KD, Seidman JD, Gilks CB; Cheryl Brown Ovarian Cancer Outcomes Unit of the British Columbia Cancer Agency, ; Vancouver BC: Differences in tumor type in low-stage versus high-stage ovarian carcinomas. Int J Gynecol Pathol. 29:203–211. 2010. View Article : Google Scholar : PubMed/NCBI
|
|
20
|
Kyo S, Ishikawa N, Nakamura K and Nakayama K: The fallopian tube as origin of ovarian cancer: Change of diagnostic and preventive strategies. Cancer Med. 9:421–431. 2020. View Article : Google Scholar : PubMed/NCBI
|
|
21
|
Soslow RA, Brenton JD, Davidson B, Folkins AK, Kong CS, Malpica A, Soerjomataram I and Vang R: High-grade serous carcinoma of the ovary. Female genital tumours, WHO classification of tumours. Cheung AN, Ellenson LH and Gilks CB: International Agency for Research on Cancer; Lyon: pp. 45–47. 2019
|
|
22
|
Seidman JD, Ronnett BM, Shih IM, Cho KR and Kurman RJ: Epithelial tumors of the ovary. Blausteins's pathology of the female genital tract. Kurman RJ, Ellenson LH and Ronnett BM: Springer; Berlin: pp. 841–966. 2019, View Article : Google Scholar
|
|
23
|
Malpica A, Deavers MT, Lu K, Bodurka DC, Atkinson EN, Gershenson DM and Silva EG: Grading ovarian serous carcinoma using a two-tier system. Am J Surg Pathol. 28:496–504. 2004. View Article : Google Scholar : PubMed/NCBI
|
|
24
|
Vang R, Shih IeM and Kurman RJ: Ovarian low-grade and high-grade serous carcinoma: Pathogenesis, clinicopathologic and molecular biologic features, and diagnostic problems. Adv Anat Pathol. 16:267–282. 2009. View Article : Google Scholar : PubMed/NCBI
|
|
25
|
Ramalingam P: Morphologic, immunophenotypic, and molecular features of epithelial ovarian cancer. Oncology (Williston Park). 30:166–176. 2016.PubMed/NCBI
|
|
26
|
Kobel M, Hunstman DG, Lim D, McCluggage WG, Rabban JT and Shih I: Endometrioid carcinoma of the ovary. Female Genital Tumours, WHO Classification of Tumours. Cheung AN, Ellenson LH and Gilks CB: International Agency for Research on Cancer; Lyon: pp. 58–61. 2019
|
|
27
|
Kobel M, Bennett JA, Cheung AN, DeLair DF, Kiyokawa T and Shih I: Clear cell carcinoma of the ovary. Female Genital Tumours, WHO Classification of Tumours. Cheung AN, Ellenson LH and Gilks CB: International Agency for Research on Cancer; Lyon: pp. 65–67. 2019
|
|
28
|
Zeimet AG, Fiegl H, Goebel G, Kopp F, Allasia C, Reimer D, Steppan I, Mueller-Holzner E, Ehrlich M and Marth C: DNA ploidy, nuclear size, proliferation index and DNA-hypomethylation in ovarian cancer. Gynecol Oncol. 121:24–31. 2011. View Article : Google Scholar : PubMed/NCBI
|
|
29
|
Rodríguez IM and Prat J: Mucinous tumors of the ovary: A clinicopathologic analysis of 75 borderline tumors (of intestinal type) and carcinomas. Am J Surg Pathol. 26:139–152. 2002. View Article : Google Scholar : PubMed/NCBI
|
|
30
|
Capo-chichi CD, Cai KQ, Smedberg J, Ganjei-Azar P, Godwin AK and Xu XX: Loss of A-type lamin expression compromises nuclear envelope integrity in breast cancer. Chin J Cancer. 30:415–425. 2011. View Article : Google Scholar : PubMed/NCBI
|
|
31
|
Kim JK, Louhghalam A, Lee G, Schafer BW, Wirtz D and Kim DH: Nuclear lamin A/C harnesses the perinuclear apical actin cables to protect nuclear morphology. Nat Commun. 8:21232017. View Article : Google Scholar : PubMed/NCBI
|
|
32
|
Smith ER, Meng Y, Moore R, Tse JD, Xu AG and Xu XX: Nuclear envelope structural proteins facilitate nuclear shape changes accompanying embryonic differentiation and fidelity of gene expression. BMC Cell Biol. 18:82017. View Article : Google Scholar : PubMed/NCBI
|
|
33
|
Jevtić P, Edens LJ, Li X, Nguyen T, Chen P and Levy DL: Concentration-dependent effects of nuclear lamins on nuclear size in Xenopus and mammalian cells. J Biol Chem. 290:27557–27571. 2015. View Article : Google Scholar : PubMed/NCBI
|
|
34
|
Liddane AG, McNamara CA, Campbell MC, Mercier I and Holaska JM: Defects in emerin-nucleoskeleton binding disrupt nuclear structure and promote breast cancer cell motility and metastasis. Mol Cancer Res. 19:1196–1207. 2021. View Article : Google Scholar : PubMed/NCBI
|


