Introduction
Colon cancer is one of the most common cancers in
the world. Many mechanisms responsible for colon cancer have been
identified in detail, including activation of oncogenic signaling
pathways resulting from genetic mutations, inactivation of tumor
suppressor genes, and epigenetic changes (1). Important features of tumor cells
during colon cancer development are their ability to suppress of
immune system cells and their avoidance of immune destruction. In
this process, tumor cells secrete cytokines such as transforming
growth factor beta, which reorganize the microenvironment and
inhibit the infiltration of T cells. As a result of major
histocompatibility complex class 1 mutations, tumor neoantigens are
lost, and immune system's ability to recognize cancer cells
decreases. Cytotoxic activity is suppressed by the overexpression
of HLA-G on the cell surface as a consequence of the production of
miR (2).
HLA-G is a non-classical major histocompatibility
class 1b molecule, the presence of which was first demonstrated in
placental extravillous trophoblast cells (3). HLA-G creates an immunotolerant
environment and prevents fetal rejection by maternal immune system
cells (4,5). While its physiological presence is
limited to pancreatic island cells, thymic epithelial cells,
activated monocytes, corneal keratocytes, and erythroblasts, its
pathological expression has been demonstrated on the surface of
various cancer cells (6). HLA-G
can inhibit the activation and proliferation of T and B cells, the
cytotoxic function of T and NK cells, and neutrophil functions.
HLA-G shows an immunosuppressive feature by binding to various
receptors on the cell surface, including immunoglobulin-like
transcript receptor 2 on lymphoid and myelomonocytic cells (ILT-2)
on lymphoid and myelomonocytic cells, ILT-4 on dendritic cells
(4,5). While its physiological presence is
limited to pancreatic island cells, thymic epithelial cells,
activated monocytes, corneal keratocytes and erythroblasts, its
pathological expression has been demonstrated on the surface of
various cancer cells (6). HLA-G
can inhibit the activation and proliferation of T and B cells, the
cytotoxic function of T and NK cells, and neutrophil functions.
HLA-G shows an immunosuppressive feature by binding to various
receptors on the cell surface some of which are are
immunoglobulin-like transcript (ILT) receptor 2 on lymphoid and
myelomonocytic cells, ILT-4 expressed by dendritic cells, and
killer cell immunoglobulin-like receptor on natural killer cells
(7–9).
An miR is a 19 to 23-nucleotide long,
non-protein-coding, single-stranded RNA molecule. The miR acts as a
post-transcriptional regulator by binding to the 3′UTR region of
protein-coding genes. Thus, miRs control various cellular
mechanisms, such as metabolism, proliferation, differentiation,
apoptosis, tumor development, and metastasis (10). Recently, there has been an increase
in studies on miRs in various types of cancer, including colon
cancer. It has been reported that various miRs interact with genes
such as KRAS, NRAS, and BRAF, which act as a kinase
in intracellular signaling pathways and show pro- or
anti-tumorigenic effects (11).
The mechanisms controlling HLA-G expression are
largely unknown. The 3′UTR region in the HLA-G structure has an
important role in regulating the expression of the molecule and
functions as the target of miRs. Previous studies have shown that
miR148-a and miR-152 bind to the 3′UTR terminal of the HLA-G
molecule, and downregulate it. HLA-G overexpression is accompanied
by low miR-148a and/or low miR-152 levels in these studies
(12–14). Based on previous studies, we
hypothesized that there may be a similar relationship of HLA-G
expression with miR-148a and miR-152 levels in colon cancer.
Materials and methods
Patients and tissue samples
Pairs of colon tumor and adjacent nontumorous
tissues of 108 patients with colon cancer were collected. All
patients were treated with surgery between 2013 and 2016 at the
GATA Haydarpasa Training Hospital (GHTH). We included patients who
were operated from the beginning of January 2013 to the end of
December 2016 in our study. The last patient we included in the
study was followed up for 5 years. Previous patients had longer
follow-up. Our study protocol complied with the principles of the
Declaration of Helsinki. Informed consent forms were obtained from
all patients. Patients who did not agree to give informed consent
for participating in the study were excluded. Formalin-fixed,
paraffin-embedded tissue blocks were retrieved from the pathology
archives. Follow-up was conducted every 3 months for the first 2
years, then every 6 months for 3 years, and then yearly. During
follow-up visits, whole and routine blood examinations were
performed, serum carcinoembryonic antigen levels were tested, and a
complete physical examination was conducted. Patients also received
abdominal ultrasound and chest X-rays or a chest, abdominal, and
pelvic computerized tomography scan once yearly. Colonoscopy was
performed 1 year after surgical resection and repeated in Years 3
and 5. The patients were followed for at least 5 years
post-operation. Clinicopathological data were retrieved from the
patients' medical files and pathology reports. In addition,
patients' survival times were confirmed via telephone inquiry until
September 2021. Time of recurrence or death was noted. Our study
was approved by the ethics committee of GHTH with approval number
37/24.02.2016.
Immunohistochemical staining
We determined the expression level of HLA-G using
the immunohistochemistry method. Blocks greater than 0.5 cm in
diameter and containing at least 50% tumor were chosen for
evaluation. We cut 4-µm-thick sections from paraffin-embedded
tissue blocks and mounted them on poly-lysine-coated slides. The
slides were deparaffinized in xylene and rehydrated in 70% ethanol.
Endogenous peroxidase activity was blocked using a 0.3% hydrogen
peroxide solution containing methanol at room temperature for 30
min. Antigen retrieval was performed at 120°C (autoclave) for 5 min
in a 10-nmol/l sodium citrate buffer (pH 6.0), and then anti-HLA-G
mouse monoclonal antibody (4H84:sc-21799; Santa Cruz Biotechnology,
Inc.; dilution range: 1/100) was incubated for 2 h. Afterwards, the
samples were washed in a 0.01-M phosphate-buffered saline solution.
Subsequently, the binding sites of the primary antibody were
visualized using the ultraView Universal DAB Detection Kit (Ventana
Company), and the Ventana BenchMark automated system; Ventana
Company. Finally, sections were counterstained with hematoxylin and
mounted with glycerol gelatin. The entire tumor area in the samples
was examined by two experienced pathologists under a light
microscope at 4× magnification. In cancer cells, HLA-G stained
cytoplasmically. The percentage of staining in the entire area was
recorded. The presence of HLA-G expression in colon cancer tissue
was found in different proportions, from negative to 95%
positivity. Overall, 75.9% (n=82) of colon cancer samples were
HLA-G positive. Kaplan-Meier survival analysis was performed to
determine the minimum proportion of HLA-G expression which reaches
statistic significance to patient survival. The data showed that
the cut-off value for HLA-G was 20%, which was significantly
associated with patient survival (P=0.039). Therefore, 41.7% (n=45)
of the patients were considered HLA-G positive.
RNA extraction and
polyadenylation
Total RNA was isolated using the RecoverAll Total
Nucleic Acid Isolation kit (Life Technologies; Thermo Fisher
Scientific, Inc.) according to manufacturer's instructions. The
quantity of the isolated RNA was assessed using a NanoDrop 1000
spectrophotometer; Thermo Fisher Scientific, Inc. Polyadenylation
of total RNA was performed with Escherichia coli poly (A)
polymerase (Life Technologies; Thermo Fisher Scientific, Inc.) at
37°C for 30 min according to the manufacturer's instructions for
the poly(A) tailing kit. RNAs were stored at 70°C.
Reverse transcriptase reaction
Single-stranded cDNA was synthesized using the
miScript II Reverse Transcription Kit (Qiagen Sample and Assay
Technologies). A reverse transcriptase mixture was prepared by
adding 4 µl of a HiSpec buffer, 2 µl of a miScript nucleic mix, 2
µl of Script RT, 2 µl of template RNA, and 10 µl RNase-free water.
This mixture was kept at 37°C for 60 min and then incubated at 95°C
for 5 min to deactivate the reverse transcriptase. For reverse
transcription-quantitative PCR (RT-qPCR) assays of miRNAs, cDNA was
generated from equal amounts of total RNA per sample. The cDNAs
were stored undiluted at 20°C.
qPCR
qPCR was done using a miScript SYBR-Green Kit
(Qiagen Sample and Assay Technologies). The 25-µl PCR mixture
contained 10 µl of Quntitect SYBR-Green PCR master mix, 1 µl of
miScript universal forward and reverse primer, 5 µl of template
cDNA, and 8 µl of RNase-free water. The nucleotide sequences for
miR-148a were forward 5′-TCAGTGCACTACAGAACTTTGT-3′ and reverse
5′-GCTGTCAACGATACGCTACGT-3′ and for miR-152 were forward
5′-TCAGTGCATGACAGAACTTGGAA-3′ and reverse
5′-GCTGTCAACGATACGCTACGT-3′. All amplifications were conducted with
a Rotor-Gene Q 5Plex real-time PCR system (Qiagen Sample and Assay
Technologies). The cycles were completed with qPCR at 94°C for 5
sec, 58°C for 20 sec, and 72°C for 30 sec, with a total of 45
amplification cycles. In order to evaluate the specificity of the
PCR products formed, melting curve analyses were performed between
55 and 95°C, with a sample temperature increase rate of 0.1°C/sec.
RNU6B small nuclear RNA with serial dilutions was used as a
reference for normalizing the expression levels of miR-148a and
miR-152. It has been shown that the RNU6B mRNA level remains
relatively stable in most systems in the human body and is not
affected by various conditions such as cancer and infection
(15). The relative expression
levels of miRNAs were calculated using the 2−ΔΔCT method
(16). The RNU6 amplification
curves were compared with the threshold values (CT:cycle threshold)
of the amplification curve of each miRNA, and the CT of the target
miRNAs were determined. For each miRNA, ΔCT (Delta Cycle Threshold)
values were calculated with the ΔCT=CT miRNA-CT U6RNA formula in
both tumor tissue and non-tumor tissue. The Rotor-Gene Q Series
software v. 1.7 (Qiagen Sample and Assay Technologies) was used for
this calculation. The relative expression ratio of miR-148a and
miR-152 was presented as the fold change. A relative expression
ratio of <1.0 was considered low expression in cancer cells
relative to the nontumorous control.
Statistical analysis
Statistical analyses were performed using SPSS v.
25.0 (IBM Corp.). Disease-free survival (DFS) was calculated from
the date of surgery to the date of disease relapse or death from
any cause. Overall survival (OS) was calculated from the date of
diagnosis to the date of death or last follow-up. Survival analyses
were performed using the Kaplan-Meier analysis method. The effects
of various prognostic factors related to tumor and patient
characteristics on DFS and OS were investigated with the log-rank
test. The effects of multiple prognostic factors on DFS and OS were
investigated using the multivariate Cox regression test.
Comparisons between groups for quantitative data were made with the
Mann-Whitney U test and Kruskal-Wallis H test. Categorical
comparisons between groups were calculated with Pearson's
Chi-squared test, continuity correction, and Fisher's exact test.
Spearman's correlation test was used to determine the level of
correlation between miR-148a and miR-152 levels. Wilcoxon's
signed-rank test was used to determine whether there was a
difference between the levels. The results were evaluated at the
95% confidence interval and a significance level of P<0.05.
Results
Patient characteristics
Analyses of HLA-G and miRNA expression were
performed on 108 patients with colon cancer stages I–III. The mean
age at the time of diagnosis was 69.31±10.35 years. Of the 108
samples analyzed, 60 were from male and 48 from female subjects.
Patients' clinicopathological features are shown in Table I.
 | Table I.HLA-G expression and
clinicopathological characteristics of patients. |
Table I.
HLA-G expression and
clinicopathological characteristics of patients.
|
| HLA-G
expression |
|
|
|---|
|
|
|
|
|
|---|
| Features | Negative
(n=63) | Positive
(n=45) |
χ2/Z | P-value |
|---|
| Mean age (SD) | 68.98 (10.59) | 69.76 (10.10) | −0.069a | 0.945 |
| Age group, n
(%) |
|
|
|
|
| <70
years | 26 (41.3) | 24 (53.3) | 1.090b | 0.297 |
| ≥70
years | 37 (58.7) | 21 (46.7) |
|
|
| Sex, n (%) |
|
|
|
|
|
Male | 37 (58.7) | 23 (51.1) | 0.347b | 0.556 |
|
Female | 26 (41.3) | 22 (48.9) |
|
|
| Tumor localization,
n (%) |
|
|
|
|
|
Cecum | 9 (14.3) | 3 (6.7) | 6.043b | 0.418 |
|
Ascending colon | 8 (12.7) | 9 (20.0) |
|
|
| Hepatic
flexura | 5 (7.9) | 5 (11.1) |
|
|
|
Transvers colon | 4 (6.3) | 2 (4.4) |
|
|
| Splenic
flexura | 4 (6.3) | 7 (15.6) |
|
|
|
Descending colon | 12 (19.0) | 9 (20.0) |
|
|
| Sigmoid
colon | 21 (33.3) | 10 (22.2) |
|
|
| Tumor side, n
(%) |
|
|
|
|
| Right
colon | 26 (41.3) | 19 (42.2) | 0.000b | >0.999 |
| Left
colon | 37 (58.7) | 26 (57.8) |
|
|
| Histopathology, n
(%) |
|
|
|
|
|
Adenocarcinoma | 55 (87.3) | 37 (82.2) | 0.210b | 0.647 |
|
Mucinous carcinoma | 8 (12.7) | 8 (17.8) |
|
|
| Tumor invasion, n
(%) |
|
|
|
|
|
pT1/2 | 15 (23.8) | 4 (8.9) | -c | 0.071 |
|
pT3/4 | 48 (76.2) | 41 (91.1) |
|
|
| Nodal status, n
(%) |
|
|
|
|
|
pN0 | 45 (71.4) | 21 (46.7) | 11.788b | 0.003d |
|
pN1 | 15 (23.8) | 12 (26.7) |
|
|
|
pN2 | 3 (4.8) | 12 (26.7) |
|
|
| Stage, n (%) |
|
|
|
|
| I | 14 (22.2) | 3 (6.7) | 6.518b | 0.038d |
| II | 30 (47.6) | 20 (44.4) |
|
|
|
III | 19 (30.2) | 22 (48.9) |
|
|
| Grade, n (%) |
|
|
|
|
|
I/II | 58 (92.1) | 36 (80.0) | -c | 0.084 |
|
III | 5 (7.9) | 9 (20.0) |
|
|
| Lymphovascular
invasion, n (%) |
|
|
|
|
|
Negative | 42 (66.7) | 22 (48.9) | 2.739b | 0.098 |
|
Positive | 21 (33.3) | 23 (51.1) |
|
|
| Perineural
invasion, n (%) |
|
|
|
|
|
Negative | 50 (79.4) | 23 (51.1) | 8.320b | 0.004d |
|
Positive | 13 (20.6) | 22 (48.9) |
|
|
| Adjuvant
chemotherapy, n (%) |
|
|
|
|
|
Yes | 11 (17.4) | 21 (46.6) |
| 0.041d |
| No | 52 (82.6) | 24 (53.4) |
|
|
| Mean miR-148a
expression in tumor tissues (SD) | 0.83 (0.44) | 0.43 (0.31) | −5.038a |
<0.001d |
| Mean miR-152
expression in tumor tissues (SD) | 0.86 (0.40) | 0.82 (0.42) | −0.545a | 0.586 |
HLA-G expression in colon cancer
In the immunohistochemical staining, HLA-G was
detected as a brown stained product in tumor tissue but not stained
in normal colon tissue (Fig. 1).
Comparing the HLA-G-positive and negative patient groups, the
former group showed significantly higher rates of lymph node
positivity (53 vs. 29%, P=0.003) and presence of perineural
invasion (49 vs. 21%, P=0.004) and significantly lower
pathologically early-stage disease rates (7 vs. 22%, P=0.038). In
addition, miR-148a levels were significantly lower (P=0.001) in the
HLA-G-positive tumor tissues than in negative ones (Table I). For miR-148a expression, levels
were downregulated 2.5 fold or more in tumor tissue compared with
normal colon tissue, but no such relationship was found for miR-152
expression (Table II).
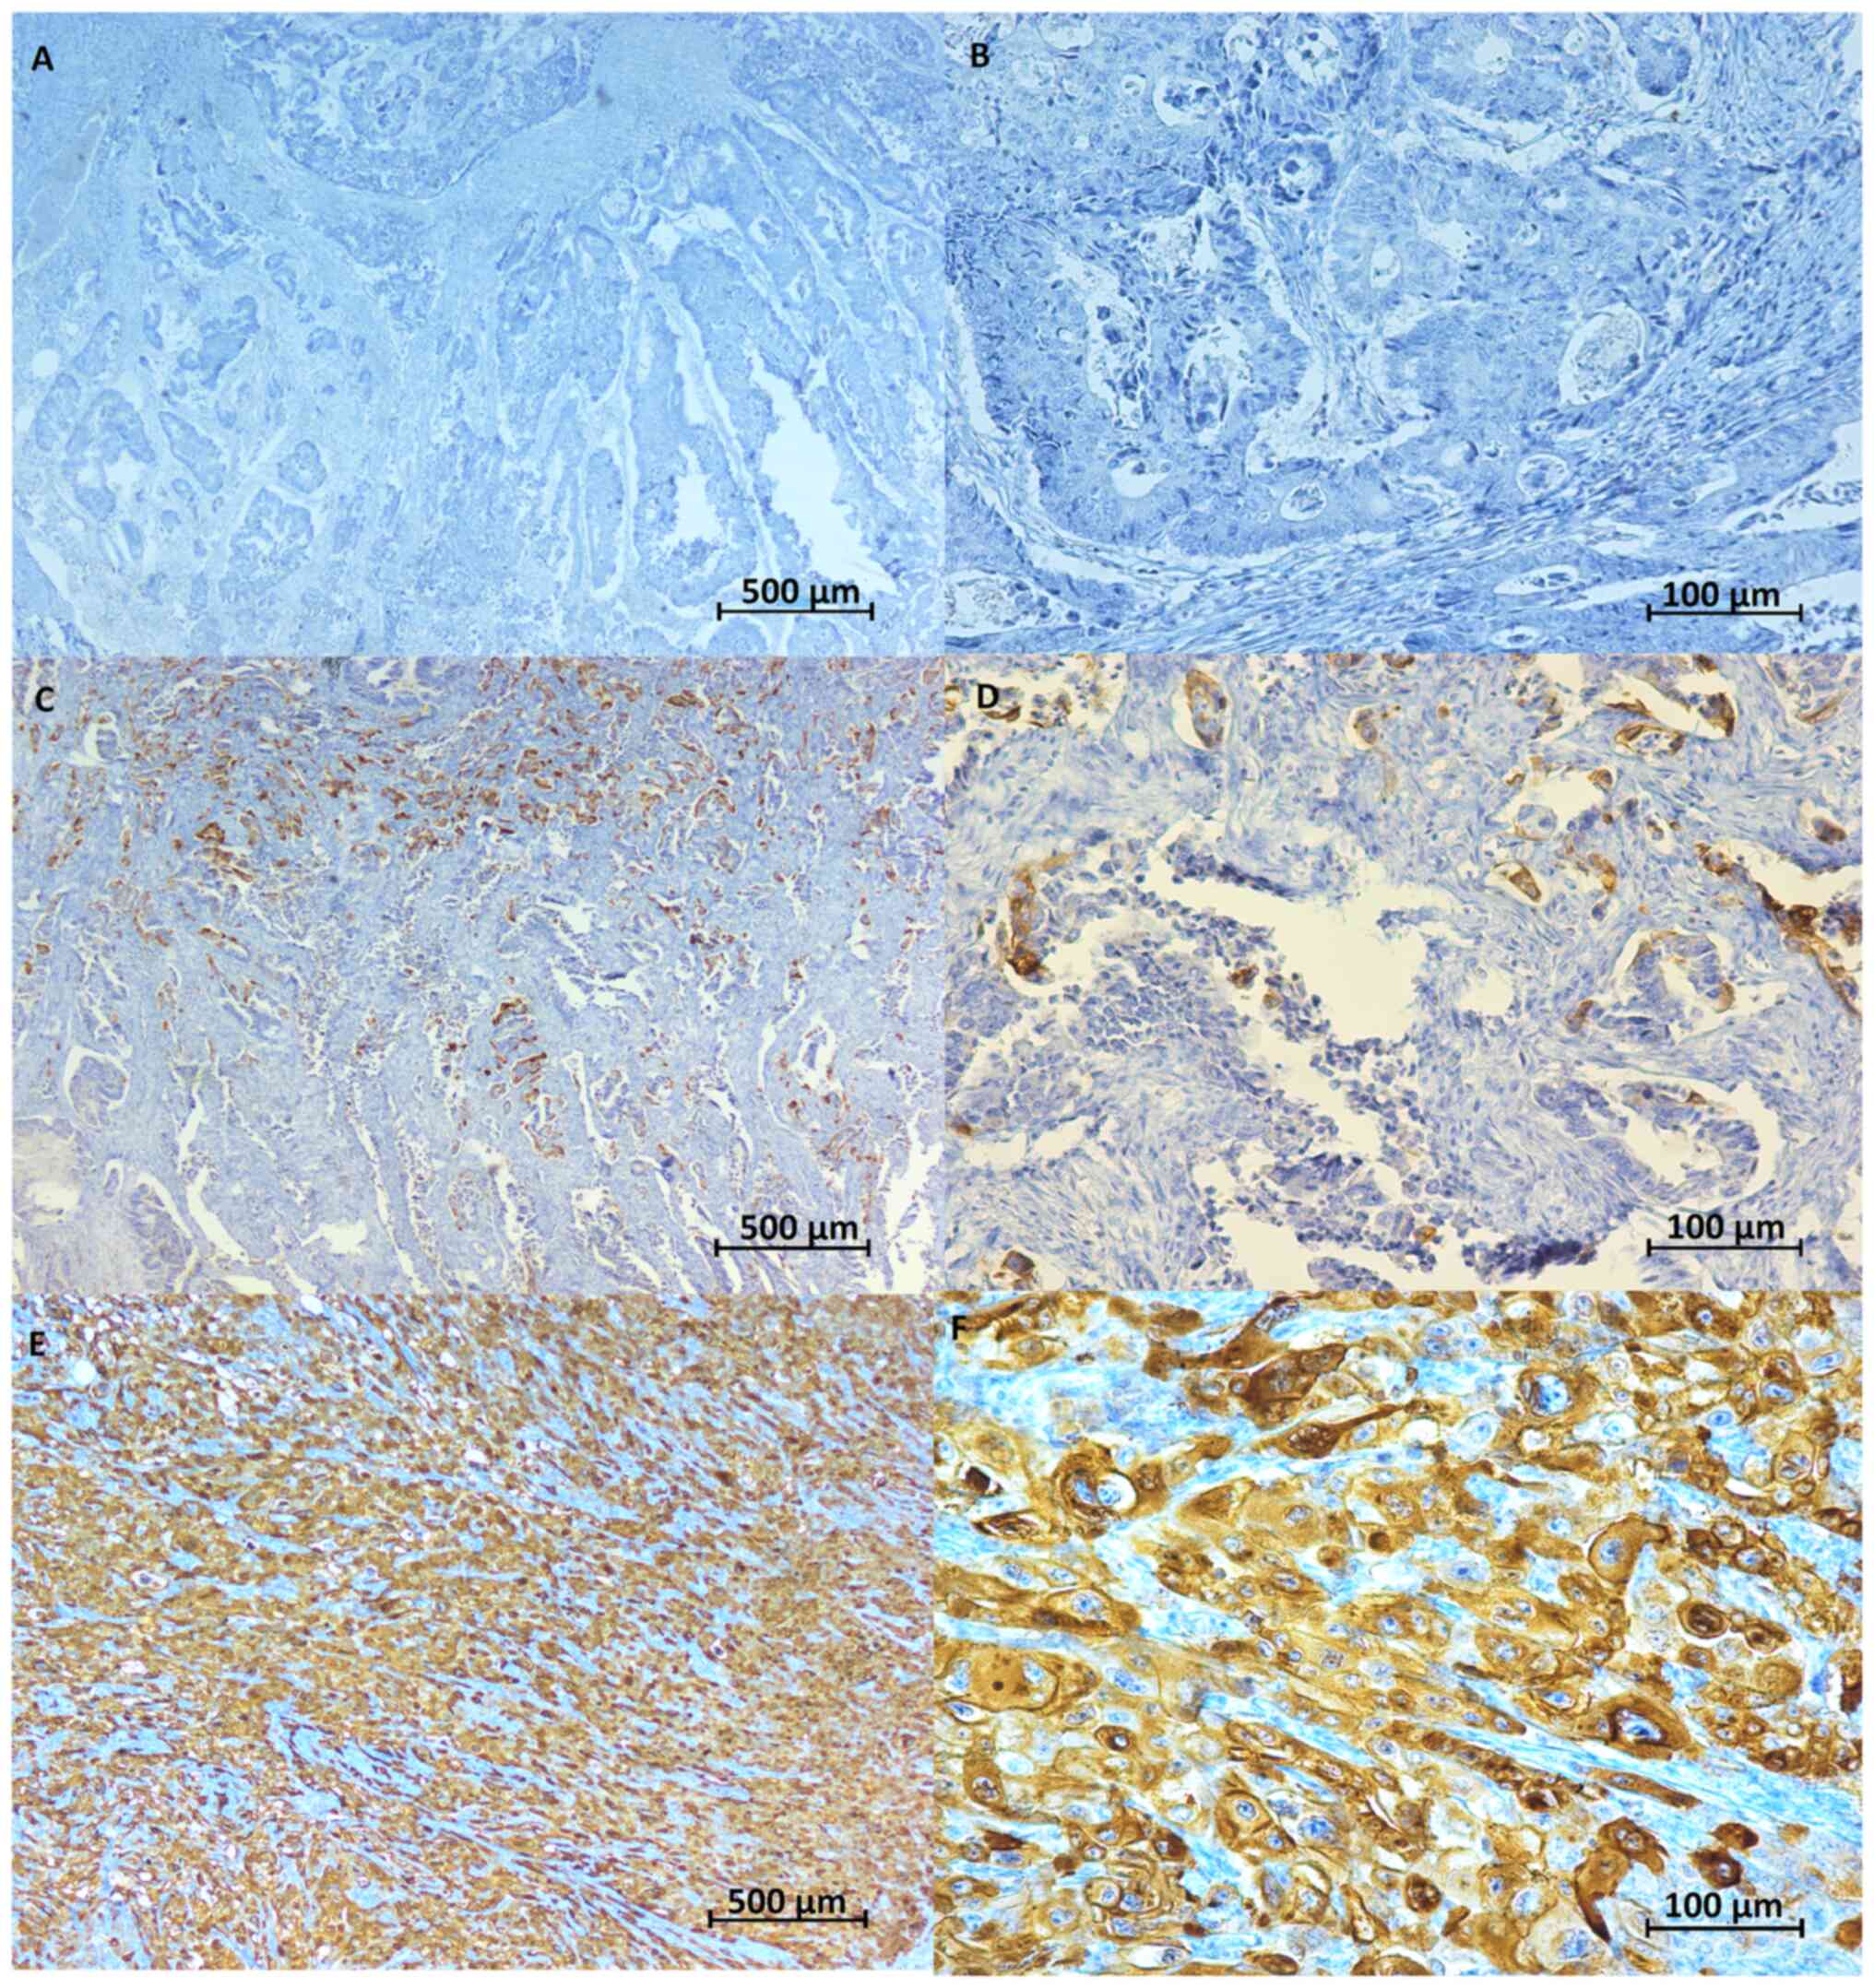 | Figure 1.Representative image of
immunohistochemical HLA-G expression. HLA-G showed cytoplasmic
staining in tumor tissues. Scale bar, 500 µm (A, C and E) or 100 µm
(B, D and F). (A) Negative HLA-G staining in cancer tissue
(magnification, ×4). (B) Negative HLA-G staining in cancer tissue
(magnification, ×20). (C) HLA-G staining <20% in cancer tissue
(magnification, ×4). (D) HLA-G staining <20% in cancer tissue
(magnification, ×20). (E) Positive HLA-G staining in cancer tissue
(magnification, ×4). (F) Positive HLA-G staining in cancer tissue
(magnification, ×20). HLA-G, human leukocyte antigen G. |
| Table II.miRNA levels in non-tumor and tumor
tissues. |
Table II.
miRNA levels in non-tumor and tumor
tissues.
| Variable | ΔCT mean (SD) | ΔCT median
(minimum-maximum) | Za | P-value |
|---|
| miR-148a |
|
|
|
|
|
Non-tumor | 1.33 (0.57) | 0.92
(0.02-3.02) | −5.238 |
<0.001b |
|
Tumor | 0.66 (0.44) | 0.68
(0.01-2.87) |
|
|
| miR-152 |
|
|
|
|
|
Non-tumor | 0.84 (0.41) | 0.85
(0.01-2.62) | −1.279 | 0.123 |
|
Tumor | 0.93 (0.41) | 0.88
(0.01-2.74) |
|
|
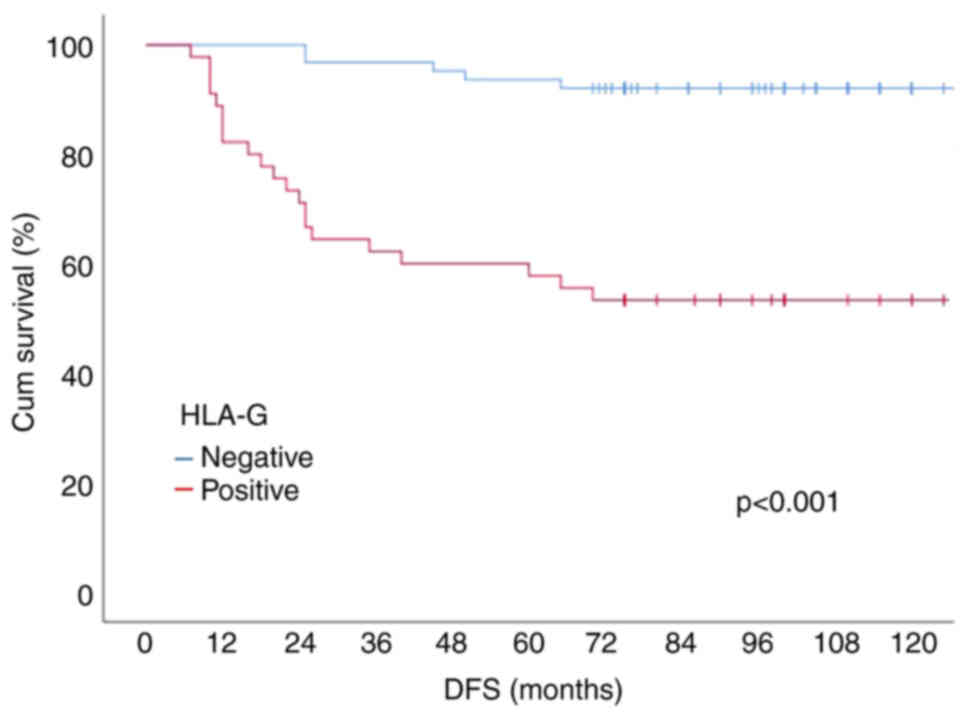
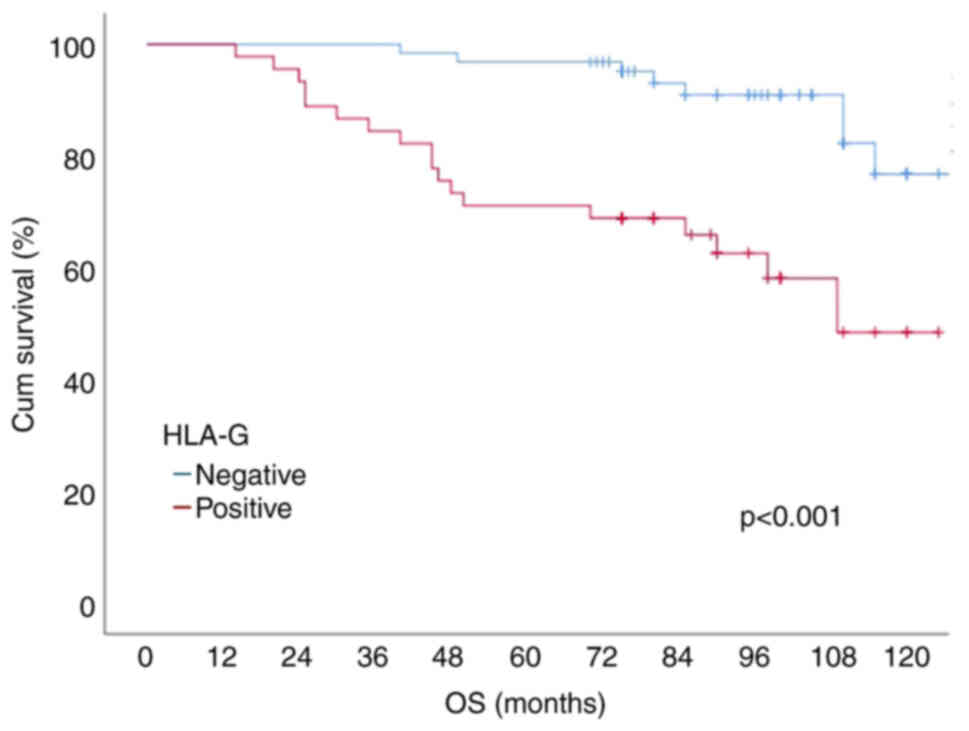
Survival analyses
The mean follow-up period was 87.46±26.29 months,
and the median follow-up period was 90 (14–127) months. A total of
32 (29.6%) patients received adjuvant fluoropyrimidine-based
chemotherapy. The rate of adjuvant therapy was significantly higher
(46.6 vs. 17.4%, P=0.041) in the HLA-G positive group. The mean
disease-free survival (DFS) time was 80.41±34.13 months, and the
median DFS time was 90 (7–127) months. During the follow-up period,
26 patients (24.1%) relapsed, 23 patients (21.3%) died due to
disease, and 3 patients (2.8%) died due to other causes. According
to the Kaplan-Meier survival analysis results, the 10-year DFS, and
OS (overall survival) probabilities of the patients were 75.9, 72.8
and 65.2%, respectively. Patients with positive HLA-G expression
had a lower 10-year DFS rate (92.1 vs. 53.3%, P<0.001).
According to the results of the univariate Cox regression analysis,
miR-148a levels were found to be associated with DFS (P=0.014)
(Table III). According to the
multivariate Cox regression analysis, the presence of HLA-G
expression, grade 3 tumor, and N2 status were shown to be
independent factors that negatively affected survival (Table IV). Survival curves according to
HLA-G status are shown in Figs. 2
and 3.
| Table III.Five-year survival rates of
patients. |
Table III.
Five-year survival rates of
patients.
| Category | No. | 5-year DFS, % | P-value | 5-year DSS, % | P-value | 5-year OS, % | P-value |
|---|
| Age group |
|
|
|
|
|
|
|
| <70
years | 50 | 72.8 | 0.292 | 72.8 | 0.445 | 70.1 | 0.558 |
| ≥70
years | 58 | 79.3 |
| 78.1 |
| 60.2 |
|
| Sex |
|
|
|
|
|
|
|
|
Male | 60 | 71.7 | 0.266 | 70.1 | 0.174 | 67.8 | 0.163 |
|
Female | 48 | 81.2 |
| 84.5 |
| 73.9 |
|
| Tumor
localization |
|
|
|
|
|
|
|
|
Cecum | 12 | 66.7 | 0.625 | 64.3 | 0.353 | 64.3 | 0.143 |
|
Ascending colon | 17 | 88.2 |
| 80.2 |
| 80.1 |
|
| Hepatic
flexura | 10 | 70.2 |
| 70.5 |
| 70.4 |
|
|
Transvers colon | 6 | 83.3 |
| 83.3 |
| 83.3 |
|
| Splenic
flexura | 11 | 63.6 |
| 63.6 |
| 63.6 |
|
|
Descending colon | 21 | 81.3 |
| 86.6 |
| 86.6 |
|
| Sigmoid
colon | 31 | 74.2 |
| 80.1 |
| 70.4 |
|
| Tumor side |
|
|
|
|
|
|
|
| Right
colon | 45 | 77.8 | 0.673 | 81.7 | 0.702 | 62.3 | 0.889 |
| Left
colon | 63 | 74.6 |
| 75.9 |
| 68.2 |
|
| Histopathology |
|
|
|
|
|
|
|
|
Adenocarcinoma | 92 | 75.8 | 0.634 | 78.1 | 0.835 | 66.4 | 0.851 |
|
Mucinous carcinoma | 16 | 81.3 |
| 81.3 |
| 81.3 |
|
| Invasion |
|
|
|
|
|
|
|
|
pT1/2 | 19 | 100 | 0.011a | 100 | 0.021a | 100 | 0.014a |
|
pT3/4 | 89 | 70.8 |
| 71.4 |
| 59.1 |
|
| Nodal status |
|
|
|
|
|
|
|
|
pN0 | 66 | 84.8 |
<0.001a | 86.8 |
<0.001a | 82.7 |
<0.001a |
|
pN1 | 27 | 81.5 |
| 81.5 |
| 76.4 |
|
|
pN2 | 15 | 26.7 |
| 37.3 |
| 37.3 |
|
| Stage |
|
|
|
|
|
|
|
| I | 17 | 100 | 0.009a | 100 | 0.023a | 100 | 0.003a |
| II | 50 | 78.2 |
| 80.5 |
| 75.5 |
|
|
III | 41 | 63.4 |
| 67.2 |
| 55.1 |
|
| Grade |
|
|
|
|
|
|
|
|
I/II | 94 | 79.8 | 0.002a | 82.4 | 0.006a | 71.4 | 0.001a |
|
III | 14 | 50.3 |
| 57.1 |
| 57.1 |
|
| LVI |
|
|
|
|
|
|
|
|
Negative | 64 | 84.4 | 0.007a | 84.4 | 0.001a | 82.6 |
<0.001a |
|
Positive | 44 | 63.6 |
| 64.2 |
| 53.5 |
|
| PNI |
|
|
|
|
|
|
|
|
Negative | 73 | 83.6 | 0.003a | 84.0 | 0.001a | 76.3 |
<0.001a |
|
Positive | 35 | 60.0 |
| 61.0 |
| 56.6 |
|
| HLA-G
expression |
|
|
|
|
|
|
|
|
Negative | 63 | 92.1 |
<0.001a | 93.1 |
<0.001a | 76.8 |
<0.001a |
|
Positive | 45 | 53.3 |
| 58.1 |
| 48.4 |
|
| miR-148a tumor |
|
|
|
|
|
|
|
|
≤0.7 | 62 | 69.4 | 0.005ª | 79.0 | 0.028ª | 69.7 | 0.070 |
|
>0.7 | 46 | 89.1 |
| 91.1 |
| 80.1 |
|
| miR-148a
non-tumor |
|
|
|
|
|
|
|
|
<1 | 62 | 88.7 | 0.006ª | 93.5 | 0.005ª | 89.6 | 0.021ª |
| ≥1 | 46 | 65.2 |
| 76.1 |
| 64.6 |
|
| miR-152 tumor |
|
|
|
|
|
|
|
|
<1 | 74 | 78.4 | 0.542 | 83.4 | 0.914 | 77.0 | 0.745 |
| ≥1 | 34 | 82.4 |
| 85.3 |
| 78.6 |
|
| miR-152
non-tumor |
|
|
|
|
|
|
|
|
<1 | 80 | 77.5 | 0.347 | 79.3 | 0.200 | 70.1 | 0.385 |
| ≥1 | 28 | 82.1 |
| 84 |
| 77.0 |
|
| Table IV.Results of multivariate Cox
regression analysis. |
Table IV.
Results of multivariate Cox
regression analysis.
|
| Disease-free
survival | Disease-specific
survival | Overall
survival |
|---|
|
|
|
|
|
|---|
| Factors | HR (95% CI) | P-value | HR (95% CI) | P-value | HR (95% CI) | P-value |
|---|
| Nodal status |
|
|
|
|
|
|
|
pN0 | 1 (Reference) |
| 1 (Reference) |
| 1 (Reference) |
|
|
pN1 | 1.10
(0.33-3.69) | 0.876 | 1.25
(0.32-4.81) | 0.749 | 1.53
(0.45-5.26) | 0.500 |
|
pN2 | 5.94
(1.92-18.42) | 0.002a | 2.09
(0.57-7.68) | 0.269 | 2.65
(0.75-9.34) | 0.129 |
| HLA-G
expression |
|
|
|
|
|
|
|
Negative | 1 (Reference) |
| 1 (Reference) |
| 1 (Reference) |
|
|
Positive | 6.07
(1.75-20.99) | 0.004a | 5.19
(1.49-18.11) | 0.010a | 3.37
(1.19-9.56) | 0.022a |
| Tumor grade |
|
|
|
|
|
|
|
I/II | 1 (Reference) |
| 1 (Reference) |
| 1 (Reference) |
|
|
III | 3.56
(1.20-10.58) | 0.022a | 1.55
(0.50-4.75) | 0.445 | 1.84
(0.67-5.10) | 0.239 |
| LVI |
|
|
|
|
|
|
|
Negative | 1 (Reference) |
| 1 (Reference) |
| 1 (Reference) |
|
|
Positive | 2.14
(0.41-11.16) | 0.366 | 3.79
(0.67-21.65) | 0.134 | 2.12
(0.44-10.32) | 0.352 |
| PNI |
|
|
|
|
|
|
|
Negative | 1 (Reference) |
| 1 (Reference) |
| 1 (Reference) |
|
|
Positive | 2.15
(0.40-11.49) | 0.373 | 1.60
(0.27-9.43) | 0.605 | 1.05
(0.24-4.65) | 0.952 |
| miR-148a tumor |
|
|
|
|
|
|
|
≤0.7 | 1 (Reference) |
| 1 (Reference) |
| 1 (Reference) |
|
|
>0.7 | 0.62
(0.20-1.93) | 0.407 | 0.76
(0.25-2.36) | 0.636 | 0.78
(0.30-2.08) | 0.624 |
| miR-148a
non-tumor |
|
|
|
|
|
|
|
<1 | 1 (Reference) |
| 1 (Reference) |
| 1 (Reference) |
|
| ≥1 | 1.26
(0.52-3.09) | 0.612 | 1.86
(0.72-4.75) | 0.198 | 1.47
(0.62-3.49) | 0.348 |
Discussion
In our study, we found that the level of miR-148a in
cancer tissue was significantly lower than in healthy adjacent
tissue, but the difference between miR-152 values was not
significant. Specifically, among the 108 patients with colon
cancer, miR-148a was weakly expressed in 82 cases (76%;
P=<0.001), and miR-152 was weakly expressed in 48 cases (44%;
P=0.123). However, no significant differences in miR-152 expression
was found between the tumor tissue and non-tumor tissue. The mean
fold changes for miR-148a and miR-152 were 0.68 and 0.88,
respectively. In a study conducted with 101 gastric cancer
patients, it was shown that 70% of cases had low expression of
miR-148a and 58% of cases had low expression of miRNA-152 when
compared to nontumor tissue. The median fold change was 0.28 and
0.50, respectively (17). In a
similar study, although miR-152 levels were found to be low in
ovarian cancer tissue, no differences were found for miR-148a
levels (18). Among the 78
patients with ovarian cancer, miR-152 was weakly expressed in 52
cases, and miR-148a was weakly expressed in 49 cases. However, no
significant differences in miR-148a expression were found between
the ovarian cancer and normal epithelium tissues. The mean
fold-chance was 0.70 and 0.37, respectively. In addition to these
studies, suppressed miR-148a expression has been demonstrated in
gastrointestinal cancers such as gastric cancer (19), colorectal cancer (20,21),
pancreatic cancer (22), and
esophageal cancer (23).
Similarly, miRNA levels were similar in all other studies. Thus,
our results were in agreement with previous studies of
gastrointestinal cancers in terms of miRNA levels. In addition, we
found that miR-148a expression was lower in HLA-G-positive tumor
tissue compared to HLA-G-negative tumor tissue. In a study on the
role of miRNAs on HLA-G expression in kidney cancer, an inverse
correlation was observed for miR-148a and miR133a with HLA-G
protein expression in situ and in vitro (24). In a similar study in esophageal
cancer, HLA-G miRNA and HLA-G protein levels were decreased in
EC9706 cells transfected with miR-148a (25).
In this study, we showed that the HLA-G protein was
expressed at varying rates in 75.9% of colon cancer samples. HLA-G
expression above 20%, which was found in 41.7% (n=45) of patients,
was significantly correlated with patient survival (P=0.039).
Previous studies have found that HLA-G expression varied between 50
and 80% in colon cancer and other gastrointestinal system cancers
(26,27). Those studies also found no HLA-G
expression in normal colon tissue, similar to our study.
Numerous studies have demonstrated that high HLA-G
expression was associated with poor prognosis in gastrointestinal
cancer patients (28–32). However, there are few studies
showing that there is no significant relationship between HLA-G
expression and the prognosis of gastrointestinal cancers (33–35).
These differences between studies may be related to the
autoantibody used. Lin et al (36) demonstrated that HLA-G expression
was related to a poor prognosis when detected with antibody 4H84,
but the results were inconsistent when using the 5A6G7 antibody. We
used 4H84 antibodies for HLA-G detection in our study. The 4H84
antibody has been confirmed by international conferences as a
reference tool for evaluating HLA-G expression in paraffin-embedded
specimens (37). Limited studies
of other antibodies could not be justify the lack of prognostic
value of HLA-G in colon cancer. Moreover, the invasive nature of
the disease and the tumor microenvironment are different in
gastrointestinal cancers, and the expression of HLA-G differs
between different cancer types, which may explain the differing
results between studies (38,39).
The number of studies showing that HLA-G expression is a poor
prognostic factor in colon cancer is increasing. Ye et al
(40) studied HLA-G expression in
colorectal carcinoma using immunohistochemistry and observed
positive HLA-G expression in 64.6% of colorectal patients. Their
multivariate analysis showed that HLA-G may serve as an independent
prognostic factor for colorectal cancer patients. Guo et al
(41) showed that HLA-G expression
is significantly correlated with OS and can serve as an independent
factor in OS. Zhang et al (39) showed that different rates of HLA-G
expression in colorectal cancer patients affect patient survival
and that a combination of HLA-G expression status with traditional
clinical risk factors can improve the prediction of specific
clinical outcomes in subpopulations of colorectal cancer patients.
The results of current studies suggest that HLA-G expression is
most likely associated with the prognosis of colorectal cancers.
Similarly, our study showed that HLA-G-positive patients had worse
outcomes in terms of both OS and DFS than HLA-G-negative
patients.
In conclusion, we found that HLA-G is expressed in
many colorectal carcinomas, and miR-148a levels in HLA-G-positive
colon cancer tissues are lower than in HLA-G-negative tissues. This
is the first study to investigate the relationship between
miR-148a, miR-152 and HLA-G in colon cancer. Using the Kaplan-Meier
analysis, we found a significant correlation between HLA-G
expression and OS in colorectal cancer patients. Furthermore, our
multivariate analysis results showed that the expression HLA-G can
serve as an independent factor for OS. According to the results of
the univariate Cox regression analysis, miR-148a levels were found
to be a factor associated with DFS. Low expression of miR-148a in
tumor tissue is associated with shorter DFS. Our results suggest
that HLA-G and miR-148a may be new prognostic markers in colon
cancer. Further investigation is needed to confirm these
results.
Acknowledgements
Not applicable.
Funding
The present study was funded by GATA Haydarpasa Training
Hospital (grant no. DS2016TO002).
Availability of data and materials
The datasets used and/or analyzed during the current
study are available from the corresponding author on reasonable
request.
Authors' contributions
LE and OO designed the study and prepared the
manuscript. LE and OO confirm the authenticity of all the raw data.
FNAM reviewed medical documents and collected patients' clinical
characteristics and was involved in the analysis of data and
validation. UB, IY, BBO, SC and MAO contributed to study design,
data analysis and manuscript editing. All authors have read and
approved the final manuscript.
Ethics approval and consent to
participate
All the procedures implemented in studies involving
human participants were consistent with the ethical standards of
the institutional and/or national research committee and with the
1964 Helsinki Declaration and its later amendments or comparable
ethical standards. All patients provided written informed consent
for participitation and patient anonymity was preserved. This
retrospective study was approved by the ethics committee of GATA
Haydarpasa Training Hospital (approval number 2016/37; Istanbul,
Turkey).
Patient consent for publication
Written informed was obtained from the patients for
publication of the data.
Competing interests
The authors declare that they have no competing
interests.
References
|
1
|
Raskov H, Pommergaard HC, Burcharth J and
Rosenberg J: Colorectal carcinogenesis-update and perspectives.
World J Gastroenterol. 20:18151–18164. 2014. View Article : Google Scholar : PubMed/NCBI
|
|
2
|
Yi M, Xu L, Jiao Y, Luo S, Li A and Wu K:
The role of cancer-derived microRNAs in cancer immune escape. J
Hematol Oncol. 13:1–14. 2020. View Article : Google Scholar
|
|
3
|
Kovats S, Main EK, Librach C, Stubblebine
M, Fisher SJ and DeMars R: A class I antigen, HLA-G, expressed in
human trophoblasts. Science. 248:220–223. 1990. View Article : Google Scholar : PubMed/NCBI
|
|
4
|
Carosella ED, Moreau P, Le Maoult J, Le
Discorde M, Dausset J and Rouas-Freiss N: HLA-G molecules: From
maternal-fetal tolerance to tissue acceptance. Ad İmmunol.
81:199–252. 2003. View Article : Google Scholar : PubMed/NCBI
|
|
5
|
Tilburgs T, Evans JH, Crespo ÂC and
Strominger JL: The HLA-G cycle provides for both NK tolerance and
immunity at the maternal-fetal interface. Proc Natl Acad Sci USA.
112:13312–13317. 2015. View Article : Google Scholar : PubMed/NCBI
|
|
6
|
Loustau M, Anna F, Dréan R, Lecomte M,
Langlade-Demoyen P and Caumartin J: HLA-G neo-expression on tumors.
Front Immunol. 11:16852020. View Article : Google Scholar : PubMed/NCBI
|
|
7
|
Carosella ED, Moreau P, LeMaoult J and
Rouas-Freiss N: HLA-G: From biology to clinical benefits. Trends
İmmunol. 29:125–132. 2008. View Article : Google Scholar : PubMed/NCBI
|
|
8
|
Favier B, LeMaoult J, Lesport E and
Carosella ED: ILT2/HLA-G interaction impairs NK-cell functions
through the inhibition of the late but not the early events of the
NK-cell activating synapse. FASEB J. 24:689–699. 2010. View Article : Google Scholar : PubMed/NCBI
|
|
9
|
Morandi F, Ferretti E, Bocca P, Prigione
I, Raffaghello L and Pistoia V: A novel mechanism of soluble HLA-G
mediated immune modulation: Downregulation of T cell chemokine
receptor expression and impairment of chemotaxis. PLoS One.
5:e117632010. View Article : Google Scholar : PubMed/NCBI
|
|
10
|
Calin GA and Croce CM: MicroRNA-cancer
connection: The beginning of a new tale. Cancer Res. 66:7390–7394.
2006. View Article : Google Scholar : PubMed/NCBI
|
|
11
|
Yaghoubi N, Avval FZ, Khazaei M and
Aghaee-Bakhtiari SH: MicroRNAs as potential investigative and
predictive biomarkers in colorectal cancer. Cell Signal.
80:1099102021. View Article : Google Scholar : PubMed/NCBI
|
|
12
|
Manaster I, Goldman-Wohl D, Greenfield C,
Nachmani D, Tsukerman P, Hamani Y, Yagel S and Mandelboim O:
MiRNA-mediated control of HLA-G expression and function. PLoS One.
7:e333952012. View Article : Google Scholar : PubMed/NCBI
|
|
13
|
Tan Z, Randall G, Fan J, Camoretti-Mercado
B, Brockman-Schneider R, Pan L, Solway J, Gern JE, Lemanske RF,
Nicolae D and Ober C: Allele-specific targeting of microRNAs to
HLA-G and risk of asthma. Am J Hum Genet. 81:829–834. 2007.
View Article : Google Scholar : PubMed/NCBI
|
|
14
|
Zhu XM, Han T, Wang XH, Li YH, Yang HG,
Luo YN, Yin GW and Yao YQ: Overexpression of miR-152 leads to
reduced expression of human leukocyte antigen-G and increased
natural killer cell mediated cytolysis in JEG-3 cells. Am J Obstet
Gynecol. 202:592e1–7. 2010. View Article : Google Scholar : PubMed/NCBI
|
|
15
|
Peskoe SB, Barber JR, Zheng Q, Meeker AK,
De Marzo AM, Platz EA and Lupold SE: Differential long-term
stability of microRNAs and RNU6B snRNA in 12–20 year old archived
formalin-fixed paraffin-embedded specimens. BMC Cancer. 17:1–7.
2017. View Article : Google Scholar : PubMed/NCBI
|
|
16
|
Livak KJ and Schmittgen TD: Analysis of
relative gene expression data using real-time quantitative PCR and
the 2(−Delta Delta C(T)) method. Methods. 25:402–408. 2001.
View Article : Google Scholar : PubMed/NCBI
|
|
17
|
Chen Y, Song Y, Wang Z, Yue Z, Xu H, Xing
C and Liu Z: Altered expression of MiR-148a and MiR-152 in
gastrointestinal cancers and its clinical significance. J
Gastrointest Surg. 14:1170–1179. 2010. View Article : Google Scholar : PubMed/NCBI
|
|
18
|
Zhou X, Zhao F, Wang ZN, Song YX, Chang H,
Chiang Y and Xu HM: Altered expression of miR-152 and miR-148a in
ovarian cancer is related to cell proliferation. Oncol Rep.
27:447–454. 2012.PubMed/NCBI
|
|
19
|
Zheng G, Xiong Y, Xu W, Wang Y, Chen F,
Wang Z and Yan Z: A two-microRNA signature as a potential biomarker
for early gastric cancer. Oncol Lett. 7:679–684. 2014. View Article : Google Scholar : PubMed/NCBI
|
|
20
|
Takahashi M, Cuatrecasas M, Balaguer F,
Hur K, Toiyama Y, Castells A, Boland CR and Goel A: The clinical
significance of MiR-148a as a predictive biomarker in patients with
advanced colorectal cancer. PLoS One. 7:e466842012. View Article : Google Scholar : PubMed/NCBI
|
|
21
|
Tsai HL, Yang IP, Huang CW, Ma CJ, Kuo CH,
Lu CY, Juo SH and Wang JY: Clinical significance of microRNA-148a
in patients with early relapse of stage II stage and III colorectal
cancer after curative resection. Transl Res. 162:258–268. 2013.
View Article : Google Scholar : PubMed/NCBI
|
|
22
|
Hanoun N, Delpu Y, Suriawinata AA, Bournet
B, Bureau C, Selves J, Tsongalis GJ, Dufresne M, Buscail L,
Cordelier P and Torrisani J: The silencing of microRNA 148a
production by DNA hypermethylation is an early event in pancreatic
carcinogenesis. Clin Chem. 56:1107–1118. 2010. View Article : Google Scholar : PubMed/NCBI
|
|
23
|
Hummel R, Hussey DJ, Michael MZ, Haier J,
Bruewer M, Senninger N and Watson DI: MiRNAs and their association
with locoregional staging and survival following surgery for
esophageal carcinoma. Ann Surg Oncol. 18:253–260. 2011. View Article : Google Scholar : PubMed/NCBI
|
|
24
|
Jasinski-Bergner S, Stoehr C, Bukur J,
Massa C, Braun J, Hüttelmaier S, Spath V, Wartenberg R, Legal W,
Taubert H, et al: Clinical relevance of miR-mediated HLA-G
regulation and the associated immune cell infiltration in renal
cell carcinoma. Oncoimmunology. 4:e10088052015. View Article : Google Scholar : PubMed/NCBI
|
|
25
|
Chen Q, Luo G and Zhang X: MiR-148a
modulates HLA-G expression and influences tumor apoptosis in
esophageal squamous cell carcinoma. Exp Ther Med. 14:4448–4452.
2017.PubMed/NCBI
|
|
26
|
Hansel DE, Rahman A, Wilentz RE, Shih IM,
McMaster MT, Yeo CJ and Maitra A: HLA-G upregulation in
pre-malignant and malignant lesions of the gastrointestinal tract.
Internat J Gastrointest Cancer. 35:15–23. 2005. View Article : Google Scholar : PubMed/NCBI
|
|
27
|
Swets M, König MH, Zaalberg A,
Dekker-Ensink NG, Gelderblom H, van de Velde CJ, van den Elsen PJ
and Kuppen PJK: HLA-G and classical HLA class I expression in
primary colorectal cancer and associated liver metastases. Hum
İmmunol. 77:773–779. 2016. View Article : Google Scholar : PubMed/NCBI
|
|
28
|
Murdaca G, Calamaro P, Lantieri F, Pigozzi
S, Mastracci L, Grillo F, Magnani O, Ceppa P, Puppo F and Fiocca R:
HLA-G expression in gastric carcinoma: Clinicopathological
correlations and prognostic impact. Virchows Arch. 473:425–433.
2018. View Article : Google Scholar : PubMed/NCBI
|
|
29
|
Shahraki PK, Alavian-Mehr A and Farjadian
S: HLA-G: Facts and fictions. Asian Pac J Cancer Biol. 3:37–45.
2018. View Article : Google Scholar
|
|
30
|
Tuncel T, Karagoz B, Haholu A, Ozgun A,
Emirzeoglu L, Bilgi O and Kandemir EG: Immunoregulatory function of
HLA-G in gastric cancer. Asian Pac J Cancer Prev. 14:7681–7684.
2013. View Article : Google Scholar : PubMed/NCBI
|
|
31
|
Wang Y, Ye Z, Meng XQ and Zheng SS:
Expression of HLA-G in patients with hepatocellular carcinoma.
Hepatobiliary Pancreat Dis İnt. 10:158–163. 2011. View Article : Google Scholar : PubMed/NCBI
|
|
32
|
Peng Y, Xiao J, Li W, Li S, Xie B, He J
and Liu C: Prognostic and clinicopathological value of human
leukocyte antigen G in gastrointestinal cancers: A meta-analysis.
Front Oncol. 11:6429022021. View Article : Google Scholar : PubMed/NCBI
|
|
33
|
Ishigami S, Natsugoe S, Miyazono F, Nakajo
A, Tokuda K, Matsumoto M, Okumura H, Douchi T, Hokita S and Aikou
T: HLA-G expression in gastric cancer. Anticancer Res.
26:2467–2472. 2006.PubMed/NCBI
|
|
34
|
Leelawat K, Engprasert S, Pongchai-rerk U,
Suthipintawong C and Leardkamolkarn V: No expression of human
leukocyte antigen G (HLA-G) in colorectal cancer cells. J Med Assoc
Thai. 87:816–818. 2004.PubMed/NCBI
|
|
35
|
Reimers MS, Engels CC, Putter H, Morreau
H, Liefers GJ, van de Velde CJ and Kuppen PJK: Prognostic value of
HLA class I, HLA-E, HLA-G and Tregs in rectal cancer: A
retrospective cohort study. BMC Cancer. 14:1–12. 2014. View Article : Google Scholar : PubMed/NCBI
|
|
36
|
Lin A, Chen HX, Zhu CC, Zhang X, Xu HH,
Zhang JG, Wang Q, Zhou WJ and Yan WH: Aberrant human leucocyte
antigen-G expression and its clinical relevance in hepatocellular
carcinoma. J Cell Mol Med. 14:2162–2171. 2010. View Article : Google Scholar : PubMed/NCBI
|
|
37
|
Lin A, Zhang X, Zhou WJ, Ruan YY, Xu DP,
Wang Q and Yan WH: Human leukocyte antigen-G expression is
associated with a poor prognosis in patients with esophageal
squamous cell carcinoma. Int J Cancer. 129:1382–1390. 2011.
View Article : Google Scholar : PubMed/NCBI
|
|
38
|
Farjadian S, Tabebordbar M, Mokhtari M,
Safaei A, Malekzadeh M and Ghaderi A: HLA-G expression in tumor
tissues and soluble HLA-G plasma levels in patients with
gastrointestinal cancer. Asian Pac J Cancer Prev. 19:2731–2735.
2018.PubMed/NCBI
|
|
39
|
Zhang RL, Zhang X, Dong SS, Hu B, Han QY,
Zhang JG, Zhou WJ, Lin A and Yan WH: Predictive value of different
proportion of lesion HLA-G expression in colorectal cancer.
Oncotarget. 8:107441–107451. 2017. View Article : Google Scholar : PubMed/NCBI
|
|
40
|
Ye SR, Yang H, Li K, Dong DD, Lin XM and
Yie SM: Human leukocyte antigen G expression: As a significant
prognostic indicator for patients with colorectal cancer. Mod
Pathol. 20:375–383. 2017. View Article : Google Scholar : PubMed/NCBI
|
|
41
|
Guo ZY, Lv YG, Wang L, Shi SJ, Yang F,
Zheng GX, Wen WH and Yang AG: Predictive value of HLA-G and HLA-E
in the prognosis of colorectal cancer patients. Cell İmmunol.
293:10–16. 2015. View Article : Google Scholar : PubMed/NCBI
|