Introduction
Colorectal cancer (CRC) is one of the commonest and
lethal malignancies worldwide. More than 1.2 million new CRC cases
were reported globally in 2020 according to cancer prevalence
statistics (1). Due to the effect
of COVID-19 in 2020, poor medical conditions will certainly lead to
a higher fatality rate in the future. With the growth health
awareness among individuals, the detection rate of CRC is
increasing. However, the metastatic rate of colorectal cancer
remains high, especially liver metastasis of colorectal cancer,
which leads to a low 5-year survival rate of colorectal cancer
(2). Currently, CRC screening
trials mainly rely on colonoscopy and some blood tests such as
carcinoembryonic antigen (CEA), carbohydrate antigen 19–9 (CA19-9)
and fecal occult blood test (FOBT) (3). Although a number of new molecular
targets continue to be discovered as diagnostic and predictive
biomarkers for CRC, such as microRNAs and circular RNAs (4,5),
there remains a number of challenges that hinder the clinical
practice for real applications. Thus, it is an urgent need to
identify new biomarkers that can accurately predict CRC, especially
metastatic CRC, to improve the prognosis and curative effect of
adenocarcinoma.
LIM domain kinase 1 (LIMK1) is a kinase of the LIMK
family and consists of two related proteins, LIMK1 and LIMK2
(6,7). LIMK1 is mainly expressed in the
cytoplasm and small amounts in the nucleus (8). LIMK1 promotes actin polymerization
and phosphorylates its downstream target cofilin, which further
influences cell growth and functions, including cell proliferation,
angiogenesis and cell cycle progression (9,10).
In the initiation and progression of tumors, studies have verified
that the abnormal expression of LIMK1 is closely related to the
change of biological behavior of several human tumors, especially
prostate cancer, breast cancer and gastric cancer (11–14).
A study by Zhang et al (11) indicate that lung carcinoma cell
proliferation and tumor metastasis are suppressed by inhibiting
LIMK1 activity in vivo and in vitro. In a subsequent
bioinformatics analysis, it is reported that the expression of
LIMK1 is significantly correlated with tumor-infiltrating immune
cells and poor prognosis of lung cancer (15). In CRC, a few studies have
demonstrated that upregulation of LIMK1 through direct or indirect
pathways can promote colorectal cancer cell proliferation, invasion
and migration in vitro (16,17).
Therefore, LIMK1 may be a suitable biomarker for the diagnosis and
treatment of CRC.
Although the fact that regulation of LIMK1
expression could change malignant biological behaviors such as
proliferation and migration of CRC (16), the association between LIMK1 and
the immune microenvironment has not been reported in CRC. The
present study hypothesized that LIMK1 might influence immune cells
or other immune markers in CRC. To test this, the differential and
prognostic value of LIMK1 was first explored in CRC based on data
from The Cancer Genome Atlas (TCGA) database, GEPIA and TIMER 2.0
database. It was found that LIMK1 was indeed upregulated in CRC and
this conclusion was verified using the Gene Expression Omnibus
database (GEO) and clinical samples from Tianjin Medical University
General Hospital. Moreover, the expression of LIMK1 was associated
with multiple clinicopathological features of CRC patients. The
association between LIMK1 and immune-related indicators in CRC was
further evaluated. In brief, the association between the high
expression of LIMK1 and CRC was analyzed from different
perspectives.
Materials and methods
TCGA and GEO
The raw gene transcriptome data of LIMK1 and the
clinical data of participants were downloaded from the TCGA
(https://portal.gdc.cancer.gov/) and GEO
websites (https://www.ncbi.nlm.nih.gov/geo/). The groups without
a normal control group were excluded and the rest were included in
the statistical analysis. For follow-up studies, the downloaded
gene expression data was converted into TPM format and ID
conversion performed. The processed data were then analyzed using
‘limma’ (version 3.50.3) and ‘ggplot2’ (version 3.3.5) (18,19)
in R software (RStudio, Inc.; version 4.1.2; 64-bit; http://www.r-project.org/).
Survival analysis
The mRNA expression data of LIMK1 and survival data
of CRC patients were downloaded from the TCGA websites. The median
value of LIMK1 expression was set as the cut-off value used to
separate patients into high and low expression groups. The overall
survival (OS) rates, disease-specific survival (DSS) rates and
progression-free interval (PFI) analyses were performed by drawing
Kaplan-Meier curves to compare the survival differences. The data
were analyzed and visualized using ‘survival’ (https://CRAN.R-project.org/package=survival; version
3.3-1), ‘survminer’ (https://CRAN.R-project.org/package=survminer; version
0.4.9) and ‘ggplot2’ in R software.
Tumor immune estimation resource 2.0
(TIMER 2.0) database
TIMER 2.0 (http://timer.cistrome.org/) is an online resource that
provides comprehensive analysis and visualization functions of
tumor-infiltrating immune cells (20). The efficacy of tumors and
immunotherapy is largely influenced by the composition and
abundance of immune cells in the tumor microenvironment (20). TIMER 2.0 allows users to select any
gene of interest and visualize the correlation of its expression
with immune infiltration levels in diverse cancer types. The
present study analyzed the correction of LIMK1 expression and
various immune cells in CRC. The correlation analysis was analyzed
using Spearman's method.
The human protein atlas (HPA)
The expression of proteins in cells, normal tissues
and cancerous tissues is shown in HPA (https://www.proteinatlas.org/; version 21.0) (21). The present study compared the
protein expression of LIMK1 between CRC tumorous tissue and normal
adjacent tissue by HPA.
Protein-protein interaction (PPI)
networks and functional enrichment analysis
STRING (version 11.5) is available online and is
user-friendly (22). It was used
to search for co-expressed genes of LIMK1 by STRING and PPI
networks were constructed using the top 10 genes by interaction
scores. The correlations between LIMK1 expression and the top 10
genes were analyzed in CRC tumor samples. The correlation
coefficient was analyzed using Spearman's method. Gene Ontology
(GO) term enrichment (23) and
Kyoto Encyclopedia of Genes and Genomes (KEGG) (24) pathway enrichment of the genes
obtained by screening were analyzed by the ‘ClusterProfiler’
package (version 4.2.2) (25) and
‘ggplot2’ package in R software.
Correlation analysis of immune cell
markers in GEPIA
The online database Gene Expression Profiling
Interactive Analysis (GEPIA) (http://gepia.cancer-pku.cn/index.html; version 1.0)
has multiple functions, such as genetic difference analysis,
survival prognosis and correlation analysis in multiple cancer
types. A few gene markers that are currently widely recognized in
immune cells were found. The correlations between LIMK1 and immune
cell markers were analyzed by comparing their expression in the
tumor tissues. The correlation coefficient was analyzed using
Spearman's method.
Cell lines culture
The CRC cell lines SW480, LOVO, HCT116, DLD-1, SW620
and CRC normal epithelial cell line NCM460 were obtained from the
Laboratory of General Surgery, Tianjin Medical University General
Hospital (Tianjin, China). Mycoplasma testing (Beijing Solarbio
Science & Technology Co., Ltd.) was performed for all cell
lines used. These cell lines were cultured in RPMI-1640 medium
(Gibco; Thermo Fisher Scientific, Inc.) containing 10% FBS
(Hyclone; Cytiva) and 1% penicillin-streptomycin (Gibco; Thermo
Fisher Scientific, Inc.) and incubated at 37°C with 5%
CO2. Cell lines were tested for mycoplasma (PCR
Mycoplasma; Venor GeM Mycoplasma Detection kit; MilliporeSigma and
negative results were obtained.
RNA extraction and reverse
transcription-quantitative (RT-q)PCR
The present study was approved by the Ethics
Committee of the Tianjin Medical University General Hospital
Ethical Committee (approval no. 2021-WZ-203). Between February 2020
and December 2020, 46 tumor tissue samples and normal adjacent
tissue samples were collected from patients with CRC. All
participants (Fig. 4F) signed an
informed consent form. Tissue samples were stored in a refrigerator
at −80°C. Total RNA from CRC cell lines and tissue samples was
extracted with TRIzol® reagent (Thermo Fisher
Scientific, Inc.) according to the manufacturer's instructions. The
concentration of RNA was measured using a NanoDrop-2000
spectrophotometer (Thermo Fisher Scientific, Inc.). The 260/280
ratios of RNA from 1.7-2.0 were reversely transcribed using the
FastQuant RT Supermix kit (Tiangen Biotech, Co., Ltd.).
Subsequently, RT-qPCR was performed using SYBR Green qPCR Master
Mix (Bimake Biotechnology). The thermocycling conditions were as
follows: 95°C for 30 sec, followed by 40 cycles of 95°C for 10 sec
and 60°C for 30 sec, finally denaturation at 95°C for 15 sec, 60°C
for 60 sec and 95°C for 15 sec. mRNA expression was quantified
using the 2−ΔΔCq method (26). The experiments were performed as
three replicates. GAPDH was used to normalize LIMK1 expression. The
primer sequences were as follows: LIMK1 forward,
5′-TTGCCAAGGACATCGCATCAGG-3′ and reverse,
5′-CGAAGTCAGCCACCACCACATT-3′; GAPDH forward,
5′-TGGCACCGTCAAGGCTGAGAA-3′ and reverse,
5′-TGGTGAAGACGCCAGTGGACTC-3′.
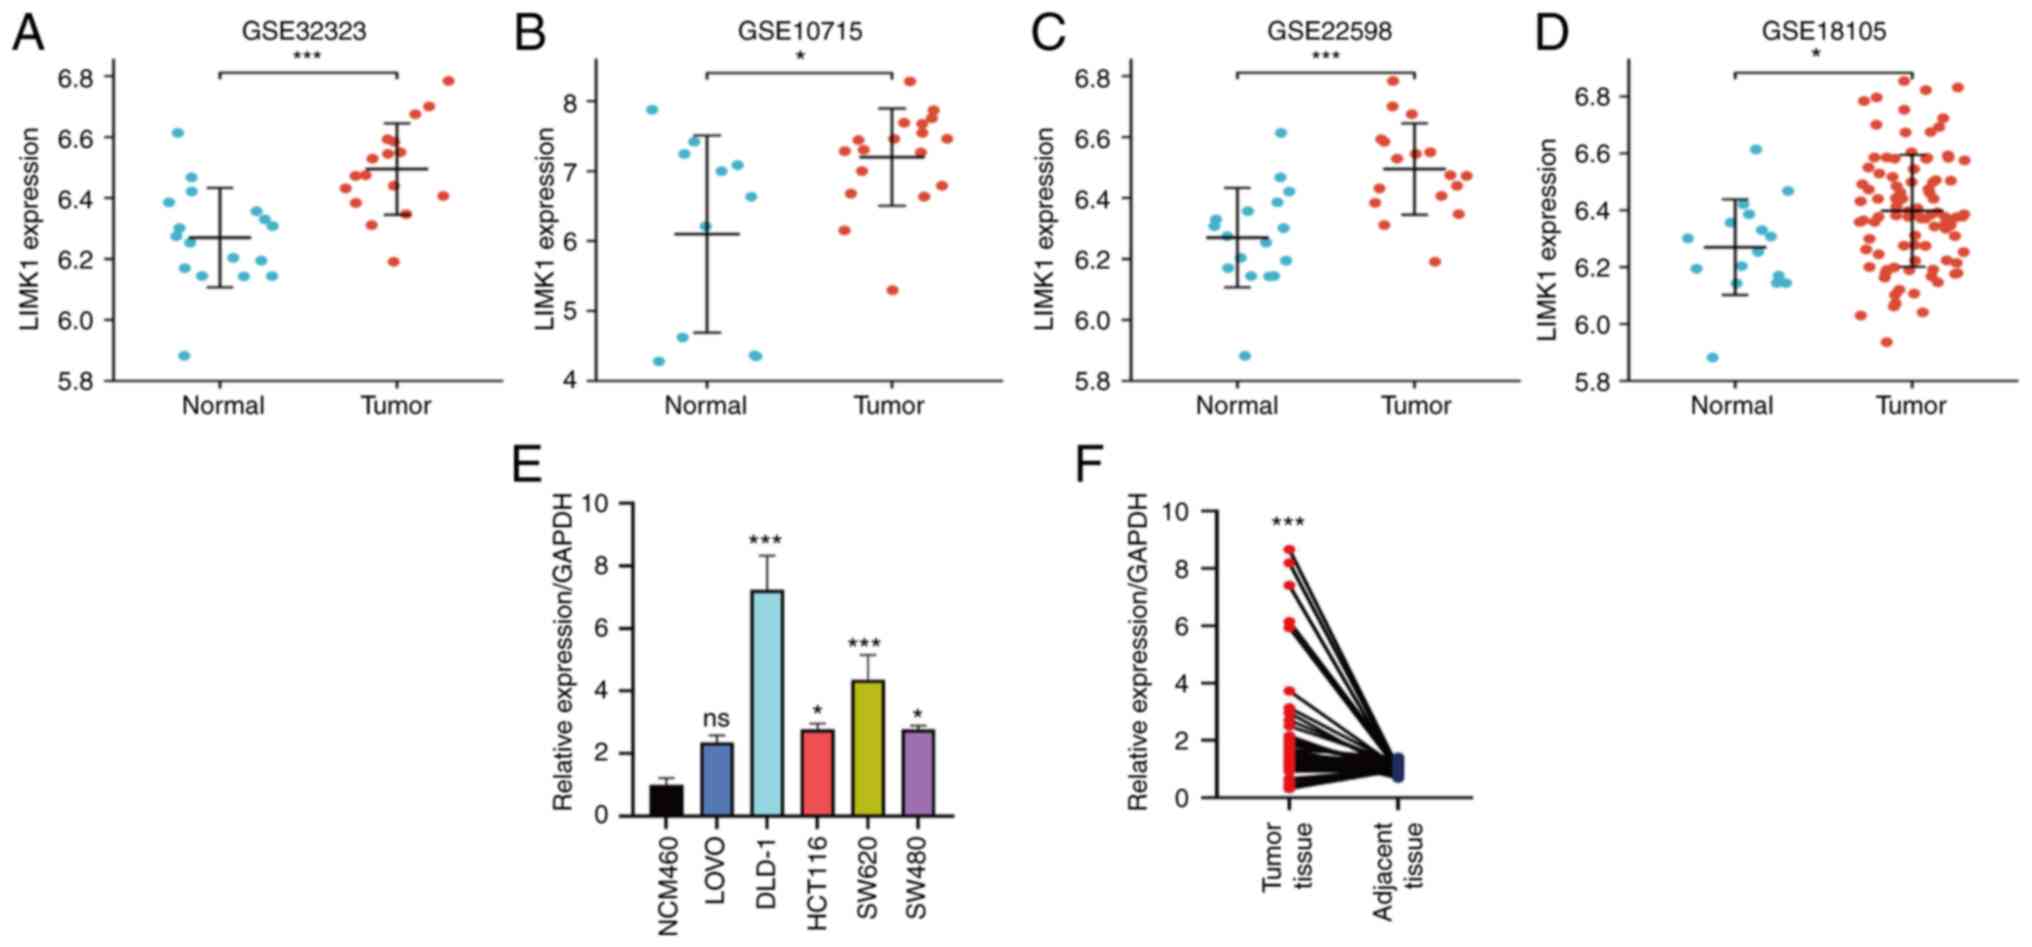 | Figure 4.Verification of LIMK1 expression in
GEO databases and tumor samples. (A-D) LIMK1 expression was
verified higher than normal tissues in GSE 10715, GSE 18105, GSE
22598 and GSE 32323. (E) The expression in CRC cell lines (SW480,
LOVO, HCT116, DLD-1 and SW620) and normal epithelial cell line
(NCM460). (F) The LIMK1 expression level was upregulated in CRC
tissues (n=46). ns, no significance; *P<0.05, ***P<0.001.
LIMK1, LIM domain kinase 1; GEO, Gene Expression Omnibus; CRC,
colorectal cancer. |
Statistical analyses
All statistical analyses were performed and
visualized using R software (4.1.0) and the R packages mentioned
above. Comparisons between tumor tissues and normal tissues were
performed using the paired t-test or Mann-Whitney U-test depending
on data distribution. Comparisons between multiple groups were made
using one-way analysis of variance (ANOVA). Bonferroni post-hoc
tests were performed when appropriate. ROC curves were plotted and
the ROC curve calculated using the R package ‘pROC’ (version
1.18.0) (27).
Results
mRNA expression differences and
prognosis analysis of LIMK1 in pan-cancer
As mentioned in previous study (28), LIMK1 was differentially expressed
in a variety of types of cancer. To determine the intracellular
localization of LIMK1, the distribution of LIMK1 was studied in
three tumor cell lines according to the HPA database. LIMK1 was
expressed in varying degrees in the nucleus and cytoplasm (Fig. 1A and B). LIMK1 also had different
levels of RNA expression in cell lines of different tissues
(Fig. 1C). The expression of LIMK1
was analyzed in 33 types of cancer and the corresponding para
cancer types. As shown in Fig. 1D,
the expression of LIMK1 was significantly upregulated in 12 types
of tumors, including colon cancer, rectal cancer, lung cancer and
stomach cancer. However, LIMK1 was downregulated in brain lower
grade glioma (LGG; P<0.01). Therefore, it was confirmed that
LIMK1 was differentially expressed in different types of cancer.
Subsequently, to verify whether the differential expression of
LIMK1 was related to the patient's survival prognosis, the
prognostic indicators of patients with differential expression of
LIMK1 were analyzed. As shown in Fig.
2, the results showed that the overall survival of colon
adenocarcinoma (COAD; HR=1.55, P=2.60×10⁻²), kidney
renal papillary cell carcinoma (KIRP; HR=2.57,
P=2.00×10⁻³), LGG (HR=2.39, P=1.00×10⁻³),
lung adenocarcinoma (LUAD; HR=1.38, P=2.90×10⁻²) and
rectum adenocarcinoma (READ; HR=1.22, P=2.20×10⁻²) were
significantly different.
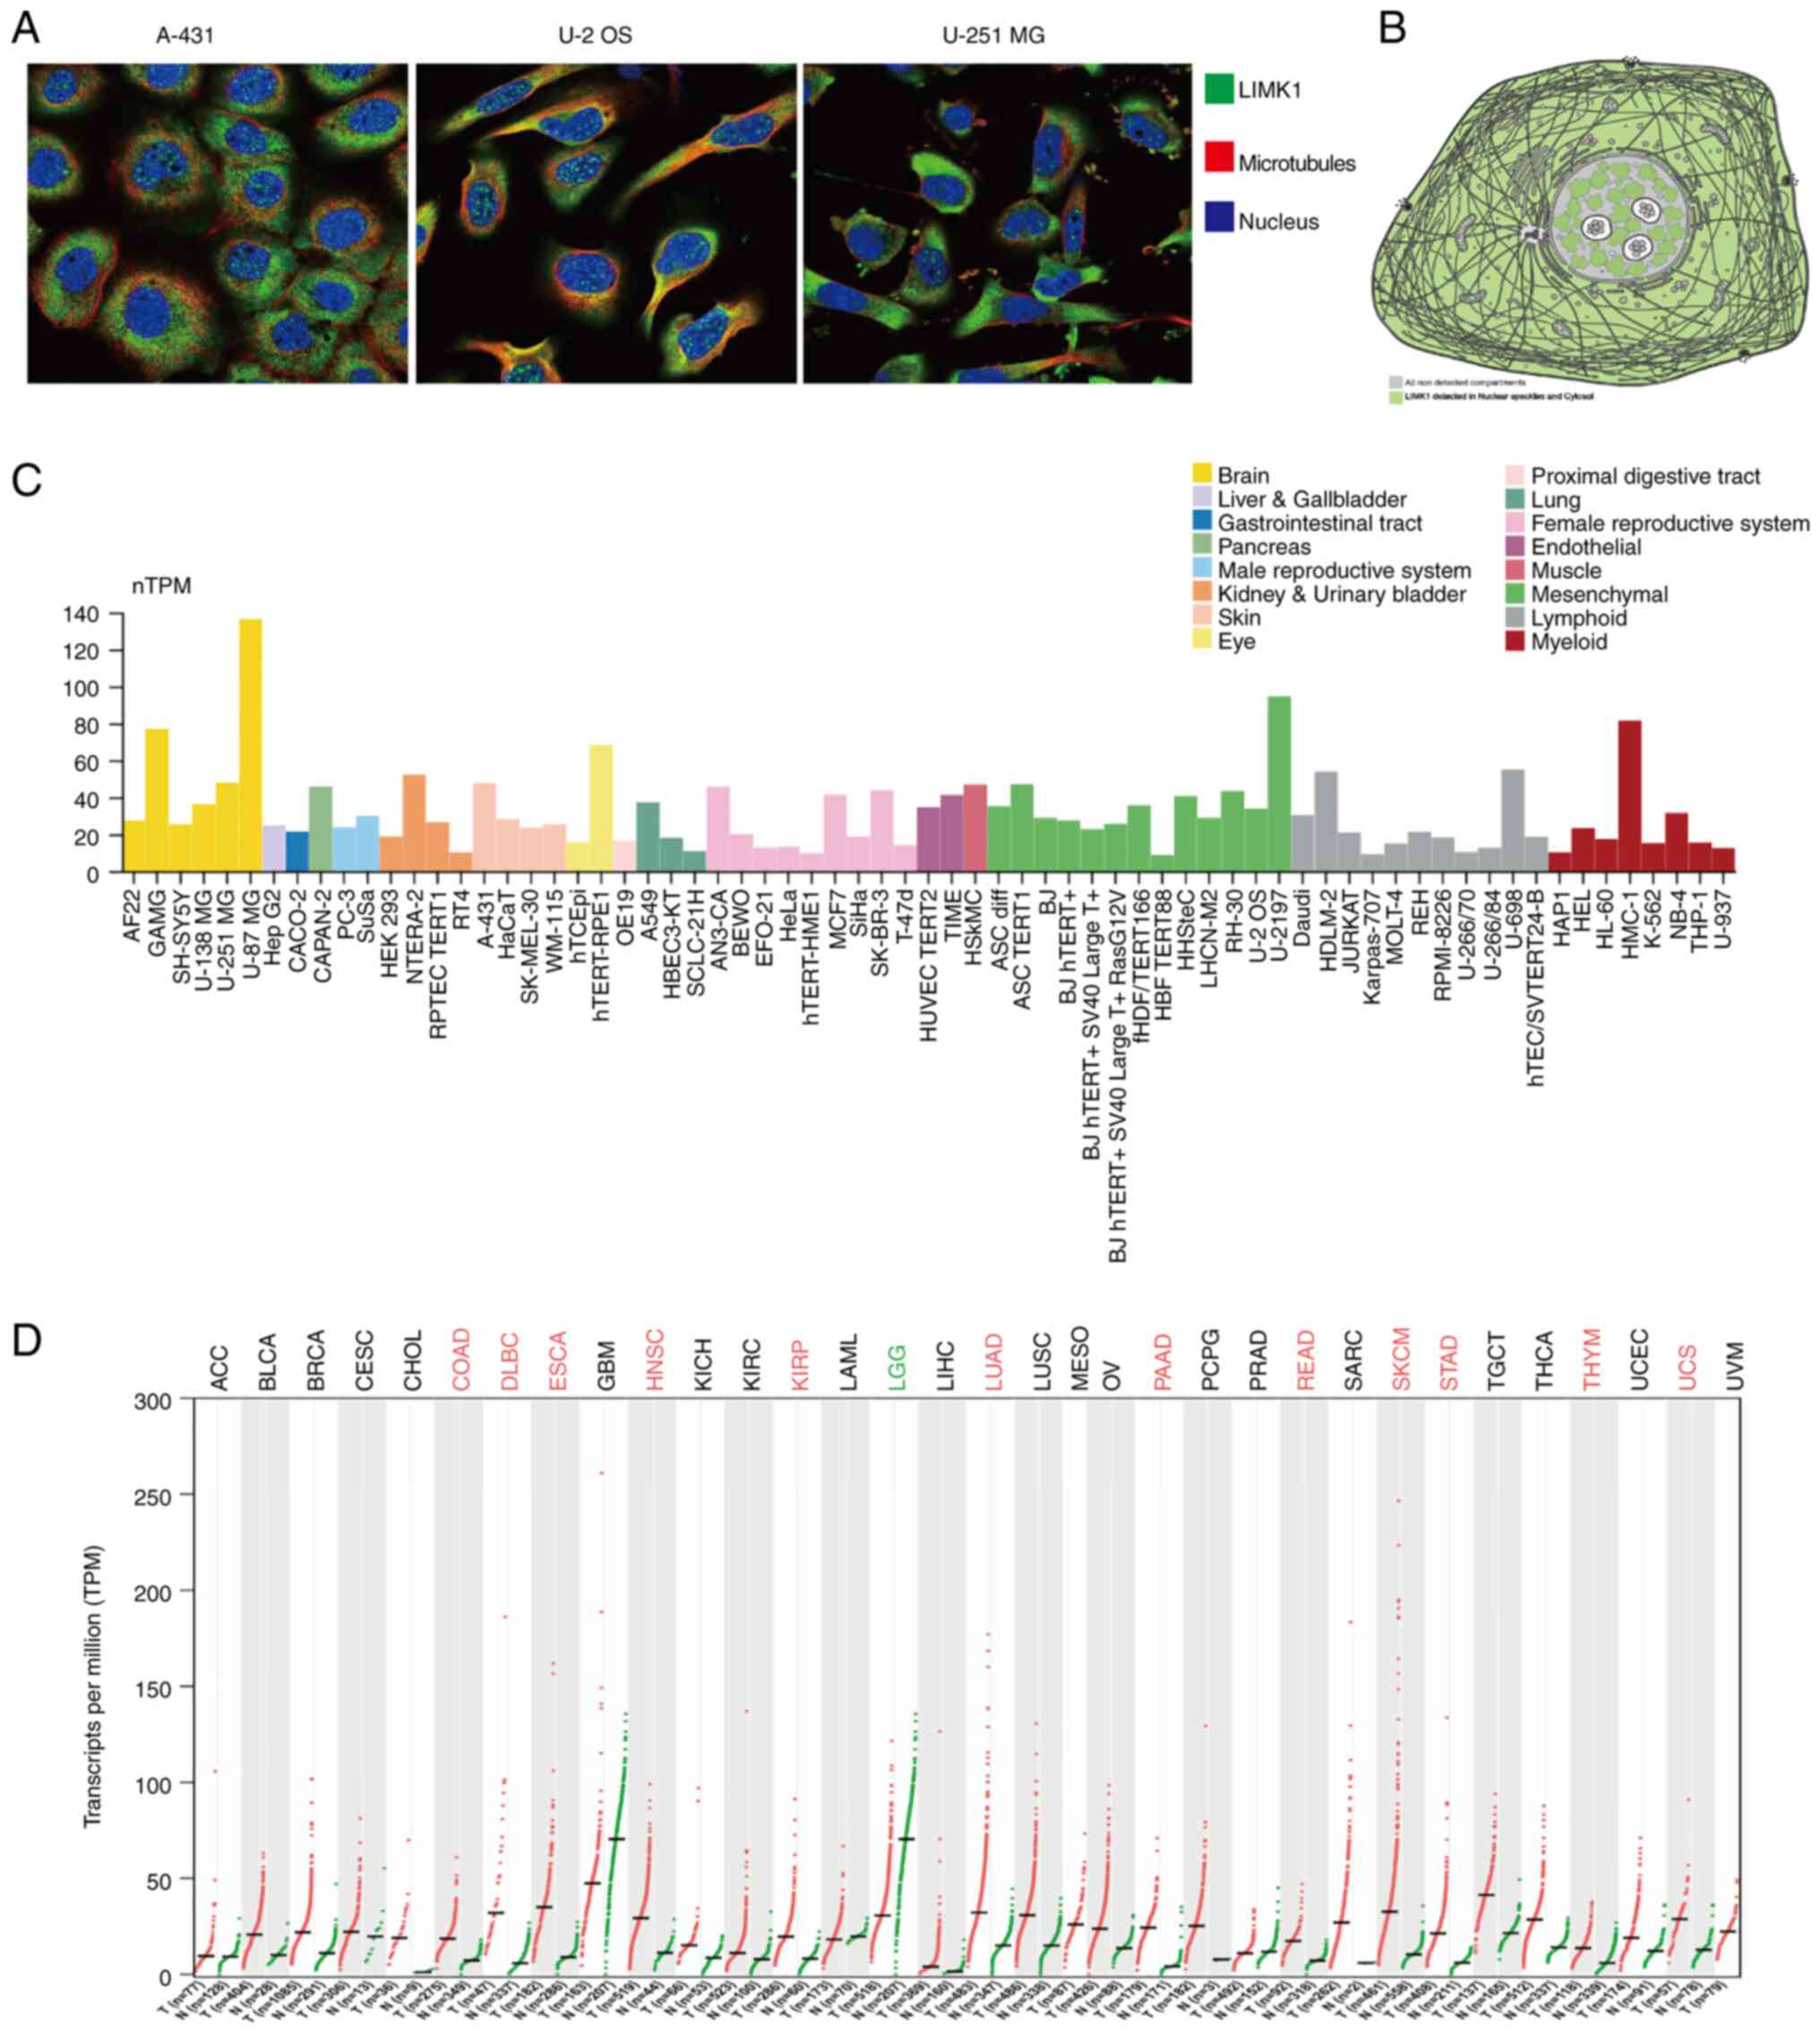 | Figure 1.LIMK1 location and expression at a
different level. (A) The subcellular distribution of LIMK1, nucleus
and microtubules of A-431, U-2 OS and U-251 MG cells as obtained
from the HPA database (magnification, ×200). (B) LIMK1 expression
pattern diagram. (C) The expression of LIMK1 in cell lines. (D)
mRNA expression differences of LIMK1 in pan-cancer. Green dots
represent normal adjacent tissue and red dots represented tumor
tissue. The tumor abbreviation in red meant that LIMK1 was
upregulated in tumor tissue. The tumor abbreviation in green meant
the opposite. HPA, human protein atlas; LIMK1, LIM domain kinase 1;
ACC, adrenocortical carcinoma; BLCA, bladder urothelial carcinoma;
BRCA, breast invasive carcinoma; CESC, cervical squamous cell
carcinoma and endocervical adenocarcinoma; CHOL,
cholangiocarcinoma; COAD, colon adenocarcinoma; COADREAD, colon
adenocarcinoma/rectum adenocarcinoma esophageal carcinoma; DLBC,
lymphoid neoplasm diffuse large B-cell lymphoma; ESCA, esophageal
carcinoma; GBM, glioblastoma multiforme; HNSC, head and neck
squamous cell carcinoma; KICH, kidney chromophobe; KIPAN,
pan-kidney cohort (KICH + KIRC + KIRP); KIRC, kidney renal clear
cell carcinoma; KIRP, kidney renal papillary cell carcinoma; LAML,
acute myeloid leukemia; LGG, brain lower grade glioma; LIHC, liver
hepatocellular carcinoma; LUAD, lung adenocarcinoma; LUSC, lung
squamous cell carcinoma; MESO, mesothelioma; OV, ovarian serous
cystadenocarcinoma; PAAD, pancreatic adenocarcinoma; PCPG,
pheochromocytoma and paraganglioma; PRAD, prostate adenocarcinoma;
READ, rectum adenocarcinoma; SARC, sarcoma; SKCM, skin cutaneous
melanoma; STAD, stomach adenocarcinoma; STES, stomach and
esophageal carcinoma; TGCT, testicular germ cell tumors; THCA,
thyroid carcinoma; THYM, thymoma; UCEC, uterine corpus endometrial
carcinoma; UCS, uterine carcinosarcoma; UVM, uveal melanoma. |
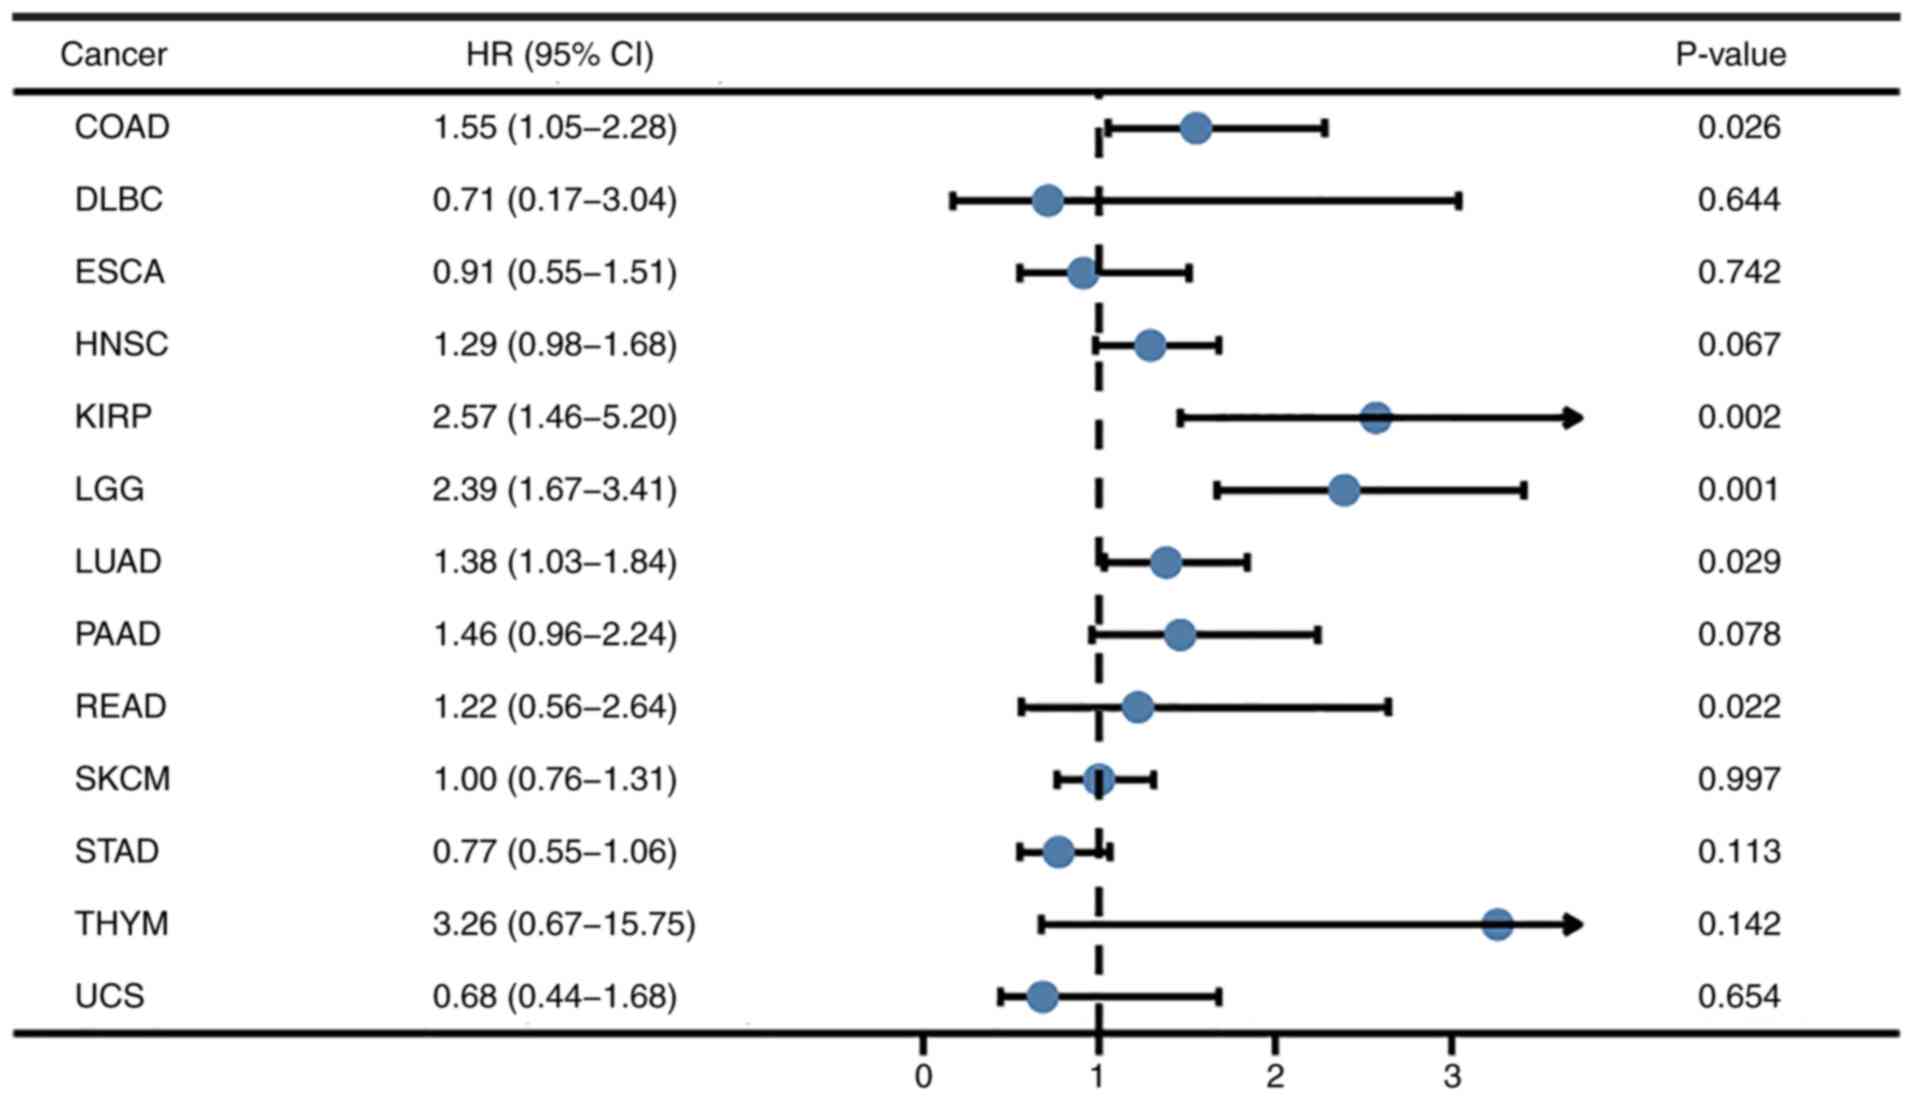 | Figure 2.Association between LIMK1 expression
level and overall survival across various tumor types. The OS of
COAD, KIRP, LGG, LUAD and READ were associated with LIMK1
expression. LIMK1, LIM domain kinase 1; OS, overall survival; COAD,
colon adenocarcinoma; KIRP, kidney renal papillary cell carcinoma;
LGG, brain lower grade glioma; LUAD, lung adenocarcinoma; READ,
rectum adenocarcinoma; DLBC, lymphoid neoplasm diffuse large B-cell
lymphoma; ESCA, esophageal carcinoma; HNSC, head and neck squamous
cell carcinoma; KIRP, kidney renal papillary cell carcinoma; PAAD,
pancreatic adenocarcinoma; SKCM, skin cutaneous melanoma; STAD,
stomach adenocarcinoma; THYM, thymoma; UCS, uterine
carcinosarcoma. |
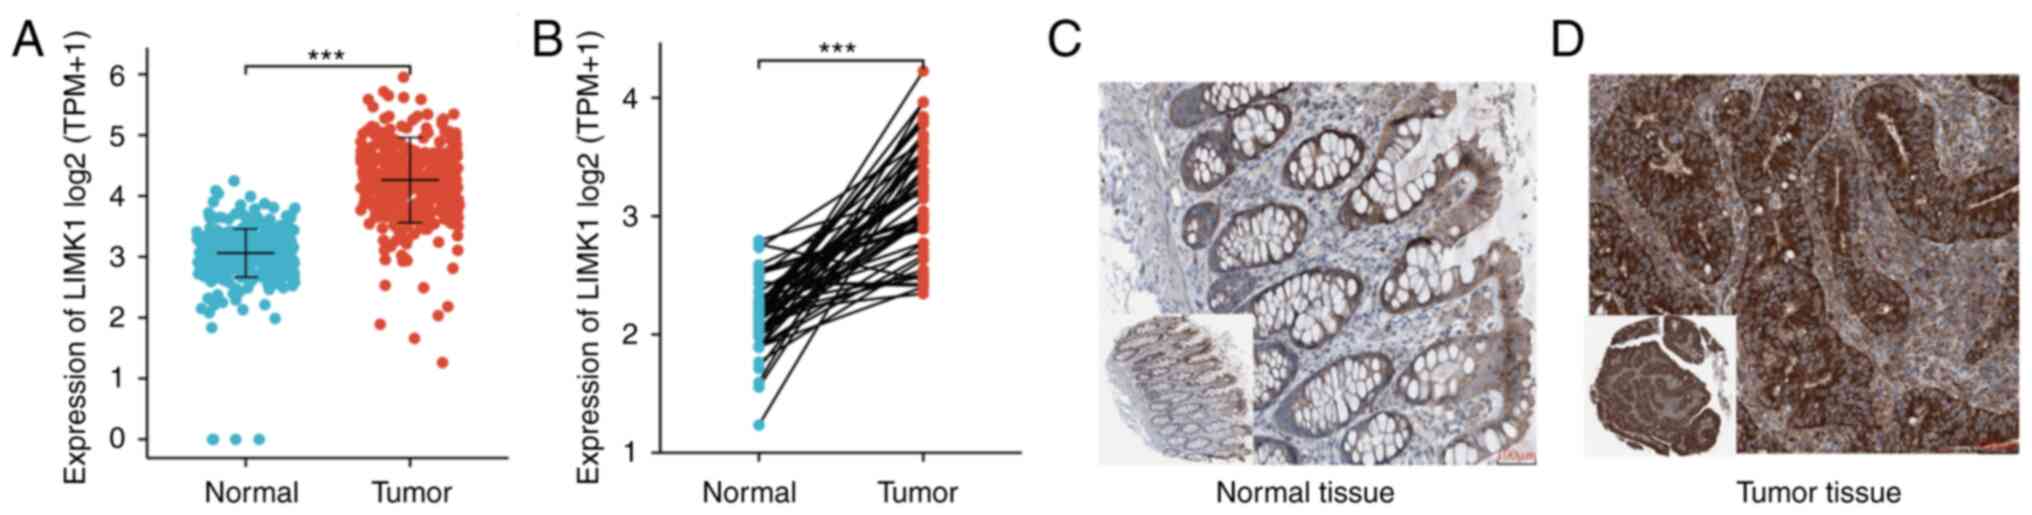
Expression of LIMK1 mRNA and protein
in CRC
To further examine the differential expression of
LIMK1, the expression of LIMK1 mRNA and protein in CRC tissues was
analyzed using data from the TCGA database and HPA. Paired and
unpaired samples from the TCGA database were analyzed. As shown in
Fig. 3A and B, analysis of paired
data showed that the expression level of LIMK1 mRNA in CRC tissues
(50) was significantly higher
compared with that in normal tissues (50). The mean level of the normal group
was 3.43±0.353 and that of the tumor group was 4.662±0.535 (paired
t-test, P=1.12×10⁻³). Analysis of unpaired data also
showed that the expression level of LIMK1 mRNA in CRC tissues (647)
was significantly higher compared with that in normal tissues
(51). The average level of the
normal group was 3.434±0.351 and that of the tumor group was
4.501±0.620 (Mann-Whitney U test, P=1.08×10⁻³). As shown
in Fig. 3C and D, LIMK1 protein
expression was also upregulated in CRC tissues based on the
immunohistochemical staining results from TPA.
Validation of LIMK1 mRNA
differentially expressed level in CRC
To further prove the difference in LIMK1 expression
in the TCGA database, the expression level of LIMK1 was analyzed in
four GEO datasets (GSE 10715, GSE 18105, GSE 22598 and GSE 32323)
and LIMK1 expression levels detected in CRC samples and peritumoral
non-cancerous tissues (a distance of 5 cm to the tumour tissue)
obtained from Tianjin Medical University General Hospital by
RT-qPCR. As shown in Fig. 4A-D,
LIMK1 was significantly upregulated in CRC tissues compared with
that in normal tissues. As shown in Fig. 4E and F, in cell-level verification,
the expression levels of LIMK1 were significantly increased in
several CRC cell lines compared with the normal colonic epithelium
cell line. The relative mRNA expression of LIMK1 was upregulated in
CRC tissues compared with that in normal tissues
(P=3.20×10⁻⁴). The above results confirmed that LIMK1
had obvious differences in expression in CRC.
Associations between the expression of
LIMK1 mRNA and clinicopathological features of CRC patients
To verify the associations between LIMK1 expression
and clinical indicators in patients, we explored the associations
between LIMK1 mRNA levels and the clinicopathological features of
CRC patients. Baseline characteristics were listed in Table I. As shown in Fig. 5, the expression levels of LIMK1
were positively associated with some clinical-pathological features
of CRC, including DSS events (P<1.00×10⁻³) and
lymphatic invasion (P=2.00×10⁻³). Although it did not
make sense to analyze pathologic stage I–IV alone, patients who
belonged to stage III–IV more highly expressed LIMK1 than those in
stage I–II (P=4.20×10⁻²). This may be due to the small
sample size in each subgroup. It was obvious that a higher tumor
stage was associated with a higher expression level of LIMK1. There
were no statistical differences in the rest of the
clinicopathological characteristics. Overall, the above results
suggested that LIMK1 could indicate the prognosis of CRC patients
in some respects.
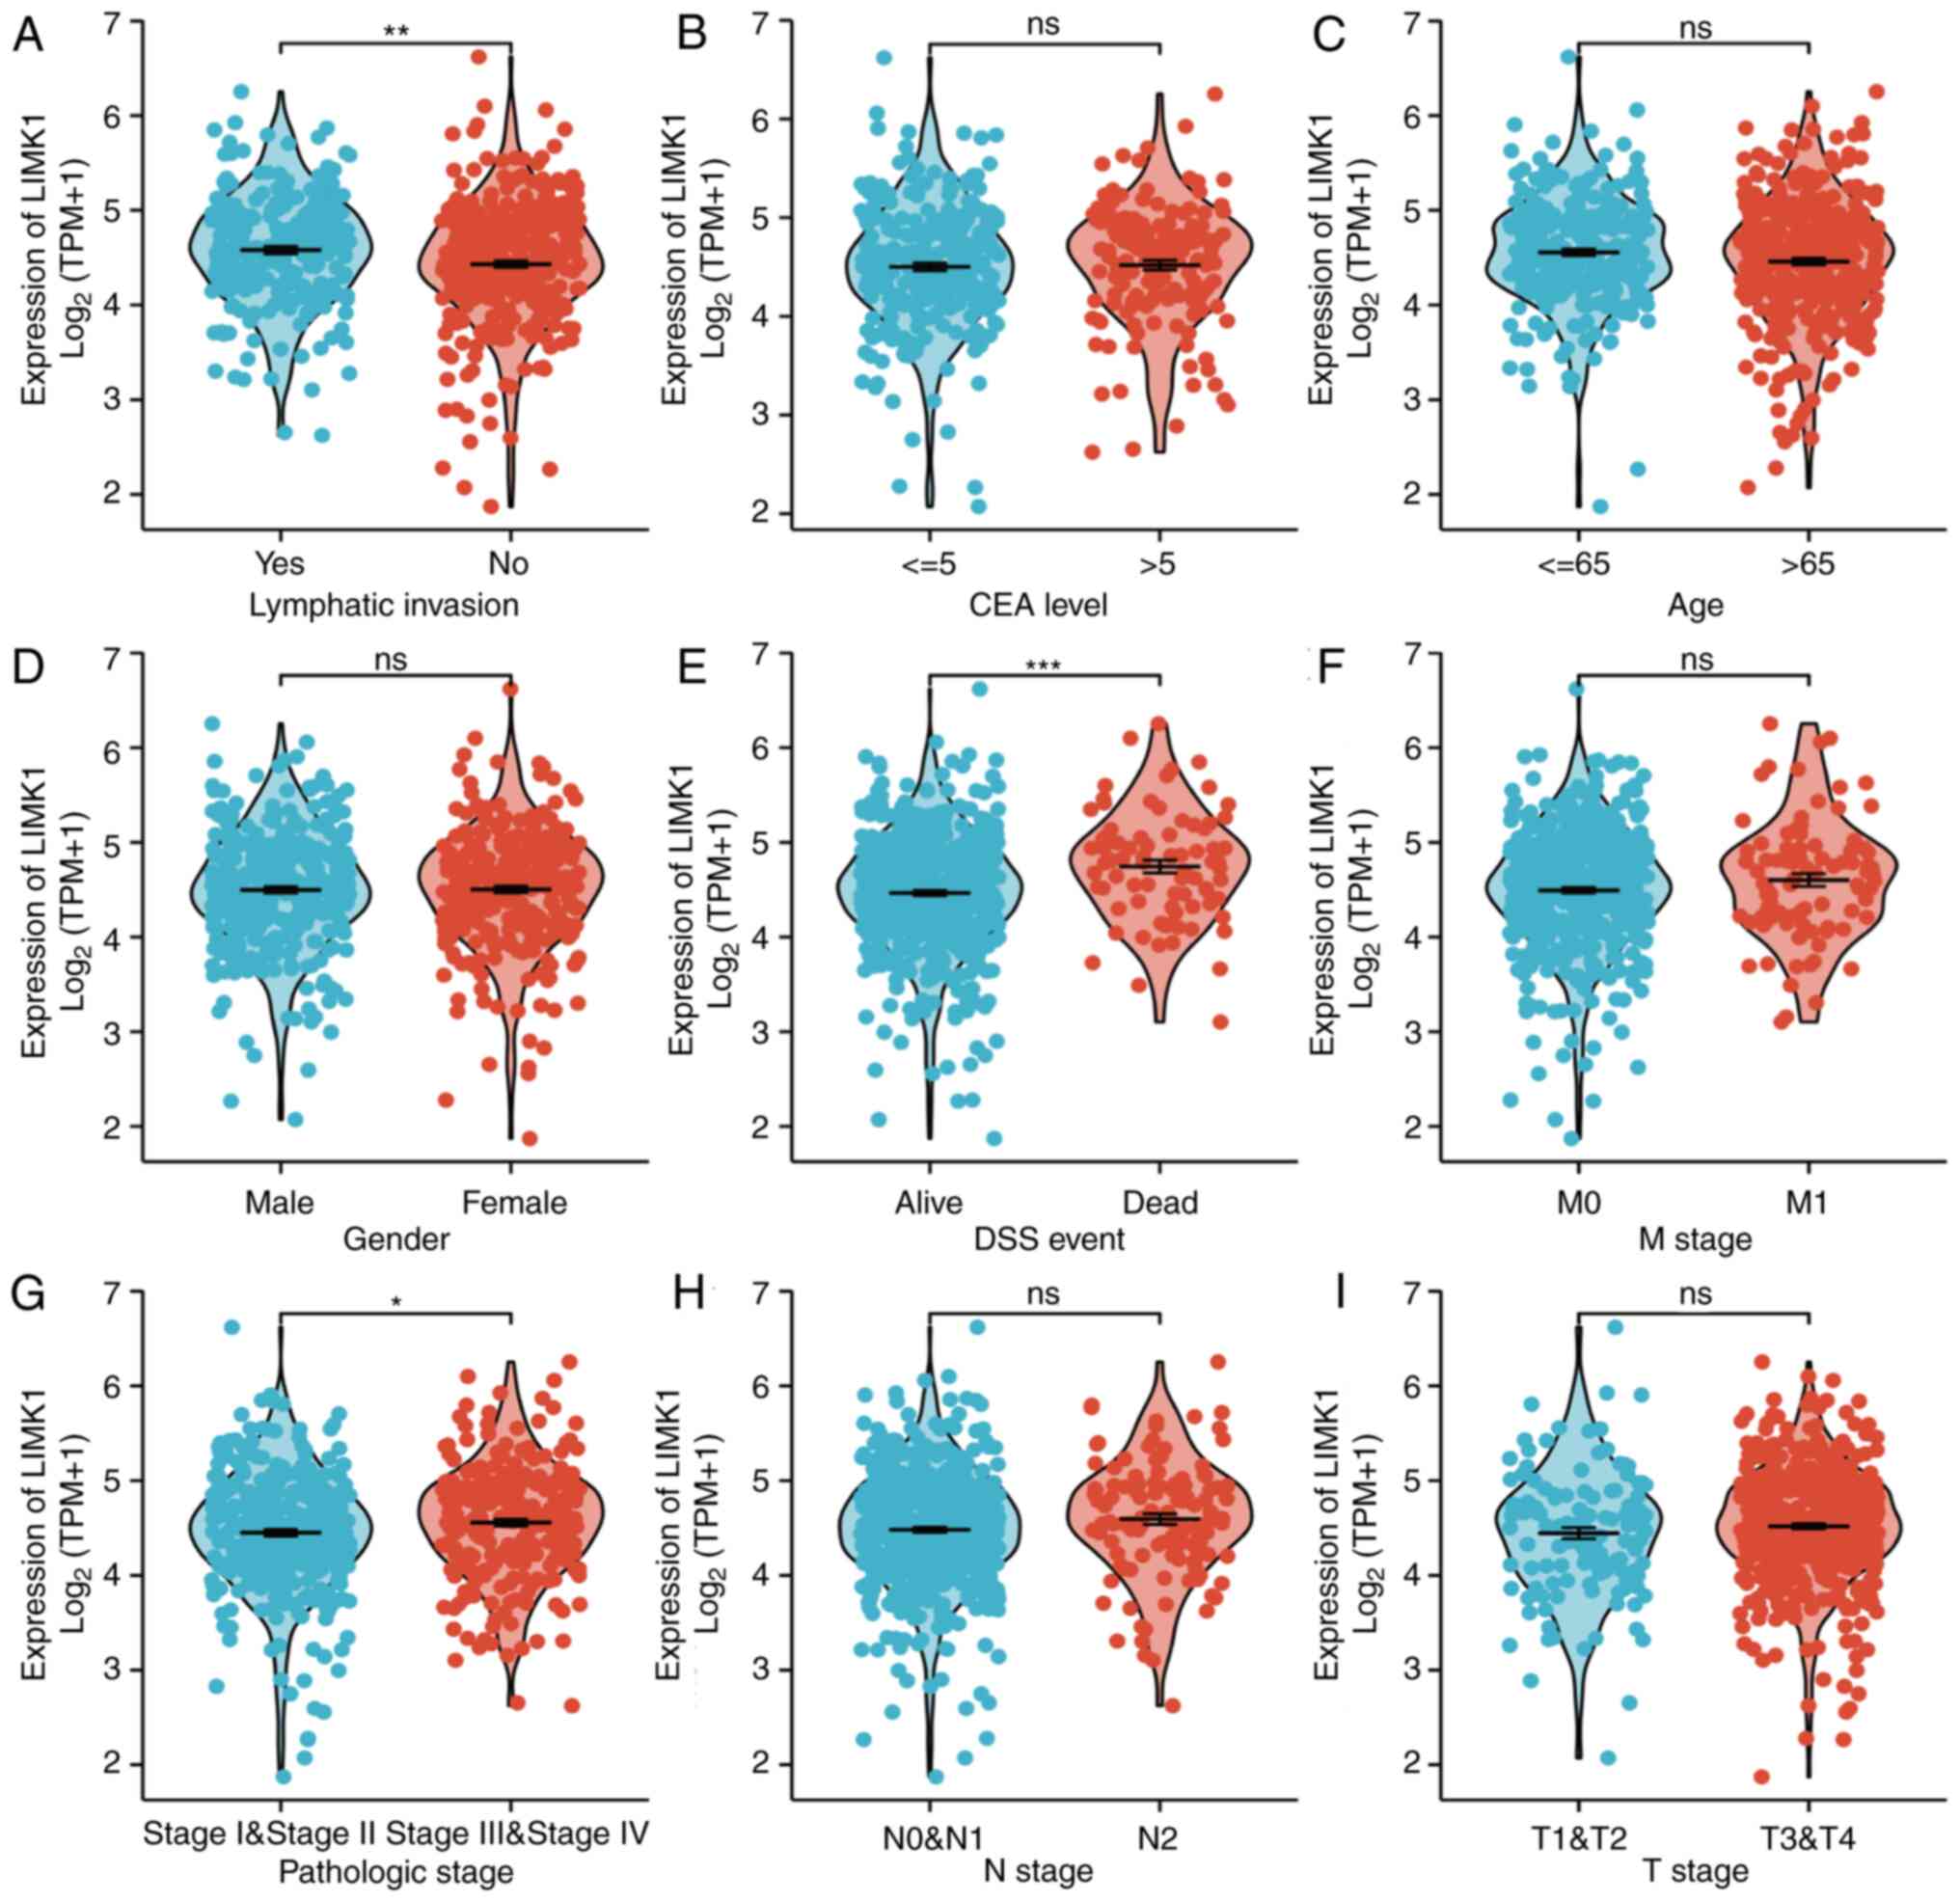 | Figure 5.Relationship between LIMK1 mRNA and
clinicopathological features of CRC including (A) lymphatic
invasion, (B) CEA level, (C) age, (D) gender, (E) DSS event, (F) M
stage, (G) pathologic stage, (H) N stage, and (I) T stage.
Increased LIMK1 expression was highly associated with lymphatic
invasion (A), DSS (E), and pathologic stage (G). No statistical
differences were found in other features. ns, no significance;
*P<0.05, **P<0.01, ***P<0.001. LIMK1, LIM domain kinase 1;
CRC, colorectal cancer; DSS, disease-specific survival rate; CEA,
carcinoembryonic antigen. |
 | Table I.Correlation between LIMK1 expression
and pathological parameters of patients with colorectal cancer. |
Table I.
Correlation between LIMK1 expression
and pathological parameters of patients with colorectal cancer.
| Characteristic | Low expression of
LIMK1 (n=322) | High expression of
LIMK1 (n=322) | P-value |
|---|
| Sex |
|
| 1.000 |
|
Female | 148 (23.0) | 153 (23.8) |
|
|
Male | 174 (27.0) | 169 (26.2) |
|
| Age, years |
|
| 1.000 |
|
≤65 | 138 (21.4) | 138 (21.4) |
|
|
>65 | 184 (28.6) | 184 (28.6) |
|
| T stage |
|
| 0.341 |
| T1 | 9 (1.4) | 11 (1.7) |
|
| T2 | 63 (9.8) | 48 (7.5) |
|
| T3 | 208 (32.4) | 228 (35.6) |
|
| T4 | 39 (6.1) | 35 (5.5) |
|
| N stage |
|
| 0.076 |
| N0 | 195 (30.5) | 173 (27.0) |
|
| N1 | 74 (11.6) | 79 (12.3) |
|
| N2 | 49 (7.7) | 70 (10.9) |
|
| M stage |
|
| 0.408 |
| M0 | 234 (41.5) | 241 (42.7) |
|
| M1 | 39 (6.9) | 50 (8.9) |
|
| Lymphatic
invasion |
|
| 0.004 |
| No | 196 (33.7) | 154 (26.5) |
|
|
Yes | 101 (17.4) | 131 (22.5) |
|
| Pathologic
stage |
|
| 0.306 |
| I | 59 (9.5) | 52 (8.3) |
|
| II | 127 (20.4) | 111 (17.8) |
|
|
III | 84 (13.5) | 100 (16.1) |
|
| IV | 41 (6.6) | 49 (7.9) |
|
| CEA, ng/ml |
|
| 0.069 |
| ≤5 | 139 (33.5) | 122 (29.4) |
|
|
>5 | 67 (16.1) | 87 (21.0) |
|
| DSS status |
|
| 0.002 |
|
Alive | 289 (46.5) | 255 (41.0) |
|
|
Succumbed | 26 (4.2) | 52 (8.4) |
|
The association between LIMK1 and
prognosis in patients with CRC
To investigate the association between LIMK1
expression and survival in patients with CRC, Kaplan-Meier curves
were performed. As shown in Fig.
6A-C, the OS rates were significantly higher among CRC patients
with low LIMK1 expression compared with those with high expression
(HR=2.01; 95% CI: 1.24-3.23; P=5.00×10⁻³). Similarly,
patients with high expression levels of LIMK1 had lower DSS rate
(HR=2.48; 95% CI: 1.37-4.49; P=4.00×10⁻³). The same was
true for PFI (HR=1.65; 95% CI: 1.08-2.54; P=2.10×10⁻²).
Subsequently, a ROC curve analysis was performed to determine
whether LIMK could distinguish between CRC samples and normal
samples. As shown in Fig. 6D, the
AUC of LIMK1 was 0.937 (95% CI: 0.918-0.957), according to the ROC
curve. When each predictive variable was at its optimum cut-off
value (cut-off=4.009), the sensitivity and specificity were 98 and
81.9%, respectively. These results suggested that LIMK1 might be a
promising biomarker for CRC diagnosis.
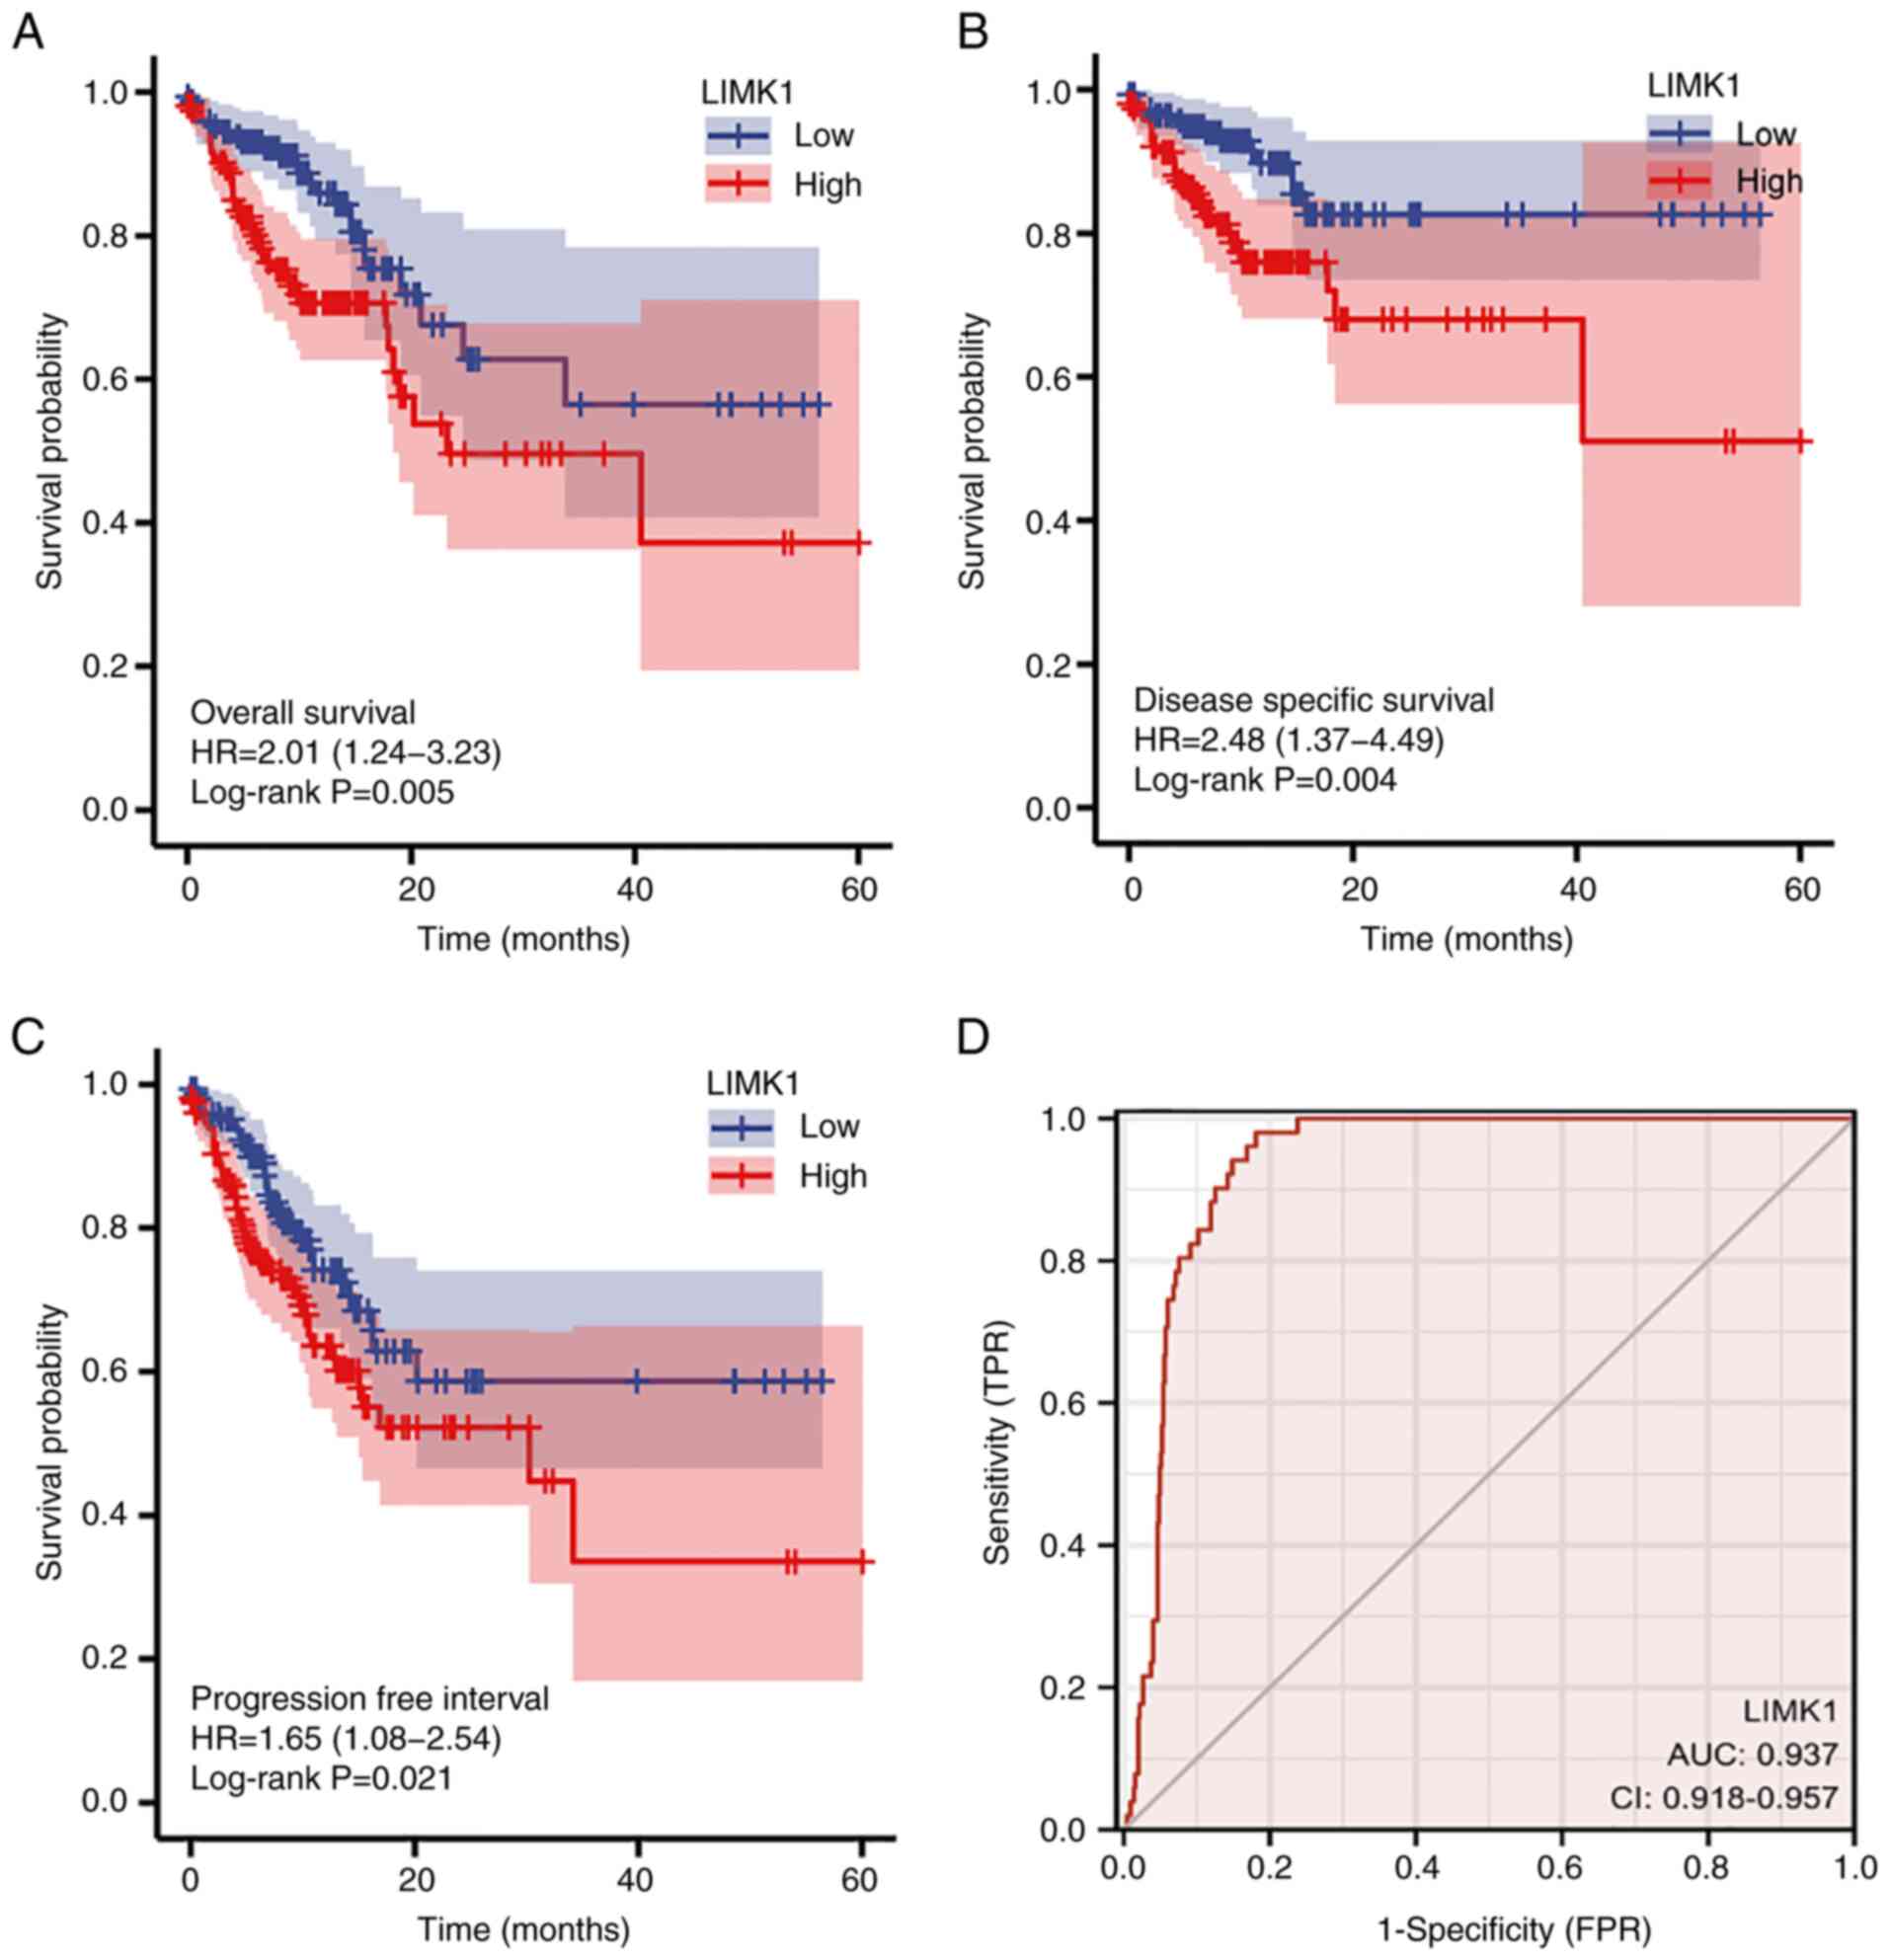 | Figure 6.Kaplan-Meier curves and ROC curves of
LIMK1 in CRC. (A-C) Kaplan-Meier curves indicated that patients
with CRC with lower LIMK1 expression levels had longer (A) overall
survival (P=5.00×10⁻³), (B) disease-specific survival
(P=4.00×10⁻³) and (C) progression-free interval
(P=2.10×10⁻²) than patients with higher expression. (D)
The AUC value of LIMK1 in CRC was 0.937 (95% CI: 0.918-0.957).
Under the best cut-off value (4.009), the sensitivity and
specificity were 98 and 81.9%, respectively. ROC, receiver
operating characteristic; AUC, area under the ROC curve; LIMK1, LIM
domain kinase 1; CRC, colorectal cancer; OS, rate; TPR, true
positive rate; FPR, false positive rate; HR, hazard ratio. |
The PPI networks and functional
annotations of LIMK1
The present study then attempted to determine the
PPI networks and functional annotations of LIMK1 using GO, KEGG and
STRING databases. The top 10 co-expressed genes of LIMK1 were
analyzed and a network constructed according to the distance of the
relationship (Fig. 7A).
Subsequently, correlation analysis was performed to explore the
correlations between LIMK1 expression and 10 co-expressed genes in
CRC (Fig. 7B-K). Among them. CFL1,
RHOB and RHOC had the most significant correlations with LIMK1. The
correlations between LIMK1 and remaining genes had non-significant
P-values or small r values in CRC. As shown in Fig. 7L, the cellular component (CC) of
LIMK1 and its co-expressed genes in CRC mainly focused on
lamellipodium, ruffle and cell leading edge. Molecular function
(MF) was correlated with rho GTPase binding, ras GTPase binding and
protein serine/threonine kinase activity. The biological process
(BP) was correlated with the regulation of the actin filament-based
process, regulation of actin cytoskeleton organization and actin
filament organization. KEGG analyses indicated that these
interrelated genes mainly concentrated on axon guidance, regulation
of actin cytoskeleton and pathogenic E. coli infection
pathways.
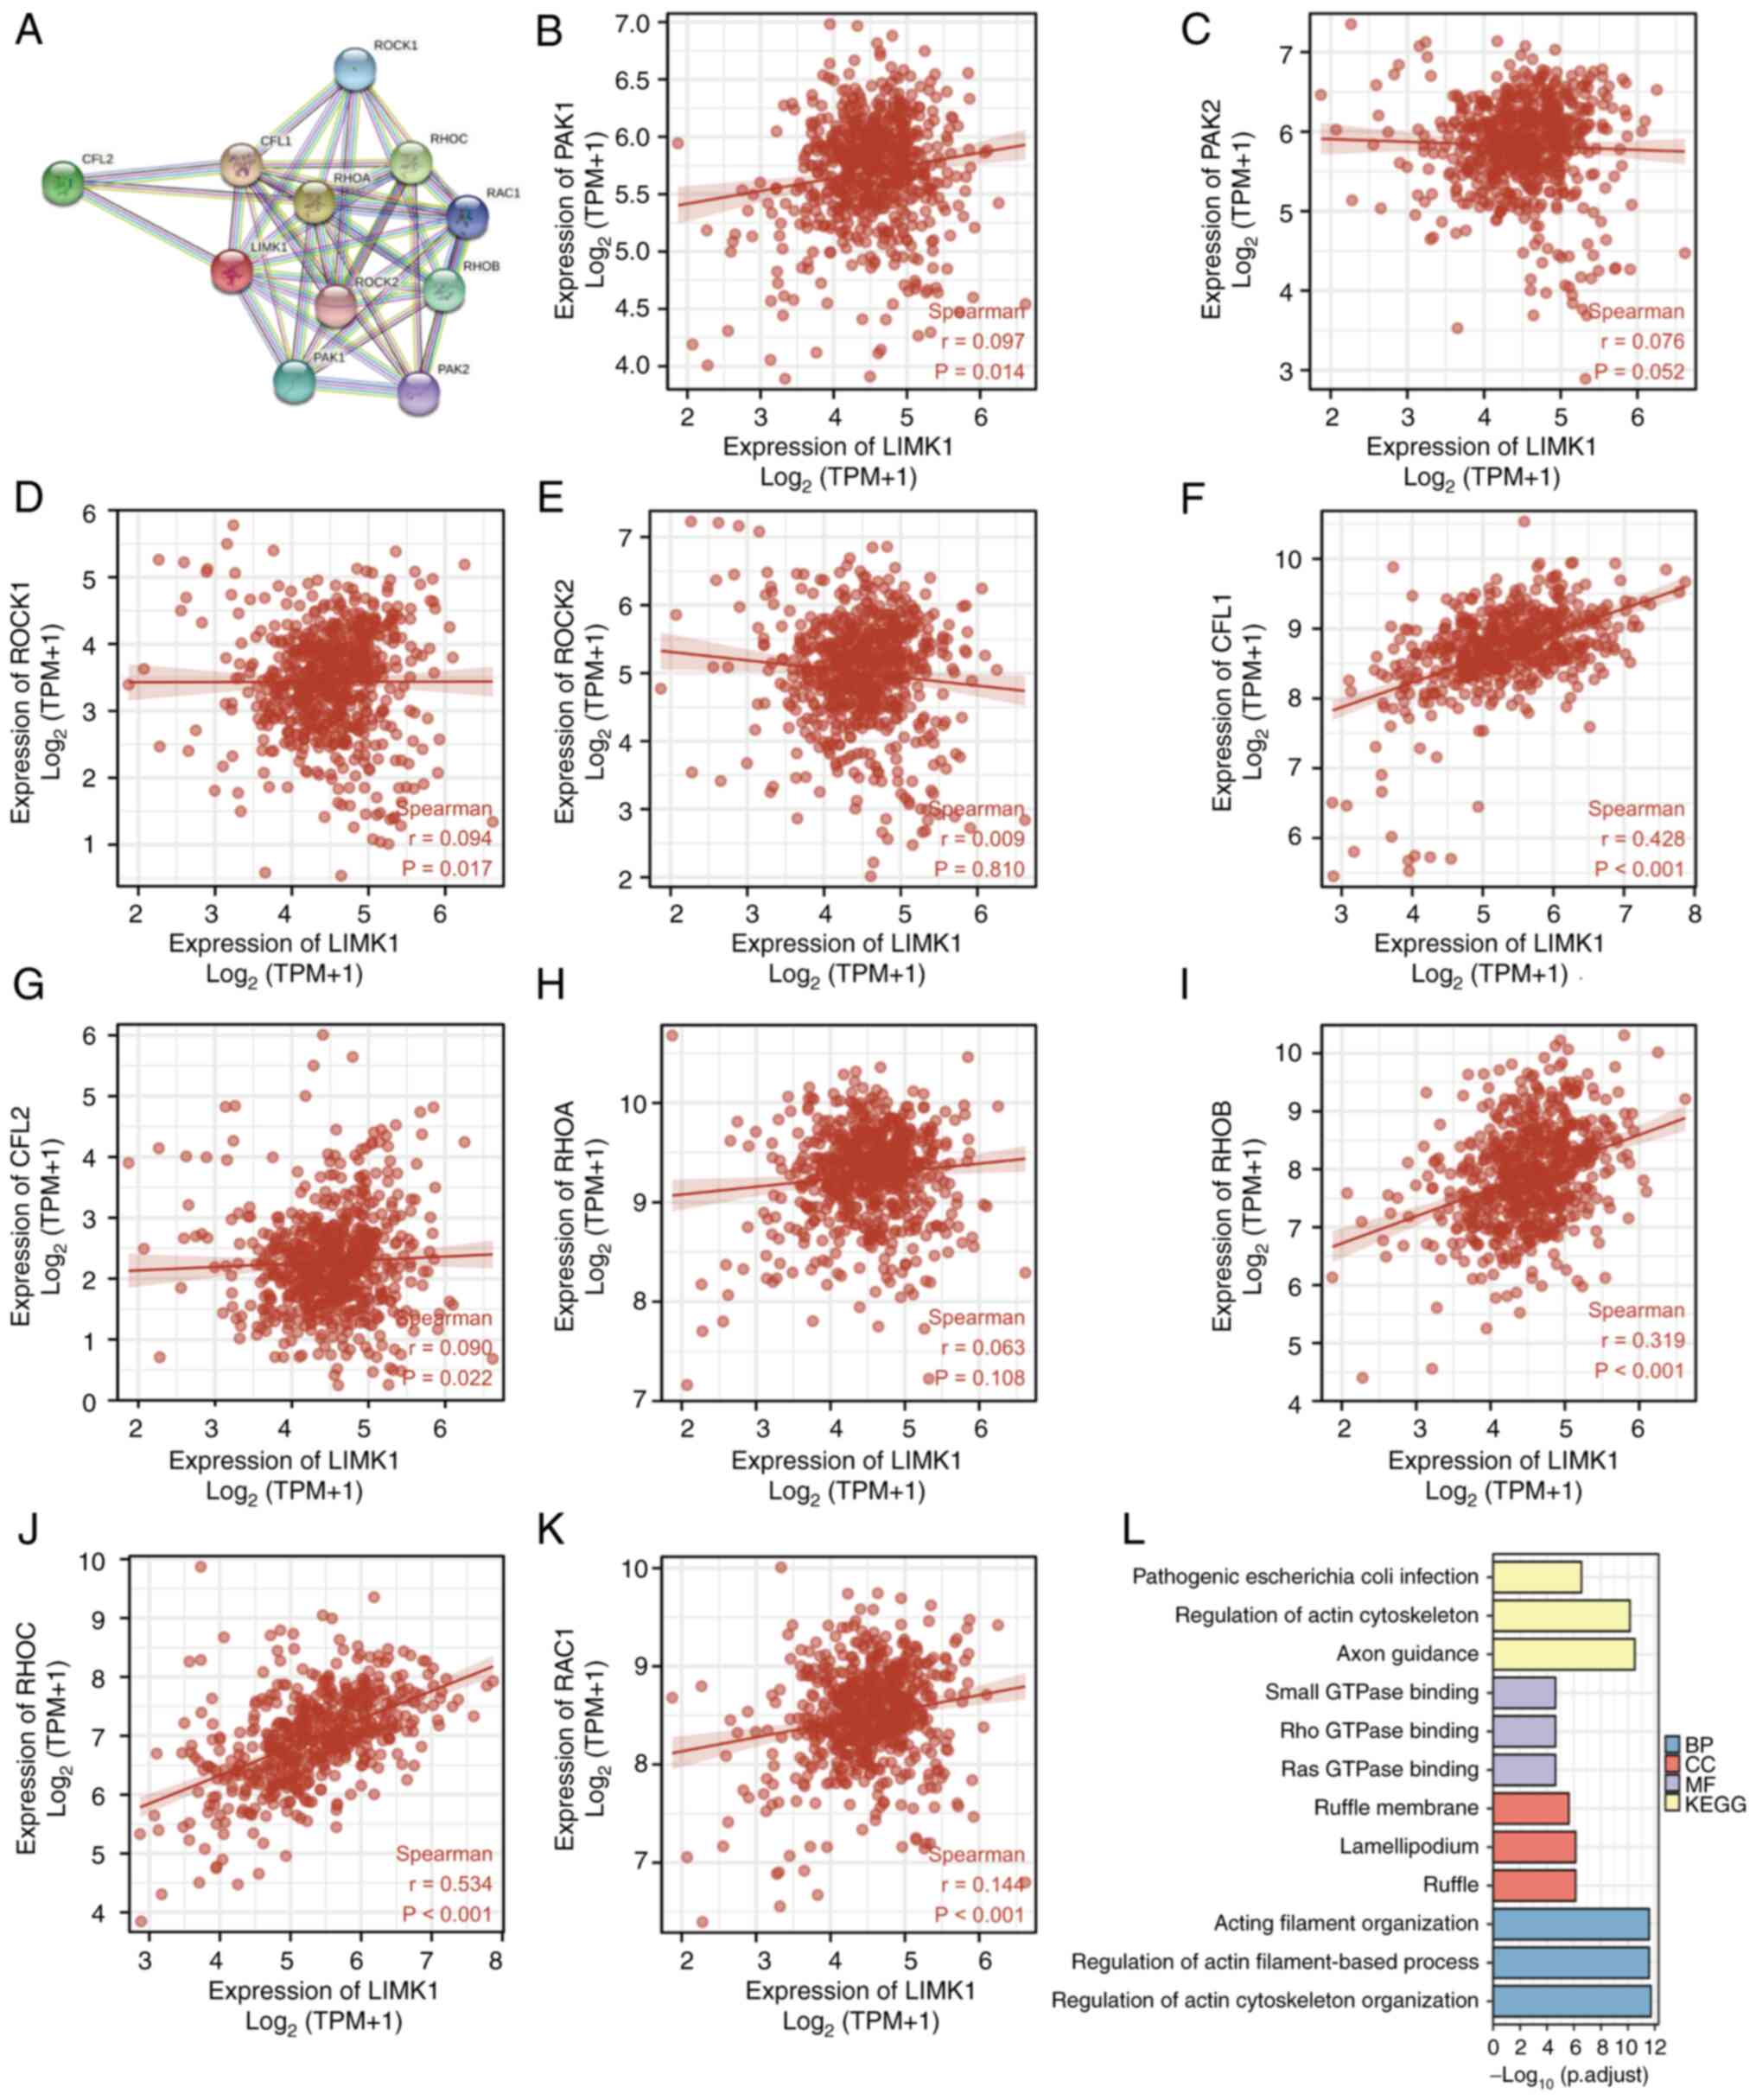 | Figure 7.PPI networks and functional
annotations of LIMK1. (A) Network of LIMK1 and its co-expressed
genes. (B-K) Correlations between LIMK1 and (B) PAK1, (C) PAK2, (D)
ROCK1, (E) ROCK2, (F) CFL1, (G) CFL2, (H) RHOA, (I) RHOB, (J) RHOC
and (K) RAC1 in CRC. Among them, CFL1 (r=0.428), RHOB (r=0.319),
RHOC (r=0.534) had the most significant correlation with LIMK1.
Other genes had non-significant P-values or small r values. (L)
Functional enrichment analyses of LIMK1 and its co-expressed genes.
The first three indicators, including pathogenic escherichia coli
infection, regulation of actin cytoskeleton, and axon guidance,
were obtained through KEGG analyses. Rho GTPase binding, ras GTPase
binding and protein serine/threonine kinase were enriched terms in
the GO category molecular function. Lamellipodium, ruffle and cell
leading edge represented were significant terms in the GO category
cellular component. Actin filament-based process, regulation of
actin cytoskeleton organization and actin filament organization
were terms accumulated in the GO category biological process. PPI,
protein-protein interaction; LIMK1, LIM domain kinase 1; GO, Gene
Ontology; KEGG, Kyoto Encyclopedia of Genes and Genomes; CRC,
colorectal cancer; BP, biological process; CC, cellular component;
MF, molecular function. |
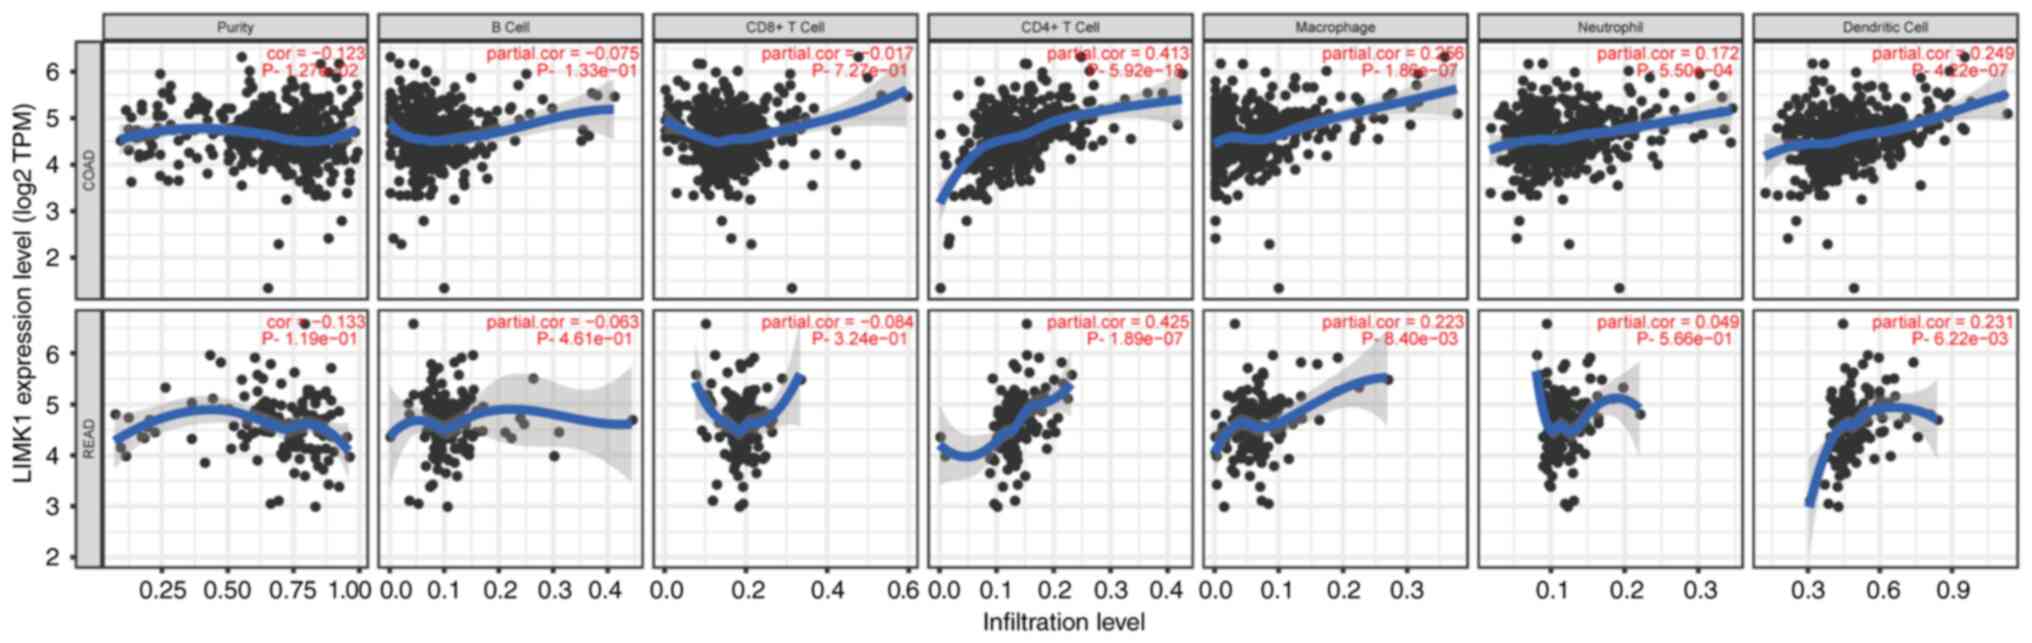
The correlations between LIMK1
expression and immune cell infiltration in CRC
To analyze the correlations between LIMK1 expression
and immune cell infiltration in CRC, the correlations between LIMK1
and six immune cells was calculated using the TIMER database. As
the TIMER database did not have CRC data, the correlation between
LIMK1 and the six immune cells in COAD and READ, respectively, were
calculated. The results revealed that the correlations between
LIMK1 expression and immune cell infiltration in COAD were almost
equivalent to READ. LIMK1 expression was mainly related to
CD4+ T cells, macrophages and dendritic cells (Fig. 8). Furthermore, the correlations
between LIMK1 expression and myeloid-derived suppressor cells
(MDSCs) were also explored. The correlations between MDSCs and
LIMK1 expression were relatively low in CRC (Fig. S1). The correlation coefficient was
0.104 (P=2.58×10⁻²) in COAD and 0.167
(P=3.1×10⁻²) in READ.
Correlation analysis between LIMK1
expression and immune cell markers
To explore the correlations between LIMK1 and
multiple immune infiltrating cells, the changes in different immune
cell subgroups were further analyzed. The correlations between
LIMK1 and the immune markers of diverse cells were analyzed in the
GEPIA database. It was observed that LIMK1 was indeed related to
these immune cells (Table II). In
addition, LIMK1 seemed to be more related to M2 macrophages
according to the correlation results. Diverse T cell subsets in
COAD and READ, such as Th1, Th2, Tfh, Th17, Tregs and T cell
exhaustion were also analyzed. In the analysis of T cell
subpopulations, the correlation of Tregs and T cell exhaustion
marker genes appeared to be higher than others.
| Table II.Correlation analysis of LIMK1 and
immune cell gene markers in GEPIA. |
Table II.
Correlation analysis of LIMK1 and
immune cell gene markers in GEPIA.
|
| COAD | READ |
|---|
|
|
|
|
|---|
| Cell type or
feature/gene markers | r | P-value | r | P-value |
|---|
| Th1 |
|
|
|
|
| T-bet
(TBX21) | 0.31 |
1.90×10⁻⁷ | 0.45 |
5.70×10⁻⁶ |
|
STAT4 | 0.3 |
2.70×10⁻⁷ | 0.37 |
3.20×10⁻⁴ |
|
STAT1 | 0.35 |
2.10×10⁻⁹ | 0.6 |
2.50×10⁻¹⁰ |
| IFN-γ
(IFNG) | 0.21 |
4.40×10⁻⁴ | 0.45 |
5.50×10⁻⁶ |
| TNF-α
(TNF) | 0.25 |
2.50×10⁻⁵ | 0.44 |
9.00×10⁻⁶ |
| Th2 |
|
|
|
|
|
STAT6 | 0.2 |
7.00×10⁻⁴ | 0.26 |
1.20×10⁻² |
|
STAT5A | 0.4 |
9.50×10⁻¹² | 0.28 |
6.50×10⁻³ |
|
IL13 | 0.22 |
3.10×10⁻⁴ | 0.093 |
3.80×10⁻¹ |
| Tfh |
|
|
|
|
|
BCL6 | 0.42 |
6.60×10⁻¹³ | 0.44 |
1.00×10⁻⁵ |
|
IL21 | 0.18 |
3.00×10⁻³ | 0.15 |
1.60×10⁻¹ |
| Th17 |
|
|
|
|
|
STAT3 | 0.32 |
4.70×10⁻⁸ | 0.3 |
3.30×10⁻³ |
|
IL17A | −0.09 |
1.30×10⁻¹ | 0.004 |
9.70×10⁻¹ |
| Treg |
|
|
|
|
|
FOXP3 | 0.44 |
1.50×10⁻¹⁴ | 0.46 |
4.10×10⁻⁶ |
|
CCR8 | 0.43 |
7.20×10⁻¹⁴ | 0.41 |
5.80×10⁻⁵ |
|
STAT5B | 0.36 |
4.60×10⁻¹⁰ | 0.36 |
9.30×10⁻⁴ |
|
TGFβ | 0.42 |
3.80×10⁻¹³ | 0.52 |
1.40×10⁻⁷ |
| T-cell
exhaustion |
|
|
|
|
| PD-1
(PDCD1) | 0.28 |
3.10×10⁻⁶ | 0.41 |
5.90×10⁻⁵ |
|
CTLA4 | 0.34 |
8.30×10⁻⁹ | 0.18 |
9.00×10⁻² |
|
LAG3 | 0.13 |
3.50×10⁻² | 0.35 |
5.50×10⁻⁴ |
|
TIM-3 | 0.44 |
1.90×10⁻¹⁴ | 0.55 |
1.90×10⁻⁸ |
|
GZMB | 0.02 |
6.90×10⁻¹ | 0.14 |
1.70×10⁻¹ |
| M1 |
|
|
|
|
| INOS
(NOS2) | 0.13 |
3.50×10⁻² | 0.35 |
5.50×10⁻³ |
|
IRF5 | 0.35 |
2.10×10⁻⁹ | 0.42 |
2.90×10⁻⁵ |
|
COX2 | 0.23 |
1.30×10⁻⁴ | 0.27 |
9.10×10⁻³ |
| M2 |
|
|
|
|
|
CD163 | 0.34 |
5.80×10⁻⁹ | 0.48 |
1.10×10⁻⁶ |
|
VSIG4 | 0.41 |
1.20×10⁻¹² | 0.37 |
2.70×10⁻⁴ |
|
MS4A4A | 0.4 |
5.00×10⁻¹² | 0.46 |
4.10×10⁻⁶ |
| Dendritic
cells |
|
|
|
|
|
HLA-DPB1 | 0.36 |
4.50×10⁻¹⁰ | 0.35 |
6.10×10⁻⁴ |
|
HLA-DQB1 | 0.2 |
7.60×10⁻⁴ | 0.067 |
5.30×10⁻¹ |
|
HLA-DRA | 0.31 |
1.80×10⁻⁷ | 0.38 |
2.20×10⁻⁴ |
|
HLA-DPA1 | 0.33 |
2.90×10⁻⁸ | 0.31 |
2.30×10⁻³ |
|
BDCA-1 | 0.33 |
1.30×10⁻⁸ | 0.058 |
5.80×10⁻¹ |
|
BDCA-4 | 0.46 |
8.90×10⁻¹⁶ | 0.48 |
1.10×10⁻⁶ |
|
CD11c | 0.42 |
3.60×10⁻¹³ | 0.38 |
1.90×10⁻⁴ |
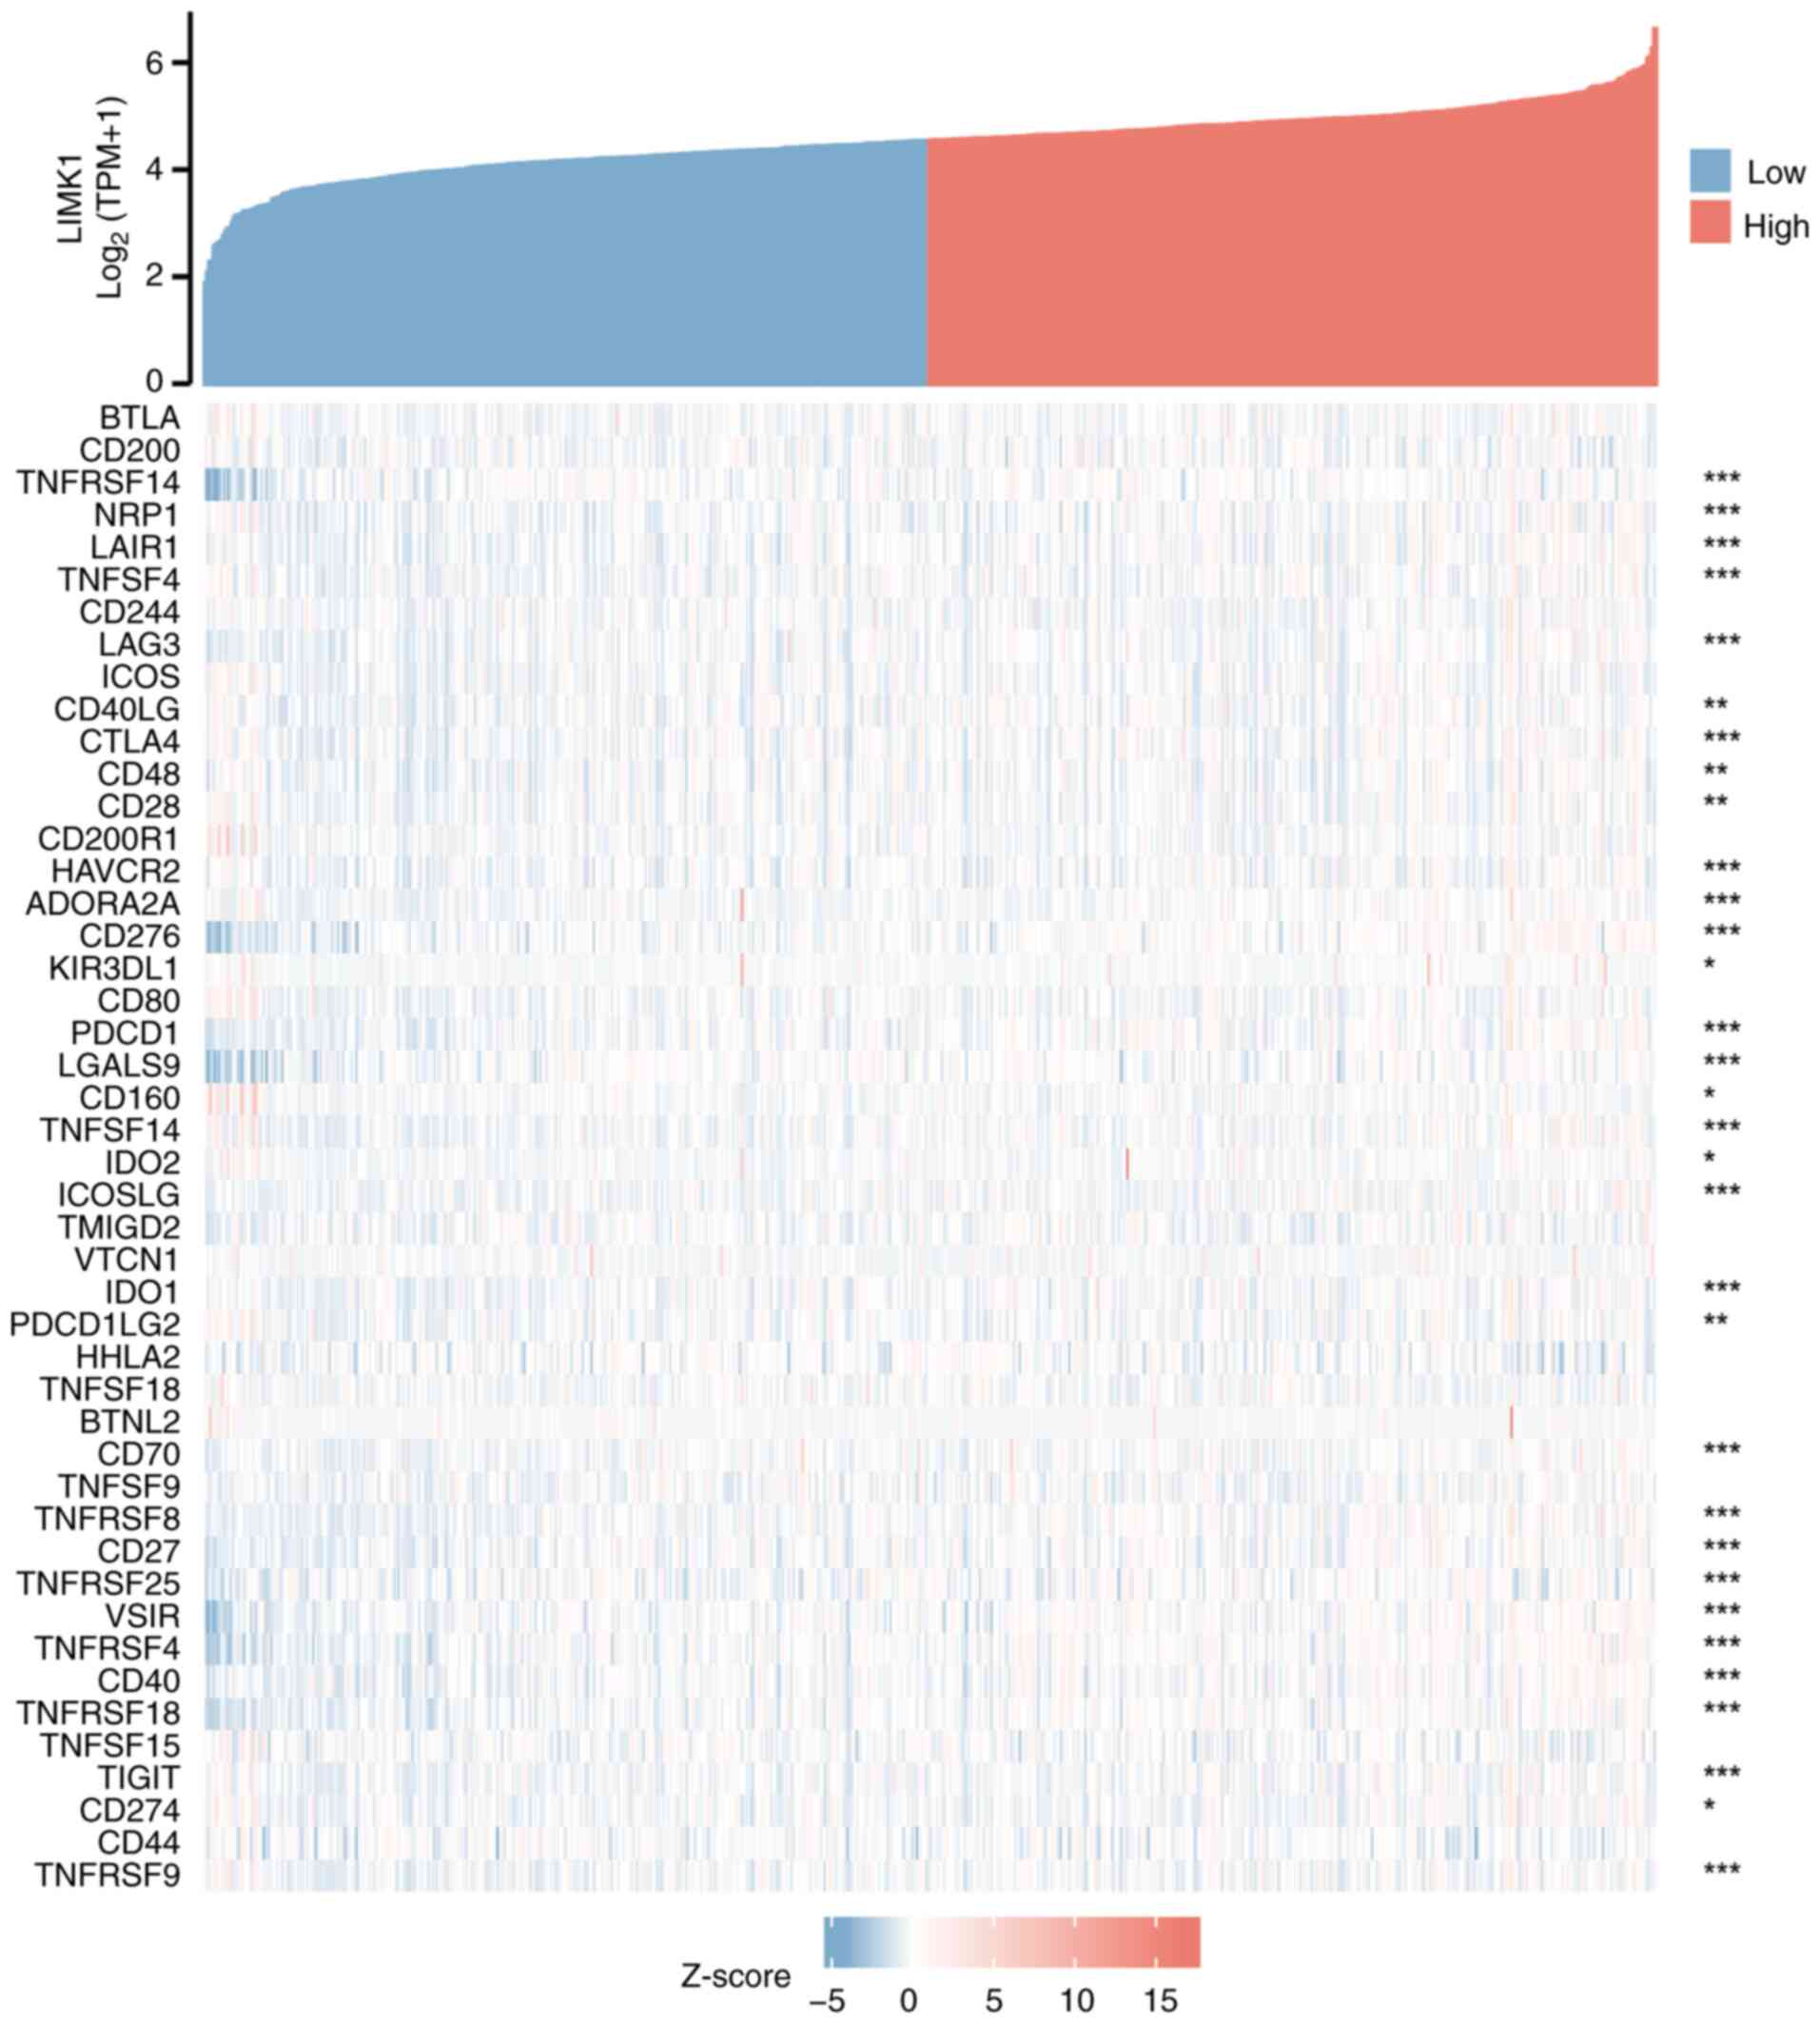
LIMK1 expression was correlated with
immune checkpoint genes in CRC
As shown in Fig. 9,
the correlations between LIMK1 expression and ~50 immune checkpoint
genes in CRC were explored. The results showed that LIMK1
expression was positively correlated with the expression levels of
various immune checkpoint genes in CRC. Among them, the most
relevant genes were CD276 (r=0.558), TNFRSF4 (r=0.440) and VSIR
(r=0.436), suggesting that LIMK1 might serve a significant role in
modulating tumor immunity by regulating these immune checkpoint
genes.
Discussion
CRC has a high morbidity and mortality rate, which
urgently requires a robust molecular marker to achieve early
diagnosis and treatment. The LIMK protein family includes LIMK1 and
LIMK2. It was reported that LIMK1 was highly expressed in a variety
of tumors and is related to patient prognosis. Studies have
indicated that LIMK1 was upregulated in CRC and causes a poor
prognosis (29–31). The related mechanism of LIMK1
regulating CRC progression has been studied (30). However, the association between
LIMK1 and tumor immune microenvironment in CRC has not been
explored. The present study discussed the association between LIMK1
and CRC from several aspects such as expression levels in tumor
samples, clinicopathological features, the correlations with immune
cell infiltration and the expression of immune checkpoint genes.
First, it confirmed that the expression levels of LIMK1 mRNA and
protein were higher in CRC tissues than in normal tissues. Higher
LIMK1 expression was correlated with a poor prognosis of CRC
including OS, DSS and PFI. In addition, LIMK1 could influence
immune cell infiltration and immune checkpoint expression in CRC.
In summary, LIMK1 may be a valuable and promising biomarker for the
diagnosis of CRC. The findings of the present study laid the
foundation that LIMK1 promotes CRC progression from the mechanism
of regulating tumor immune microenvironment.
LIMK1, a serine protein kinase, serves a crucial
role in the reorganization of actin and microtubule
depolymerization (7). Research on
LIMK1 has also focused on oncology because of its vital role in
promoting tumor cell proliferation, invasion and metastasis
(32). It has been reported that
LIMK1 expression is upregulated in several types of human cancers,
especially in highly malignant neoplasm, such as lung
adenocarcinoma, breast cancer and prostate cancer (12,32,33).
Furthermore, upregulated LIMK1 is associated with poor patient
prognosis. A number of studies have shown that LIMK1 is a
significant biomarker that portended a poor prognosis in numerous
types of cancer. A study by Huang et al (12) indicates that upregulation of LIMK1
is highly associated with lymph node metastasis and shortened
biochemical-free survival in prostate cancer. In ovarian carcinoma,
it is reported that high levels of LIMK1 indicate poor tumor
differentiation and disease severity (34). In gastric cancer, You et al
(35) confirm that with the
upregulation of LIMK1, the size of the primary tumor is larger and
the number of lymph node metastases greater. It has been confirmed
that reducing the expression of LIMK1 can delay tumor growth and
peritoneal metastasis in vivo. In CRC research, upregulation
of LIMK1 enhances the invasiveness of CRC cells in vitro and
in vivo (30). The present
study demonstrated that LIMK1 mRNA was highly expressed in a
variety of tumor tissues, including CRC. Notably, LIMK1 was
downregulated in tumor tissues of LGG by pan-cancer analysis.
However, LIMK1 was significantly associated with poor survival in
LGG. Few existing studies report the association between LIMK1 and
LGG. The expression levels and functions of LIMK1 in LGG needs to
be confirmed by further study. LIMK1 was highly expressed in tumor
tissues with CRC, whether in paired or unpaired samples.
Subsequently, the present study indicated that the protein
expression of LIMK1 was upregulated in CRC tumor tissues compared
with that in adjacent tissues. It also confirmed that the
upregulation of LIMK1 was associated with poor survival. Regarding
clinicopathological characteristics, significant positive
associations were found between LIMK1 and lymphatic invasion and
high TNM stage. Thus, LIMK1 might be more advantageous in the
detection of metastatic CRC and prognostic assessment compared with
previous screening methods such as CEA, FOBT and CA199, which are
more suitable for the diagnosis of early-stage CRC. To prove the
accuracy and sensitivity of LIMK1 in the diagnosis of CRC, a ROC
curve analysis was performed. The results indicated that the AUC
value of LIMK1 was obviously high in the detection of CRC, with 98%
sensitivity and 81.9% specificity. Although further studies are
needed, LIMK1 may serve as a promising marker for identifying CRC
with a poor prognosis.
LIMK1 serves an important role in several signaling
pathways, especially those related to tumors (36,37).
The present study analyzed the top 10 co-expressed genes that were
most related to the expression of LIMK1, of which CFL1, RHOB and
RHOC had the highest correlations. In addition, it was found that
LIMK1 was involved in a variety of biological processes in the
following functional annotations. Zeng et al (38) found that knockdown of Rho GDP
dissociation inhibitor 2 could downregulate the malignant
biological behavior of gastric cancer cells via the Rac1/Pak1/LIMK1
pathway. In pancreatic cancer, other researchers have indicated
that DEP domain-containing protein 1 B could also stimulate cell
migration and invasion through this pathway (39). In functional annotations of LIMK1,
the present study found that LIMK1 was mainly focused on
lamellipodium, ruffle and cell leading edge in CC. The accumulation
of LIMK1 in these cellular components probably indicated that it
was related to the migration and metastasis of tumor cells. Vainer
et al (40) found that
VICKZ accumulated at the leading edge of SW480 CRC cells which
facilitated the formation of surface morphologies required for cell
migration. Rho GTPase-activating protein 5 promotes EMT to
accelerate tumor metastasis by regulating RhoA activity in CRC
cells (41), which corroborated
the results of the present study of LIMK1 enrichment in MF. Axon
guidance (42), regulation of
actin cytoskeleton (43) and
pathogenic E. coli infection (44) pathways are involved in the process
of the occurrence of metastasis in CRC. Therefore, combined with
the results of the present study, it was hypohesized that the
upregulated LIMK1 might directly or indirectly affect the
biological functions of tumors by regulating these proteins and
pathways.
Another novelty of the present study was that LIMK1
expression was associated with immune cell infiltration in CRC.
Several studies have shown that LIMK1 may be involved in the
regulation of the immune microenvironment. In T cell immunity, HIV
triggers actin polymerization through the LIMK1-cofilin signaling
pathway (45). In NK cells, Duvall
et al (46) identify LIMK1
as a vital medium to regulate cytoskeletal rearrangement. However,
the role of LIMK1 in the immune tumor microenvironment remains to
be elucidated. Only some researchers have found that the expression
of LIMK1 was enriched in immune (CMS1) subtypes of CRC (29). The present study found that LIMK1
was associated with multiple tumor-infiltrating immune cells in
CRC. Among them, LIMK1 was most closely related to CD4+
T cells, macrophages and dendritic cells. In further subgroup
analysis, it was found that LIMK1 had stronger correlations with M2
macrophages and Treg cells, according to the analysis of cell
surface markers. Among these markers, forkhead box protein 3
(FOXP3) and CD163 showed the highest correlation. FOXP3 is a
crucial surface protein in Treg cells, which inhibits cytotoxic T
cells from attacking tumor cells (47). Research suggested that macrophages
with high expression of CD163 predict poor survival prognosis in a
variety of tumors (48). Inspired
by immune-related genes, the present study hypothesized that immune
checkpoint genes were related to LIMK1 expression levels. MDSCs, as
immune suppressive cells, can promote tumor growth, invasion and
angiogenesis (49). MDSCs are also
been reported to migrate to tumor tissues and exert
immunosuppressive functions in CRC (50). A study by Jensen et al
(51) found that high LIMK1
expression is associated with poor prognosis of patients with acute
myeloid leukemia by influencing MDSCs. Thus, the present study
explored the associations between LIMK1 and MDSCs in CRC. According
to the results, it was found that the correlation between MDSCs and
LIMK1 expression was relatively low in CRC. It was possible that
LIMK1 expression could not affect MDSCs recruitment and function in
TME. Thus, LIMK1 might be able to regulate the tumor immune
microenvironment through affecting immune cell infiltration and
immune-related molecules expression. Although more experiments were
needed to confirm these speculations, the results suggested that
LIMK1 had a significant relationship with immune cell infiltration
in CRC.
However, there were several limitations to the
present study. First, it only used the online shared database and a
small number of clinical samples to analyze the expression of LIMK1
and clinicopathological features of CRC. There are differences in
chip consistency in the database. It was important to verify the
results using more clinical data. Zhang et al (52) indicated that imbalanced LIMK1 and
LIMK2 expression leads to CRC progression and metastasis. Thus, it
was appropriate to consider LIMK1 and LIMK2 as common detection and
research targets in future studies of the LIMK family. Second, the
association between LIMK1 and tumor-infiltrating cells needed to be
further confirmed by experiments in vivo or in
vitro.
Taken together, the present study showed that LIMK1
was upregulated in CRC and its upregulation trend was closely
related to tumor lymph node metastasis and pathological staging in
this study. Moreover, it verified the potential association between
LIMK1 and tumor-infiltrating lymphocytes in CRC for the first time
to the best of the authors' knowledge. This indicated that LIMK1
was probably a powerful indicator for the diagnosis and treatment
of CRC.
In brief, LIMK1 was highly expressed in CRC and was
closely related to the clinical features and prognosis of patients.
In addition, LIMK1 was a promising prognostic indicator that may
regulate tumor progression by affecting the tumor immune
microenvironment in CRC.
Supplementary Material
Supporting Data
Acknowledgements
Not applicable.
Funding
Funding: No funding was received.
Availability of data and materials
The datasets used or analyzed during the current
study can be acquired from the corresponding author upon reasonable
request.
Authors' contributions
XL and QS analyzed LIMK1 expression data of CRC from
the TCGA and GEO databases. DW and YL conducted experimental
validation. ZZ and WF designed the experiments and wrote the
manuscript. All authors read and approved the final manuscript. ZZ
and WF confirm the authenticity of all the raw data.
Ethics approval and consent to
participate
This study was approved by the Ethics Review
Committee of Tianjin Medical University General Hospital (approval
no. 2021-WZ-203) and written informed consent was provided by all
patients.
Patient consent for publication
Not applicable.
Competing interests
The authors declare that they have no competing
interests.
References
|
1
|
Sung H, Ferlay J, Siegel RL, Laversanne M,
Soerjomataram I, Jemal A and Bray F: Global cancer statistics 2020:
GLOBOCAN estimates of incidence and mortality worldwide for 36
cancers in 185 countries. CA Cancer J Clin. 71:209–249. 2021.
View Article : Google Scholar : PubMed/NCBI
|
|
2
|
Allemani C, Matsuda T, Di Carlo V,
Harewood R, Matz M, Nikšić M, Bonaventure A, Valkov M, Johnson CJ,
Estève J, et al: Global surveillance of trends in cancer survival
2000-14 (CONCORD-3): Analysis of individual records for 37 513 025
patients diagnosed with one of 18 cancers from 322 population-based
registries in 71 countries. Lancet. 391:1023–1075. 2018. View Article : Google Scholar : PubMed/NCBI
|
|
3
|
Shaukat A, Kahi CJ, Burke CA, Rabeneck L,
Sauer BG and Rex DK: ACG Clinical guidelines: Colorectal cancer
screening 2021. Am J Gastroenterol. 116:458–479. 2021. View Article : Google Scholar : PubMed/NCBI
|
|
4
|
Liu X, Pan B, Sun L, Chen X, Zeng K, Hu X,
Xu T, Xu M and Wang S: Circulating exosomal miR-27a and miR-130a
Act as Novel Diagnostic And Prognostic Biomarkers Of Colorectal
Cancer. Cancer Epidemiol Biomarkers Prev. 27:746–754. 2018.
View Article : Google Scholar : PubMed/NCBI
|
|
5
|
Xu H, Wang C, Song H, Xu Y and Ji G:
RNA-Seq profiling of circular RNAs in human colorectal cancer liver
metastasis and the potential biomarkers. Mol Cancer. 18:82019.
View Article : Google Scholar : PubMed/NCBI
|
|
6
|
Nunoue K, Ohashi K, Okano I and Mizuno K:
LIMK-1 and LIMK-2, two members of a LIM motif-containing protein
kinase family. Oncogene. 11:701–710. 1995.PubMed/NCBI
|
|
7
|
Scott RW and Olson MF: LIM kinases:
Function, regulation and association with human disease. J Mol Med
(Berl). 85:555–568. 2007. View Article : Google Scholar : PubMed/NCBI
|
|
8
|
Kwon J, Seong MJ, Piao X, Jo YJ and Kim
NH: LIMK1/2 are required for actin filament and cell junction
assembly in porcine embryos developing in vitro. Asian-Australas J
Anim Sci. 33:1579–1589. 2020. View Article : Google Scholar : PubMed/NCBI
|
|
9
|
Bamburg JR and Bernstein BW: Roles of
ADF/cofilin in actin polymerization and beyond. F1000 Biol Rep.
2:622010. View
Article : Google Scholar : PubMed/NCBI
|
|
10
|
Nishimura Y, Yoshioka K, Bernard O,
Bereczky B and Itoh K: A role of LIM kinase 1/cofilin pathway in
regulating endocytic trafficking of EGF receptor in human breast
cancer cells. Histochem Cell Biol. 126:627–638. 2006. View Article : Google Scholar : PubMed/NCBI
|
|
11
|
Zhang M, Tian J, Wang R, Song M, Zhao R,
Chen H, Liu K, Shim J, Zhu F, Dong Z and Lee MH: Dasatinib inhibits
lung cancer cell growth and patient derived tumor growth in mice by
targeting LIMK1. Front Cell Dev Biol. 8:5565322020. View Article : Google Scholar : PubMed/NCBI
|
|
12
|
Huang JB, Wu YP, Lin YZ, Cai H, Chen SH,
Sun XL, Li XD, Wei Y, Zheng QS, Xu N and Xue XY: Up-regulation of
LIMK1 expression in prostate cancer is correlated with poor
pathological features, lymph node metastases and biochemical
recurrence. J Cell Mol Med. 24:4698–4706. 2020. View Article : Google Scholar : PubMed/NCBI
|
|
13
|
Zhao J, Li D and Fang L: MiR-128-3p
suppresses breast cancer cellular progression via targeting LIMK1.
Biomed Pharmacother. 115:1089472019. View Article : Google Scholar : PubMed/NCBI
|
|
14
|
Kang X, Li W, Liu W, Liang H, Deng J, Wong
CC, Zhao S, Kang W, To KF, Chiu PWY, et al: LIMK1 promotes
peritoneal metastasis of gastric cancer and is a therapeutic
target. Oncogene. 40:3422–3433. 2021. View Article : Google Scholar : PubMed/NCBI
|
|
15
|
Lu G, Zhou Y, Zhang C and Zhang Y:
Upregulation of LIMK1 is correlated with poor prognosis and immune
infiltrates in lung adenocarcinoma. Front Genet. 12:6715852021.
View Article : Google Scholar : PubMed/NCBI
|
|
16
|
Su J, Zhou Y, Pan Z, Shi L, Yang J, Liao
A, Liao Q and Su Q: Downregulation of LIMK1-ADF/cofilin by DADS
inhibits the migration and invasion of colon cancer. Sci Rep.
7:456242017. View Article : Google Scholar : PubMed/NCBI
|
|
17
|
Hu YH, Lu YX, Zhang ZY, Zhang JM, Zhang
WJ, Zheng L, Lin WH, Zhang W and Li XN: SSH3 facilitates colorectal
cancer cell invasion and metastasis by affecting signaling cascades
involving LIMK1/Rac1. Am J Cancer Res. 9:1061–1073. 2019.PubMed/NCBI
|
|
18
|
Ito K and Murphy D: Application of ggplot2
to pharmacometric graphics. CPT Pharmacometrics Syst Pharmacol.
2:e792013. View Article : Google Scholar : PubMed/NCBI
|
|
19
|
Ritchie ME, Phipson B, Wu D, Hu Y, Law CW,
Shi W and Smyth GK: limma powers differential expression analyses
for RNA-sequencing and microarray studies. Nucleic Acids Res.
43:e472015. View Article : Google Scholar : PubMed/NCBI
|
|
20
|
Li T, Fu J, Zeng Z, Cohen D, Li J, Chen Q,
Li B and Liu XS: TIMER2.0 for analysis of tumor-infiltrating immune
cells. Nucleic Acids Res. 48:W509–W514. 2020. View Article : Google Scholar : PubMed/NCBI
|
|
21
|
Uhlén M, Fagerberg L, Hallström BM,
Lindskog C, Oksvold P, Mardinoglu A, Sivertsson Å, Kampf C,
Sjöstedt E, Asplund A, et al: Proteomics. Tissue-based map of the
human proteome. Science. 347:12604192015. View Article : Google Scholar : PubMed/NCBI
|
|
22
|
Szklarczyk D, Gable AL, Nastou KC, Lyon D,
Kirsch R, Pyysalo S, Doncheva NT, Legeay M, Fang T, Bork P, et al:
The STRING database in 2021: Customizable protein-protein networks,
and functional characterization of user-uploaded gene/measurement
sets. Nucleic Acids Res. 49:D605–D612. 2021. View Article : Google Scholar : PubMed/NCBI
|
|
23
|
Huang da W, Sherman BT and Lempicki RA:
Systematic and integrative analysis of large gene lists using DAVID
bioinformatics resources. Nat Protoc. 4:44–57. 2009. View Article : Google Scholar : PubMed/NCBI
|
|
24
|
Dennis G Jr, Sherman BT, Hosack DA, Yang
J, Gao W, Lane HC and Lempicki RA: DAVID: Database for annotation,
visualization, and integrated discovery. Genome Biol. 4:P32003.
View Article : Google Scholar : PubMed/NCBI
|
|
25
|
Wu T, Hu E, Xu S, Chen M, Guo P, Dai Z,
Feng T, Zhou L, Tang W, Zhan L, et al: clusterProfiler 4.0: A
universal enrichment tool for interpreting omics data. Innovation
(Camb). 2:1001412021.PubMed/NCBI
|
|
26
|
Livak KJ and Schmittgen TD: Analysis of
relative gene expression data using real-time quantitative PCR and
the 2(−Delta Delta C(T)) method. Methods. 25:402–408. 2001.
View Article : Google Scholar : PubMed/NCBI
|
|
27
|
Robin X, Turck N, Hainard A, Tiberti N,
Lisacek F, Sanchez JC and Müller M: pROC: An open-source package
for R and S+ to analyze and compare ROC curves. BMC Bioinformatics.
12:772011. View Article : Google Scholar : PubMed/NCBI
|
|
28
|
Li J, Liu Y and Zheng L: The diagnostic
and prognostic value of LIMK1/2: A pan-cancer analysis. Ann Clin
Lab Sci. 51:615–624. 2021.PubMed/NCBI
|
|
29
|
Sousa-Squiavinato ACM, Vasconcelos RI,
Gehren AS, Fernandes PV, de Oliveira IM, Boroni M and Morgado-Díaz
JA: Cofilin-1, LIMK1 and SSH1 are differentially expressed in
locally advanced colorectal cancer and according to consensus
molecular subtypes. Cancer Cell Int. 21:692021. View Article : Google Scholar : PubMed/NCBI
|
|
30
|
Liao Q, Li R, Zhou R, Pan Z, Xu L, Ding Y
and Zhao L: LIM kinase 1 interacts with myosin-9 and
alpha-actinin-4 and promotes colorectal cancer progression. Br J
Cancer. 117:563–571. 2017. View Article : Google Scholar : PubMed/NCBI
|
|
31
|
Dai S, Xu S, Ye Y and Ding K:
Identification of an immune-related gene signature to improve
prognosis prediction in colorectal cancer patients. Front Genet.
11:6070092020. View Article : Google Scholar : PubMed/NCBI
|
|
32
|
McConnell BV, Koto K and
Gutierrez-Hartmann A: Nuclear and cytoplasmic LIMK1 enhances human
breast cancer progression. Mol Cancer. 10:752011. View Article : Google Scholar : PubMed/NCBI
|
|
33
|
Chen Q, Jiao D, Hu H, Song J, Yan J, Wu L
and Xu LQ: Downregulation of LIMK1 level inhibits migration of lung
cancer cells and enhances sensitivity to chemotherapy drugs. Oncol
Res. 20:491–498. 2013. View Article : Google Scholar : PubMed/NCBI
|
|
34
|
Zhang W, Gan N and Zhou J:
Immunohistochemical investigation of the correlation between LIM
kinase 1 expression and development and progression of human
ovarian carcinoma. J Int Med Res. 40:1067–1073. 2012. View Article : Google Scholar : PubMed/NCBI
|
|
35
|
You T, Gao W, Wei J, Jin X, Zhao Z, Wang C
and Li Y: Overexpression of LIMK1 promotes tumor growth and
metastasis in gastric cancer. Biomed Pharmacother. 69:96–101. 2015.
View Article : Google Scholar : PubMed/NCBI
|
|
36
|
Zhao CC, Zhan MN, Liu WT, Jiao Y, Zhang
YY, Lei Y, Zhang TT, Zhang CJ, Du YY, Gu KS and Wei W: Combined LIM
kinase 1 and p21-activated kinase 4 inhibitor treatment exhibits
potent preclinical antitumor efficacy in breast cancer. Cancer
Lett. 493:120–127. 2020. View Article : Google Scholar : PubMed/NCBI
|
|
37
|
Zhang X, Fang J, Chen S, Wang W, Meng S
and Liu B: Nonconserved miR-608 suppresses prostate cancer
progression through RAC2/PAK4/LIMK1 and BCL2L1/caspase-3 pathways
by targeting the 3′-UTRs of RAC2/BCL2L1 and the coding region of
PAK4. Cancer Med. 8:5716–5734. 2019. View Article : Google Scholar : PubMed/NCBI
|
|
38
|
Zeng Y, Ren M, Li Y, Liu Y, Chen C, Su J,
Su B, Xia H, Liu F, Jiang H, et al: Knockdown of RhoGDI2 represses
human gastric cancer cell proliferation, invasion and drug
resistance via the Rac1/Pak1/LIMK1 pathway. Cancer Lett.
492:136–146. 2020. View Article : Google Scholar : PubMed/NCBI
|
|
39
|
Zhang S, Shi W, Hu W, Ma D, Yan D, Yu K,
Zhang G, Cao Y, Wu J, Jiang C and Wang Z: DEP domain-containing
protein 1B (DEPDC1B) promotes migration and invasion in pancreatic
cancer through the Rac1/PAK1-LIMK1-cofilin1 signaling pathway. Onco
Targets Ther. 13:1481–1496. 2020. View Article : Google Scholar : PubMed/NCBI
|
|
40
|
Vainer G, Vainer-Mosse E, Pikarsky A,
Shenoy SM, Oberman F, Yeffet A, Singer RH, Pikarsky E and Yisraeli
JK: A role for VICKZ proteins in the progression of colorectal
carcinomas: Regulating lamellipodia formation. J Pathol.
215:445–456. 2008. View Article : Google Scholar : PubMed/NCBI
|
|
41
|
Tian T, Chen ZH, Zheng Z, Liu Y, Zhao Q,
Liu Y, Qiu H, Long Q, Chen M, Li L, et al: Investigation of the
role and mechanism of ARHGAP5-mediated colorectal cancer
metastasis. Theranostics. 10:5998–6010. 2020. View Article : Google Scholar : PubMed/NCBI
|
|
42
|
Li VS, Yuen ST, Chan TL, Yan HH, Law WL,
Yeung BH, Chan AS, Tsui WY, So S, Chen X and Leung SY: Frequent
inactivation of axon guidance molecule RGMA in human colon cancer
through genetic and epigenetic mechanisms. Gastroenterology.
137:176–187. 2009. View Article : Google Scholar : PubMed/NCBI
|
|
43
|
Sousa-Squiavinato ACM, Rocha MR,
Barcellos-de-Souza P, de Souza WF and Morgado-Diaz JA: Cofilin-1
signaling mediates epithelial-mesenchymal transition by promoting
actin cytoskeleton reorganization and cell-cell adhesion regulation
in colorectal cancer cells. Biochim Biophys Acta Mol Cell Res.
1866:418–429. 2019. View Article : Google Scholar : PubMed/NCBI
|
|
44
|
Yang Y and Jobin C: Microbial imbalance
and intestinal pathologies: Connections and contributions. Dis
Model Mech. 7:1131–1142. 2014. View Article : Google Scholar : PubMed/NCBI
|
|
45
|
Xu X, Guo J, Vorster P and Wu Y:
Involvement of LIM kinase 1 in actin polarization in human CD4 T
cells. Commun Integr Biol. 5:381–383. 2012. View Article : Google Scholar : PubMed/NCBI
|
|
46
|
Duvall MG, Fuhlbrigge ME, Reilly RB,
Walker KH, Kılıç A and Levy BD: Human NK cell cytoskeletal dynamics
and cytotoxicity are regulated by LIM kinase. J Immunol.
205:801–810. 2020. View Article : Google Scholar : PubMed/NCBI
|
|
47
|
Facciabene A, Motz GT and Coukos G:
T-regulatory cells: Key players in tumor immune escape and
angiogenesis. Cancer Res. 72:2162–2171. 2012. View Article : Google Scholar : PubMed/NCBI
|
|
48
|
Jung KY, Cho SW, Kim YA, Kim D, Oh BC,
Park DJ and Park YJ: Cancers with higher density of
tumor-associated macrophages were associated with poor survival
rates. J Pathol Transl Med. 49:318–324. 2015. View Article : Google Scholar : PubMed/NCBI
|
|
49
|
Zhang Y, Xu J, Zhang N, Chen M, Wang H and
Zhu D: Targeting the tumour immune microenvironment for cancer
therapy in human gastrointestinal malignancies. Cancer Lett.
458:123–135. 2019. View Article : Google Scholar : PubMed/NCBI
|
|
50
|
Yin K, Xia X, Rui K, Wang T and Wang S:
Myeloid-derived suppressor cells: A new and pivotal player in
colorectal cancer progression. Front Oncol. 10:6101042020.
View Article : Google Scholar : PubMed/NCBI
|
|
51
|
Jensen P, Carlet M, Schlenk RF, Weber A,
Kress J, Brunner I, Słabicki M, Grill G, Weisemann S, Cheng YY, et
al: Requirement for LIM kinases in acute myeloid leukemia.
Leukemia. 34:3173–3185. 2020. View Article : Google Scholar : PubMed/NCBI
|
|
52
|
Zhang Y, Li A, Shi J, Fang Y, Gu C, Cai J,
Lin C, Zhao L and Liu S: Imbalanced LIMK1 and LIMK2 expression
leads to human colorectal cancer progression and metastasis via
promoting β-catenin nuclear translocation. Cell Death Dis.
9:7492018. View Article : Google Scholar : PubMed/NCBI
|