Introduction
Colon cancer is a common type of gastrointestinal
tumor. According to statistics, its incidence ranks third among all
tumors and its mortality rates second (1). The specific symptoms, occurrence and
development of colon cancer are not obvious and its detection is
challenging, which results in patients being diagnosed at the
advanced stages (2). The
development and progression of colon cancer is a multi-step
process, in which accumulated genetic changes can serve an
important role. Although considerable progress has been made in the
surgery, chemotherapy, radiotherapy and targeted drugs used for
colon cancer, there has been no improvement in the overall survival
of patients with colon cancer (3).
Therefore, identifying new ways for the prevention and treatment of
colon cancer is necessary.
There are significant differences in the metabolism
between tumor and normal cells and there is great potential for
anti-tumor therapy to use these differences to advantage (4). Graziosi et al (5) show that gastric tumor cells cannot
grow in methionine-deprived media and normal cells can grow
normally under methionine-deprived conditions. This may be due to
the increase in protein synthesis and transmethylation in tumor
cells. The requirement for methionine far exceeds that of normal
cells (6). At the same time, due
to the low activity of methionine synthase in tumor cells, they
cannot use homocysteine to synthesize sufficient endogenous
methionine, as can normal cells (5,6). A
study by Epner et al (7)
that the restriction of methionine provided in the intestines for
an average of 17 weeks is safe and feasible for patients with
advanced metastatic cancer. The short-term methionine restriction
(MR) obtained through total parenteral nutrition can improve the
efficacy of 5-fluorouracil in patients with advanced gastric cancer
(8). These finding suggested that
restricting the access of colon cancer cells to methionine is a
promising treatment approach.
The Gene Expression Omnibus (GEO, http://www.ncbi.nlm.nih.gov/geo/) and The Cancer
Genome Atlas databases (version 23.0; http://portal.gdc.cancer.gov) were used in the present
study to comprehensively analyze the effect of MR on the expression
of colon cancer genes and preliminarily explore its anti-tumor
mechanism. It was also confirmed that the MR ability inhibited the
proliferation, metastasis and invasion of colon cancer HCT116 cells
and promoted apoptosis. Finally, a variety of statistical and
bioinformatics methods were used to identify and verify the key
genes that affect the progression of colon cancer by MR.
Materials and methods
Data collection and processing
The GSE72131 and GSE103602 datasets, which included
data on the treatment of HCT116 colon cancer cells with MR, were
downloaded from the GEO database. The acquired dataset was analyzed
using R 3.6.1 software (https://www.r-project.org/) and ‘DESeq2’ (version
1.36.0; http://github.com/mikelove/DESeq2) and ‘Edge’ R
(version 2.28.0; http://github.com/jdstorey/edge) packages were used to
analyze the two datasets separately and |Log2Fold change|>1 and
false discovery rate <0.05 were used as the screening conditions
to identify the differentially expressed genes. A Venn diagram was
used to obtain the common methionine starvation differentially
expressed genes in the two datasets. The colon cancer IlluminaHiSeq
dataset was downloaded from UCSC Xena (https://xena.ucsc.edu), matching colon cancer samples
were extracted and the ‘Limma’ R package (9) was used to identify genes that are
differentially expressed in colon cancer. The Venn diagram was used
to analyze the effect of MR treatment on the differentially
expressed genes in colon cancer. The original ‘CEL’ files of the
GSE41445 dataset (containing three human colon cancer cell lines:
HT116, HT29 and SW480) and the GSE29316 dataset (containing human
colonic tissue cell line CCD-18Co) were downloaded from the GEO
database. The expression data of the four cell lines were extracted
from the ‘CEL’ original file by running the ‘RMA’ function using
R3.6.1 software and the ‘Combat’ function was used to perform
background correction and remove batch effects. The expression of
vital genes in these cells was extracted and Student's t-test was
used for differential analysis of CCD-18Co and HT116, HT29 and
SW480, respectively.
Gene Ontology (GO) and Kyoto
Encyclopedia of Genes and Genomes (KEGG) enrichment analysis
The GO resource provides a computational
representation of current scientific knowledge on the functions of
genes from a number of different organisms, from humans to
bacteria. The ontology is usually composed of a set of categories
(or terms or concepts), between which there is a relationship. It
describes current understanding of the biological field from three
aspects (GO domains): Molecular Function (MF), Cellular Component
(CC) and Biological Process (BP). The KEGG is used to understand
the advanced functions of biological systems (such as cells,
organisms and ecosystems) from molecular-level information
(especially large-scale molecular datasets generated through genome
sequencing and other high-throughput sequencing). To understand the
molecular mechanism and related biological signaling changes in
colon cancer cells after MR, the ‘clusterprofiler’ R package
(version 4.4.1; http://doi.org/10.1016/j.xinn.2021.100141)was used to
perform GO and KEGG functional enrichment analysis on MR-affected
differentially expressed genes.
Construction of transcription
regulation and competitive endogenous (ce) RNA network
In order to understand the possible mechanism of the
effect MR has on differentially expressed genes in colon cancer,
transcriptional regulation and ceRNA network construction were
performed on the obtained genes. For the transcriptional regulatory
network, DAVID 6.8 (https://david.ncifcrf.gov/) was used to enrich the
potential transcription factors of all genes and the transcription
factors with a Bonferroni value of <0.05 were considered as
meaningful (10). For the ceRNA
network, miRcode (http://mircode.org/) was used to compare the obtained
genes, in order to obtain the ceRNA network and identify key long
non-coding (lnc)RNAs and microRNAs (11). The two networks are visualized
using Cytoscape 3.6.1 (https://cytoscape.org/).
Protein interaction network (PPI)
construction and screening of independent prognostic candidate
genes
The STRING database (version 11.5; http://string-db.org/) contains known protein
interactions. To identify core gene networks from differentially
expressed genes in colon cancer affected by MR, they were uploaded
to the STRING database for online retrieval of protein interactions
using default settings. These protein interaction networks were
visualized using Cytoscape 3.6.1 and the network analysis tool
ranked genes from the inside to the outside by degree value. The
molecular complex detection (MCODE) tool was used to conduct a
comprehensive analysis of the entire PPI network. The following
conditions were set as follows: Degree cutoff=2, node score
cutoff=0.2, K-core=2 and max depth=100. The modules were filtered
with k>5 as a key module. For genes in key modules, least
absolute shrinkage and selection operator (Lasso) and multivariate
Cox regression analysis identified gastric cancer-independent
prognostic genes while removing collinearity to avoid
overfitting.
Cell culture and processing
Human HCT116, HT29 and SW480 cell lines containing
10% fetal bovine serum (Gibco; Thermo Fisher Scientific, Inc.) and
100 IU/ml penicillin (Beijing Solarbio Science & Technology
Co., Ltd.) were cultured in DMEM (Boster Biological Technology).
Methionine-restricted cells were cultured in methionine-free (MET-)
DMEM (Boster Biological Technology). All cells were cultured in a
humidified atmosphere containing 5% CO2 at 37°C.
Cell proliferation assay
Evaluation of colon cancer cell proliferation
through 5-ethynyl-2′-deoxyuridine (EdU) cell proliferation
detection. First, staining was performed according to the
instructions of the EDU commercial kit (US Everbright Inc.). Cells
were incubated with EdU for 4 h at 37°C and fixed with 4%
paraformaldehyde for 15 min at room temperature, cells were treated
with 100 µl of YF®594 Azide (US Everbright Inc.) for 30
min at room temperature. Cells in each well were then stained for
DNA with 100 µl of DAPI for 30 min at room temperature.
Subsequently, under a fluorescence microscope (magnification, ×50;
Olympus Corporation), three different fields of view were randomly
selected for counting analysis.
Apoptosis detection through TUNEL
staining
DNA double-strand breaks in apoptotic cells or gaps
in one strand result in a series of 3′-OH ends, which are formed by
deoxyribonucleotide and biotin under the action of
deoxyribonucleotide terminal transferase. Derivatives are labeled
to the 3′ end of DNA for the detection of apoptotic cells. Based on
this principle, TUNEL staining kit (US Everbright Inc.) was used to
stain the treated cells. The fixed and permeabilized cells were
treated with deoxyribonucleotide terminal transferase at 37°C for
30 min. subsequently with YF®594 TUNEL reaction in the
dark for 60 min. Cells in each well were then stained for DNA with
100 µl of DAPI for 30 min at room temperature. Subsequently, under
a fluorescence microscope (magnification, ×50; Olympus
Corporation), three different fields of view were randomly selected
for counting analysis.
Cell migration and invasion
experiments
The wound-healing assay measures cell migration.
When the cells were close to 95% confluence, 200 µl pipette tips
were used to scrape the monolayer vertically. After washing away
the cell debris with PBS, an inverted microscope (magnification,
×50; Olympus Corporation) was used to analyze the wound gap size at
0, 24 and 48 h after the injury to evaluate the migration
ability.
To determine the vertical migration of cells, the
cells were suspended in different serum-free media and
2×10⁵ cells were seeded in the chamber of a 8.0 µm
Transwell® plate (Corning, Inc.). For the cell invasion
assay, the upper chamber was pre-coated with Matrigel®
(BD Biosciences) for 2 h at 37°C and the remaining steps were the
same as the vertical migration assay. The lower chamber was
supplemented with 800 µl serum-containing medium and cultured for
72 h. At room temperature, the cells that invaded into the lower
chamber were fixed with methanol for 15 min, stained with 0.1%
(w/v) crystal violet (room temperature) for 20 min and analyzed
using an inverted microscope (magnification, ×50; Olympus
Corporation).
Western blot analysis
Cells were lysed in RIPA (Beijing Solarbio Science
& Technology Co., Ltd.) containing protease inhibitors (Boster
Biological Technology) for 20 min on ice. A BCA protein content kit
(Beijing Solarbio Science & Technology Co., Ltd.) was used to
determine protein concentration. Total protein (40 µg) per well was
separated on 10% Sodium Dodecyl Sulphate-Polyacrylamide Gel
electrophoresis and transferred onto a PVDF membrane
(MilliporeSigma). The membrane was blocked with 5% BSA (CoWin
Biosciences) for 1 h at room temperature. The PVDF membrane was
soaked with GAPDH (cat. no. 60004-1-Ig; dilution: 1:10,000;
ProteinTech Group, Inc.), B-cell lymphoma/leukemia-2 (cat. no.
12789-1-AP; dilution: 1:1,000; ProteinTech Group, Inc.),
Bcl-2-associated X (cat. no. 50599- 2-Ig; dilution: 1:1,000;
ProteinTech Group, Inc.), Caspase-3 (cat. no. 66470-2-Ig; dilution:
1:1,000; ProteinTech Group, Inc.), N-cadherin (cat. no. ab76057;
dilution: 1:1,000; Abcam), E-cadherin (cat. no. ab231303; dilution:
1:1,000; Abcam) and vimentin (cat. no. ab137321; dilution:
1:10,000; Abcam) for 12 h at 4°C. Following washing with
Tris-buffered saline with 0.05% Tween, the membrane was probed with
horseradish peroxidase-conjugated goat anti-rabbit (cat. no.
BA1070; dilution: 1:5,000; Boster Biological Technology) or goat
anti-mouse IgG (cat. no. BM2002; dilution: 1:5,000; Boster
Biological Technology) for 1 h at room temperature. The band was
detected using Super ECL Plus (US Everbright Inc.). The protein
expression results are expressed relative to the GAPDH band
density. The expression gray value of every protein was analyzed
using Image Lab 5.2.1 (Bio-Rad Laboratories, Inc.).
Expression verification of key
genes
The expression of six hub genes was validated
following MR in HCT116, HT29 and SW480. Total RNA was extracted
from 80–90% confluent cells using TRIzol® Reagent
(Thermo Fisher Scientific, Inc.) according to the manufacturer's
instructions. After the concentration and purity of the RNA were
qualified, an RR047a reverse transcription (RT) kit (Takara Bio,
Inc.) was used for RT, according to the manufacturer's
instructions. β-actin was used as the internal reference gene, and
calculate the 2−ΔΔCq value for each hub gene. The
calculation formula was as follows:
ΔΔCq=ΔCqexperimentalgroup-ΔCqcontrolgroup,
ΔCq=Cqtargetgene-Cqinternalreference
(12). The expression level of the
target gene was analyzed using an RR820 kit (Takara Bio, Inc.) in
the ABI7900-HT system (Thermo Fisher Scientific, Inc.). The qPCR
conditions were: Denaturation, 95°C, 30 sec; annealing, 95°C, 3
sec; extension, 60°C, 30 sec; 40 cycles. All primers used were
synthesized by Sangon Biotech (Shanghai) Co., Ltd. and the primer
sequences are shown in Table I.
The above experiments were repeated three times.
 | Table I.Primer sequence used in the present
study. |
Table I.
Primer sequence used in the present
study.
| Gene ID | Forward primer
sequence (5′-3′) | Reverse primer
sequence (5′-3′) |
|---|
| β-actin |
CACCATTGGCAATGAGCGGTTC |
AGGTCTTTGCGGATGTCCACGT |
| E2F1 |
GGACCTGGAAACTGACCATCAG |
CAGTGAGGTCTCATAGCGTGAC |
| MIR17HG |
GGGCCTCCGGTCGTAGTAA |
AACAGGTTTCCCTCCGTCGC |
| FANCI |
CCACCTTTGGTCTATCAGCTTC |
CAACATCCAATAGCTCGTCACC |
| HJURP |
CAGATGGGGTGGACAACAC |
TCTTCCATCCTGTAAGACGTG |
| KPNA2 |
CTGTTGGCTCTCCTTGCAGTTC |
GCAGGATTCTTGTTGCGGCAAAG |
| KIF15 |
AGGAATCTGTATTCGCAACTGTG |
ACTTCGTGGGATTACTCCTCTC |
Statistical analysis
GraphPad Prism 8.0 (GraphPad Software, Inc.) was
used for statistical analysis and the mean ± standard deviation was
used to describe the measurement data. The experiments were
repeated >3 times and a Student's unpaired t-test was
used to compare the two samples. For multiple comparisons, the
significance was identified by simple one-way ANOVA followed by a
Tukey's post-hoc test. P<0.05 was considered to indicate a
statistically significant difference.
Results
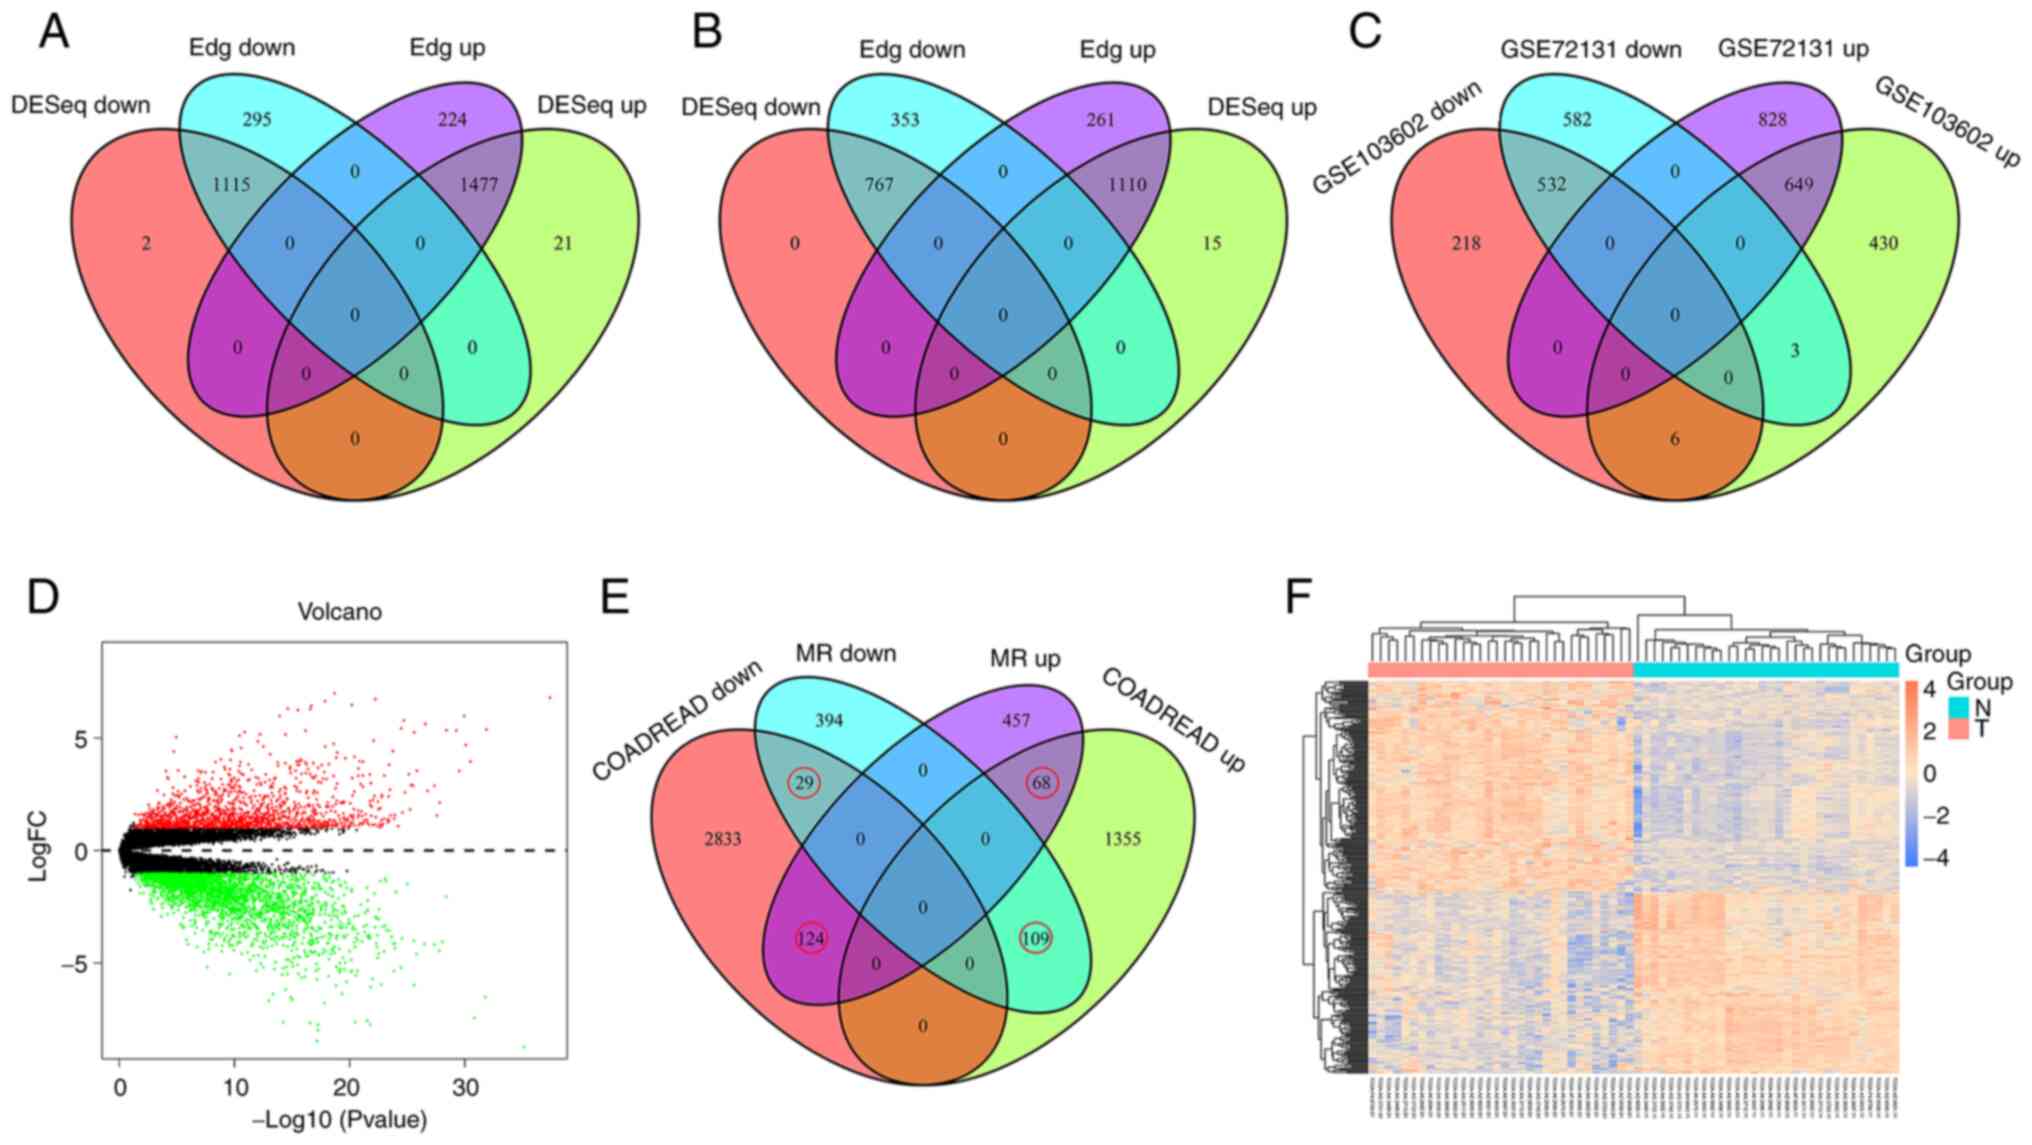
Gene expression affected by MR
The effects of MR on gene expression were identified
in the GSE72131 and GSE103602 datasets using the ‘Edge’ and ‘DESeq’
packages. In the GSE72131 dataset, 1,477 upregulated and 1,115
downregulated genes were identified (Fig. 1A). In the GSE103602 dataset, 1,877
dysregulated genes were identified, including 1,110 upregulated and
767 downregulated genes (Fig. 1B).
The intersection of the two datasets identified a total of 649
co-upregulated and 532 co-downregulated genes (Fig. 1C), which were considered to be
differentially expressed genes affected by MR. In addition, the
dysregulated genes in colon cancer were also analyzed, with a total
of 1,532 upregulated and 2,986 downregulated genes identified
(Fig. 1D). To identify the effect
of methionine starvation on these differentially expressed genes in
colon cancer, Venn diagram analysis was performed on the two.
Finally, 330 genes were identified (Fig. 1E) and cluster analysis of these
genes in paired colon samples was performed using heat maps
(Fig. 1F).
GO and KEGG function enrichment
analysis
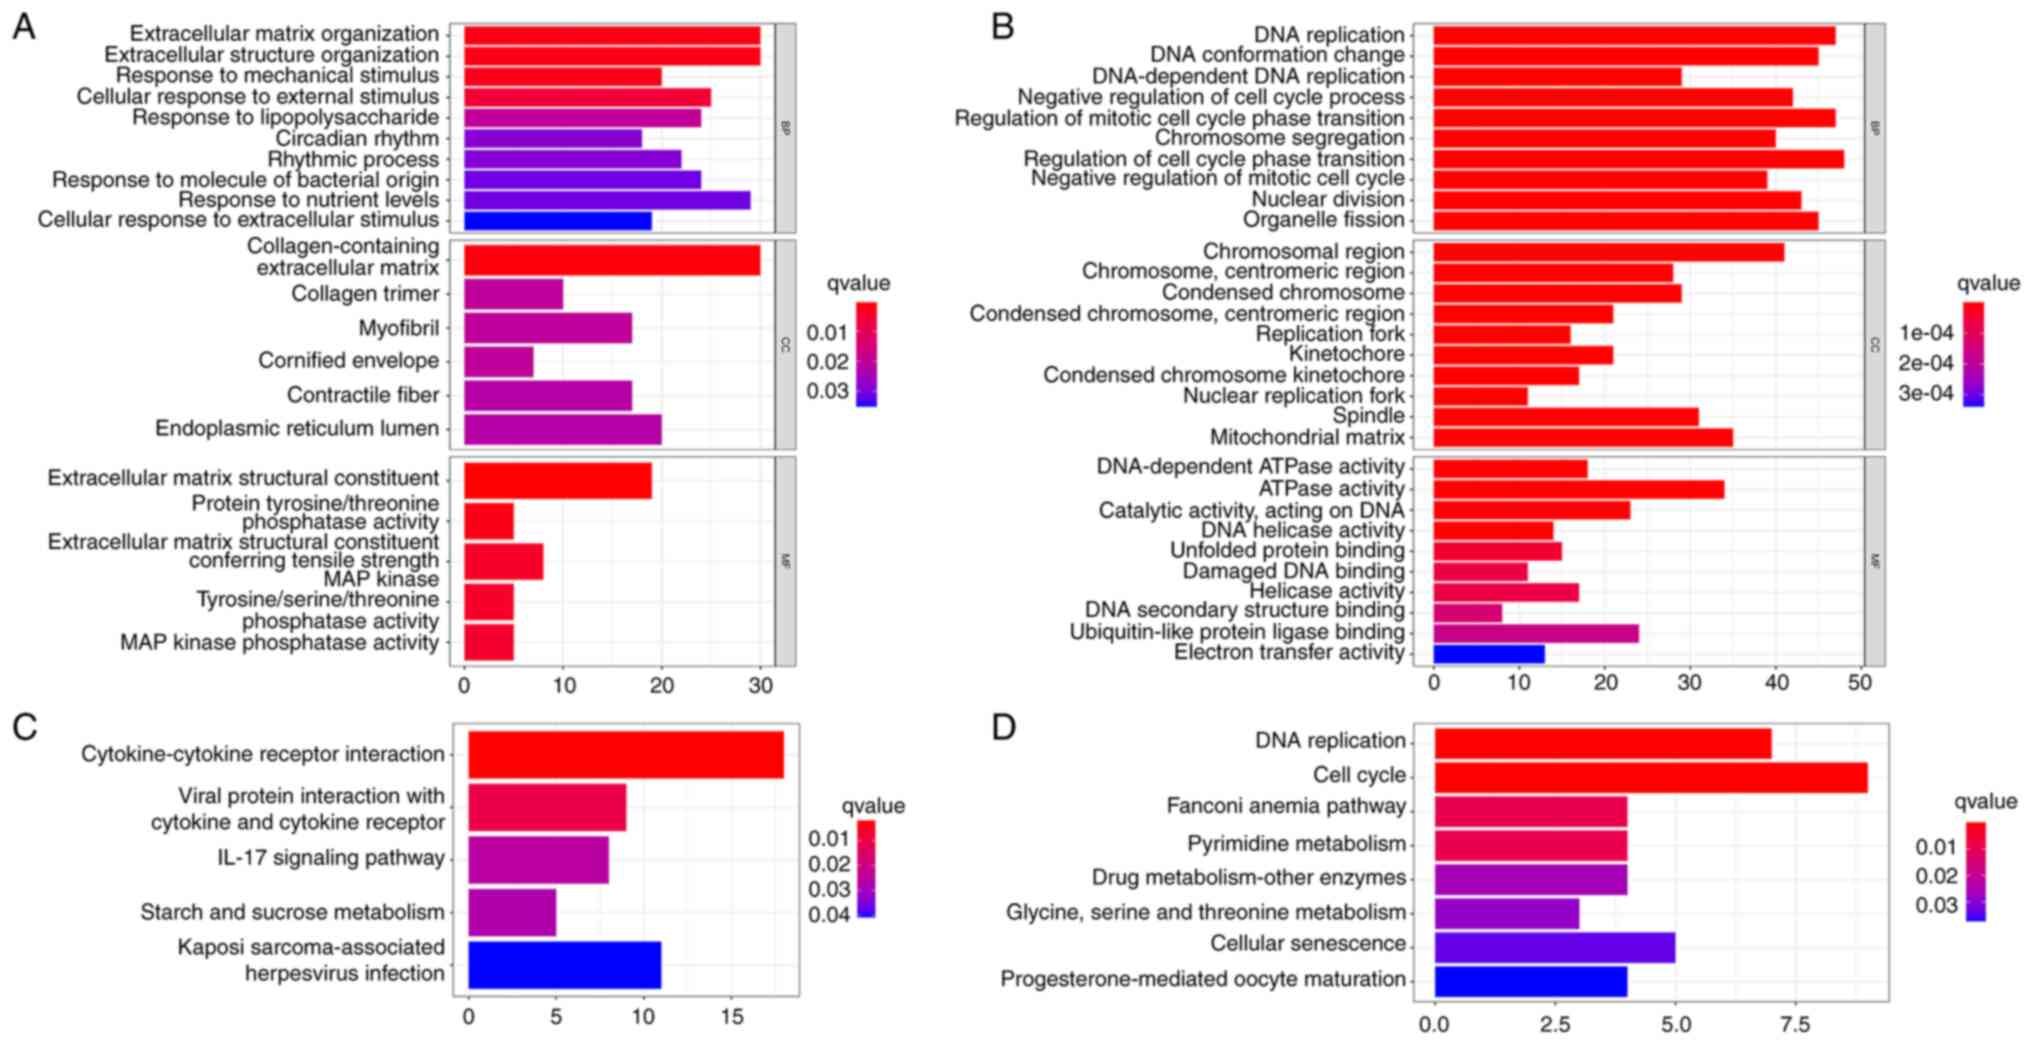
To understand the influence of MR on the molecular
mechanism of colon cancer, the obtained MR-regulated genes were
enriched and analyzed. For 649 upregulated genes, BP was enriched
in extracellular matrix organization, extracellular structure
organization, response to nutrient levels and I-κΒ kinase/NF-κΒ
signaling; CC was mainly enriched in the collagen-containing
extracellular matrix, collagen trimer; MF was mainly enriched in
extracellular matrix structural constituent, protein
tyrosine/threonine phosphatase activity, extracellular matrix
structural constituent conferring tensile strength, MAPK
tyrosine/serine/threonine phosphatase activity and MAPK phosphatase
activity (Fig. 2A; Table SI). KEGG was mainly enriched in
cytokine-cytokine receptor interaction, viral protein interaction
with cytokine and cytokine receptors pathway, IL-17 signaling
pathway and starch and sucrose metabolism (Fig. 2C). For 532 downregulated genes, BP
was enriched in DNA replication, DNA conformation change,
DNA-dependent DNA replication and negative regulation of cell cycle
process; CC was mainly enriched in chromosome regions and
mitochondria; MF was mainly enriched in DNA-dependent ATPase
activity, ATPase activity and ubiquitin-like protein ligase binding
(Fig. 2B; Table SI). KEGG was mainly enriched in
DNA replication, cell cycle, pyrimidine metabolism, drug
metabolism-other enzymes, glycine and serine and threonine
metabolism (Fig. 2D).
Transcription regulation and ceRNA
network
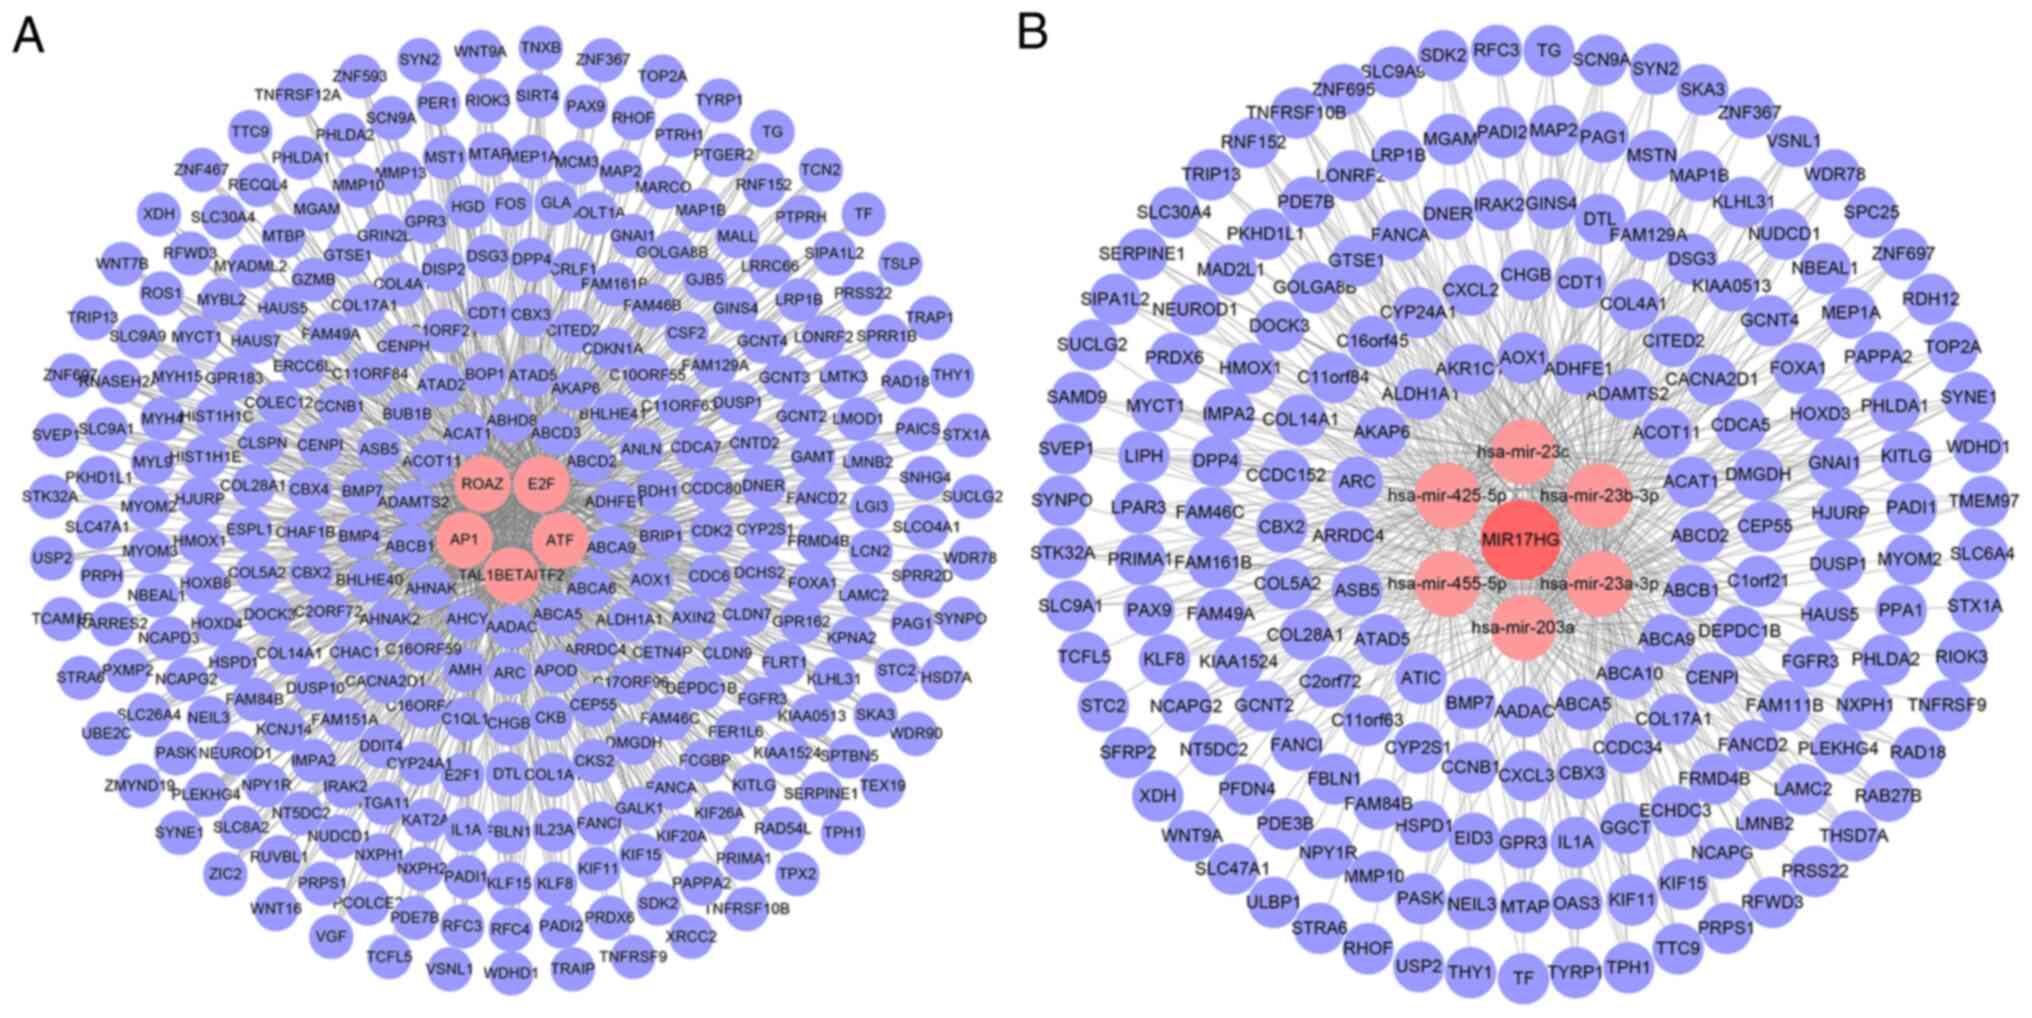
A transcriptional regulatory network was constructed
for differentially expressed genes regulated by MR in colon cancer.
For the obtained 330 genes, five types of transcription factors
[zinc finger protein 423 (ZNF423, ROAZ), E2F Transcription Factor
(E2F), Activating Transcription Factor (ATF), TAL1β-ITF2 and
Activator Protein 1 (AP1)] and 298 downstream coding genes were
identified. It is worth noting that the differential genes
identified included E2F family gene F transcription factor 1 (E2F1;
Fig. 3A). In addition, these 330
genes were found to contain two lncRNAs [MiR-17-92a-1 Cluster Host
Gene (MIR17HG) and Small Nucleolar RNA Host Gene 4], 325
protein-coding genes and three pseudogenes. On this basis, a ceRNA
network was constructed and five miRNAs downstream of MIR17HG were
identified (has-mir-23c, has-mir-23b-3p, has-mir-23a-3p,
has-mir-203a, has-mir-455- 5p and has-mir-425-5p) and 190 miRNA
target genes (Fig. 3B).
Construction of PPI network and
identification of independent prognostic genes
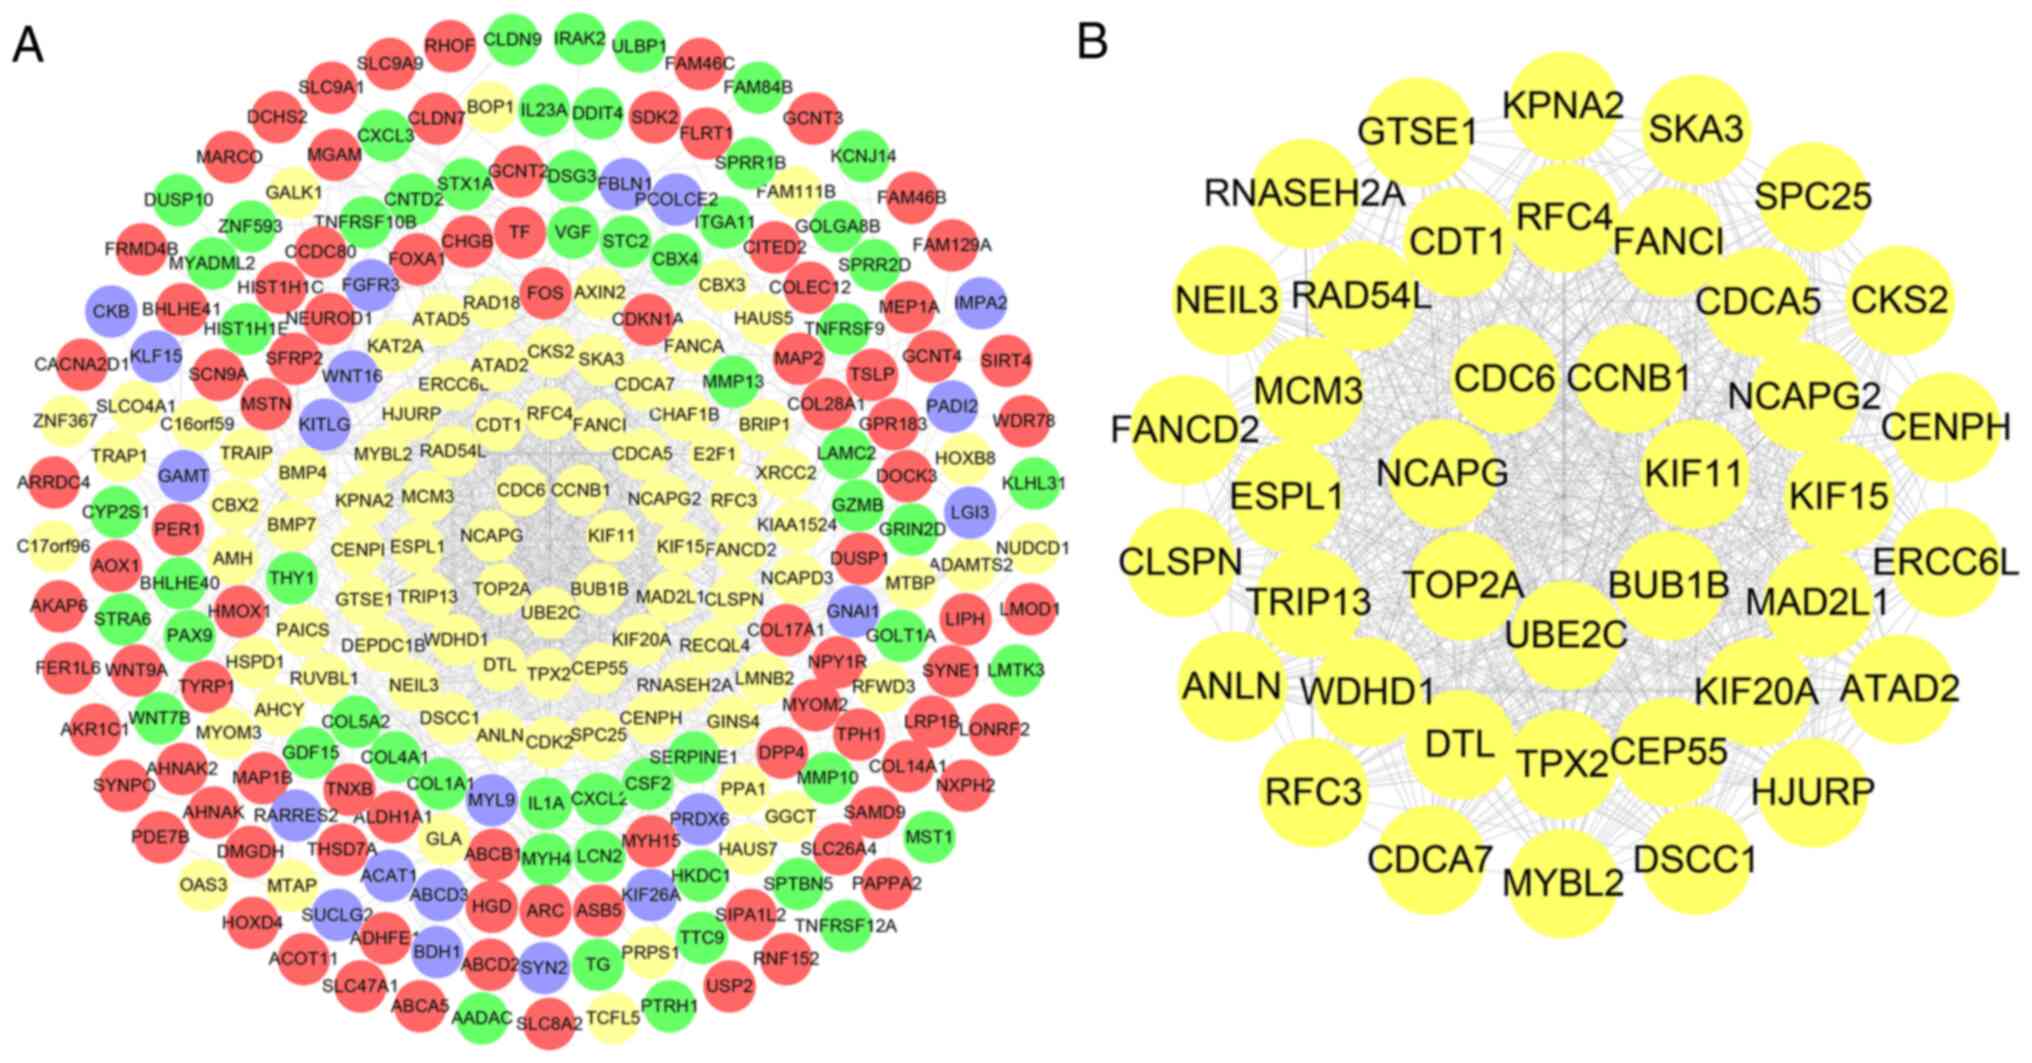
A total of 325 encoded proteins were uploaded to
STRING and the independent and unconnected proteins from the
overall network were removed to obtain a network of 256 genes and
1,321 edges (Fig. 4A). Using
MCODE, a key network with k=15.6 was identified from the network,
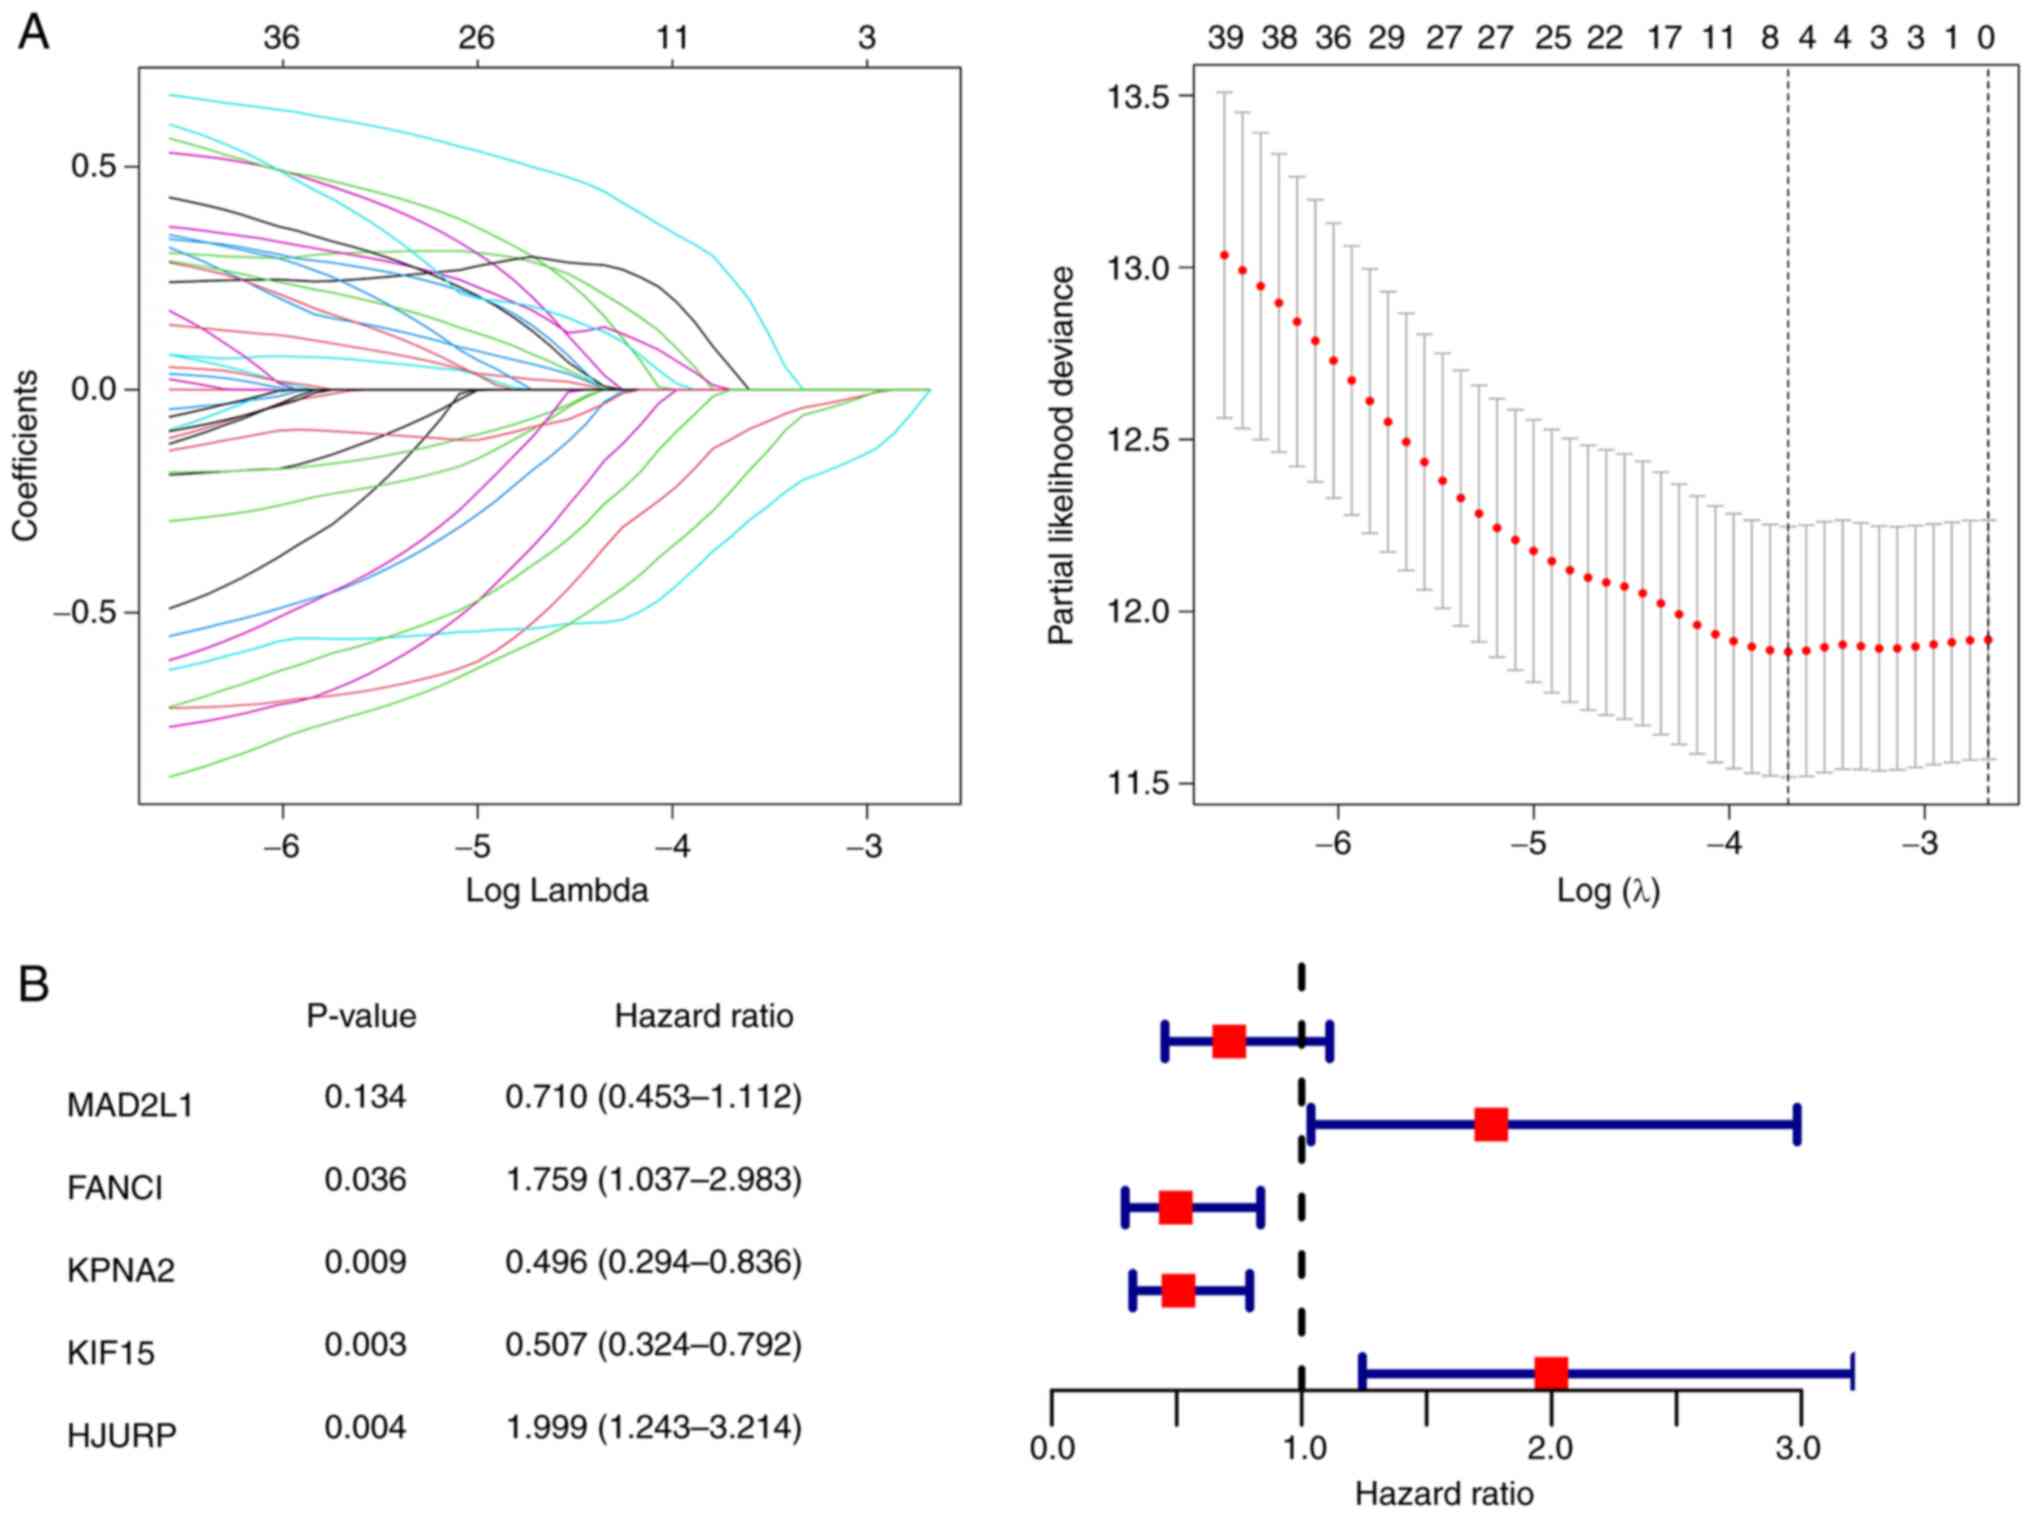
which contained 41 genes and 675 edges (Fig. 4B). For these 41 candidate genes,
Lasso regression analysis was first used to remove collinearity and
five prognostic genes [Mitotic arrest deficient 2 like 1, FA
complementation group I (FANCI), Karyopherin subunit alpha 2
(KPNA2), Kinesin family member 15 (KIF15) and Holliday junction
recognition protein (HJURP)] were identified (Fig. 5A). Furthermore, using multivariate
Cox regression analysis (Fig. 5B),
four out of these five genes (FANCI, KPNA2, KIF15 and HJURP) were
identified as independent prognostic genes (P<0.05).
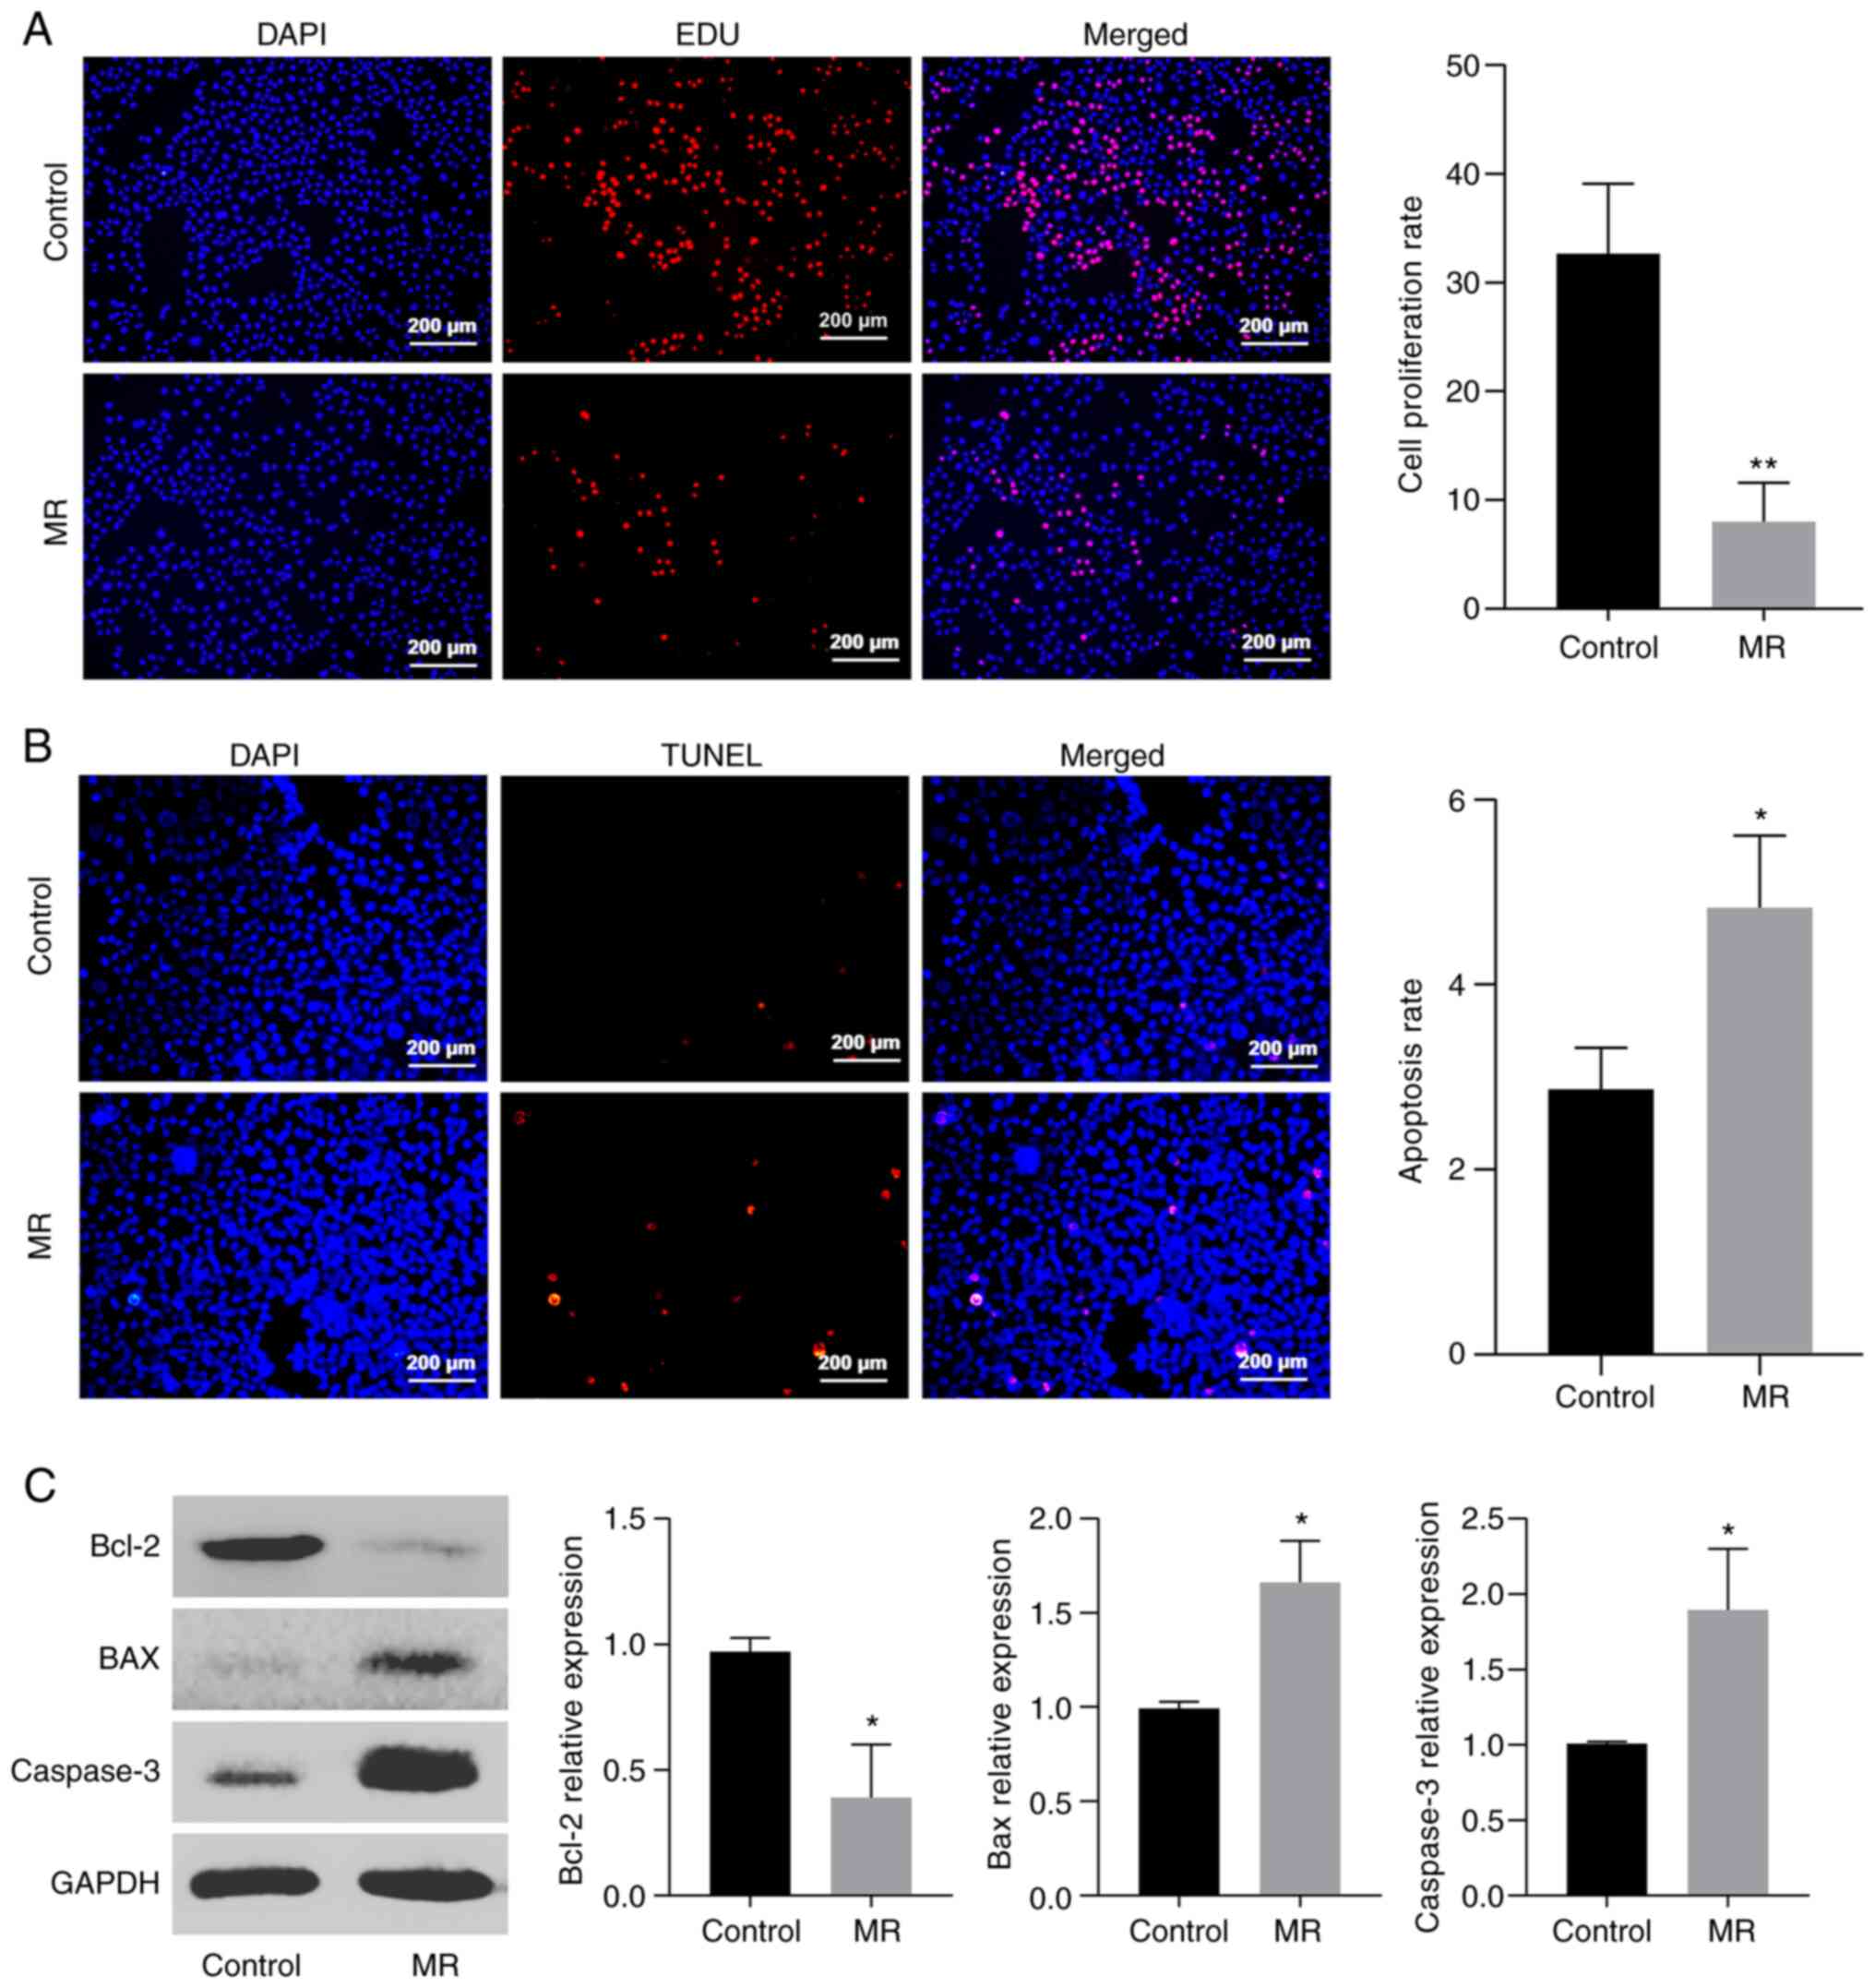
Effect of MR on the proliferation and
apoptosis of colon cancer cells
First, EDU staining was used to analyze the effect
of MR on the proliferation of colon cells (Fig. 6A) and the results showed that the
cell proliferation ability of the MR group was weaker than that of
the control group (P<0.01). The apoptotic rate was also analyzed
(Fig. 6B) following MR and it was
found to be significantly higher than that of the control group
(P<0.05). By analyzing the expression of apoptosis-related
proteins (Fig. 6C), the expression
of Bax and Caspase-3 was significantly increased, while that of
Bcl-2 was decreased, which also confirmed that MR can induce
apoptosis (P<0.05).
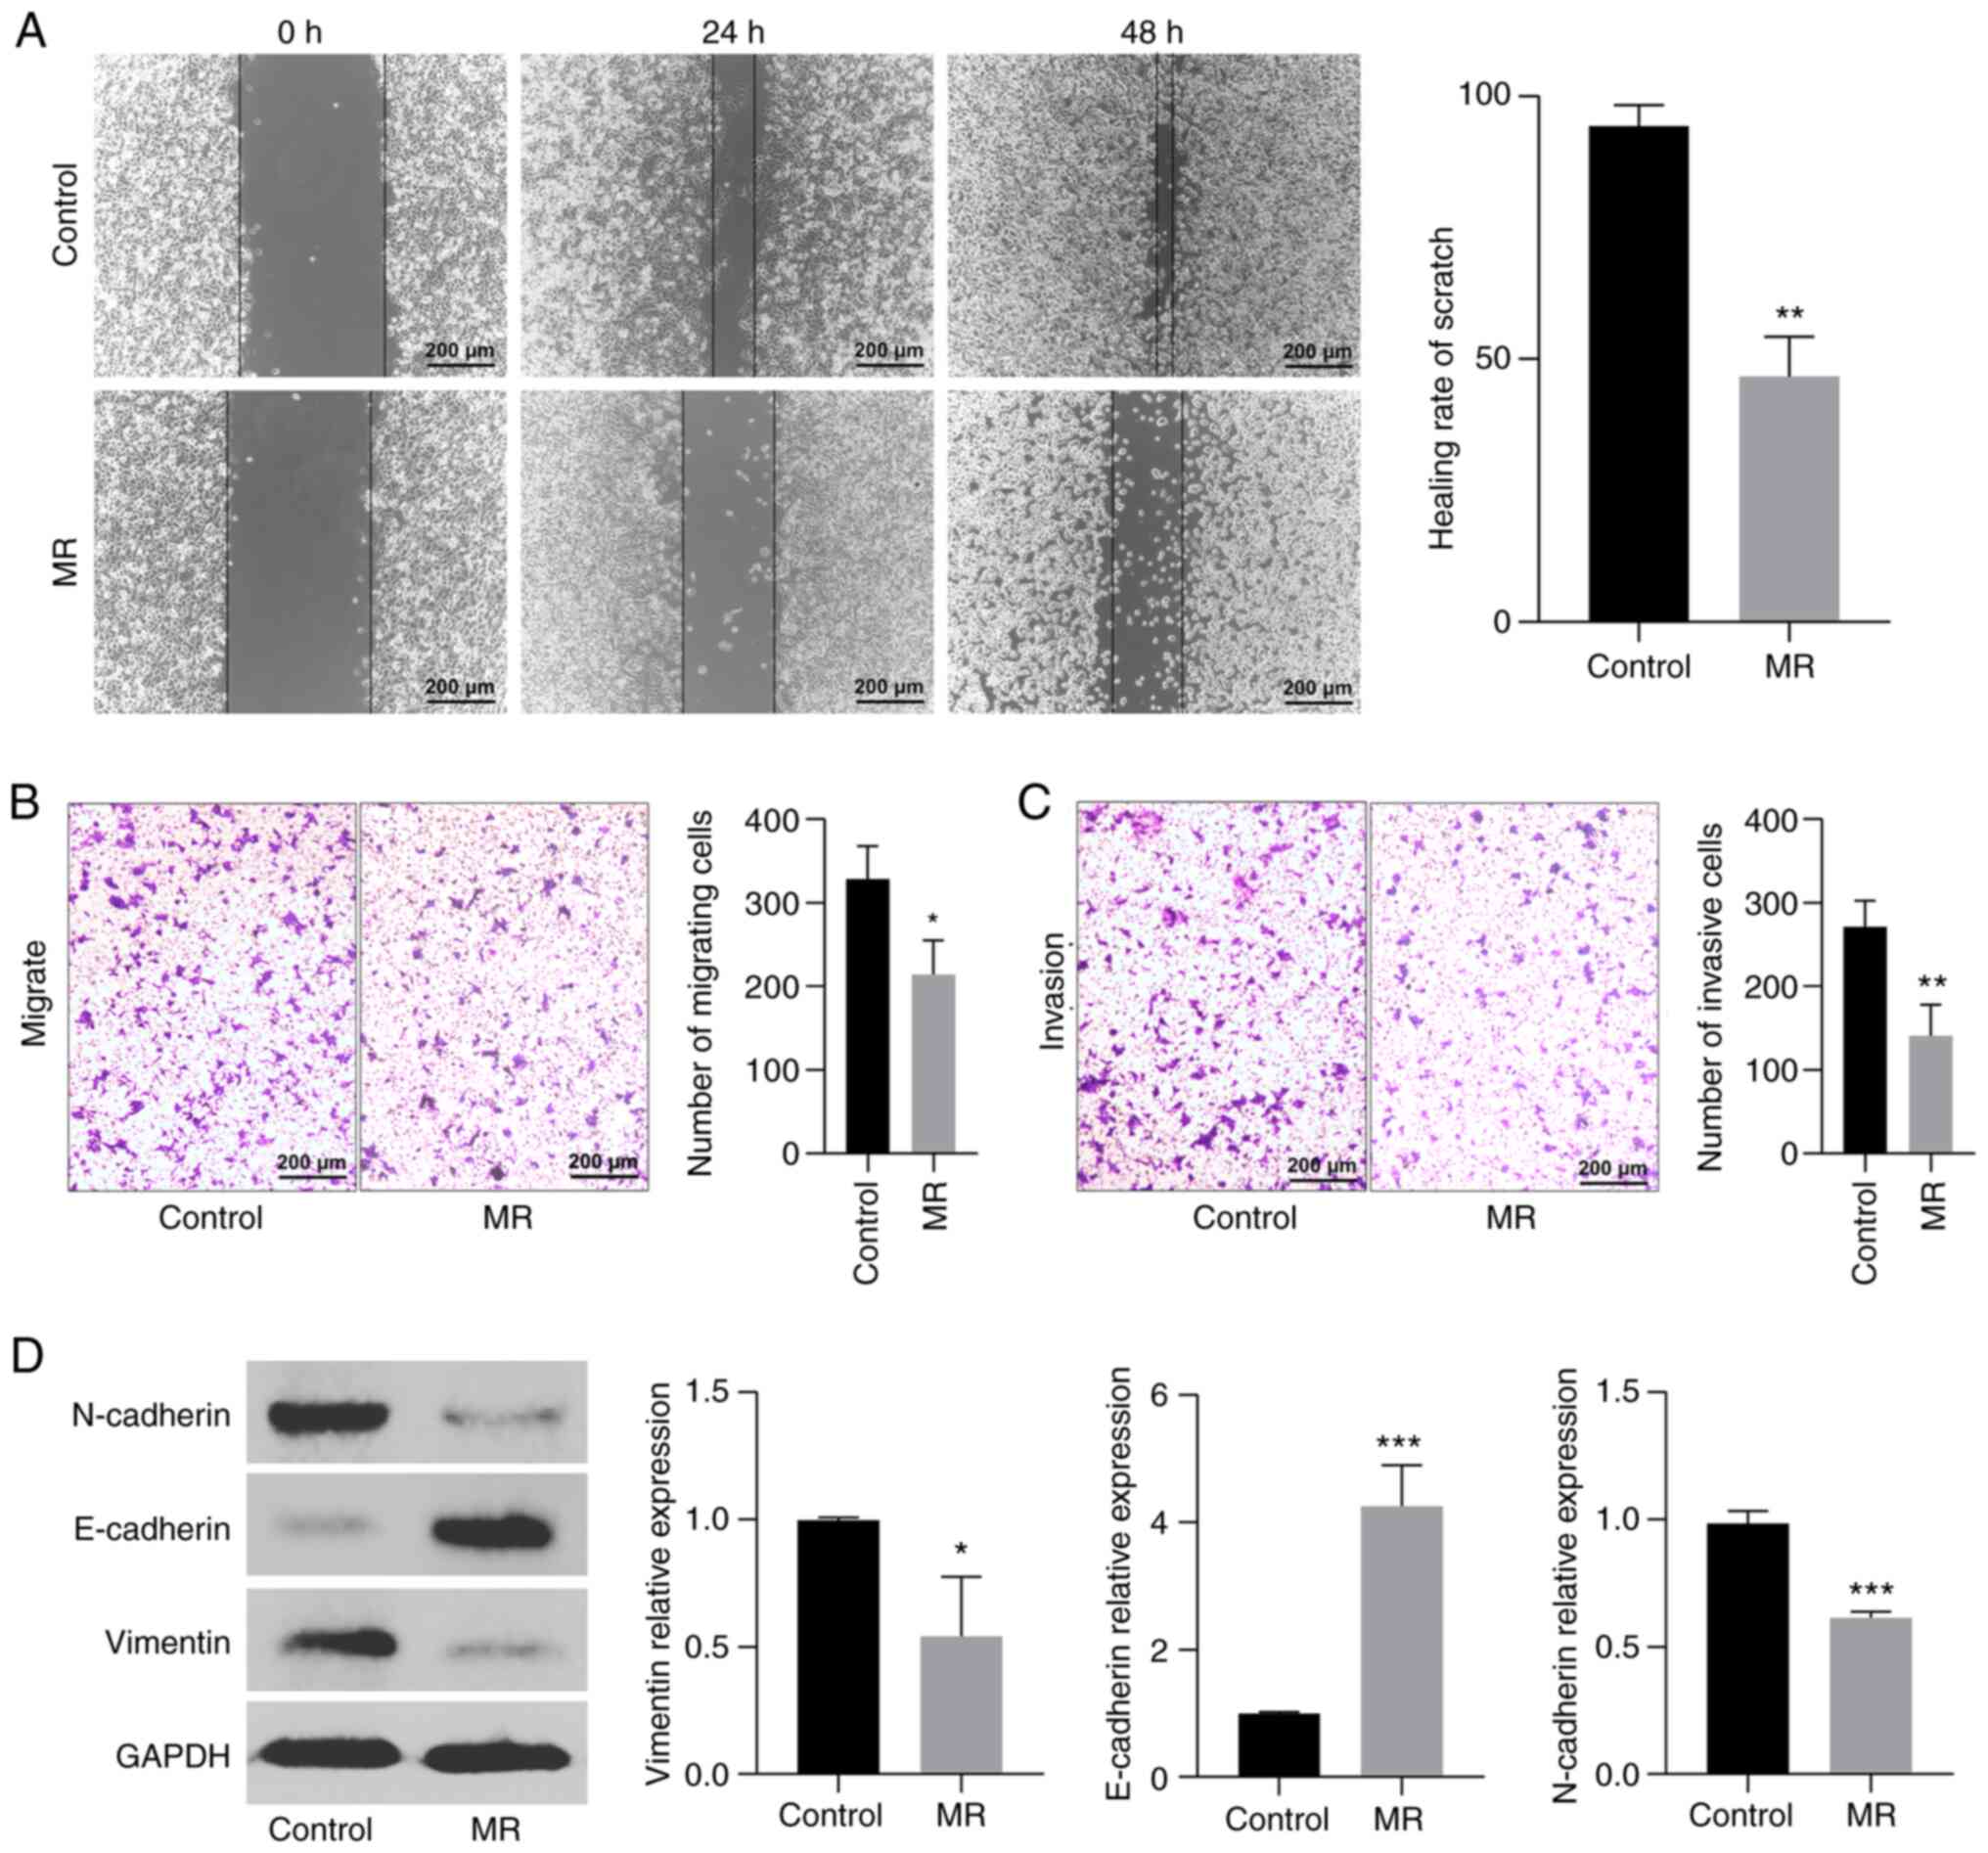
Effect of MR on colon cancer cell
invasion and migration
The cell scratch test can reflect the horizontal
migration ability of colon cancer cells and the results showed that
the horizontal migration ability of methionine-restricted cells is
lower than that of the control group (P<0.01; Fig. 7A). Similarly, in Transwell
experiments, MR can inhibit the vertical migration of colon cells
(P<0.05; Fig. 7B). In addition,
invasion experiments showed that MR caused a decrease in invasion
ability (P<0.01; Fig. 7C).
Finally, the expression of metastasis-related proteins was analyzed
(Fig. 7D). Following MR, the
expression of N-cadherin and vimentin decreased, while that of
E-cadherin increased, suggesting that MR inhibited colon cancer
metastasis (P<0.05).
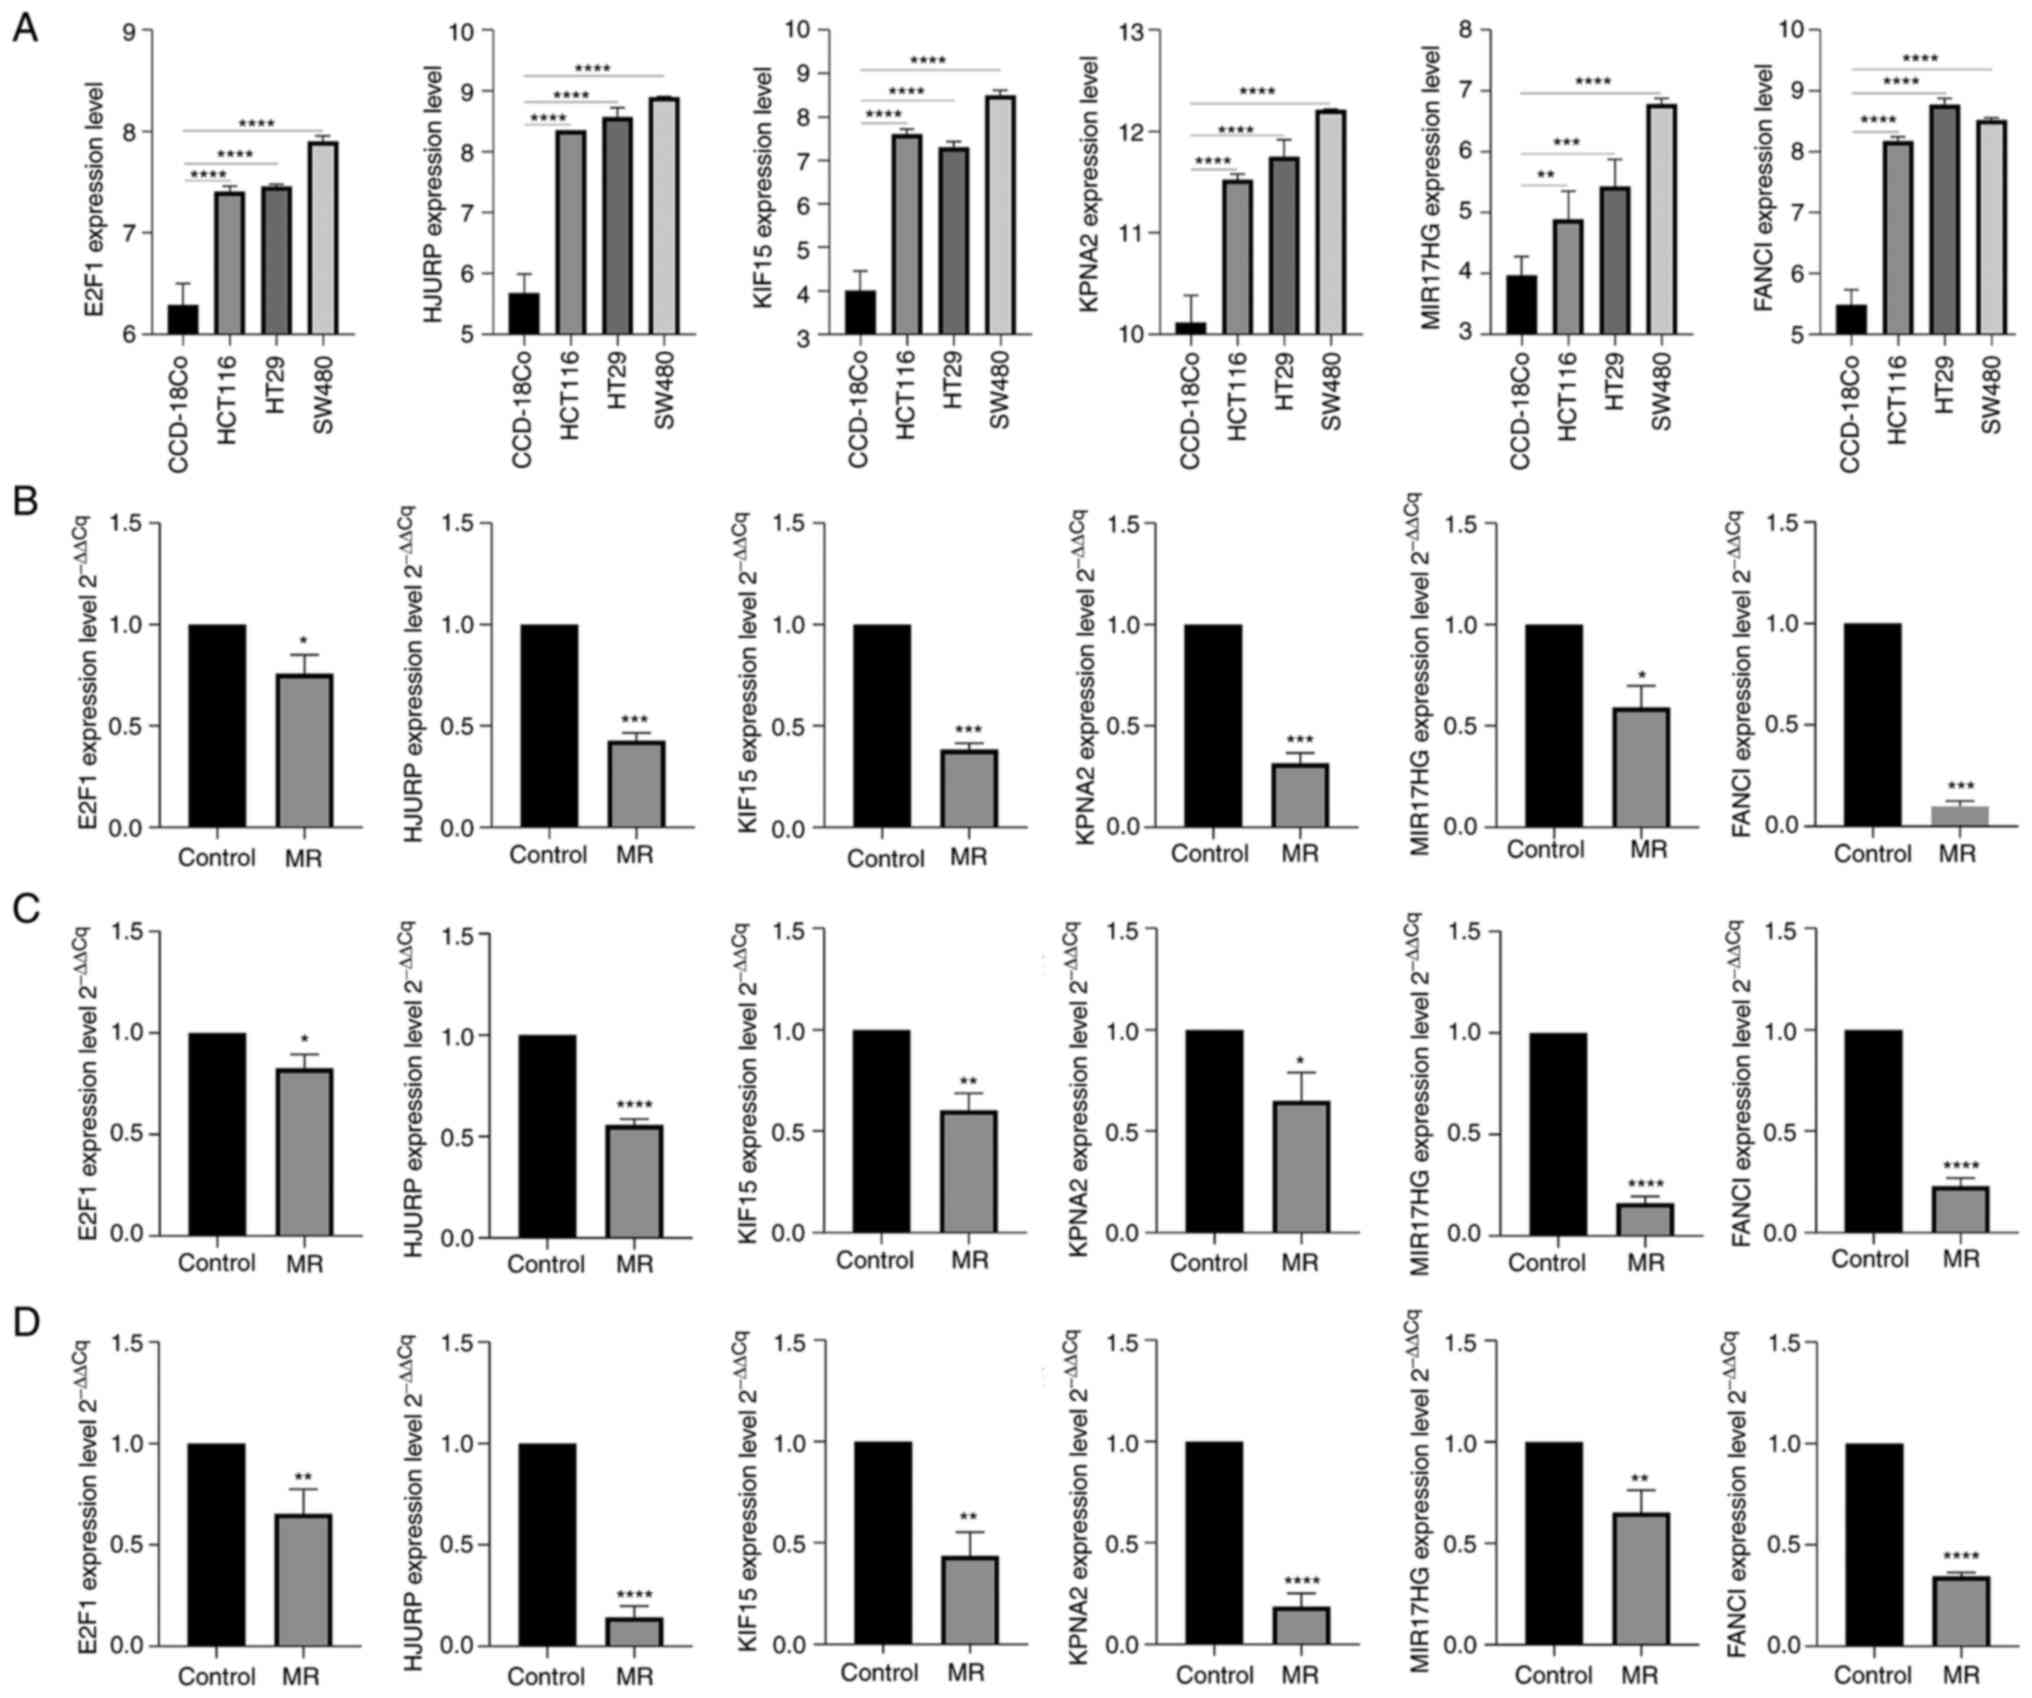
Verification of the expression of key
genes affected by MR
In the transcriptional regulatory network, the key
transcription factor E2F1 was identified. In the ceRNA network, it
was found that MIR17HG was the core lncRNA of the network. By
identifying candidate genes obtained from the key network of the
PPI network, combined with Lasso regression and multivariate Cox
regression, four independent prognostic genes (FANCI, KPNA2, KIF15
and HJURP) were identified. Gene expression changes in HCT116, HT29
and SW480 colon cancer cell lines were compared with those in
CCD-18Co normal colon fibroblasts (Fig. 8A). The results showed that the
expression of E2F1, FANCI, HJURP, KPNA2 and KIF15, MIR17HG was
significantly increased in colon cancer (P<0.01). Next, RT-qPCR
was performed to verify the expression of these six genes following
MR in HCT116, HT29 and SW480 colon cancer cell lines (Fig. 8B-D). The results showed that the
expression of the above six genes was significantly downregulated
following MR, which was consistent with our previous analysis in
two data sets (P<0.05).
Discussion
Colon cancer usually occurs at the junction of the
rectum and the sigmoid colon, mainly in individuals aged 40–50.
Modern society has brought significant changes in the diet and
living habits of individuals. Obesity, metabolic syndrome,
sedentary, physical inactivity and high-calorie diet have lowered
the age in which colon cancer occurs (13). Over 30 years ago, Halpern et
al (14) found that there is a
methionine-dependent metabolic phenotype in tumor cells. Studies on
colon cancer have shown that methionine supplements can stimulate
malignant changes in the intestinal tissues of mice. Hanley et
al (15) and Komninou et
al (16) successively found
that restricting methionine intake inhibited the progression of
colon cancer. At present, the drug that targets methionine is
methioninase, which can catalyze the α- and γ-cleavage reactions of
methionine to produce α-butyric acid, methyl mercaptan and ammonia.
Methioninase can cooperate with traditional chemotherapy drugs to
treat colon cancer and exert a improved therapeutic effect
(8,17,18).
The study of Machover et al (19) showed that the possible mechanism of
methioninase-induced tumor suppression is that it can decrease the
methylation level of proto-oncogene cyclin-dependent kinase
inhibitor 2A and increase its expression. The present study
explored the effect of MR on colon cancer cells. The results showed
that MR could inhibit the proliferation, metastasis and invasion of
colon cancer cells and promote their apoptosis, which also reflects
the methionine-dependent phenotype of colon cancer cells.
Methionine restriction is a promising means of
cancer suppression, but there are few reports on the analysis of
the potential mechanism of methionine inhibiting colon cancer
growth. Using public data, the genes that may be regulated by MR
were analyzed and enrichment analysis was performed on these genes.
Among the upregulated genes, the focus was placed on MAPK
phosphatase activity and protein tyrosine/threonine phosphatase
activity. The MAPK cascade is a signal transduction component that
serves a key role in converting extracellular stimuli into cellular
responses through the phosphorylation of different substrates. The
MAPK signaling pathway controls various cellular processes, such as
growth, differentiation, proliferation, survival and death. The
activation of this signal depends on the simultaneous
phosphorylation of both threonine (T) and tyrosine (Y) sites
(20). To study methionine on MAPK
signaling, Xin et al (21)
used proteomics methods and found that the expression of p38
increased following MR in gastric cancer. P38 is inseparable from
the oncogene-induced senescence of tumor cells and can also serve a
tumor suppressor role (20). Some
of the downregulated genes of MR were enriched in glycolysis
process, ATPase activity and drug metabolism. There are differences
in energy metabolism between tumor and normal cells, and tumor
cells can preferentially produce a large amount of lactic acid
through aerobic glycolysis to obtain the required energy. By
inhibiting the energy production of tumor cells, this approach can
play an effective anti-tumor effect. In gastric cancer, MR is found
to reduce the activity of aerobic glycolysis and induce tumor cell
apoptosis (22). The reduction in
tumor productivity leads to the inactivation of a number of ATPases
and drug metabolism depends on a variety of ATP-dependent transport
enzymes (23). Among them, P-gp
glycoprotein serves an important role in tumor resistance and it
uses ATP to supply energy to metabolize cell-energy drugs (23). Xin et al (24) found that MR induces the
downregulation of the expression of resistance-related protein
P-gp, which enhances the drug sensitivity of gastric cancer.
Based on bioinformatics analysis, MR was found to
affect the important transcription factor E2F1 and the key lncRNA
MIR17HG. In addition, four independent prognostic genes of colon
cancer regulated by MR were identified based on Lasso and
multivariate Cox regression, among which FANCI and HJURP can be
considered as risk genes. E2F1 is a member of the E2F transcription
factor family, which can bind to DNA with dimer partner protein
through the E2 recognition site 5′-TTTC[CG]CGC-3′ found in the
promoter region of various genes. E2F1 is directly involved in
several types of cancer with poor prognosis and has been shown to
be a key cancer biomarker (25).
E2F1 not only promotes the proliferation and metastasis of rectal
cancer, but also contributes to aerobic glycolysis,
repressurization and oxidative metabolism and promotes anabolic
metabolism (26). MIR17HG is an
miR-17-92 cluster host gene lncRNA, which participates in cell
proliferation and growth by regulating the cell growth phenotype.
Studies on cervical cancer, non-small cell carcinoma and
osteosarcoma have shown that MIR17HG acts as an oncogene in tumors,
inhibiting its expression, resulting in tumor cell proliferation,
metastasis and drug resistance (27–29).
The study by Xu et al (30)
on colon cancer showed that MIR17HG is closely associated with
tumor immunity. First, it competitively sponges miR-375, thereby
increasing the expression of nuclear factor κB/V-Rel Avian
reticuloendotheliosis viral oncogene homolog A and then
upregulating programmed death receptor 1, RELA can also directly
bind to the MIR17HG promoter region to form a positive feedback
loop to activate MIR17HG transcription.
The FANCI gene serves a key role in maintaining
chromosome stability and repairing DNA double-strand breaks by
homologous recombination. It repairs inter-strand DNA crosslinks
through homologous recombination and induces FANCL to promote
Fanconi anemia, complementation group D2 monoubiquitination and
participates in the recruitment of DNA repair sites (31). HJURP is a histone chaperone
involved in the recruitment of de novo histone H3 variants
CenH3 (CENP-A) and CENP-C in nucleosomes, which can regulate the
amplification of centromeric chromatin and chromosomal stability
(32). HJURP has been confirmed as
a key prognostic gene in breast cancer, hepatocellular carcinoma,
advanced serous ovarian cancer, colon cancer and prostate cancer
(33–37). Studies have shown that HJURP
promotes tumor cell proliferation (38). For example, Wang et al
(38) showed that HJURP activates
Mouse Double Minute 2 homolog transcription by regulating the
recruitment of H3K4me2 in its promoter region to inhibit the
expression of p53 and promote pancreatic cancer cell proliferation.
Chen et al (39) found that
HJURP destabilizes p21 through MAPK/ERK1/2 and protein kinase
B/glycogen synthase kinase-3β pathways, thereby regulating nuclear
cytoplasmic translocation and ubiquitin-mediated p21 degradation
and promoting tumor cell proliferation. In addition, studies have
shown that HJURP can promote epithelial-mesenchymal transition of
tumor cells by regulating the Wnt/β-catenin pathway and Sphingosine
kinase 1 (40,41). In addition, studies by Cao et
al (42) and Yuan et al
(43) successively confirmed that
HJURP affects the oxidative stress and cell cycle arrest of tumor
cells by regulating the peroxisome proliferator-activated receptor
γ-sirtuin 1 feedback loop. In the present study, it was confirmed
that E2F1, MIR17HG, FANCI and HJURP are highly expressed in colon
cancer tissues. In addition, six hub genes expression decreased
significantly following MR, suggesting that MR may exert a tumor
suppressing effect through the above pathways.
In conclusion, it was verified in vitro that
MR inhibits the proliferation, metastasis and invasion of colon
cancer. Using bioinformatics, the potential molecular biological
mechanisms affecting the progression of colon cancer were analyzed
and the key target genes regulated by MR were identified. However,
there are still some defects in this study, including: The
mechanism by which MR regulates the expression of crucial genes is
not yet clear and the mechanisms by which these genes influence
colon cancer progression remain to be elucidated. Addressing these
deficiencies will be the focus of future research work.
Supplementary Material
Supporting Data
Acknowledgements
Not applicable.
Funding
The present study was supported by the special clinical research
project of the Second Affiliated Hospital of Nanchang University
(grant no. 2019YNLZ12002), Natural Science Foundation of Jiangxi
Province (grant no. 20192BAB205079) and General Science and
Technology Program of Jiangxi Provincial Health Commission (grant
no. 20165292).
Availability of data and materials
The datasets used and/or analyzed during the current
study are available from the corresponding author on reasonable
request.
Authors' contributions
LZ performed the bioinformatics analysis and wrote
the manuscript; ZC performed the experiments and data analysis; CL
designed the entire project, supervised and supported the
completion of the work, and made revisions to the manuscript and
approved for publication. LZ and CL confirm the authenticity of all
the raw data. All authors reviewed and approved the final
manuscript.
Ethics approval and consent to
participate
Not applicable.
Patient consent for publication
Not applicable.
Competing interests
The authors declare that they have no competing
interests.
References
|
1
|
Siegel RL, Miller KD, Fuchs HE and Jemal
A: Cancer statistics, 2021. CA Cancer J Clin. 71:7–33. 2021.
View Article : Google Scholar : PubMed/NCBI
|
|
2
|
Wu XD, Zeng YY, Wu XJ and Qin HY: The
prevalence and correlates of prehospital delay and health belief in
chinese patients with colorectal cancer. Gastroenterol Nurs.
43:186–195. 2020.PubMed/NCBI
|
|
3
|
Mobley LR and Kuo TM: Demographic
disparities in late-stage diagnosis of breast and colorectal
cancers across the USA. J Racial Ethn Health Disparities.
4:201–212. 2017. View Article : Google Scholar : PubMed/NCBI
|
|
4
|
Vander Heiden MG and DeBerardinis RJ:
Understanding the intersections between metabolism and cancer
biology. Cell. 168:657–669. 2017. View Article : Google Scholar : PubMed/NCBI
|
|
5
|
Graziosi L, Mencarelli A, Renga B, D'Amore
C, Bruno A, Santorelli C, Cavazzoni E, Cantarella F, Rosati E,
Donini A and Fiorucci S: Epigenetic modulation by methionine
deficiency attenuates the potential for gastric cancer cell
dissemination. J Gastrointest Surg. 17:39–49. 2013. View Article : Google Scholar : PubMed/NCBI
|
|
6
|
Cavuoto P and Fenech MF: A review of
methionine dependency and the role of methionine restriction in
cancer growth control and life-span extension. Cancer Treat Rev.
38:726–736. 2012. View Article : Google Scholar : PubMed/NCBI
|
|
7
|
Epner DE, Morrow S, Wilcox M and Houghton
JL: Nutrient intake and nutritional indexes in adults with
metastatic cancer on a phase I clinical trial of dietary methionine
restriction. Nutr Cancer. 42:158–166. 2002. View Article : Google Scholar : PubMed/NCBI
|
|
8
|
Gao X, Sanderson SM, Dai Z, Reid MA,
Cooper DE, Lu M, Richie JP Jr, Ciccarella A, Calcagnotto A, Mikhael
PG, et al: Dietary methionine influences therapy in mouse cancer
models and alters human metabolism. Nature. 572:397–401. 2019.
View Article : Google Scholar : PubMed/NCBI
|
|
9
|
Ritchie ME, Phipson B, Wu D, Hu Y, Law CW,
Shi W and Smyth GK: limma powers differential expression analyses
for RNA-sequencing and microarray studies. Nucleic Acids Res.
43:e472015. View Article : Google Scholar : PubMed/NCBI
|
|
10
|
Huang D, Sherman B, Tan Q, Collins JR,
Alvord WG, Roayaei J, Stephens R, Baseler MW, Lane HC and Lempicki
RA: The DAVID gene functional classification tool: A novel
biological module-centric algorithm to functionally analyze large
gene lists. Genome Biol. 8:R1832007. View Article : Google Scholar : PubMed/NCBI
|
|
11
|
Jeggari A, Marks DS and Larsson E:
miRcode: A map of putative microRNA target sites in the long
non-coding transcriptome. Bioinformatics. 28:2062–2063. 2012.
View Article : Google Scholar : PubMed/NCBI
|
|
12
|
Livak KJ and Schmittgen TD: Analysis of
relative gene expression data using real-time quantitative PCR and
the 2(−Delta Delta C(T)) method. Methods. 25:402–408. 2001.
View Article : Google Scholar : PubMed/NCBI
|
|
13
|
Mármol I, Sanchez-de-Diego C, Pradilla
Dieste A, Cerrada E and Rodriguez Yoldi MJ: Colorectal Carcinoma: A
general overview and future perspectives in colorectal cancer. Int
J Mol Sci. 18:1972017. View Article : Google Scholar : PubMed/NCBI
|
|
14
|
Halpern BC, Ezzell R, Hardy DN, Clark BR,
Ashe H, Halpern RM and Smith RA: Effect of methionine replacement
by homocystine in cultures containing both malignant rat breast
carcinosarcoma (Walker-256) cells and normal adult rat liver
fibroblasts. In Vitro. 11:14–19. 1975. View Article : Google Scholar : PubMed/NCBI
|
|
15
|
Hanley MP, Kadaveru K, Perret C, Giardina
C and Rosenberg DW: Dietary methyl donor depletion suppresses
intestinal adenoma development. Cancer Prev Res. 9:812–820. 2016.
View Article : Google Scholar : PubMed/NCBI
|
|
16
|
Komninou D, Leutzinger Y, Reddy B and
Richie JP Jr: Methionine restriction inhibits colon carcinogenesis.
Nutr Cancer. 54:202–208. 2006. View Article : Google Scholar : PubMed/NCBI
|
|
17
|
Park JH, Han Q, Zhao M, Tan Y, Higuchi T,
Yoon SN, Sugisawa N, Yamamoto J, Bouvet M, Clary B, et al: Oral
recombinant methioninase combined with oxaliplatinum and
5-fluorouracil regressed a colon cancer growing on the peritoneal
surface in a patient-derived orthotopic xenograft mouse model.
Tissue Cell. 61:109–114. 2019. View Article : Google Scholar : PubMed/NCBI
|
|
18
|
Park JH, Zhao M, Han Q, Sun Y, Higuchi T,
Sugisawa N, Yamamoto J, Singh SR, Clary B, Bouvet M and Hoffman RM:
Efficacy of oral recombinant methioninase combined with
oxaliplatinum and 5-fluorouracil on primary colon cancer in a
patient-derived orthotopic xenograft mouse model. Biochem Biophys
Res Comm. 518:306–310. 2019. View Article : Google Scholar : PubMed/NCBI
|
|
19
|
Machover D, Rossi L, Hamelin J, Desterke
C, Goldschmidt E, Chadefaux-Vekemans B, Bonnarme P, Briozzo P,
Kopečný D, Pierigè F, et al: Effects in cancer cells of the
recombinant l-methionine gamma-lyase from brevibacterium
aurantiacum. Encapsulation in human erythrocytes for sustained
l-methionine elimination. J Pharmacol Exp Ther. 369:489–502. 2019.
View Article : Google Scholar : PubMed/NCBI
|
|
20
|
Cuadrado A and Nebreda AR: Mechanisms and
functions of p38 MAPK signalling. Biochem J. 429:403–417. 2010.
View Article : Google Scholar : PubMed/NCBI
|
|
21
|
Xin L, Cao WX, Fei XF, Wang Y, Liu WT, Liu
BY and Zhu ZG: Applying proteomic methodologies to analyze the
effect of methionine restriction on proliferation of human gastric
cancer SGC7901 cells. Clin Chim Acta. 377:206–212. 2007. View Article : Google Scholar : PubMed/NCBI
|
|
22
|
Zhou L, Li S, Liu L, Zhou Q, Yuan Y and
Xin L: Recombinant methioninase regulates PI3K/Akt/Glut-1 pathway
and inhibits aerobic glycolysis to promote apoptosis of gastric
cancer cells. Nan Fang Yi Ke Da Xue Xue Bao. 40:27–33. 2020.(In
Chinese). PubMed/NCBI
|
|
23
|
Robey RW, Pluchino KM, Hall MD, Fojo AT,
Bates SE and Gottesman MM: Revisiting the role of ABC transporters
in multidrug-resistant cancer. Nat Rev. 18:452–464. 2018.
View Article : Google Scholar : PubMed/NCBI
|
|
24
|
Xin L, Yang WF, Zhang HT, Li YF and Liu C:
The mechanism study of lentiviral vector carrying methioninase
enhances the sensitivity of drug-resistant gastric cancer cells to
Cisplatin. Br J Cancer. 118:1189–1199. 2018. View Article : Google Scholar : PubMed/NCBI
|
|
25
|
Stanelle J, Stiewe T, Theseling CC, Peter
M and Pützer BM: Gene expression changes in response to E2F1
activation. Nucleic Acids Res. 30:1859–1867. 2002. View Article : Google Scholar : PubMed/NCBI
|
|
26
|
Fang Z, Lin M, Li C, Liu H and Gong C: A
comprehensive review of the roles of E2F1 in colon cancer. Am J
Cancer Res. 10:757–768. 2020.PubMed/NCBI
|
|
27
|
Liu H, Zhu C, Xu Z, Wang J, Qian L, Zhou
Q, Shen Z, Zhao W, Xiao W, Chen L and Zhou Y: lncRNA PART1 and
MIR17HG as ΔNp63α direct targets regulate tumor progression of
cervical squamous cell carcinoma. Cancer Sci. 111:4129–4141. 2020.
View Article : Google Scholar : PubMed/NCBI
|
|
28
|
Wei S, Liu J, Li X and Liu X: LncRNA
MIR17HG inhibits non-small cell lung cancer by upregulating
miR-142-3p to downregulate Bach-1. BMC Pulm Med. 20:782020.
View Article : Google Scholar : PubMed/NCBI
|
|
29
|
Meng Y, Hao D, Huang Y, Jia S, Zhang J, He
X, Sun L and Liu D: Positive feedback loop SP1/MIR17HG/miR-130a-3p
promotes osteosarcoma proliferation and cisplatin resistance.
Biochem Biophys Res Comm. 521:739–745. 2020. View Article : Google Scholar : PubMed/NCBI
|
|
30
|
Xu J, Meng Q, Li X, Yang H, Xu J, Gao N,
Sun H, Wu S, Familiari G, Relucenti M, et al: Long noncoding RNA
MIR17HG promotes colorectal cancer progression via miR-17-5p.
Cancer Res. 79:4882–4895. 2019. View Article : Google Scholar : PubMed/NCBI
|
|
31
|
Zheng P and Li L: FANCI cooperates with
IMPDH2 to promote lung adenocarcinoma tumor growth via a
MEK/ERK/MMPs pathway. OncoTargets Ther. 13:451–463. 2020.
View Article : Google Scholar : PubMed/NCBI
|
|
32
|
Kato T, Sato N, Hayama S, Yamabuki T, Ito
T, Miyamoto M, Kondo S, Nakamura Y and Daigo Y: Activation of
holliday junction recognizing protein involved in the chromosomal
stability and immortality of cancer cells. Cancer Res.
67:8544–8553. 2007. View Article : Google Scholar : PubMed/NCBI
|
|
33
|
Hu Z, Huang G, Sadanandam A, Gu S, Lenburg
ME, Pai M, Bayani N, Blakely EA, Gray JW and Mao JH: The expression
level of HJURP has an independent prognostic impact and predicts
the sensitivity to radiotherapy in breast cancer. Breast Cancer
Res. 12:R182010. View Article : Google Scholar : PubMed/NCBI
|
|
34
|
Hu B, Wang Q, Wang Y, Chen J, Li P and Han
M: Holliday junction-recognizing protein promotes cell
proliferation and correlates with unfavorable clinical outcome of
hepatocellular carcinoma. Onco Targets Ther. 10:2601–2607. 2017.
View Article : Google Scholar : PubMed/NCBI
|
|
35
|
Li L, Li X, Meng Q, Khan AQ and Chen X:
Increased expression of holliday junction-recognizing protein
(HJURP) as an independent prognostic biomarker in advanced-stage
serous ovarian carcinoma. Med Sci Monit. 24:3050–3055. 2018.
View Article : Google Scholar : PubMed/NCBI
|
|
36
|
Kang DH, Woo J, Kim H, Kim SY, Ji S,
Jaygal G, Ahn TS, Kim HJ, Kwak HJ, Kim CJ, et al: Prognostic
relevance of HJURP expression in patients with surgically resected
colorectal cancer. Int J Mol Sci. 21:79282020. View Article : Google Scholar : PubMed/NCBI
|
|
37
|
Chen YF, Liang YX, Yang JA, Yuan DZ, Li J,
Zheng SS, Wan YP, Wang B, Han ZD and Zhong WD: Upregulation of
holliday junction recognition protein predicts poor prognosis and
biochemical recurrence in patients with prostate cancer. Oncol
Lett. 18:6697–6703. 2019.PubMed/NCBI
|
|
38
|
Wang CJ, Li X, Shi P, Ding HY, Liu YP, Li
T, Lin PP, Wang YS, Zhang GQ and Cao Y: Holliday junction
recognition protein promotes pancreatic cancer growth and
metastasis via modulation of the MDM2/p53 signaling. Cell Death
Dis. 11:3862020. View Article : Google Scholar : PubMed/NCBI
|
|
39
|
Chen T, Huang H, Zhou Y, Geng L, Shen T,
Yin S, Zhou L and Zheng S: HJURP promotes hepatocellular carcinoma
proliferation by destabilizing p21 via the MAPK/ERK1/2 and
AKT/GSK3β signaling pathways. J Exp Clin Cancer Res. 37:1932018.
View Article : Google Scholar : PubMed/NCBI
|
|
40
|
Wei Y, Ouyang GL, Yao WX, Zhu YJ, Li X,
Huang LX, Yang XW and Jiang WJ: Knockdown of HJURP inhibits
non-small cell lung cancer cell proliferation, migration, and
invasion by repressing Wnt/β-catenin signaling. Eur Rev Med
Pharmacol Sci. 23:3847–3856. 2019.PubMed/NCBI
|
|
41
|
Chen T, Zhou L, Zhou Y, Zhou W, Huang H,
Yin S, Xie H, Zhou L and Zheng S: HJURP promotes
epithelial-to-mesenchymal transition via upregulating SPHK1 in
hepatocellular carcinoma. Int J Biol Sci. 15:1139–1147. 2019.
View Article : Google Scholar : PubMed/NCBI
|
|
42
|
Cao R, Wang G, Qian K, Chen L, Qian G, Xie
C, Dan HC, Jiang W, Wu M, Wu CL, et al: Silencing of HJURP induces
dysregulation of cell cycle and ROS metabolism in bladder cancer
cells via PPARγ-SIRT1 feedback loop. J Cancer. 8:2282–2295. 2017.
View Article : Google Scholar : PubMed/NCBI
|
|
43
|
Yuan JS, Chen ZS, Wang K and Zhang ZL:
Holliday junction-recognition protein modulates apoptosis, cell
cycle arrest and reactive oxygen species stress in human renal cell
carcinoma. Oncol Rep. 44:1246–1254. 2020. View Article : Google Scholar : PubMed/NCBI
|