Introduction
Breast cancer (BC) is the most common malignant
tumor and ranks as the second leading cause of cancer-related
mortality in women, which poses a considerable threat to their
health globally (1,2). BC can be subdivided into four
molecular subtypes: i) Luminal A, defined as estrogen receptor (ER)
and/or progesterone receptor (PR) positive (+) and human epidermal
growth factor receptor-2 (HER2) negative (−); ii) luminal B (ER+
and/or PR+ and HER2+); iii) basal-like (ER-, PR-, HER2-,
cytokeratin 5/6+ and EGFR+); and iv) HER2-overexpressing subtypes
(ER-, PR- and HER2+) (3). The
early treatment methods for BC are surgery, chemotherapy, endocrine
therapy and radiation therapy, which have improve the outcome of
this disease (4,5). The classical clinical prognostic
biomarkers, including the ER, PR and HER2 status, continue to serve
a significant role in the identification of patients who may
benefit from endocrine or targeted therapy (5). Although the management strategies of
BC have improved rapidly over the past few decades, including the
early diagnostic and effective therapeutic approaches, metastasis
remains a major cause of poor prognosis in patients with BC
(6). Due to tumor heterogeneity,
available biomarkers that can be used to accurately predict BC
prognosis remain limited. Therefore, there is a demand for the
exploration of novel effective biomarkers as prognostic indicators
and for designing individualized treatments.
C-type lectin domain family 10 member A (CLEC10A) is
a member of the C-type lectin receptor (CLR) family and is also
named macrophage galactose type C-type lectin (7). Similar to other members of the CLR
family, CLEC10A has been reported to be involved in increasing
antigen-specific CD8 T-cell activation (7). In addition,
galactose/N-acetylgalactosamine (Tn antigen) was recognized by the
carbohydrate recognition domain of CLEC10A, which is associated
with tumors, rendering it one of the most effective antigen
presentation proteins expressed on CD4 T cells to facilitate immune
responses and significantly promote antigen-specific CD8 T-cell
activation (7,8). Tumor-specific CD8 and CD4 T cells are
required for effective tumor eradication (9). The ability of CLEC10A in promoting
the antitumor activity of immune cells has been garnering attention
(10,11), where it was proposed to be a target
for cancer immunotherapy (8).
Lower expression levels of CLEC10A in lung cancer have been
reported to be associated with poorer clinical prognosis (12). Furthermore, a previous study based
on artificial intelligence algorithms revealed that CLEC10A can be
applied as prognostic biomarkers for BC (13). However, the clinical significance
and biological function of CLEC10A in BC remain unclear.
In the present study, a comprehensive analysis of
the association between CLEC10A expression and the risk of BC
progression was performed using The Cancer Genome Atlas (TCGA)
database. Reverse transcription-quantitative (RT-q)PCR was also
performed to validate the results of this analysis. Furthermore,
the association between CLEC10A expression levels and alterations
in the tumor immune microenvironment was assessed.
Materials and methods
RNA-sequencing data and bioinformatics
analysis
Normalized RNA-seq data and corresponding clinical
characteristics were collected from the TCGA-breast invasive
carcinoma (TCGA-BRCA) datasets (https://tcga.xenahubs.net). A total of 1,109 BC
tissues and 113 healthy breast tissues were obtained. The
downloaded data format was level 3 HTSeq-fragments per kilobase per
million (FPKM) for subsequent analysis. The XIANTAO platform
(www.xiantao.love) was used to conduct a paired
comparison between CLEC10A expression in BC and case-matched
adjacent benign tissues obtained from the TCGA database.
Tumor Immune Estimation Resource
database analysis
The TIMER database (TIMER 2.0; http://cistrome.shinyapps.io/timer/) is
a comprehensive resource for the analysis of gene expression and
tumor-infiltrating immune cells across multiple cancer types
(14). The TIMER website was
utilized to analyze the differential expression levels of CLEC10A
in tumor and normal tissues. In addition, the association between
CLEC10A and the infiltration of various immune cell types into
tumors and the expression of molecular markers of immune cell types
was investigated using TIMER.
University of Alabama at Birmingham
Cancer (UALCAN) data analysis portal
The UALCAN data analysis portal (http://ualcan.path.uab.edu/index.html)
is available for the online analysis of the differential gene
expression in cancer and normal tissues based on the TCGA-RNA
sequencing datasets and clinical datasets (15). In addition, this website provides
survival prognostic data based on the gene expression differences
in 31 cancer types (15). The
present study used the UALCAN database to validate the results
obtained from analysis using the XIANTAO database and to verify the
possible association between CLEC10A gene expression and clinical
features, including T stage, N stage, age, pathological stage, ER
status and HER2 status.
Clinical significance of CLEC10A
expression in BC
CLEC10A expression was compared between BC tumor and
para-cancerous tissues by receiver operating characteristic (ROC)
analysis to test the predictive value of CLEC10A expression for BC
diagnosis. The Kaplan-Meier (KM) plotter (http://kmplot.com/analysis/) is an open, intuitive
portal tool for prognostic analysis that can be used to assess the
relationship between CLEC10A expression levels and patient survival
(16). The patients with BC from
the TCGA-BRCA dataset were divided into the high and low CLEC10A
expression groups according to the median value. One-way Cox
survival analysis was performed and the results were visualized as
Forest plots using the ‘Forest plot’ R package (17). A prognostic analysis was performed
based on the CLEC10A expression levels in the relevant immune cell
subgroups using the TIMER database, where the hazard ratios, 95%
confidence intervals, P<0.05 and |log fold-change (FC)|>1
were set as the threshold values.
Immune infiltration analysis
The levels of tumor immune infiltration was
determined using the single sample gene set enrichment analysis
(ssGSEA) method with the ‘GSVA’ R package based on the TCGA-BRCA
datasets (18). Correlation
analysis between CLEC10A and infiltration by the immune cell types
was conducted by Spearman's rank correlation coefficient analysis.
Graphs and figures were generated using the ‘ggplot2’ R package
(19). The Tumor and Immune System
Interaction Database website (TISIDB; http://cis.Hku.hk/TISIDB/) was utilized to calculate
the correlation between CLEC10A expression and the relative number
of tumor-infiltrating lymphocytes (20). P-values were determined by Spearman
and Wilcoxon rank sum tests.
Cell lines and culture
Human BC cell lines MCF-7, SKBR-3 and MDA-MB-231 and
the normal breast epithelial cell line MCF10A were purchased from
The Cell Bank of Type Culture Collection of the Chinese Academy of
Sciences. SKBR-3, MCF-7 and MDA-MB-231 cells were routinely
cultured in DMEM (Gibco; Thermo Fisher Scientific, Inc.)
supplemented with 10% (v/v) fetal bovine serum (Gibco; Thermo
Fisher Scientific, Inc.) and a 1% (v/v) penicillin and streptomycin
solution (Beyotime Institute of Biotechnology). MCF10A cells were
cultured in mammary epithelial cell medium (Procell Life Science
& Technology Co., Ltd.) supplemented with 10% horse serum, EGF,
hydrocortisone, insulin and 1% penicillin-streptomycin. All cell
lines were cultured in an incubator at 37°C with 5% CO2
and passaged using standard cell culture techniques.
RT-qPCR
Total RNA of SKBR-3, MCF-7, MDA-MB-231 and MCF10A
cells was isolated using the RNAiso Plus Kit (cat. no. 9109; Takara
Biotechnology Co., Ltd.) according to the manufacturer's protocols.
A total of 1,000 ng mRNA was reverse transcribed into cDNA using
the PrimeScript™ RT Reagent Kit with the genomic DNA Eraser (cat.
no. RR047; Takara Biotechnology Co., Ltd.) according to the
manufacturer's protocols. Quantitative PCR (qPCR) analysis was
performed in the LightCycler® 96 Instrument (Roche
Diagnostics) using the TB Green Premix Ex Taq (cat. no. RR420;
Takara Biotechnology Co., Ltd.) to detect the expression of each of
the target genes. The following primer pairs were used for qPCR:
CLEC10A forward, 5′-GCCAGGTGGCTACTCTCAAC-3′ and reverse,
5′-TTCTGCTCCTCCCTGGAGTT-3′; and GAPDH forward,
5′-CATTGACCTCAACTACATGGTTT-3′ and reverse,
5′-GAAGATGGTGATGGGATTTCC-3′. The following thermocycling conditions
were used for qPCR: 95°C for 5 min, followed by 40 cycles of 95°C
for 10 sec and 60°C for 30 sec. The relative cycle threshold of the
housekeeping gene GAPDH was measured as an endogenous control and
the relative mRNA expression levels were normalized to those of
GAPDH using the standard 2−ΔΔCq method (21). The experiment was performed in
triplicate.
Statistical analysis
Bioinformatics analysis was performed in R version
3.6.3 (http://www.r-project.org/). The
association between clinical features and CLEC10A expression was
analyzed using the U Mann Whitney test, Wilcoxon signed-rank test,
Fisher's exact test, χ2 test and logistic regression. A
paired t-test was used to compare the differential expression
levels of CLEC10A between the BC tissues and the paired normal
tissues from TCGA database. Comparisons of CLEC10A expression
levels between normal breast epithelial cells and BC cells were
performed using one-way ANOVA followed by Dunnett's (comparing all
experimental groups with control group) post hoc test. ROC curve
analysis was applied, with the area under curve (AUC) used as the
index of diagnostic accuracy. Survival curves were generated using
the Kaplan-Meier plotter database. Spearman's correlation analysis
was utilized to evaluate the correlation between gene expression
and immune cell infiltration in the TIMER. The RT-qPCR data are
presented as the mean ± standard deviation, and each experiment was
repeated three times. P<0.05 was considered to indicate a
statistically significant difference.
Results
Aberrant downregulation of CLEC10A in
BC
To determine the overall expression levels of
CLEC10A in different malignancies, the CLEC10A expression profiles
were first analyzed among the different cancer types using the
TIMER database. The analysis indicated that the expression level of
CLEC10A was significantly downregulated in the majority of cancer
tissues, including BRCA, colon adenocarcinoma, rectum
adenocarcinoma, bladder urothelial carcinoma, head and neck
squamous cell carcinoma and kidney chromophobe, compared with that
in their corresponding normal tissues (Fig. 1A). To determine the expression
levels of CLEC10A in BC and normal tissues in further detail,
RNA-seq data and clinical information from 1109 BC tissues and 113
normal breast tissues were collected from the TCGA-BRCA datasets.
The expression levels of CLEC10A were found to be significantly
lower in BC tissues compared with those in the normal tissues
(P<0.001; Fig. 1B).
Subsequently, the CLEC10A expression levels in 112 BC tissues and
their matched adjacent normal tissues were also measured, which
showed that BC tissues expressed significantly lower levels of
CLEC10A compared with those of the normal tissues (P<0.001;
Fig. 1C). According to RT-qPCR
analysis, the expression level of CLEC10A in all three types of BC
cells tested was significantly lower (SKBR-3, MCF-7, MDA-MB-231)
compared with that of MCF10A cells (Fig. 1D), which is consistent with the
aforementioned results.
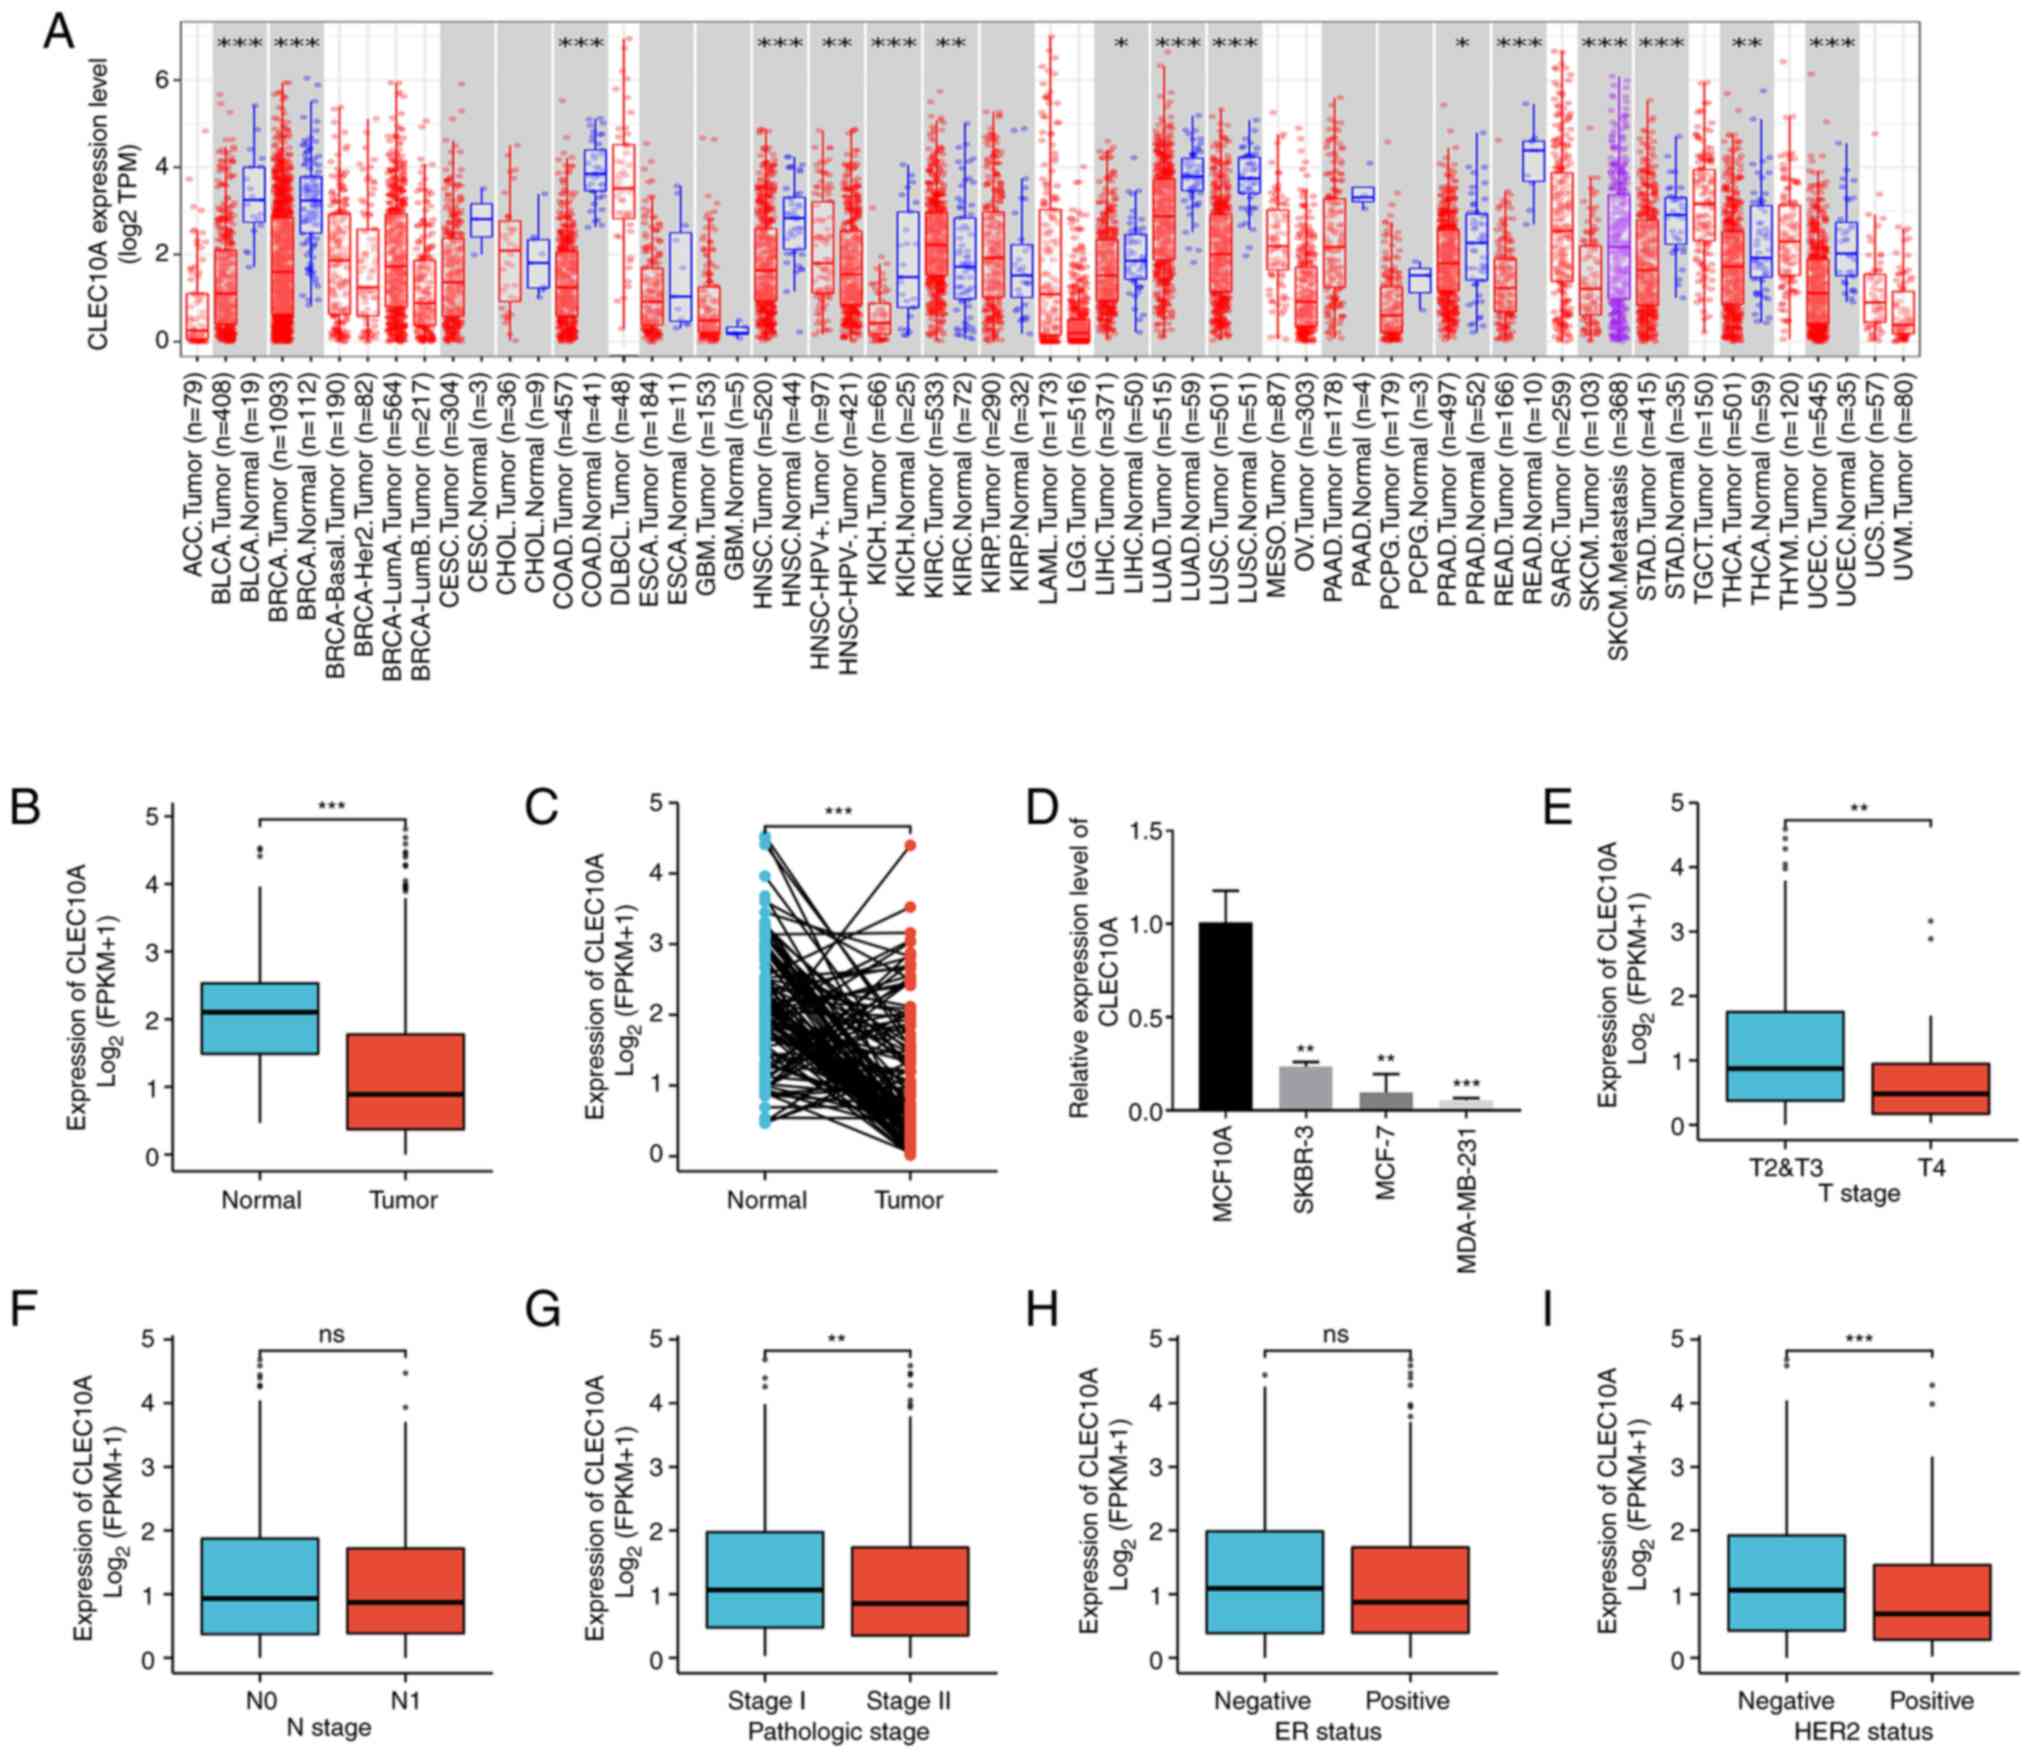 | Figure 1.Expression levels of the CLEC10A gene
in different cancers and their association with individual clinical
parameters of BC. (A) CLEC10A gene expression levels in different
cancer tissues compared with normal tissues in the Tumor IMmune
Estimation Resource database. (B) Difference in the CLEC10A gene
expression levels between primary BCs and unmatched normal samples
from the TCGA-BRCA data sets using Mann-Whitney U test. (C)
Difference in the CLEC10A gene expression levels between primary
BCs and matched normal samples from the TCGA-BRCA data sets using
Wilcoxon signed-rank test. (D) Reverse transcription-quantitative
PCR analysis of the mRNA expression levels of CLEC10A in normal
breast epithelial and breast cancer cell lines. Mann Whitney U test
of the association between CLEC10A gene expression from the
TCGA-BRCA datasets and (E) clinical T, (F) clinical N and (G)
pathological stages, (H) ER and (I) HER2 statuses. *P<0.05,
**P<0.01, ***P<0.001. ns, not significant; CLEC10A, C-type
lectin domain family 10 member A; BC, breast cancer; COAD, colon
adenocarcinoma; ACC, adrenocortical carcinoma; READ, rectum
adenocarcinoma; BLCA, bladder urothelial carcinoma; BRCA, breast
invasive carcinoma; CESC, cervical and endocervical cancer; CHOL,
cholangiocarcinoma; ESCA, esophageal carcinoma; GBM, glioblastoma
multiforme; HNSC, head and neck squamous cell carcinoma; KICH,
kidney chromophobe; KIRC, kidney renal clear cell carcinoma; KIRP,
kidney renal papillary cell carcinoma; LIHC, liver hepatocellular
carcinoma; LUAD, lung adenocarcinoma; UVM, uveal melanoma; SKCM,
skin cutaneous melanoma; LUSC, lung squamous cell carcinoma; PCPG,
pheochromocytoma and paraganglioma; PRAD, prostate adenocarcinoma;
STAD, stomach adenocarcinoma; THCA, thyroid carcinoma; UCEC,
uterine corpus; DLBCL, diffuse large B cell lymphoma; LAML, acute
myeloid leukemia; LGG, low-grade glioma; MESO, mesothelioma; OV,
ovarian cancer; PAAD, pancreatic adenocarcinoma; SARC, sarcoma;
TGCT, tenosynovial giant cell tumor; THYM, thymoma; UCS, uterine
carcinosarcoma; FPKM, fragments per kilobase of exon per million
mapped fragments; ER, estrogen receptor; HER2, human epidermal
growth factor receptor 2. |
In addition, the association between the
clinicopathological characteristics of BC and the expression of
CLEC10A was then analyzed using the Wilcoxon rank sum test. CLEC10A
expression level was higher for patients with T2&T3 (P<0.01;
Fig. 1E), pathological stage I
(P<0.01; Fig. 1G) and negative
HER2 status (P<0.001; Fig. 1I)
than in patients with T4, pathologic stage II and positive HER2
status, respectively. However, there was no significant association
with N stage or ER status (Fig. 1F and
H). This indicates that the expression of CLEC10A is associated
with disease malignancy degree in BC.
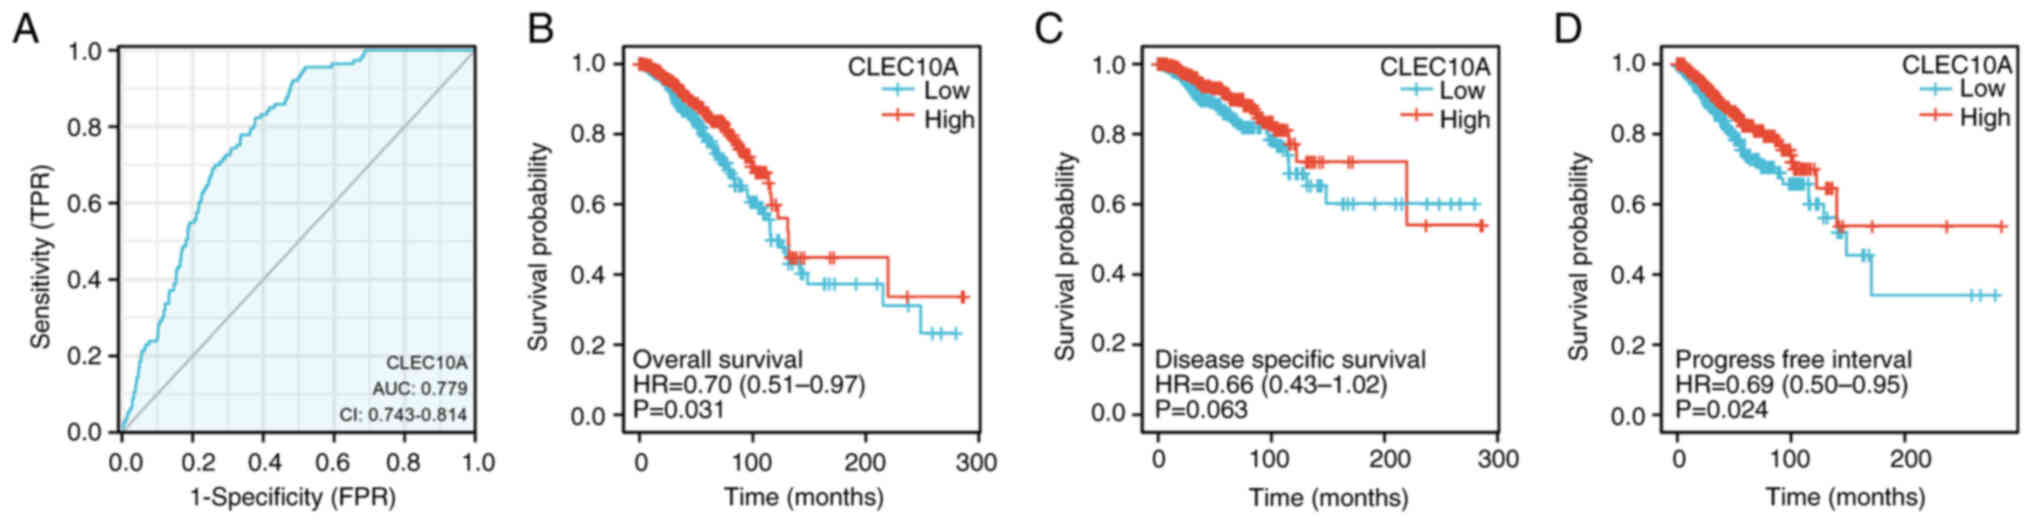
Predictive value of CLEC10A for BC
prognosis and in other cancers
To explore the potential clinical applicability of
CLEC10A expression, ROC curve was used to assess its value in
discriminating BC during diagnosis. With an AUC of 0.779, CLEC10A
showed marked median sensitivity and specificity for BC diagnosis
(Fig. 2A). KM analyses were also
performed to verify the predictive value of CLEC10A regarding
clinical outcomes. The results showed that the patients with BC and
higher CLEC10A expression levels tended to have more favorable
overall survival (OS; P=0.031; Fig.
2B), disease-specific survival (DSS; P=0.063: Fig. 2C) and progression-free survival
(PFS, P=0.024; Fig. 2D) rates.
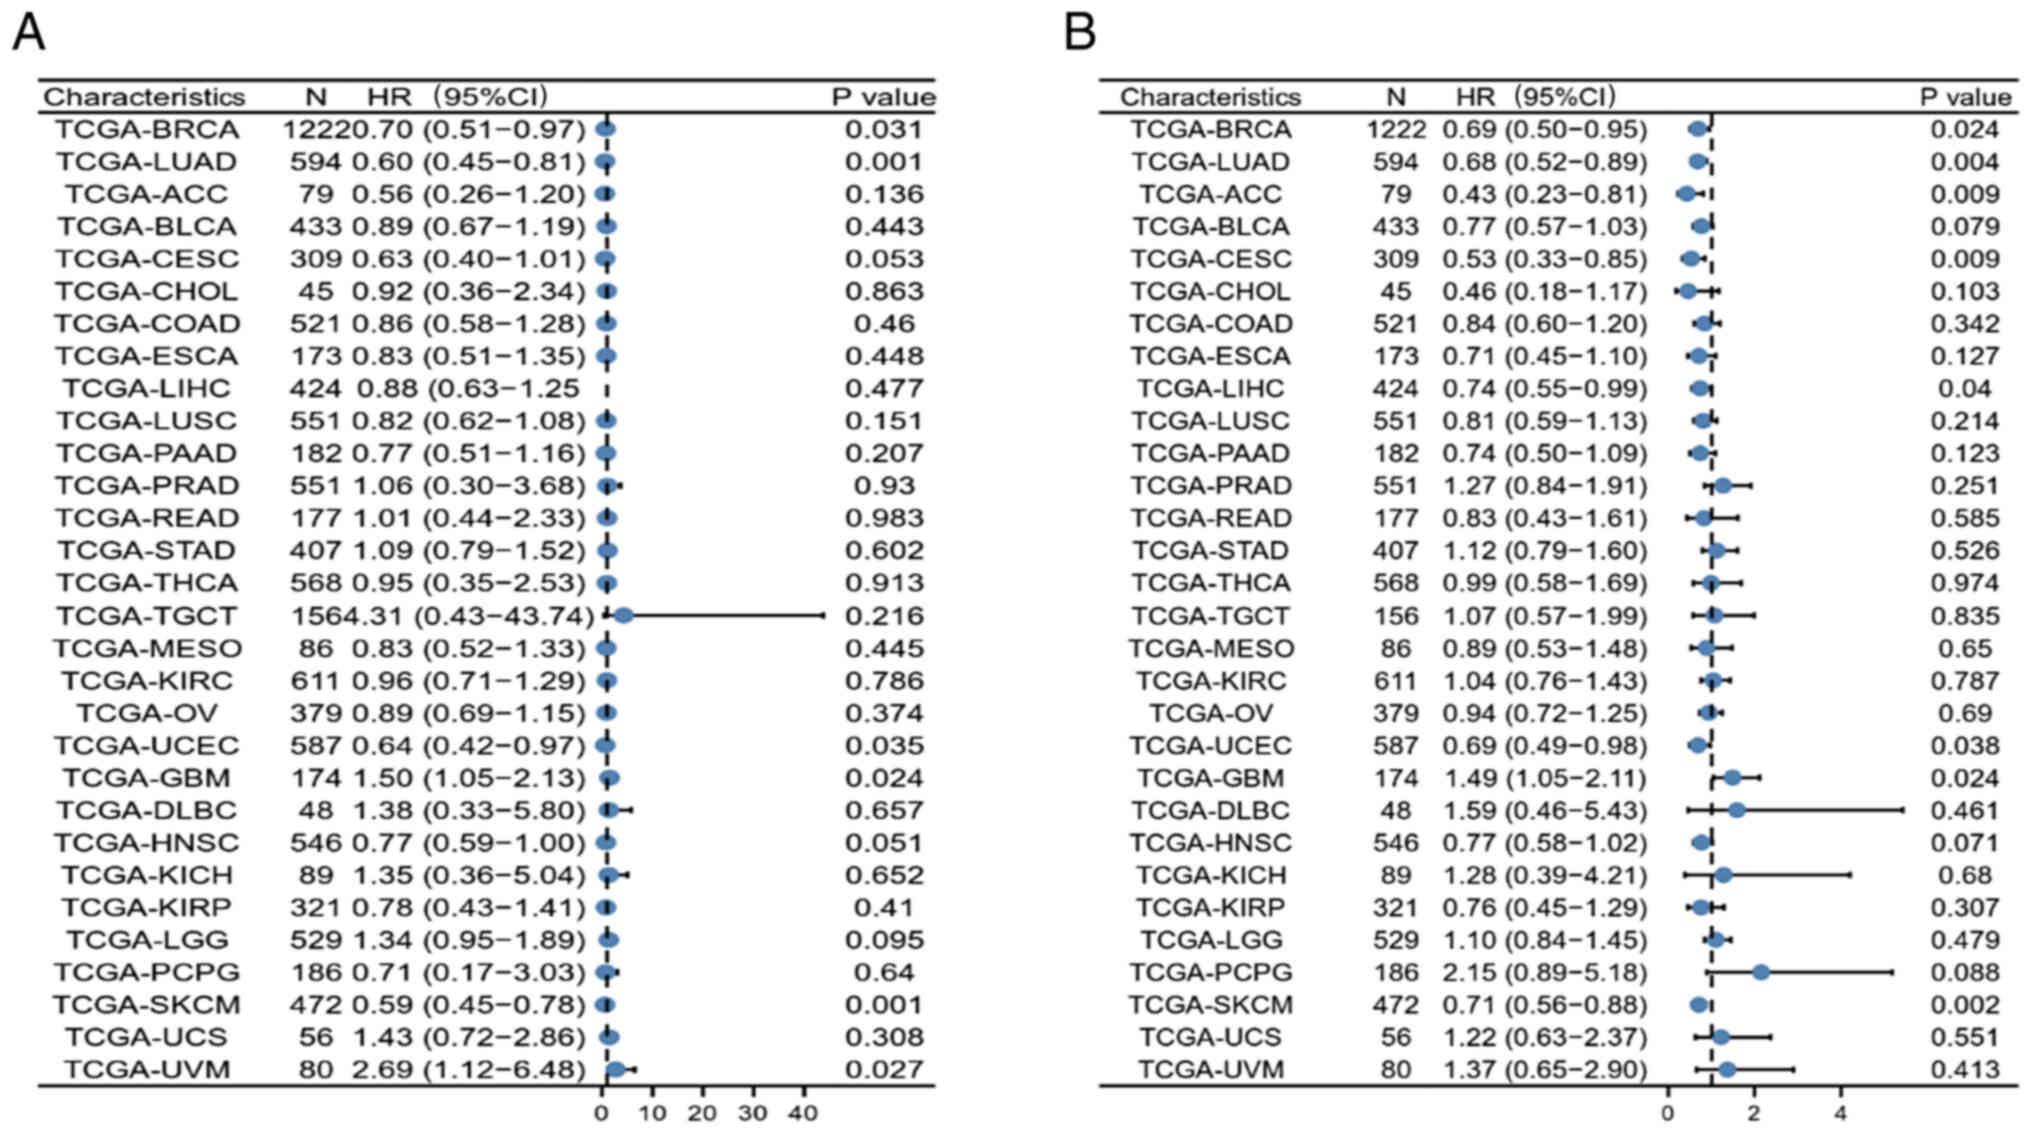
Furthermore, the possible association between
CLEC10A expression and OS and PFS in 30 TCGA tumor types was also
investigated using univariate survival analysis. CLEC10A expression
was found to be associated with the OS of patients with lung
adenocarcinoma (LUAD; P=0.001), uterine corpus (UCEC; P=0.035),
glioblastoma multiforme (GBM; P=0.024), skin cutaneous melanoma
(SKCM; P=0.001) and uveal melanoma (UVM; P=0.027) in addition to
BRCA (Fig. 3A). CLEC10A expression
also correlated with the PFS of patients with LUAD (P=0.004),
adrenocortical carcinoma (P=0.009), cervical and endocervical
cancer (P=0.009), liver hepatocellular carcinoma (P=0.04), UCEC
(P=0.038), GBM (P=0.024) and SKCM (P=0.002; Fig. 3B). These results suggest the value
of CLEC10A in predicting prognosis in several cancers and that
CLEC10A may be a potential prognostic biomarker for BC.
CLEC10A expression is associated with
immune infiltration in BC
Tumor infiltrating lymphocytes have been previously
identified to be an independent factor for predicting sentinel
lymph node status and prognosis in various cancers (9). Therefore, the present study next used
the TISIDB database to further analyze the potential correlation
between expression levels of CLEC10A and tumor immune infiltrating
cells. CLEC10A expression was correlated with all immune cell
subtypes in BC (Fig. 4A; Table I). Correlation analysis between
CLEC10A expression and immune cell subsets in BC using ssGSEA with
Spearman's correlation coefficient indicated that CLEC10A
expression significantly correlated with immune infiltration by B
cells (r=0.682; P<0.001), CD8 T cells (r=0.615; P<0.001),
macrophages (r=0.404; P<0.001), dendritic cells (DCs; r=0.755;
P<0.001), natural killer (NK) cells (r=0.267: P<0.001),
central memory T cells (r=0.236: P<0.001), Th1 cells (r=0.558:
P<0.001), Th17 cells (r=0.107: P<0.001) and neutrophils
(r=0.426: P<0.001) in BC positively (Fig. 4B-J). These results suggest that
CLEC10A can potentially serve as a major tumor immune infiltration
regulator in BC.
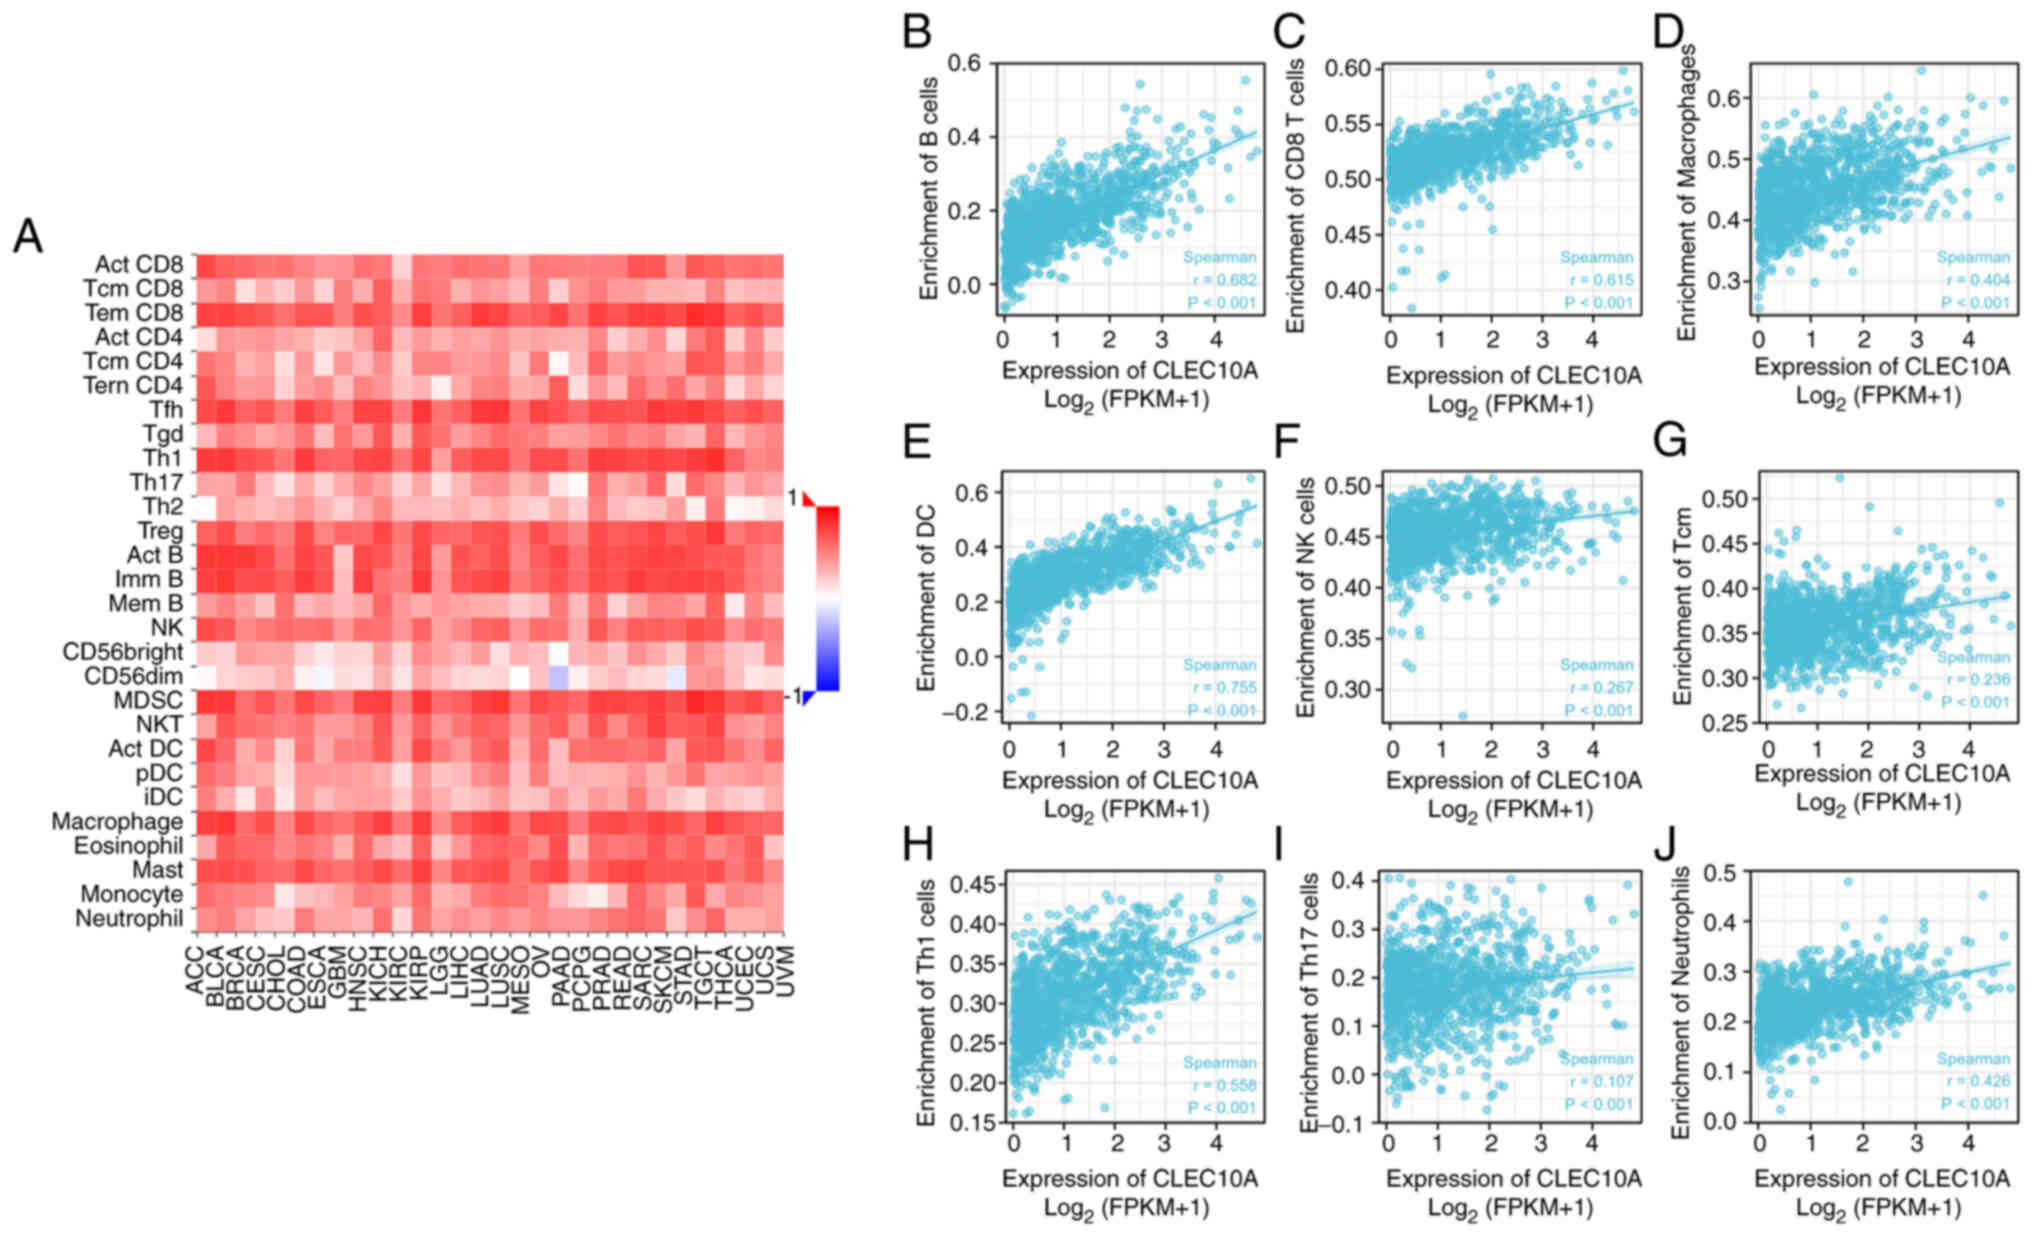 | Figure 4.Association analysis of CLEC10A gene
expression and immune infiltration using the Tumor And Immune
System Interaction Database by Spearman's correlation analysis. (A)
Relationships between the gene expression of CLEC10A and 28 types
of tumor-infiltrating lymphocytes among a panel of heterogeneous
human cancers. Correlation of CLEC10A gene expression with the
degree of infiltration by (B) B, (C) CD8+ T, (D) macrophages, (E)
dendritic, (F) NK, (G) Tcm, (H) Th1, (I) Th17 cells and (J)
neutrophils. CLEC10A, C-type lectin domain family 10 member A; Tcm,
T central memory; NK, natural killer; DC, dendritic cells; FPKM,
fragments per kilobase per million. |
 | Table I.Correlation between C-type lectin
domain family 10 member A expression and tumor lymphocyte
infiltration in breast cancera. |
Table I.
Correlation between C-type lectin
domain family 10 member A expression and tumor lymphocyte
infiltration in breast cancera.
| Cell type | Rho-value | P-value |
|---|
| Activated CD8 T
cell | 0.59 |
<2.2×10⁻¹⁶ |
| Central memory CD8
T | 0.134 |
8.57×10−06 |
| Effector memory CD8
T | 0.701 |
<2.2×10⁻¹⁶ |
| Activated CD4
T | 0.382 |
<2.2×10⁻¹⁶ |
| Central memory CD4
T | 0.296 |
7.30×10⁻²⁴ |
| Effector memory CD4
T | 0.392 |
<2.2×10⁻¹⁶ |
| T follicular
helper | 0.607 |
<2.2×10⁻¹⁶ |
| Gamma delta T | 0.434 |
<2.2×10⁻¹⁶ |
| Type 1 T
helper | 0.69 |
<2.2×10⁻¹⁶ |
| Type 17 T
helper | 0.526 |
<2.2×10⁻¹⁶ |
| Type 2 T
helper | 0.315 |
<2.2×10⁻¹⁶ |
| Regulatory T | 0.504 |
<2.2×10⁻¹⁶ |
| Activated B | 0.782 |
<2.2×10⁻¹⁶ |
| Immature B | 0.688 |
<2.2×10⁻¹⁶ |
| Memory B | 0.381 |
<2.2×10⁻¹⁶ |
| natural killer | 0.464 |
<2.2×10⁻¹⁶ |
| CD56bright natural
killer | 0.388 |
<2.2×10⁻¹⁶ |
| CD56dim natural
killer | 0.209 |
3.02X10⁻¹⁶ |
| Myeloid derived
suppressor | 0.566 |
<2.2×10⁻¹⁶ |
| Natural killer
T | 0.576 |
<2.2×10⁻¹⁶ |
| Activated
dendritic | 0.326 |
<2.2×10⁻¹⁶ |
| Plasmacytoid
dendritic | 0.353 |
<2.2×10⁻¹⁶ |
| Immature
dendritic | 0.098 | 0.00111 |
| Macrophage | 0.585 |
<2.2×10⁻¹⁶ |
| Eosinophil | 0.601 |
<2.2×10⁻¹⁶ |
| Mast | 0.685 |
<2.2×10⁻¹⁶ |
| Monocyte | 0.483 |
<2.2×10⁻¹⁶ |
| Neutrophil | 0.359 |
<2.2×10⁻¹⁶ |
CLEC10A expression is associated with
the expression of immune cell type markers
The possible association between CLEC10A expression
and the expression levels of tumor-infiltrating immune cell markers
in BC tissues were analyzed using the TIMER database. The
expression levels of CLEC10A in BC tissues were significantly
correlated with immune markers of B cells, CD8 T cells, M2
macrophages, monocytes, NK cells, T cells (general), DCs, T helper
cells, Tregs, and exhausted T cells (Table I). The expression levels of CLEC10A
were significantly correlated with the levels of various subtypes
of T cell markers, including CD8 T cell markers, CD8A and CD8B, T
cell (general) markers, CD3D, CD3E, and CD2, exhausted T cell
markers cytotoxic T-lymphocyte antigen 4, hepatitis A virus
cellular receptor 2, granzyme B, lymphocyte activating 3 and
programmed cell death protein 1, Th2 markers, Th17 markers STAT6
and 5A and IL17A, Treg markers forkhead box P3, C-C motif chemokine
receptor (CXCR) type 8, STAT5B, and TGF-β1, Tfh marker Bcl-6 and
neutrophil markers integrin subunit α M and C-C motif chemokine
receptor type 7 (all P<0.001; Table II). The expression levels of
CLEC10A were also significantly correlated with macrophage markers
[M2 macrophage markers membrane spanning 4-domains A4A, V-set and
immunoglobulin domain containing 4 and CD163; monocyte markers
colony stimulating factor 1 receptor and CD86; tumor-associated
macrophage markers CD68, IL21, IL10, BCL-6 (P<0.01) and C-C
motif chemokine ligand 2; all P<0.001 unless stated otherwise;
Table II] and B cell markers CD19
and CD79A (all P<0.001; Table
II). However, the expression levels of CLEC10A were not
significantly correlated with the DC marker CD1C, M1 macrophage
marker nitric oxide synthase 2, neutrophil marker carcinoembryonic
antigen-related cell adhesion molecule 8 or Th2 marker GATA binding
protein 3 in BC (Table II). These
results suggest that CLEC10A is associated with the expression
levels of infiltrating immune cell markers in BC tissues and may be
involved in the regulation of tumor immune infiltration in BC.
| Table II.Correlation analysis between the
expression of C-type lectin domain family 10 member A and related
immune cell markers using the Tumor IMmune Estimation Resource
online database. |
Table II.
Correlation analysis between the
expression of C-type lectin domain family 10 member A and related
immune cell markers using the Tumor IMmune Estimation Resource
online database.
|
|
| None | Purity |
|---|
|
|
|
|
|
|---|
| Description | Gene markers | Rho value | P-value | Rho value | P-value |
|---|
| B cell | CD19 | 0.655 |
9.19×10−136 | 0.532 |
7.48×10−74 |
|
| CD79A | 0.650 |
4.69×10−133 | 0.511 |
3.23×10−67 |
| CD8 T Cell | CD8A | 0.726 |
7.88×10⁻¹³ | 0.507 |
7.73×10−109 |
|
| CD8B | 0.677 |
1.31×10−146 | 0.565 |
2.54×10−83 |
| Dendritic cell | ITGAX | 0.492 |
7.06×10−67 | 0.343 |
2.95×10⁻²⁸ |
|
| NRP1 | 0.273 |
2.35×10⁻¹⁹ | 0.121 |
3.05×10⁻⁴ |
|
| CD1C | 0.876 | 0.923 | 0.819 |
5.21×10−240 |
|
| HLA-DPA1 | 0.642 |
1.96×10−127 | 0.511 |
3.52×10−66 |
|
| HLA-DRA | 0.648 |
2.70×10−130 | 0.514 |
2.41×10−67 |
|
| HLA-DQB1 | 0.535 |
7.90×10−81 | 0.411 |
1.34×10−40 |
|
| HLA-DPB1 | 0.715 |
5.86×10−171 | 0.586 |
2.54×10−91 |
| M1 Macrophage | PTGS2 | 0.415 |
2.19×10−45 | 0.284 |
1.26×10⁻¹⁸ |
|
| IRF5 | 0.307 |
1.05×10⁻²⁴ | 0.226 |
2.12×10⁻¹² |
|
| NOS2 | 0.011 | 0.847 | −0.022 | 0.563 |
| M2 Macrophage | MS4A4A | 0.554 |
7.70×10−88 | 0.430 |
2.94×10−45 |
|
| VSIG4 | 0.399 |
8.77×10−43 | 0.272 |
7.93×10⁻¹⁸ |
|
| CD163 | 0.440 |
1.34×10−52 | 0.327 |
1.31×10⁻²⁵ |
| Monocyte | CSF1R | 0.549 |
1.12×10−86 | 0.405 |
5.48×10−40 |
|
| CD86 | 0.475 |
2.08×10−62 | 0.338 |
1.21×10⁻²⁷ |
| Natural killer
cell | KIR2DS4 | 0.332 |
4.69×10⁻²⁸ | 0.234 |
3.15×10⁻¹² |
|
| KIR3DL3 | 0.235 |
1.15×10⁻¹³ | 0.181 |
1.97×10⁻⁷ |
|
| KIR3DL2 | 0.469 |
1.23×10−59 | 0.356 |
2.16×10⁻²⁹ |
|
| KIR3DL1 | 0.432 |
9.59×10−50 | 0.340 |
1.24×10⁻²⁶ |
|
| KIR2DL4 | 0.388 |
2.51×10−39 | 0.279 |
6.63×10⁻¹⁸ |
|
| KIR2DL3 | 0.356 |
1.17×10⁻³² | 0.266 |
2.93×10⁻¹⁶ |
|
| KIR2DL1 | 0.340 |
1.50×10⁻²⁹ | 0.255 |
1.40×10⁻¹⁴ |
| Neutrophils | CCR7 | 0.792 |
1.06×10−235 | 0.704 |
2.44×10−148 |
|
| ITGAM | 0.392 |
4.19×10−41 | 0.259 |
2.18×10⁻¹⁶ |
|
| CEACAM8 | 0.041 | 0.178 | 0.005 | 0.886 |
| T cell general | CD3D | 0.771 |
7.67×10−216 | 0.671 |
2.02×10−129 |
|
| CD3E | 0.782 |
5.90×10−45 | 0.686 |
8.12×10−138 |
|
| CD2 | 0.735 |
3.30×10−184 | 0.628 |
1.463×10−108 |
| T cell
exhaustion | CTLA4 | 0.570 |
2.14×10−94 | 0.440 |
2.63×10−47 |
|
| LAG3 | 0.387 |
7.68×10−40 | 0.286 |
2.37×10⁻¹⁹ |
|
| HAVCR2 | 0.393 |
2.38×10−41 | 0.252 |
1.80×10⁻¹⁵ |
|
| GZMB | 0.625 |
8.536×10−119 | 0.508 |
1.02×10−64 |
|
| PDCD1 | 0.675 |
2.22×10−45 | 0.552 |
1.06×10−78 |
| Tumor-associated
macrophages | CCL2 | 0.472 |
1.21×10−60 | 0.338 |
4.71×10⁻²⁷ |
|
| IL10 | 0.455 |
6.35×10−56 | 0.334 |
1.38×10⁻²⁶ |
|
| CD68 | 0.420 |
2.05×10⁻¹⁷ | 0.288 |
1.11×10⁻¹⁹ |
|
| BCL6 | 0.126 |
1.48×10⁻⁴ | 0.083 | 0.030 |
|
| IL21 | 0.367 |
8.59×10⁻³⁵ | 0.279 |
3.60×10⁻¹⁸ |
| Th1 | TBX21 | 0.745 |
7.90×10−194 | 0.643 |
1.538×10−115 |
|
| STAT4 | 0.686 |
3.40×10−152 | 0.554 |
2.21×10−79 |
|
| STAT1 | 0.255 |
3.93×10⁻¹⁷ | 0.184 |
1.79×10⁻⁸ |
|
| IFNG | 0.520 |
9.83×10−76 | 0.404 |
1.30×10−38 |
|
| IL13 | 0.273 |
4.06×10⁻¹⁹ | 0.216 |
6.44×10⁻¹¹ |
| Th2 | GATA3 | −0.198 |
1.03×10⁻¹⁰ | −0.061 | 0.075 |
|
| STAT6 | 0.249 |
9.69×10⁻¹⁶ | 0.223 |
4.08×10⁻¹¹ |
|
| STAT5A | 0.424 |
3.19×10⁻¹⁶ | 0.310 |
6.09×10⁻²³ |
| Th17 | STAT3 | 0.083 | 0.011 | 0.038 | 0.229 |
|
| IL17A | 0.203 |
1.36×10⁻¹⁰ | 0.102 | 0.006 |
| Treg | FOXP3 | 0.525 |
8.75×10−78 | 0.384 |
2.19×10−39 |
|
| CCR8 | 0.420 |
9.70×10−48 | 0.333 |
1.41×10⁻²⁶ |
|
| STAT5B | 0.234 |
3.30×10⁻¹⁴ | 0.207 |
2.08×10⁻¹⁰ |
|
| TGFB1 | 0.411 |
5.85×10−45 | 0.263 |
2.02×10⁻¹⁶ |
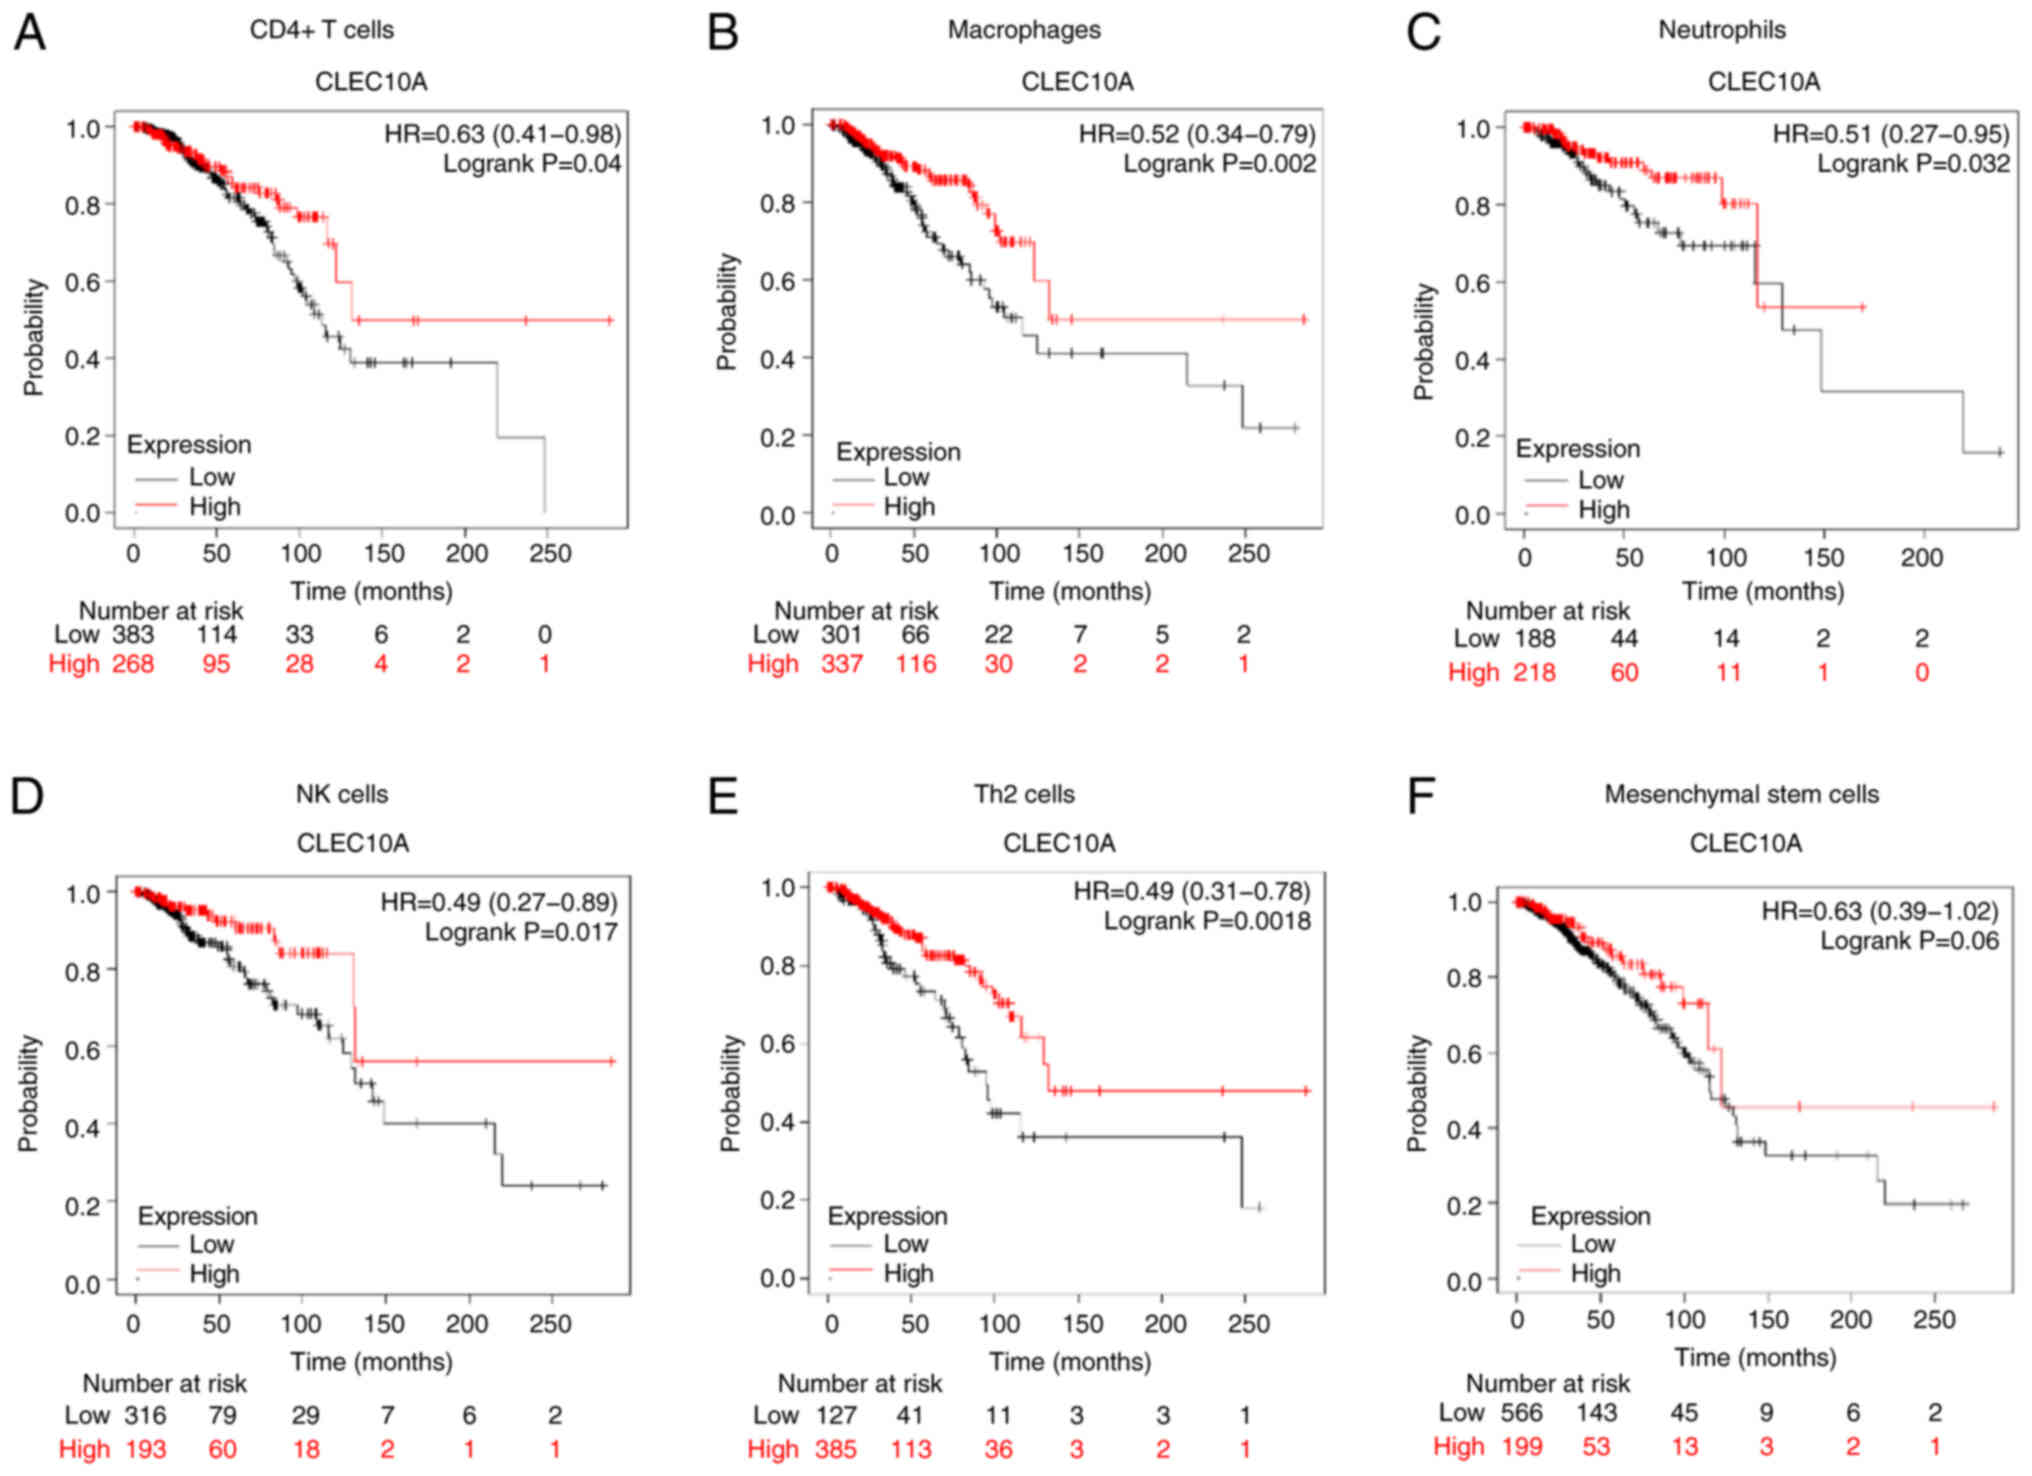
Prognostic analysis of CLEC10A
expression in BC based on immune cell types
The present study found that the expression levels
of CLEC10A were associated with immune infiltration in BC.
Additionally, downregulation of CLEC10A expression was associated
with unfavorable prognosis in patients with BC. Therefore, it was
next hypothesized that CLEC10A may affect the prognosis of patients
with BC through immune infiltration. A prognostic analysis based on
CLEC10A expression levels in enriched immune cell subgroups was
performed between the expression levels of CLEC10A in BC and the
infiltration levels of CD4 T cells, macrophages, neutrophils, NK
cells, Th2 cells and mesenchymal stem cells through the KM Plotter.
High CLEC10A levels were found to be associated with a favourable
prognosis in patients with BC with enriched CD4 T cells (P=0.04),
neutrophils (P=0.032), macrophages (P=0.002), NK cells (P=0.017)
and Th2 cells (P=0.0018) (Fig.
5A-E). However, there was no significant association in
mesenchymal stem cells (P=0.06; Fig.
5F). The present results supported the hypothesis that the
higher CLEC10A expression levels may improve the prognosis of
patients with BC by altering immune infiltration levels.
Discussion
BC has an intrinsically complex tumor
microenvironment (TME), which plays a central role in the
pathogenesis of BC (22). The TME
can be divided into two parts: Tumor cells and the surrounding
extracellular matrix (ECM) (23).
The ECM is a complex network consisting of collagenous and
non-collagenous components, both of which are key regulators of
interstitial transport (24). The
ECM is mainly comprised of collagen I, collagen IV, fibronectin and
laminin, which provide biochemical scaffold and structural support
for the tumor cells (24).
Furthermore, immune cells of the TME can influence the course of
tumor progression and become key to the overall efficacy (25).
CLEC10A has been previously reported to be
associated with improved immune responses of immune cells (7). CLEC10A recognizes tumor-associated Tn
antigens and can efficiently present antigens to CD4 T cells
(8,10,11).
It has been found to significantly increase the activation of
antigen-specific CD8 T cells by binding with tumor-associated
antigens carrying α-N-acetylgalactosamine (8). The ability of CLEC10A to influence
the antitumor immune response has been garnering attention, leading
to previous reports proposing that CLEC10A can serve as a potential
therapeutic target for tumor therapies, including those for
colorectal and ovarian cancer (7,8,26).
In addition, a number of reviews have also discussed its value in
breast and lung cancer based on the immune response (27,28).
Based on these previous findings, the present study therefore
investigated the potential association between CLEC10A and immune
cell infiltration in BC cells, in addition to its expression and
prognostic significance.
In the present study, it was found that CLEC10A
expression is lower in some cancer tissues, including BC tissues,
compared with that in the normal tissues. Furthermore, the
expression levels of CLEC10A were associated with tumor
pathological stage, histological type, T stage, and HER2 status in
BC. In particular, lower expression levels of CLEC10A were
associated with T4 stage (Fig.
1E). Therefore, the present results suggest that lower
expression of CLEC10A may serve a role in the progression of
tumors, including BC.
A previous study on 146 patients with early invasive
ductal breast carcinoma revealed that positive CLEC10A expression
is significantly associated with increased disease-free survival
and OS (11). The present study
was performed using data from 1,222 patients with BC, which also
included clinicopathological data, from the TCGA database. Lower
CLEC10A expression was found to be associated with poorer
prognosis. Some similar findings were reported in lung carcinoma,
in a bioinformatics analysis on LUAD data downloaded from TCGA and
Gene Expression Omnibus (12).
Therefore, CLEC10A may be applied as a potentially powerful
prognostic biomarker in BC clinical management.
Subsequently, the present study demonstrated that
CLEC10A expression is associated with some infiltrating immune cell
types in BC, in particular CD8 T cells, macrophages, DC and NK
cells (Fig. 4). Efficient CLEC10A
binding requires multivalent ligands and a corresponding
multivalent binder, such as a fragment of the mucin 1 protein, to
provide greater affinity to the receptor (27). In addition, the structure of the
ligand can determine the cellular response, with large Tn-bearing
glycoproteins typically trapped in the endolysosomal compartment,
whilst smaller glycopeptides tend to be processed further in the
human leukocyte antigen (HLA) I/HLA II compartments (29). CLEC10A can bind to the Tn ligand to
induce the maturation of CD4 and CD8 T cells to combat tumor
progression (11,30).
Expression of markers of the immune system in BC
were then analyzed. After cell purity correction, CLEC10A was found
to be positively correlated with a wide range of immune cell
markers in BC (Table II). These
results implied further that CLEC10A is associated with immune
infiltration in BC. Notably, increased CLEC10A expression level was
positively correlated with Treg and exhausted T cell markers. There
was also a significant correlation between CLEC10A expression
levels and Th1 and Th2 markers in BC. These correlations may
reflect the underlying mechanisms by which CLEC10A regulates T cell
function in BC. Therefore, CLEC10A may confer favorable prognosis
in patients with BC by recruiting and regulating immune cells.
The results of the KM plotter database analysis
indicated that CD4 T cells, neutrophils, macrophages, NK cells Th2
cells infiltration and CLEC10A expression were significantly
correlated with BC prognosis (Fig.
5). Tregs can suppress antitumor responses, leading to tumor
immune escape. DCs can promote tumor metastasis by increasing the
Treg cell population whilst decreasing the cytotoxicity of CD8 T
cells (31–34). Previous studies have also shown
that the proportion of macrophages, CD8 T cells, Tregs and
myeloid-derived suppressor cells in patients with BC is associated
with poor prognosis (34). These
results may explain why lower expression of CLEC10A can affect the
prognosis of patients with BC through immune infiltration.
In summary, the present study found that lower
expression levels of CLEC10A were significantly associated with
poorer survival and immune infiltration in patients with BC through
bioinformatics analysis. CLEC10A may be a potential novel biomarker
for predicting prognosis in BC. Furthermore, the present study
provides novel and promising insights for the further elucidation
of significant clinicopathological factors and molecular
pathogenesis mechanisms of BC. However, the mechanism by which
CLEC10A regulates the TME and prognosis in BC remains unclear.
Further in vivo and clinical studies are necessary to
comprehensively elucidate the biological impact of CLEC10A in
BC.
Acknowledgements
Not applicable.
Funding
The present study was supported by the Shanghai Yangpu District
Health and Family Planning Commission Fund for Hao Yi Shi Training
Project (grant no. 202056, 2020-2023), the Natural Science
Foundation of Shanghai (grant no. 18ZR1436000) and the National
Natural Science Foundation of China (grant no. 81802961).
Availability of data and materials
The datasets used and/or analyzed during the current
study are available from the corresponding author on reasonable
request.
Authors' contributions
FC designed and managed the entire study. ST
downloaded and analyzed the data and wrote the main manuscript. YZ,
XL and HW helped with the statistical analysis. LY and HZ performed
the RT-qPCR. FC and ST confirm the authenticity of all the raw
data. All authors read and approved the final version of the
manuscript.
Ethics approval and consent to
participate
Not applicable.
Patient consent for publication
Not applicable.
Competing interests
The authors declare that they have no competing
interests.
Glossary
Abbreviations
Abbreviations:
|
CLEC10A
|
C-type lectin domain family 10 member
A
|
|
BC
|
breast cancer
|
|
BRCA
|
breast invasive carcinoma
|
|
GBM
|
glioblastoma multiforme
|
|
LUAD
|
lung adenocarcinoma
|
|
SKCM
|
skin cutaneous melanoma
|
|
UCEC
|
uterine corpus
|
|
TIMER
|
Tumor IMmune Estimation Resource
|
|
TCGA
|
The Cancer Genome Atlas
|
|
ROC
|
receiver operating characteristic
|
|
AUC
|
area under curve
|
|
OS
|
overall survival
|
|
DSS
|
disease-specific survival
|
|
PFI
|
progress-free interval
|
References
|
1
|
Aushev VN, Lee E, Zhu J, Gopalakrishnan K,
Li Q, Teitelbaum SL, Wetmur J, Degli Esposti D, Hernandez-Vargas H,
Herceg Z, et al: Novel predictors of breast cancer survival derived
from miRNA activity analysis. Clin Cancer Res. 24:581–591. 2018.
View Article : Google Scholar : PubMed/NCBI
|
|
2
|
Sung H, Ferlay J, Siegel RL, Laversanne M,
Soerjomataram I, Jemal A and Bray F: Global cancer statistics 2020:
GLOBOCAN estimates of incidence and mortality worldwide for 36
cancers in 185 countries. CA Cancer J Clin. 71:209–249. 2021.
View Article : Google Scholar : PubMed/NCBI
|
|
3
|
Saad ED, Squifflet P, Burzykowski T,
Quinaux E, Delaloge S, Mavroudis D, Perez E, Piccart-Gebhart M,
Schneider BP, Slamon D, et al: Disease-free survival as a surrogate
for overall survival in patients with HER2-positive, early breast
cancer in trials of adjuvant trastuzumab for up to 1 year: A
systematic review and meta-analysis. Lancet Oncol. 20:361–370.
2019. View Article : Google Scholar
|
|
4
|
Shachar SS, Deal AM, Weinberg M, Williams
GR, Nyrop KA, Popuri K, Choi SK and Muss HB: Body composition as a
predictor of toxicity in patients receiving anthracycline and
taxane-based chemotherapy for early-stage breast cancer. Clin
Cancer Res. 23:3537–3543. 2017. View Article : Google Scholar : PubMed/NCBI
|
|
5
|
Lischka A, Doberstein N, Freitag-Wolf S,
Kocak A, Gemoll T, Heselmeyer-Haddad K, Ried T, Auer G and
Habermann JK: Genome instability profiles predict disease outcome
in a cohort of 4,003 patients with breast cancer. Clin Cancer Res.
26:4606–4615. 2020. View Article : Google Scholar : PubMed/NCBI
|
|
6
|
Abu-Thuraia A, Goyette MA, Boulais J,
Delliaux C, Apcher C, Schott C, Chidiac R, Bagci H, Thibault MP,
Davidson D, et al: AXL confers cell migration and invasion by
hijacking a PEAK1-regulated focal adhesion protein network. Nat
Commun. 11:35862020. View Article : Google Scholar : PubMed/NCBI
|
|
7
|
Pirro M, Mohammed Y, van Vliet SJ,
Rombouts Y, Sciacca A, de Ru AH, Janssen GMC, Tjokrodirijo RTN,
Wuhrer M, van Veelen PA and Hensbergen PJ: N-Glycoproteins have a
major role in MGL binding to colorectal cancer cell lines:
Associations with overall proteome diversity. Int J Mol Sci.
21:55222020. View Article : Google Scholar
|
|
8
|
Eggink LL, Roby KF, Cote R and Kenneth
Hoober J: An innovative immunotherapeutic strategy for ovarian
cancer: CLEC10A and glycomimetic peptides. J Immunother Cancer.
6:282018. View Article : Google Scholar : PubMed/NCBI
|
|
9
|
Messenheimer DJ, Jensen SM, Afentoulis ME,
Wegmann KW, Feng Z, Friedman DJ, Gough MJ, Urba WJ and Fox BA:
Timing of PD-1 blockade is critical to effective combination
immunotherapy with Anti-OX40. Clin Cancer Res. 23:6165–6177. 2017.
View Article : Google Scholar : PubMed/NCBI
|
|
10
|
Heger L, Balk S, Luhr JJ, Heidkamp GF,
Lehmann CH, Hatscher L, Purbojo A, Hartmann A, Garcia-Martin F,
Nishimura SI, et al: CLEC10A is a specific marker for human
CD1c+ dendritic cells and enhances their toll-like
receptor 7/8-induced cytokine secretion. Front Immunol. 9:7442018.
View Article : Google Scholar
|
|
11
|
Kurze AK, Buhs S, Eggert D,
Oliveira-Ferrer L, Muller V, Niendorf A, Wagener C and Nollau P:
Immature O-glycans recognized by the macrophage glycoreceptor
CLEC10A (MGL) are induced by 4-hydroxy-tamoxifen, oxidative stress
and DNA-damage in breast cancer cells. Cell Commun Signal.
17:1072019. View Article : Google Scholar
|
|
12
|
He M, Han Y, Cai C, Liu P, Chen Y, Shen H,
Xu X and Zeng S: CLEC10A is a prognostic biomarker and correlated
with clinical pathologic features and immune infiltrates in lung
adenocarcinoma. J Cell Mol Med. 25:3391–3399. 2021. View Article : Google Scholar : PubMed/NCBI
|
|
13
|
Zhang Z, Li J, He T and Ding J:
Bioinformatics identified 17 immune genes as prognostic biomarkers
for breast cancer: Application study based on artificial
intelligence algorithms. Front Oncol. 10:3302020. View Article : Google Scholar
|
|
14
|
Li T, Fan J, Wang B, Traugh N, Chen Q, Liu
JS, Li B and Liu XS: TIMER: A web server for comprehensive analysis
of tumor-infiltrating immune cells. Cancer Res. 77:e108–e110. 2017.
View Article : Google Scholar : PubMed/NCBI
|
|
15
|
Chandrashekar DS, Bashel B, Balasubramanya
SAH, Creighton CJ, Ponce-Rodriguez I, Chakravarthi BVSK and
Varambally S: UALCAN: A portal for facilitating tumor subgroup gene
expression and survival analyses. Neoplasia. 19:649–658. 2017.
View Article : Google Scholar
|
|
16
|
Nagy A, Lanczky A, Menyhart O and Gyorffy
B: Validation of miRNA prognostic power in hepatocellular carcinoma
using expression data of independent datasets. Sci Rep. 8:92272018.
View Article : Google Scholar : PubMed/NCBI
|
|
17
|
Svetnik V, Liaw A, Tong C, Culberson JC,
Sheridan RP and Feuston BP: Random forest: A classification and
regression tool for compound classification and QSAR modeling. J
Chem Inf Comput Sci. 43:1947–1958. 2003. View Article : Google Scholar
|
|
18
|
Bindea G, Mlecnik B, Tosolini M,
Kirilovsky A, Waldner M, Obenauf AC, Angell H, Fredriksen T,
Lafontaine L, Berger A, et al: Spatiotemporal dynamics of
intratumoral immune cells reveal the immune landscape in human
cancer. Immunity. 39:782–795. 2013. View Article : Google Scholar : PubMed/NCBI
|
|
19
|
Shang Y, Zhang Y, Liu J, Chen L, Yang X,
Zhu Z, Li D, Deng Y, Zhou Z, Lu B and Fu CG: Decreased E2F2
expression correlates with poor prognosis and immune infiltrates in
patients with colorectal cancer. J Cancer. 13:653–668. 2022.
View Article : Google Scholar : PubMed/NCBI
|
|
20
|
Ru B, Wong CN, Tong Y, Zhong JY, Zhong
SSW, Wu WC, Chu KC, Wong CY, Lau CY, Chen I, et al: TISIDB: An
integrated repository portal for tumor-immune system interactions.
Bioinformatics. 35:4200–4202. 2019. View Article : Google Scholar : PubMed/NCBI
|
|
21
|
Livak KJ and Schmittgen TD: Analysis of
relative gene expression data using real-time quantitative PCR and
the 2(−Delta Delta C(T)) method. Methods. 25:402–408. 2001.
View Article : Google Scholar : PubMed/NCBI
|
|
22
|
Sameni M, Tovar EA, Essenburg CJ,
Chalasani A, Linklater ES, Borgman A, Cherba DM, Anbalagan A, Winn
ME, Graveel CR and Sloane BF: Cabozantinib (XL184) inhibits growth
and invasion of preclinical TNBC models. Clin Cancer Res.
22:923–934. 2016. View Article : Google Scholar : PubMed/NCBI
|
|
23
|
Lin W, Noel P, Borazanci EH, Lee J, Amini
A, Han IW, Heo JS, Jameson GS, Fraser C, Steinbach M, et al:
Single-cell transcriptome analysis of tumor and stromal
compartments of pancreatic ductal adenocarcinoma primary tumors and
metastatic lesions. Genome Med. 12:802020. View Article : Google Scholar : PubMed/NCBI
|
|
24
|
Narayanan K, Kumar S, Padmanabhan P,
Gulyas B, Wan ACA and Rajendran VM: Lineage-specific exosomes could
override extracellular matrix mediated human mesenchymal stem cell
differentiation. Biomaterials. 182:312–322. 2018. View Article : Google Scholar : PubMed/NCBI
|
|
25
|
Wang G, Lu X, Dey P, Deng P, Wu CC, Jiang
S, Fang Z, Zhao K, Konaparthi R, Hua S, et al: Targeting
YAP-Dependent MDSC infiltration impairs tumor progression. Cancer
Discov. 6:80–95. 2016. View Article : Google Scholar : PubMed/NCBI
|
|
26
|
Nollau P, Wolters-Eisfeld G, Mortezai N,
Kurze AK, Klampe B, Debus A, Bockhorn M, Niendorf A and Wagener C:
Protein domain histochemistry (PDH): Binding of the carbohydrate
recognition domain (CRD) of recombinant human glycoreceptor CLEC10A
(CD301) to formalin-fixed, paraffin-embedded breast cancer tissues.
J Histochem Cytochem. 61:199–205. 2013. View Article : Google Scholar : PubMed/NCBI
|
|
27
|
Zizzari IG, Napoletano C, Battisti F,
Rahimi H, Caponnetto S, Pierelli L, Nuti M and Rughetti A: MGL
Receptor and immunity: When the ligand can make the difference. J
Immunol Res. 2015.4506952015.
|
|
28
|
Hoober JK: ASGR1 and its enigmatic
relative, CLEC10A. Int J Mol Sci. 21:48182020. View Article : Google Scholar
|
|
29
|
Heger L, Hofer TP, Bigley V, de Vries IJM,
Dalod M, Dudziak D and Ziegler-Heitbrock L: Subsets of CD1c(+) DCs:
Dendritic cell versus monocyte lineage. Front Immunol.
11:5591662020. View Article : Google Scholar
|
|
30
|
Zelensky AN and Gready JE: The C-type
lectin-like domain superfamily. FEBS J. 272:6179–6217. 2005.
View Article : Google Scholar : PubMed/NCBI
|
|
31
|
Sawant DV, Yano H, Chikina M, Zhang Q,
Liao M, Liu C, Callahan DJ, Sun Z, Sun T, Tabib T, et al: Adaptive
plasticity of IL-10+ and IL-35+
Treg cells cooperatively promotes tumor T cell
exhaustion. Nat Immunol. 20:724–735. 2019. View Article : Google Scholar
|
|
32
|
Plitas G, Konopacki C, Wu K, Bos PD,
Morrow M, Putintseva EV, Chudakov DM and Rudensky AY: Regulatory T
cells exhibit distinct features in human breast cancer. Immunity.
45:1122–1134. 2016. View Article : Google Scholar : PubMed/NCBI
|
|
33
|
Aguilera TA and Giaccia AJ: Molecular
pathways: Oncologic pathways and their role in T-cell exclusion and
immune evasion-A new role for the AXL receptor tyrosine kinase.
Clin Cancer Res. 23:2928–2933. 2017. View Article : Google Scholar : PubMed/NCBI
|
|
34
|
Kajikawa M, Ose T, Fukunaga Y, Okabe Y,
Matsumoto N, Yonezawa K, Shimizu N, Kollnberger S, Kasahara M and
Maenaka K: Structure of MHC class I-like MILL2 reveals
heparan-sulfate binding and interdomain flexibility. Nat Commun.
9:43302018. View Article : Google Scholar : PubMed/NCBI
|