Introduction
Prostate cancer is the most common urological cancer
among older men. In 2020, 1,414,259 patients were newly diagnosed
with prostate cancer globally (1).
Surgical treatment, which primarily comprises radical
prostatectomy, provides reasonable disease control for prostate
cancer, but ~25% of patients experience disease recurrence
(2). The most frequently used test
to monitor disease occurrence is the detectable prostate-specific
antigen (PSA) value after surgery. Patients with high-risk prostate
cancer after prostatectomy have a particularly high chance of being
diagnosed with biochemical recurrence (BCR) following two
consecutive PSA measurements of >0.2 ng/ml. Patients with BCR
have a greater risk of disease progression and mortality (2–6), and
the early occurrence of BCR is associated with a poor prognosis
(6–9).
Patients defined as high risk according to the
National Comprehensive Cancer Network (NCCN) guidelines have an
increased risk of disease progression and cancer-specific mortality
(10). Furthermore, one study
reported that ~50% of high-risk patients had BCR within 1 year
(6), which indicates that patients
categorized as high risk require considerable attention and a
strong follow-up strategy, particularly those with early BCR. The
present study evaluated the risk factors associated with high-risk
and very high-risk patients as classified by the NCCN guidelines
after radical prostatectomy. These guidelines are designed to help
urologists to identify patients requiring more aggressive
therapeutic programs of clinical care.
Materials and methods
Study sample
The present retrospective study enrolled patients
diagnosed with prostate cancer who received radical prostatectomy
at Taichung Veterans General Hospital (Taichung, Taiwan) from
January 1, 2009 to June 30, 2020. The patients were all male with a
median age of 73 years (range 52–85 years). All patients had
received laparoscopic radical prostatectomy or robotic-assisted
prostatectomy performed by a single surgical team. Two radiologists
interpreted MRI images based on Prostate Imaging-Reporting and Data
System scores (11). The follow-up
duration for all patients was ≥6 years. Patients without follow-up
data or with pathologic stage T3bN2M0 were excluded. All patient
data were extracted from medical records, including demographics,
surgery type, pelvic lymph node dissection (PLND) status, PSA
values, Gleason scores, and pathological and image examination data
at diagnosis and within 1 year after prostatectomy. The
pathological and image examination in the present study was based
on the standard Tumor-Node-Metastasis staging system defined by the
published American Joint Committee on Cancer 8th edition (12). The detected range of primary tumor
invasion was different between the pathological and image
examination. Pathological examination evaluated T2a, T2b, T3a and
T3b staging of prostate cancer, but image examination evaluated
T2b, T2c, T3a and T3b staging. T2a indicates that tumors were
located in <50% of one side of the prostate; T2b indicates that
tumors were located in >50% of one side of the prostate; T2c
indicates that tumors were located in both sides of the prostate;
T3a indicates that tumors had broken through the capsule of the
prostate gland; T3b indicates that tumors had spread into the tubes
that carry semen; N0M0 indicates that tumors had not spread to
nearby lymph nodes or elsewhere in the body; any T stage indicates
that tumors may or may not have grown into tissues near the
prostate (12). Pathological tumor
percentage was calculated as a proportion of tumor volume and
prostate volume. The formula used was as follow: Vc=Vol × Pc/100,
where Pc is pathological tumor percentage (%); Vc is the volume of
tumor tissues (cc); and Vol is the prostate volume (cc). The unit
of volume measurement detected by planimetry software [Photoshop CC
2017 (version 18; Adobe Systems, Inc.)] is indicated as cc
(13,14). PSA density (ng/ml2) was
calculated as total PSA value (ng/ml) divided by prostate volume
(ml). Detectable PSA is defined as a PSA value >0.1 ng/ml within
3 months after prostatectomy. Disease control is defined as the
last PSA value being less than the PSA value during salvage
therapy. The patients were assigned to high-risk (T3a, Gleason
score >8 or PSA >20 ng/ml) and very high-risk groups (T3b-T4,
primary Gleason pattern 5, two or three high-risk features or >4
biopsy cores with Gleason score >8) after radical prostatectomy
according to the NCCN guidelines.
Ethical considerations
The study protocol was approved by the Institutional
Review Boards I&II of Taichung Veterans General Hospital (ref.
no. CE21174A; approval date, June 23, 2022) and followed the
approved guidelines. No informed consent was required of the
participants because no identifying patient information was
included and the data were analyzed anonymously.
Primary outcome
The primary outcome was the BCR of prostate cancer.
BCR is defined as a PSA value that had decreased to <0.1 ng/ml
but then increased to >0.2 ng/ml more than 3 months after
prostatectomy, during salvage therapy.
Statistical analysis
The normal distribution of continuous data was
checked with the Shapiro-Wilk test. Data that did not follow a
normal distribution are presented as the median with the
interquartile range (IQR) in parentheses, and were analyzed using
the Wilcoxon rank-sum test. Categorical data were analyzed using
the Chi-square or Fisher's exact test, as appropriate, and are
presented as n (%). Cox regression models were used to estimate the
hazard ratios (HRs) and 95% confidence intervals (CIs) of the risk
of BCR in patients with undetectable PSA. Univariate and
multivariate logistic regression models were used to estimate the
odds ratios (ORs) and 95% CIs for postoperative detectable PSA
rate, post-salvage therapy disease control rate and the BCR
<1-year rate. Receiver operating characteristic (ROCs) curves
were plotted to assess the value of PSA density and pathological
tumor percentage in the prediction of outcomes. The cut-off point
was calculated according to the maximum Youden index. Each area
under the curve (AUC) was calculated, with higher AUCs indicating
higher predictive performance. The full model ROC curve is a linear
regression model that includes the values of all explanatory
variables, such as age, surgical type, PLND, PSA density,
pathological tumor percentage, imaging stage and pathologic stage.
A two-sided P<0.05 was considered to indicate a statistically
significant difference. Data management and statistical analyses
were conducted using SAS version 9.4 software (SAS Institute,
Inc.).
Results
Demographic and clinical
characteristics of the patients
A total of 307 patients were included in the study,
with a median age of 73 years (IQR, 68–77 years). According to the
NCCN guidelines, 187 patients were classified in the high-risk
group and 120 patients were classified in the very high-risk group.
Table I presents the baseline
characteristics of the study population. In the very high-risk
group, the initial PSA [29.66 (17.79-45.19) vs. 21.00 (10.10-30.99)
ng/ml; P<0.001], PSA density [0.74 (0.38-1.20) vs. 0.48
(0.24-0.80) ng/ml2; P<0.001] and pathological tumor
percentage [35.0 (15.0-67.5) vs. 20.0 (10.0-40.0)%; P<0.001]
were significantly higher than those in the high-risk group. The
very high-risk group had a higher proportion of patients undergoing
extended PLND, higher initial and postoperative Gleason grades, and
a lower proportion of patients with imaging stage T2bN0M0/T2cN0M0
and pathologic stage T2aN0M0/T2bN0M0 and T3aN0M0 when compared with
the high-risk group (all P<0.001).
 | Table I.Demographic and clinical
characteristics of the patient population. |
Table I.
Demographic and clinical
characteristics of the patient population.
| Characteristics | Total, n=307 | Very high risk,
n=120 | High risk, n=187 | P-value |
|---|
| Age, years | 73 (68–77) | 74 (68–78) | 72 (68–77) | 0.314 |
| Surgery type |
|
|
| 0.740 |
| LRP | 41 (13.36) | 17 (14.17) | 24 (12.83) |
|
|
RARP/RALRP/RALP | 266 (86.64) | 103 (85.83) | 163 (87.17) |
|
| PLND |
|
|
| <0.001 |
| Extended
PLND | 224 (72.96) | 108 (90.00) | 116 (62.03) |
|
| Standard
PLND | 83 (27.04) | 12 (10.00) | 71 (37.97) |
|
| Initial PSA,
ng/ml | 23.93
(12.54-37.54) | 29.66
(17.79-45.19) | 21.00
(10.10-30.99) | <0.001 |
| Initial Gleason
grade |
|
|
| <0.001 |
| ≤6 | 50 (16.29) | 8 (6.67) | 42 (22.46) |
|
|
3+4=7 | 57 (18.57) | 9 (7.50) | 48 (25.67) |
|
|
4+3=7 | 36 (11.73) | 13 (10.83) | 23 (12.30) |
|
| 8 | 70 (22.80) | 29 (24.17) | 41 (21.93) |
|
| 9 or
10 | 94 (30.62) | 61 (50.83) | 33 (17.65) |
|
| Postoperative Gleason
grade |
|
|
| <0.001 |
| ≤6 | 18 (5.88) | 4 (3.36) | 14 (7.49) |
|
|
3+4=7 | 92 (30.07) | 19 (15.97) | 73 (39.04) |
|
|
4+3=7 | 82 (26.80) | 28 (23.53) | 54 (28.88) |
|
| 8 | 27 (8.82) | 13 (10.92) | 14 (7.49) |
|
| 9 or
10 | 87 (28.43) | 55 (46.22) | 32 (17.11) |
|
|
Unknown | 1 | 1 | 0 |
|
| PSA density,
ng/ml2 | 0.54 (0.29-1.00) | 0.74
(0.38-1.20) | 0.48
(0.24-0.80) | <0.001 |
| Pathological tumor
percentage | 25.0
(10.0-45.0) | 35.0
(15.0-67.5) | 20.0
(10.0-40.0) | <0.001 |
| Imaging stage |
|
|
| <0.001 |
|
T2bN0M0, T2cN0M0 | 128 (41.69) | 17 (14.17) | 111 (59.36) |
|
|
T3aN0M0 | 79 (25.73) | 46 (38.33) | 33 (17.65) |
|
|
T3bN0M0 | 89 (28.99) | 48 (40.00) | 41 (21.93) |
|
| Any
N1 | 11 (3.58) | 9 (7.50) | 2 (1.07) |
|
| Pathologic
stage |
|
|
| <0.001 |
|
T2aN0M0, T2bN0M0 | 90 (29.32) | 17 (14.17) | 73 (39.04) |
|
|
T3aN0M0 | 85 (27.69) | 26 (21.67) | 59 (31.55) |
|
|
T3bN0M0 | 87 (28.34) | 46 (38.33) | 41 (21.93) |
|
| Any
N1 | 45 (14.66) | 31 (25.83) | 14 (7.49) |
|
Comparisons of the clinical outcomes between the
very high-risk and high-risk groups are presented in Table II. In the very high-risk group, the
BCR rates in the patients with undetectable PSA (52.70 vs. 30.00%;
P=0.001) and postoperative detectable PSA (38.33 vs. 19.79%;
P=0.004) were higher than the respective rates in the high-risk
group. Furthermore, fewer patients did not receive salvage therapy
(19.61 vs. 46.31%; P<0.001) and fewer patients were receiving
continence medication 4 and 12 weeks after Foley catheter removal
(37.82 vs. 41.94% and 50.42 vs. 53.76%; P=0.048) in the very
high-risk group compared with the high-risk group.
| Table II.Associations of outcomes with very
high-risk and high-risk prostate cancer. |
Table II.
Associations of outcomes with very
high-risk and high-risk prostate cancer.
| Outcome | Total, n=307 | Very high risk,
n=120 | High risk,
n=187 | P-value |
|---|
| BCR in patients
with undetectable PSA |
|
|
| 0.001 |
| No | 140 (62.50) | 35 (47.30) | 105 (70.00) |
|
|
Yes | 84 (37.50) | 39 (52.70) | 45 (30.00) |
|
|
Excluded | 83 | 46 | 37 |
|
| Time to BCR,
years | 1.11
(0.80-2.08) | 1.03
(0.63-1.79) | 1.25
(0.87-2.20) | 0.074 |
| Time to BCR,
years |
|
|
| 0.157 |
|
>1 | 52 (61.90) | 21 (53.85) | 31 (68.89) |
|
|
<1 | 32 (38.10) | 18 (46.15) | 14 (31.11) |
|
| Postoperative
detectable PSA |
|
|
| 0.004 |
| No | 224 (72.96) | 74 (61.67) | 150 (80.21) |
|
|
Yes | 83 (27.04) | 46 (38.33) | 37 (19.79) |
|
| Post-salvage
therapy disease control |
|
|
| 0.492a |
| No | 8 (5.00) | 3 (3.70) | 5 (6.33) |
|
|
Yes | 152 (95.00) | 78 (96.30) | 74 (93.67) |
|
|
Unknown | 147 | 39 | 108 |
|
| Salvage
therapy |
|
|
| <0.001 |
| No | 89 (35.46) | 20 (19.61) | 69 (46.31) |
|
|
Radiotherapy | 44 (17.53) | 22 (21.57) | 22 (14.77) |
|
|
Antiandrogen | 38 (15.14) | 15 (14.71) | 23 (15.44) |
|
|
ADT | 80 (31.87) | 45 (44.12) | 35 (23.49) |
|
|
Unknown | 56 | 18 | 38 |
|
| Receiving
continence medicationb |
|
|
| 0.048 |
| 4 weeks
(after Foley removal) | 123 (40.33) | 45 (37.82) | 78 (41.94) |
|
| 12
weeks (after Foley removal) | 160 (52.46) | 60 (50.42) | 100 (53.76) |
|
| >12
months | 22 (7.21) | 14 (11.76) | 8 (4.3) |
|
|
Unknown | 1 | 1 | 0 |
|
| Sexual
intercoursec |
|
|
| 0.182 |
|
Impotent | 231 (75.74) | 95 (79.83) | 136 (73.12) |
|
|
Potent | 74 (24.26) | 24 (20.17) | 50 (26.88) |
|
|
Unknown | 1 | 1 | 0 |
|
Risk factors of BCR
The results of univariate and multivariate Cox
proportional hazards regression analysis of BCR are shown in
Table III. A total of 224
patients had undetectable PSA. Univariate analysis showed that
patients in the very high-risk group had a 2.13-fold risk of BCR
compared with those in the high-risk group (95% CI, 1.38-3.27;
P=0.001), with a significant difference between the two groups.
Significant differences were also detected in other variables,
including extended PLND, PSA density, pathological tumor
percentage, imaging stage and pathologic stage between the two
groups [all P<0.001, with the exception of PSA density (P=0.003)
and imaging stage any N1 vs. T2bN0M0/T2cN0M0 (P=0.014)]. After
adjusting for other covariates, the PSA density [adjusted HR (aHR),
1.46, 95% CI, 1.01-2.39; P=0.042], pathological tumor percentage
(aHR, 1.02, 95% CI, 1.01-1.23; P<0.001), imaging stage (T3aN0M0
vs. T2bN0M0/T2cN0M0: aHR, 1.96, 95% CI, 1.01-3.79; P=0.047; T3bN0M0
vs. T2bN0M0/T2cN0M0: aHR, 2.59, 95% CI, 1.12-6.01; P=0.026) and
pathologic stage (any N1 vs. T2aN0M0/T2bN0M0: aHR, 3.21, 95% CI,
1.25-8.23; P=0.015) remained significantly associated with BCR.
However, no significant difference in BCR was found between the two
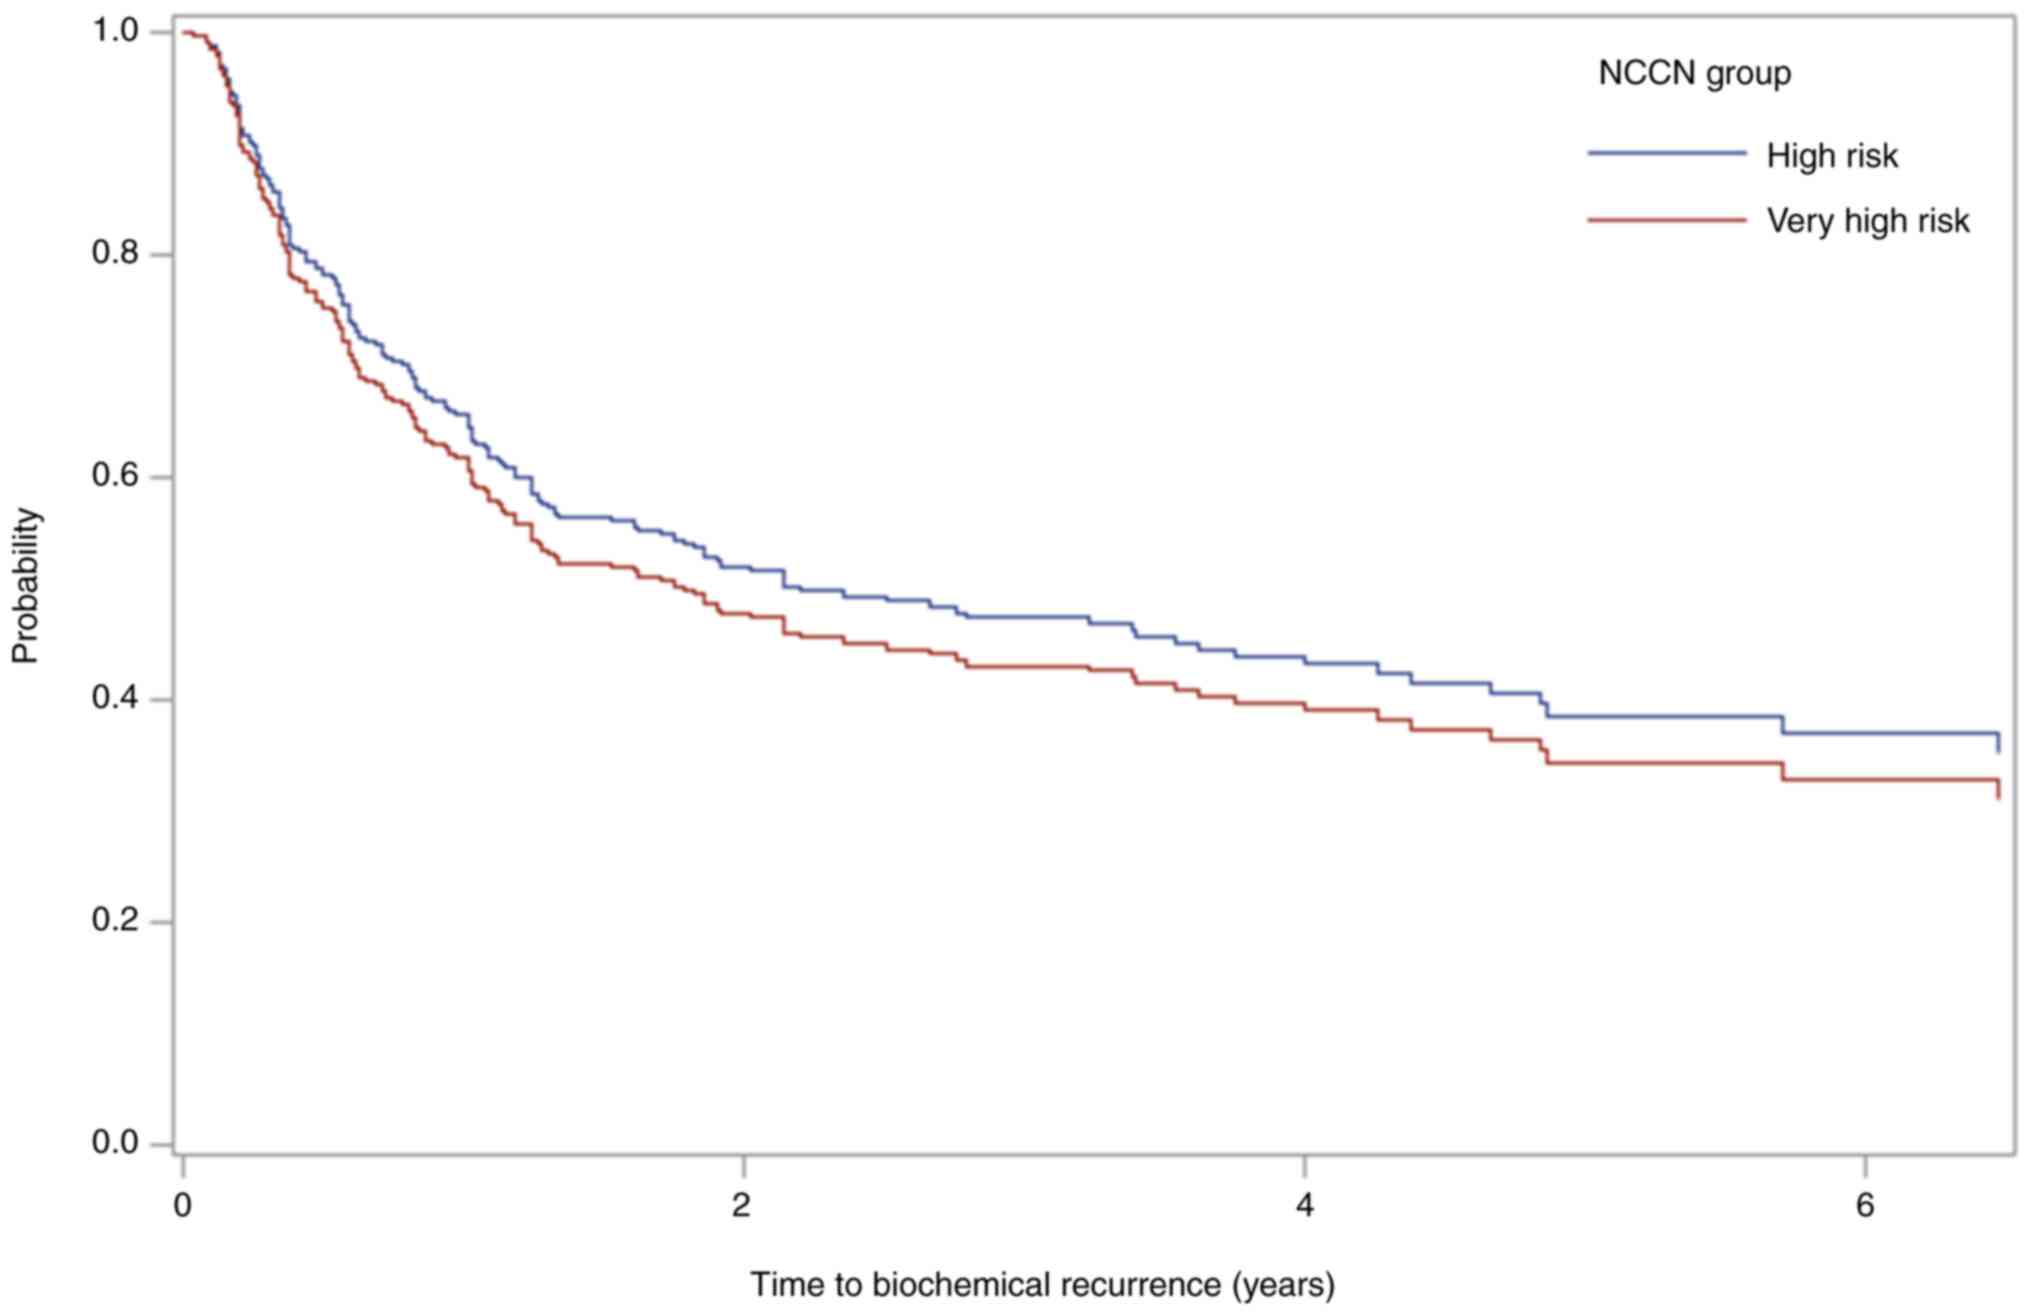
NCCN risk groups (aHR, 1.25; 95%CI, 0.76-2.92; P=0.372). The
BCR-free survival curve based on the multivariate model is shown in
Fig. 1. The median BCR-free
survival for patients in the very high-risk group was 3.62 years;
however, the high-risk group had a higher survival rate than the
very high-risk group. The medium BCR-free survival for patients in
the high-risk group was 4.66 years.
| Table III.Univariate and adjusted HRs for BCR
in the high-risk and very high-risk groups of patients with
undetectable PSA. |
Table III.
Univariate and adjusted HRs for BCR
in the high-risk and very high-risk groups of patients with
undetectable PSA.
| Variable | Univariate HR (95%
CI) | P-value | Adjusted HR (95%
CI) | P-value |
|---|
| NCCN group, very
high-risk (vs. high-risk) | 2.13
(1.38-3.27) | 0.001 | 1.25
(0.76-2.92) | 0.372 |
| Age | 1.01
(0.97-1.44) | 0.711 | 1.00
(0.96-1.94) | 0.874 |
| Surgery type, LRP
(vs. RALP/RARP/RALRP) | 1.53
(0.87-2.67) | 0.138 | 1.02
(0.56-1.86) | 0.952 |
| PLND, extended PLND
(vs. standard PLND) | 2.45
(1.42-4.24) | 0.001 | 1.20
(0.66-2.19) | 0.549 |
| PSA density | 1.51
(1.15-1.97) | 0.003 | 1.46
(1.01-2.39) | 0.042 |
| Pathological tumor
percentage | 1.03
(1.02-1.14) | <0.001 | 1.02
(1.01-1.23) | <0.001 |
| Imaging stage (vs.
T2bN0M0/T2cN0M0) |
|
|
|
|
|
T3aN0M0 | 3.22
(1.79-5.79) | <0.001 | 1.96
(1.01-3.79) | 0.047 |
|
T3bN0M0 | 6.35
(3.61-11.17) | <0.001 | 2.59
(1.12-6.01) | 0.026 |
| Any
N1 | 4.59
(1.35-15.58) | 0.014 | 1.45
(0.36-5.89) | 0.602 |
| Pathologic stage
(vs. T2aN0M0/T2bN0M0) |
|
|
|
|
|
T3aN0M0 | 3.35
(1.73-6.51) | <0.001 | 1.64
(0.78-3.45) | 0.194 |
|
T3bN0M0 | 5.96
(3.07-11.57) | <0.001 | 1.80
(0.68-4.77) | 0.232 |
| Any
N1 | 8.93
(4.24-18.81) | <0.001 | 3.21
(1.25-8.23) | 0.015 |
Table IV presents
the results of the univariate and multivariate logistic regression
analysis of postoperatively detectable PSA. The analysis of the
NCCN-defined very high-risk group vs. the high-risk group showed
statistical significance for postoperatively detectable PSA but
only prior to adjustment for other covariates [OR: 2.52, 95% CI:
1.51-4.22; P<0.001; adjusted OR (aOR): 1.31, 95% CI: 0.68-2.50,
P=0.419]. Other variables were also associated with this outcome,
including extended PLND, PSA density, pathological tumor
percentage, imaging stage and pathologic stage. Following
adjustment for other covariates, the pathological tumor percentage
(aOR, 1.03, 95% CI, 1.02-1.04; P<0.001) and higher pathologic
stage (T3bN0M0 vs. T2aN0M0/T2bN0M0: aOR, 3.66, 95% CI, 1.14-11.70;
P=0.029; any N1 vs. T2aN0M0/T2bN0M0: aOR, 4.47, 95% CI, 1.29-15.44;
P=0.018) maintained their association with a significantly higher
risk of postoperatively detectable PSA. Notably, the univariate OR
for postoperatively detectable PSA in the very high-risk group was
significantly different compared with that of the high-risk group
(P<0.001).
| Table IV.Univariate and adjusted ORs for
postoperatively detectable PSA levels in the high-risk and very
high-risk groups. |
Table IV.
Univariate and adjusted ORs for
postoperatively detectable PSA levels in the high-risk and very
high-risk groups.
| Variable | Univariate OR (95%
CI) | P-value | Adjusted OR (95%
CI) | P-value |
|---|
| NCCN group, very
high-risk (vs. high-risk) | 2.52
(1.51-4.22) | <0.001 | 1.31
(0.68-2.50) | 0.419 |
| Age | 1.01
(0.97-1.04) | 0.764 | 1.01
(0.97-1.05) | 0.677 |
| Surgery type, LRP
(vs. RALP/RARP/RALRP) | 1.14
(0.55-2.35) | 0.730 | 0.93
(0.40-2.17) | 0.863 |
| PLND, extended PLND
(vs. standard PLND) | 2.45
(1.27-4.72) | 0.008 | 1.25
(0.57-2.73) | 0.582 |
| PSA density | 1.57
(1.13-2.18) | 0.008 | 1.43
(1.00-2.05) | 0.052 |
| Pathological tumor
percentage | 1.03
(1.02-1.05) | <0.001 | 1.03
(1.02-1.04) | <0.001 |
| Imaging stage (vs.
T2bN0M0/T2cN0M0) |
|
|
|
|
|
T3aN0M0 | 2.22
(1.12-4.38) | 0.022 | 0.78
(0.31-1.94) | 0.587 |
|
T3bN0M0 | 3.34
(1.76-6.34) | <0.001 | 0.52
(0.18-1.51) | 0.227 |
| Any
N1 | 6.48
(1.80-23.29) | 0.004 | 0.81
(0.15-4.46) | 0.807 |
| Pathologic stage
(vs. T2aN0M0/T2bN0M0) |
|
|
|
|
|
T3aN0M0 | 2.42
(1.02-5.73) | 0.045 | 1.50
(0.57-3.94) | 0.414 |
|
T3bN0M0 | 5.50
(2.44-12.41) | <0.001 | 3.66
(1.14-11.70) | 0.029 |
| Any
N1 | 9.41
(3.81-23.22) | <0.001 | 4.47
(1.29-15.44) | 0.018 |
Univariate and multivariate logistic regression
analyses of the disease control rate after salvage therapy are
shown in Table V. A total of 162
patients were included in this analysis. As the number of patients
in imaging stage T3bN0M0 and any N1 was small, the two groups were
combined for analysis. None of the analyzed variables showed
significant associations in univariate and adjusted ORs between
groups. The univariate and multivariate logistic regression
analysis for time to BCR <1-year is shown in Table VI. A total of 84 patients were
included in this analysis. No significant associations were found
between these variables and BCR within 1 year (Table VI).
| Table V.Univariate and adjusted ORs for
disease control after salvage therapy in the high-risk and very
high-risk groups. |
Table V.
Univariate and adjusted ORs for
disease control after salvage therapy in the high-risk and very
high-risk groups.
| Variable | Univariate OR (95%
CI) | P-value | Adjusted OR (95%
CI) | P-value |
|---|
| NCCN group, very
high-risk (vs. high-risk) | 1.76
(0.41-7.61) | 0.451 | 1.17
(0.19-7.26) | 0.869 |
| Age | 0.99
(0.89-1.09) | 0.793 | 0.99
(0.89-1.11) | 0.903 |
| Surgery type, LRP
(vs. RALP/RARP/RALRP) | 1.38
(0.16-11.69) | 0.769 | 1.26
(0.12-12.99) | 0.846 |
| PLND, extended PLND
(vs. standard PLND) | 3.05
(0.68-13.58) | 0.144 | 2.18
(0.35-13.42) | 0.403 |
| PSA density | 2.57
(0.51-13.02) | 0.254 | 2.66
(0.44-16.12) | 0.287 |
| Pathological tumor
percentage | 1.01
(0.98-1.04) | 0.464 | 1.00
(0.97-1.04) | 0.937 |
| Imaging stage (vs.
T2bN0M0/T2cN0M0) |
|
|
|
|
|
T3aN0M0 | 0.65
(0.11-3.74) | 0.627 | 0.29
(0.04-2.17) | 0.230 |
| T3bN0M0
+ Any N1 | 2.18
(0.29-16.11) | 0.446 | 0.69
(0.03-14.18) | 0.810 |
| Pathologic stage
(vs. T2aN0M0/T2bN0M0) |
|
|
|
|
|
T3aN0M0 | 1.33
(0.21-8.67) | 0.763 | 1.67
(0.18-15.69) | 0.653 |
|
T3bN0M0 | 6.00
(0.52-69.95) | 0.153 | 7.83
(0.33-184.40) | 0.202 |
| Any
N1 | 2.00
(0.26-15.32) | 0.505 | 1.60
(0.07-37.95) | 0.772 |
| Table VI.Univariate analysis and adjusted ORs
for a time to BCR of <1 year in patients with BCR. |
Table VI.
Univariate analysis and adjusted ORs
for a time to BCR of <1 year in patients with BCR.
| Variable | Univariate OR (95%
CI) | P-value | Adjusted OR (95%
CI) | P-value |
|---|
| NCCN group, very
high-risk (vs. high-risk) | 1.90
(0.78-4.63) | 0.159 | 1.17
(0.39-3.47) | 0.780 |
| Age | 1.00
(0.94-1.06) | 0.875 | 1.00
(0.93-1.08) | 0.981 |
| Surgery type, LRP
(vs. RALP/RARP/RALRP) | 0.78
(0.24-2.53) | 0.676 | 0.51
(0.14-1.89) | 0.315 |
| PLND, extended PLND
(vs. standard PLND) | 3.22
(0.84-12.36) | 0.088 | 2.73
(0.56-13.27) | 0.214 |
| PSA density | 1.73
(0.84-3.57) | 0.139 | 1.67
(0.74-3.81) | 0.219 |
| Pathological tumor
percentage | 1.01
(1.00-1.03) | 0.129 | 1.01
(0.99-1.03) | 0.343 |
| Imaging stage (vs.
T2bN0M0/T2cN0M0) |
|
|
|
|
|
T3aN0M0 | 3.48
(0.92-13.25) | 0.067 | 1.80
(0.38-8.56) | 0.460 |
|
T3bN0M0 | 2.50
(0.69-9.12) | 0.165 | 0.62
(0.09-4.25) | 0.624 |
| Any
N1 | 1.88
(0.13-26.32) | 0.641 | 0.36
(0.01-10.28) | 0.549 |
| Pathologic stage
(vs. T2aN0M0/T2bN0M0) |
|
|
|
|
|
T3aN0M0 | 3.24
(0.59-17.66) | 0.175 | 3.26
(0.47-22.43) | 0.231 |
|
T3bN0M0 | 4.77
(0.89-25.56) | 0.068 | 6.39
(0.63-65.25) | 0.118 |
| Any
N1 | 4.28
(0.71-25.91) | 0.114 | 6.19
(0.56-68.83) | 0.138 |
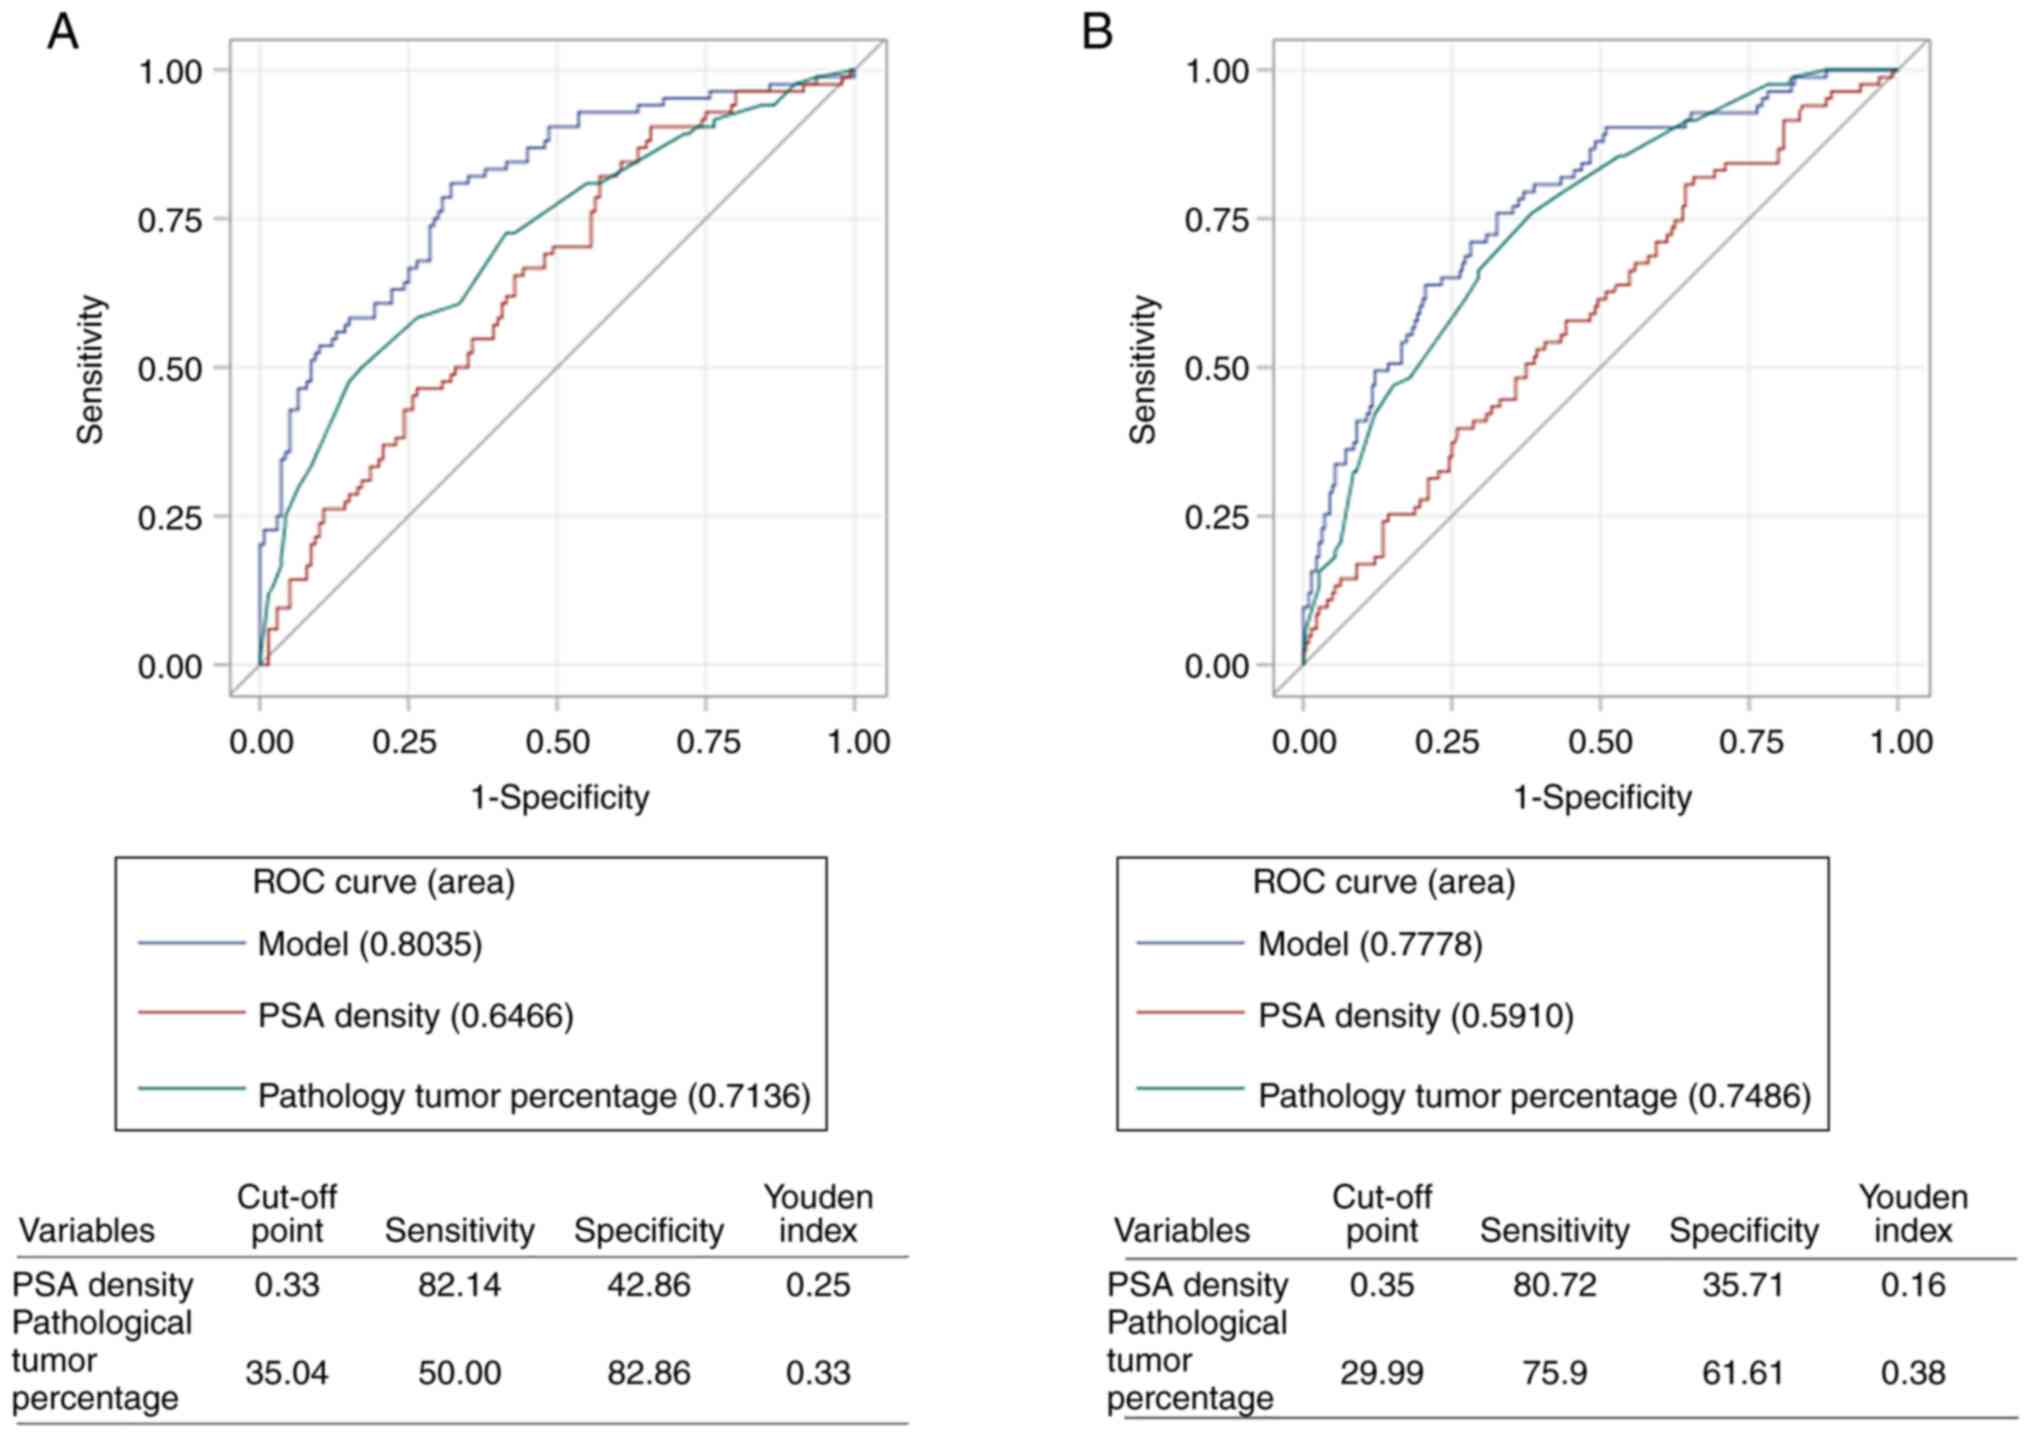
ROC curves were constructed for BCR and
postoperative detectable PSA level, and the cut-off points of the
full model were calculated, along with those for PSA density and
the pathological tumor percentage (Fig.
2). The AUC of the full model (AUC: 0.80, 95% CI: 0.74-0.86)
was significantly higher than those of PSA density (AUC: 0.65, 95%
CI: 0.57-0.72; P<0.001) and pathological tumor percentage (AUC:
0.71, 95% CI: 0.64-0.78; P=0.002) for BCR. The cut-off points for
PSA density and pathological tumor percentage were 0.33 and 35.04,
respectively. The AUC and 95% CI of the full model, PSA density and
pathological tumor percentage for postoperative detectable PSA
levels were 0.78 (0.72-0.84), 0.59 (0.52-0.66) and 0.75
(0.69-0.81), respectively. No significant difference was found in
the AUC between the full model and pathological tumor percentage
(P=0.12), whereas the full model had a higher AUC than the PSA
density (P<0.001). The cut-off points for PSA density and
pathological tumor percentage were 0.35 and 29.99,
respectively.
Discussion
The present study evaluated the outcomes of patients
defined as high risk and very high risk after radical prostatectomy
according to the NCCN guidelines, and found that patients in the
very high-risk category displayed lower BCR-free survival than
those in the high-risk category, and that patients with
undetectable PSA had a high risk of BCR and detectable PSA levels
postoperatively. Therefore, the patients were re-stratified to
identify further criteria that may help in the screening of
patients who are suitable for radical prostatectomy. The results of
the present study suggest that NCCN-defined high-risk patients with
pathologic stage T3bN0M0 have a high risk of BCR <1 year, which
signals to urologists that radical prostatectomy should be
considered as a salvage therapy option for disease control.
The present study also found that in patients in the
NCCN-defined high-risk and very high-risk categories, BCR was
associated with PSA density, imaging stage T3aN0M0 and T3bN0M0, and
pathologic stage any N1, while pathologic stage T3bN0M0 and any N1
were associated with postoperatively detectable PSA. In the
literature, the independent risk factors associated with BCR among
high-risk patients include pathological Gleason score ≥8 (15–18),
postoperative positive surgical margins (15), initial PSA value (16), seminal vesicle invasion (17), >50% positive cores (18) and several risk factors (15,18).
In addition, another study showed via multivariate analysis that
high preoperative PSA levels, Gleason score ≥7, lymph node invasion
and positive margins were associated with early and late BCR
(19). These findings indicate that
NCCN-defined high-risk patients with a Gleason score ≥7 deserve
merit attention from urologists regarding follow-up strategies,
regardless of their postoperative PSA values. It must be noted that
patients at very high-risk according to the NCCN guidelines are not
good candidates for radical prostatectomy because of the relatively
short time to the onset of BCR. However, patients categorized as
high-risk could potentially benefit from radical prostatectomy due
to tolerable trifecta results.
The rate of BCR <1 year in the high-risk and very
high-risk patients in the present study was 54% (167/307), which is
comparable with the reported rate of 47.5% (6). An early BCR occurring <1 year after
radical prostatectomy has been regarded as a predictor of
metastatic progression and prostate cancer mortality (6–9), so is
therefore worthy of particular attention. However, none of the
variables included in the present study was found to be associated
with BCR <1 year after surgery, and no associations were noted
between surgery type, PLND status and BCR. The therapeutic value of
PLND status with regard to BCR remains controversial in the
literature. Cao et al (20)
found no significant differences between laparoscopic radical
prostatectomy, robotic-assisted radical prostatectomy and open
radical prostatectomy in postoperative BCR and overall complication
rates. Preisser et al (21)
reported that extended PLND had no significant effect on
oncological outcomes in high-risk patients (21). However, lymph node invasion is
associated with BCR <1 year after surgery (6). Further prospective, randomized studies
are required to clarify the extent of node dissection that is
necessary for satisfactory oncological outcomes.
A previous study outlined the current state of
evidence for prostate cancer screening and early detection and
summarized the recent recommendations of various guidelines
(22). It reviewed the global
public health burden and risk factors for prostate cancer with
clinical implications as a screening tool, along with screening,
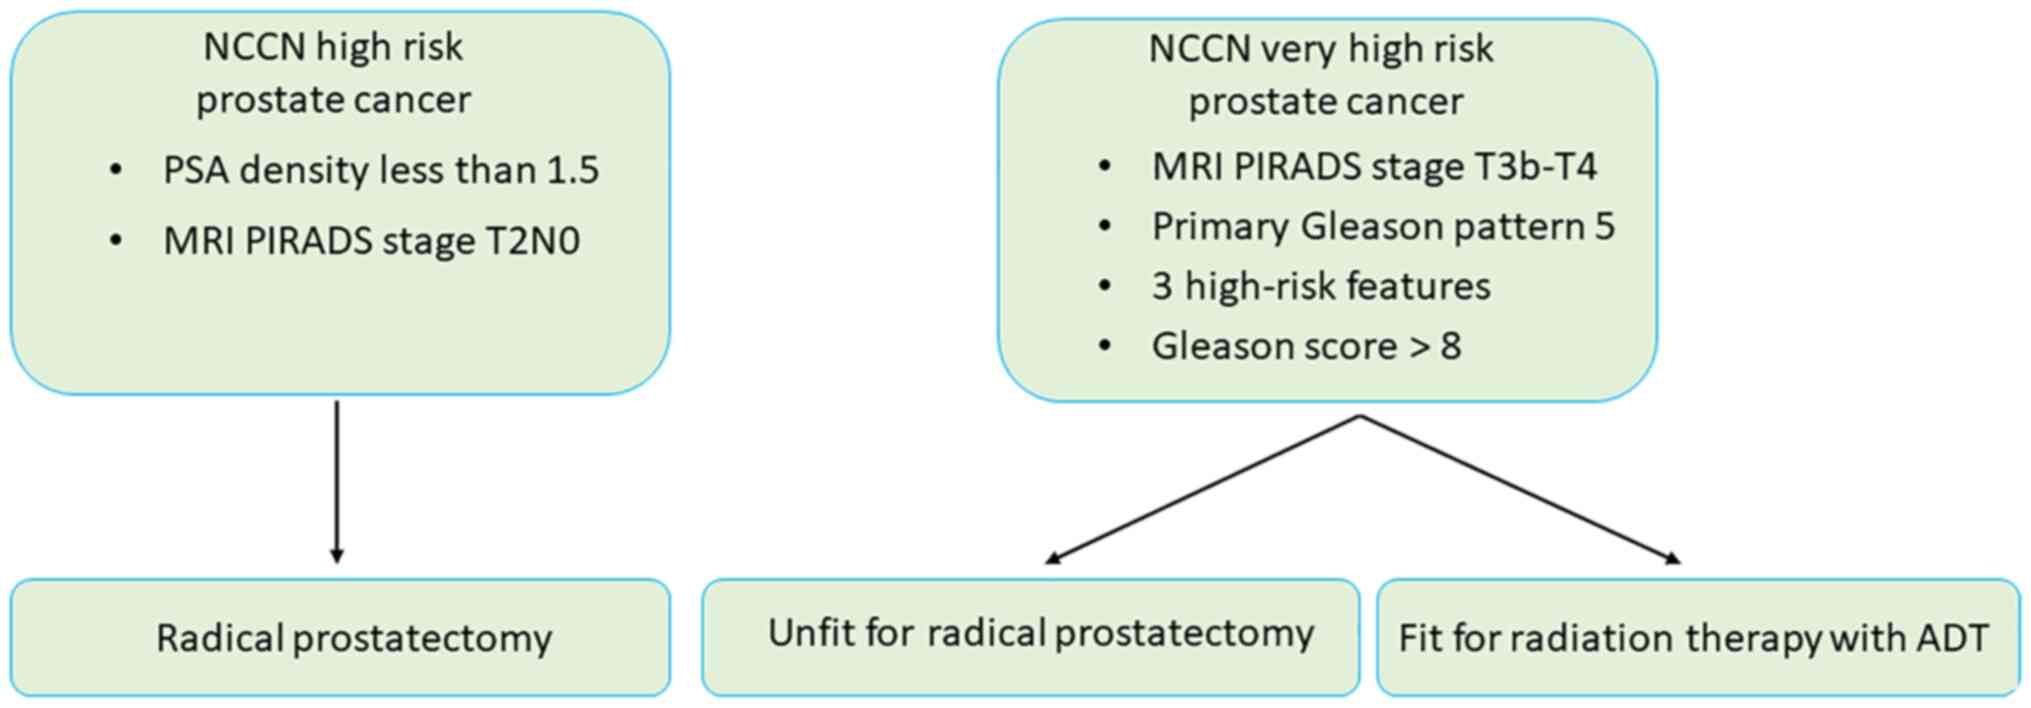
novel biomarkers and magnetic resonance imaging (22). By contrast, the present study
outlines key practice points for primary care physicians and
provides a simple model to facilitate shared decision-making
conversations. A decision tree for use as a diagnostic model for
high-risk and very high-risk prostate cancer is provided in
Fig. 3.
The present study has several limitations. First, it
is a retrospective study with inherent limitations such as only
certain variables being available, restriction to a given time
period that rules out long-term follow-up, and the possible
existence of bias. Second, the database was derived from a single
center with a relatively small sample size, which may not allow the
results to be generalized to other populations or locations. The
imaging stages may also be variable because the MRI images were
interpreted by different radiologists.
In conclusion, after radical prostatectomy, patients
defined as very high-risk according to the NCCN guidelines have low
BCR-free survival and patients with undetectable PSA have a high
risk of BCR. Preoperative MRI imaging stage T3aN0M0 and T3bN0M0 and
pathologic stage any N1 have a higher risk of BCR after
prostatectomy, and PSA density predicts short-term BCR after
prostatectomy. These findings may help in the screening of patients
to identify those requiring active therapeutic protocols.
Acknowledgements
The authors would like to thank Ms. Szu-Han Ho
(Department of Surgery, Division of Urology at Taichung Veterans
General Hospital, Taichung, Taiwan) for assisting with data
curation.
Funding
Funding: No funding was received.
Availability of data and materials
The datasets used and/or analyzed during the current
study are available from the corresponding author on reasonable
request.
Authors' contributions
CKY, CRY, CLC, HCH, KYC, SSW, CCC, SCW, CYL and SCH
contributed to the conception and design of the study, and drafting
the manuscript. YCO and JRL contributed to the conception and
design of the study, acquisition of data and drafting the
manuscript. CSC contributed to the conception and design of the
study, drafting the manuscript and clinical analysis. CFH
contributed to the conception and design of the study, acquisition
of data, drafting and critical revision of the manuscript, and
clinical analysis. CKY and CYL confirm the authenticity of the raw
data. All authors read and approved the final version of the
manuscript.
Ethics approval and consent to
participate
The study protocol was approved by Institutional
Review Board I&II of Taichung Veterans General Hospital (ref.
no. CE21174A) and was carried out according to the approved
guidelines. No informed consent was required because the data were
analyzed anonymously and no identifying information associated with
the participants was included.
Patient consent for publication
Not applicable.
Competing interests
The authors declare that they have no competing
interests.
References
|
1
|
Wang L, Lu B, He M, Wang Y, Wang Z and Du
L: Prostate cancer incidence and mortality: Global status and
temporal trends in 89 countries from 2000 to 2019. Front Public
Health. 10:8110442022. View Article : Google Scholar : PubMed/NCBI
|
|
2
|
Boorjian SA, Eastham JA, Graefen M,
Guillonneau B, Karnes RJ, Moul JW, Schaeffer EM, Stief C and Zorn
KC: A critical analysis of the long-term impact of radical
prostatectomy on cancer control and function outcomes. Eur Urol.
61:664–675. 2012. View Article : Google Scholar : PubMed/NCBI
|
|
3
|
Van den Broeck T, van den Bergh RCN, Arfi
N, Gross T, Moris L, Briers E, Cumberbatch M, De Santis M, Tilki D,
Fanti S, et al: Prognostic value of biochemical recurrence
following treatment with curative intent for prostate cancer: A
systematic review. Eur Urol. 75:967–987. 2019. View Article : Google Scholar : PubMed/NCBI
|
|
4
|
Kasuya G, Ishikawa H, Tsuji H, Nomiya T,
Makishima H, Kamada T, Akakura K, Suzuki H, Shimazaki J, Haruyama
Y, et al: Significant impact of biochemical recurrence on overall
mortality in patients with high–risk prostate cancer after
carbon–ion radiotherapy combined with androgen deprivation therapy.
Cancer. 122:3225–3231. 2016. View Article : Google Scholar : PubMed/NCBI
|
|
5
|
Freedland SJ, Humphreys EB, Mangold LA,
Eisenberger M, Dorey FJ, Walsh PC and Partin AW: Risk of prostate
cancer–specific mortality following biochemical recurrence after
radical prostatectomy. JAMA. 294:433–439. 2005. View Article : Google Scholar : PubMed/NCBI
|
|
6
|
Venclovas Z, Stanionis M, Matjosaitis AJ
and Milonas D: Significance of time until PSA recurrence on
clinical progression of surgically treated high-risk prostate
cancer patients. Eur Urol Suppl.
18:e206910.1016/S1569-9056(19)31500-3. 2019. View Article : Google Scholar
|
|
7
|
Pak S, You D, Jeong IG, Kim YS, Hong JH,
Kim CS and Ahn H: Time to biochemical relapse after radical
prostatectomy and efficacy of salvage radiotherapy in patients with
prostate cancer. Int J Clin Oncol. 24:1238–1246. 2019. View Article : Google Scholar : PubMed/NCBI
|
|
8
|
Briganti A, Karnes RJ, Gandaglia G, Spahn
M, Gontero P, Tosco L, Kneitz B, Chun FK, Zaffuto E, Sun M, et al:
Natural history of surgically treated high-risk prostate cancer.
Urol Oncol. 33:163.e7–13. 2015. View Article : Google Scholar : PubMed/NCBI
|
|
9
|
Pompe RS, Gild P, Karakiewicz PI, Bock LP,
Schlomm T, Steuber T, Graefen M, Huland H, Tian Z and Tilki D:
Long-term cancer control outcomes in patients with biochemical
recurrence and the impact of time from radical prostatectomy to
biochemical recurrence. Prostate. 78:676–681. 2018. View Article : Google Scholar : PubMed/NCBI
|
|
10
|
Garg H, Dursun F, Alsayegh F, Wang H, Wu
S, Liss MA, Kaushik D, Svatek RS and Mansour AM: Revisiting current
national comprehensive cancer network (NCCN) high-risk prostate
cancer stratification: A national cancer database analysis.
Prostate Cancer Prostatic Dis. 14:10.1038/s41391–022-00621-7.
2023.
|
|
11
|
Turkbey B, Rosenkrantz AB, Haider MA,
Padhani AR, Villeirs G, Macura KJ, Tempany CM, Choyke PL, Cornud F,
Margolis DJ, et al: Prostate imaging reporting and data system
version 2.1: 2019 Update of prostate imaging reporting and data
system version 2. Eur Urol. 76:340–351. 2019. View Article : Google Scholar : PubMed/NCBI
|
|
12
|
Buyyounouski MK, Choyke PL, McKenney JK,
Sartor O, Sandler HM, Amin MB, Kattan MW and Lin DW: Prostate
cancer-major changes in the American Joint Committee on Cancer
eighth edition cancer staging manual. CA Cancer J Clin. 67:245–253.
2017. View Article : Google Scholar : PubMed/NCBI
|
|
13
|
Vollmer RT: Percentage of tumor in
prostatectomy specimens: A study of American Veterans. Am J Clin
Pathol. 131:86–91. 2009. View Article : Google Scholar : PubMed/NCBI
|
|
14
|
Ito Y, Udo K, Vertosick EA, Sjoberg DD,
Vickers AJ, Al-Ahmadie HA, Chen YB, Gopalan A, Sirintrapun SJ,
Tickoo SK, et al: Clinical usefulness of prostate and tumor volume
related parameters following radical prostatectomy for localized
prostate cancer. J Urol. 201:535–540. 2019. View Article : Google Scholar : PubMed/NCBI
|
|
15
|
Otsuka M, Kamasako T, Uemura T, Takeshita
N, Shinozaki T, Kobayashi M, Komaru A and Fukasawa S: Factors
predicting biochemical recurrence after radical prostatectomy among
patients with clinical T3 prostate cancer. Jpn J Clin Oncol.
48:760–764. 2018. View Article : Google Scholar : PubMed/NCBI
|
|
16
|
Murata Y, Tatsugami K, Yoshikawa M,
Hamaguchi M, Yamada S, Hayakawa Y, Ueda K, Momosaki S and Sakamoto
N: Predictive factor of biochemical recurrence after radical
prostatectomy for high–risk prostate cancer. Int J Urol.
25:284–289. 2018. View Article : Google Scholar : PubMed/NCBI
|
|
17
|
Nkengurutse G, Tian F, Jiang S, Wang Q,
Wang Y and Sun W: Preoperative predictors of biochemical
recurrence–free survival in high–risk prostate cancer following
radical prostatectomy. Front Oncol. 10:17612020. View Article : Google Scholar : PubMed/NCBI
|
|
18
|
Lee KS, Koo KC, Choi IY, Lee JY, Hong JH,
Kim CS, Lee HM, Hong SK, Byun SS, Rha KH and Chung BH:
Re–stratification of patients with high–risk prostate cancer
according to the NCCN guidelines among patients who underwent
radical prostatectomy: An analysis based on the K–CaP registry.
Cancer Res Treat. 50:88–94. 2018. View Article : Google Scholar : PubMed/NCBI
|
|
19
|
García-Barreras S, Nunes I, Srougi V,
Secin F, Baghdadi M, Sánchez-Salas R, Barret E, Rozet F, Galiano M
and Cathelineau X: Predictors of early, intermediate and late
biochemical recurrence after minimally invasive radical
prostatectomy in a single–centre cohort with a mean follow–up of 8
years. Actas Urol Esp (Engl Ed). 42:516–523. 2018.(In English,
Spanish). View Article : Google Scholar : PubMed/NCBI
|
|
20
|
Cao L, Yang Z, Qi L and Chen M:
Robot–assisted and laparoscopic vs open radical prostatectomy in
clinically localized prostate cancer: Perioperative, functional,
and oncological outcomes: A Systematic review and meta–analysis.
Medicine (Baltimore). 98:e157702019. View Article : Google Scholar : PubMed/NCBI
|
|
21
|
Preisser F, van den Bergh RCN, Gandaglia
G, Ost P, Surcel CI, Sooriakumaran P, Montorsi F, Graefen M, van
der Poel H, de la Taille A, et al: Effect of extended pelvic lymph
node dissection on oncologic outcomes in patients with D'Amico
intermediate and high risk prostate cancer treated with radical
prostatectomy: A multi–institutional study. J Urol. 203:338–343.
2020. View Article : Google Scholar : PubMed/NCBI
|
|
22
|
Lee CU, Lee SM, Chung JH, Kang M, Sung HH,
Jeon HG, Jeong BC, Seo SI, Jeon SS, Lee HM and Song W: Clinical
utility of prostate health index for diagnosis of prostate cancer
in patients with PI-RADS 3 lesions. Cancers (Basel). 14:41742022.
View Article : Google Scholar : PubMed/NCBI
|