Introduction
Breast cancer remains a significant health issue
among women. It is the most common malignancy and is as the second
leading cause of cancer-related deaths in this population (1). Breast cancer is notably diverse,
leading to its classification into four main molecular subtypes for
clinical relevance: Luminal A, luminal B, human epidermal growth
factor receptor 2 (HER2)+ and triple-negative, based on
the presence or absence of estrogen receptor (ER), progesterone
receptor (PR) and HER2 (2).
HER2+ breast cancer, which accounts for 15–20% of all
breast cancer cases, is characterized by the overexpression of HER2
and the lack of ER and PR expression (2,3). This
subtype is associated with more aggressive tumor growth, a higher
likelihood of metastasis and recurrence, and ultimately, a less
favorable outcome (4). Identifying
precise biomarkers for the early detection and prognosis of
HER2+ breast cancer is imperative for improving patient
outcomes.
Long non-coding (lnc)RNAs are RNA transcripts
>200 nucleotides long that lack protein-coding potential
(5). Typically, lncRNAs are linear
RNA molecules characterized by the presence of a 5′ cap or 3′
poly-A tail (6). They are
recognized for their diverse roles in biological processes such as
gene expression regulation, RNA splicing, micro (mi)RNA modulation
and protein folding (7). The
best-known function of lncRNAs is their ability to modulate gene
expression by acting as miRNA sponges and influencing the binding
of transcription factors to promoters, whilst also forming
scaffolding complexes with effector molecules to regulate the
activation or silencing of target genes (8). Numerous studies have reported the
impact of lncRNAs on several aspects of breast cancer, encompassing
their regulatory roles in the proliferation, invasion, metastasis
and apoptosis of breast cancer cells (9–11).
Furthermore, lncRNAs are involved in the development of
chemoresistance in breast cancer (12). Moreover, previous research has
underscored the essential roles of lncRNAs in cancer immunity, such
as antigen presentation, immune activation and immune cell
infiltration, thereby garnering significant attention (13,14).
Whilst the prognostic significance of immune-related lncRNA markers
for overall survival (OS) in breast cancer has been previously
addressed (15), their diagnostic
and prognostic values in HER2+ breast cancer remain
largely unexplored.
Therefore, in the present study, data from patients
with breast cancer were retrieved from The Cancer Genome Atlas
(TCGA) to identify differential lncRNAs linked to HER2+
breast cancer. Integrating immune-related genes from The Immunology
Database and Analysis Portal (Immport), the correlation between
immune-associated lncRNAs and prognosis was assessed. These
potential biomarkers were then experimentally evaluated to
establish novel diagnostic and prognostic targets for
HER2+ breast cancer.
Materials and methods
Data source and preprocessing
In July 2021, the TCGA-BRCA dataset (Version 3; The
Cancer Imaging Archive. http://doi.org/10.7937/K9/TCIA.2016.AB2NAZRP)
(16) was retrieved via the
University of California Santa Cruz Xena platform (https://xenabrowser.net), which includes RNA
sequencing data, survival statistics and clinical details for both
cancerous and normal breast tissue samples. It enables the
segmentation of cancer cases into four molecular categories based
on the status of ER, PR, and HER2: Luminal A (positive for ER or
PR, and negative for HER2), luminal B (positive for ER or PR, and
HER2), HER2+ (negative for ER and PR, and positive for
HER2) and triple-negative (negative for ER, PR and HER2) (2). For the present analysis, the Gene
Annotation by the ENCODE Consortium (GENCODE) human gene annotation
(release 22) (https://www.gencodegenes.org/human/release_22.html)
was used, selecting ‘protein-coding’ tags for mRNA research, and
classifying several non-coding RNA types, such as ‘antisense’,
‘sense-intronic’, ‘lincRNA’, ‘ncRNA’, ‘sense-overlapping’ or
‘processed-transcript’, as lncRNAs. The data was organized into
separate matrices for mRNA and lncRNA evaluation. Additionally,
immune gene data were compiled from the ImmPort database
(https://immport.niaid.nih.gov) to create
a dedicated immune gene matrix, setting the stage for the
subsequent analysis.
Identification of differentially
expressed immune-related genes and lncRNAs
In the analysis, differential expression of
immune-related genes across luminal A, luminal B, triple negative
breast cancer (TNBC) and normal samples compared with
HER2+ samples was assessed using the ‘limma’ package in
R (version 3.5.1; http://bioconductor.org/packages/release/bioc/html/limma.html)
(17). The screening criteria of
P<0.05 and log2fold change (FC) >0.5 were selected
to identify significantly differentially expressed genes. A Venn
diagram analysis was performed using the online tool Venn
(http://bioinformatics.psb.ugent.be/webtools/Venn/) to
extract the overlapping set of differentially expressed immune
genes across the different conditions. This identical approach was
also applied to identify differentially expressed lncRNAs, adhering
to the same screening criteria of P<0.05 and log2FC
>0.5, to ascertain the common subset of lncRNAs for further
investigation.
Identification of immune-related
lncRNAs
The intersecting differentially expressed immune
genes and lncRNAs identified from the previous steps were analyzed
using Pearson correlation analysis to ascertain significant
relationships. Significantly correlated pairs exhibiting an
absolute value of r>0.3 and P<0.05 were earmarked for further
assessment. The outcomes of this screening were graphically
represented utilizing the ‘ggplot2’ package in R (version 3.3.2;
http://ggplot2.tidyverse.org/),
facilitating a visual interpretation of the data's underlying
patterns and associations.
Screening for diagnostic markers
The ‘pROC’ package within R software (version
1.12.1; http://www.rdocumentation.org/packages/pROC/versions/1.18.5)
was used to create receiver operating characteristic (ROC) curves
(18), comparing the performance of
immune-related lncRNAs in HER2+ breast cancer samples
and normal controls. The diagnostic capabilities of these lncRNAs
were quantified by measuring the area under the curve (AUC).
lncRNAs with AUC>0.7 were deemed as significant, highlighting
their potential as effective markers for differentiating between
healthy and cancerous conditions.
Screening biomarkers
The optimal cut-off value of each diagnostic marker
was determined by the surv_cutpoint function, enabling the division
of HER2+ breast cancer samples into groups based on high
or low expression levels of specific lncRNAs. To assess how the
expression levels of these lncRNAs correlated with OS among
HER2+ patients, the ‘survival’ package in R (version
3.5–3; http://CRAN.R-project.org/package=survival) was used
to create Kaplan-Meier survival curves. lncRNAs with P<0.05 were
considered significant and were therefore identified as potential
prognostic biomarkers for further analysis in the present
research.
Correlation analysis of biomarkers and
clinicopathological features
The correlation between biomarkers and
clinicopathological characteristics was analyzed by creating box
plots to visualize the differences in biomarker expression across
several clinicopathological categories. This was accomplished using
the ‘ggplot2’ R package, allowing for a clear and informative
representation of the data trends and distributions relative to
clinical attributes.
Subcellular localization analysis of
biomarkers
The subcellular locations of prognostic biomarkers
were identified using the LncLocator (http://www.csbio.sjtu.edu.cn/bioinf/lncLocator/index.html#)
and iLoc-lncRNA database (http://lin-group.cn/server/iLoc-LncRNA/predictor.php),
respectively.
Correlation analysis of biomarkers and
immune cells
The Cell-type Identification By Estimating Relative
Subsets Of RNA Transcripts (CIBERSORT) approach (19) was used to perform immune cell
infiltration analysis in patients with HER2+ breast
cancer. Following this, the R package ‘ggstatsplot’ (version 3.6.1;
http://indrajeetpatil.github.io/ggstatsplot/) was used
to calculate the Spearman's rank correlation coefficient between
the identified biomarkers and 22 types of infiltrating immune
cells. This analysis aimed to assess the relationship between
biomarkers and the presence of immune cells in the tumor
environment. Immune cells that demonstrated a correlation
coefficient of r>0.3 and P<0.05 were recognized as
significantly correlated with the biomarkers in question.
Construction of lncRNA-mRNA and
competing endogenous (ce)RNA network
A Pearson correlation analysis was performed to
identify the relationships between nuclear and cytoplasmic lncRNAs
and immune-related genes, selecting only lncRNA-mRNA pairs with
r>0.3 and P<0.05. The lncbaseV2 database (https://dianalab.e-ce.uth.gr/html/diana/web/index.php?r=lncbasev2)
was used to predict lncRNA-miRNA relationships, with significance
set at a prediction score >0.7. Furthermore, the miRWalk 2.0
platform (http://zmf.umm.uni-heidelberg.de/apps/zmf/mirwalk2/)
was used to identify miRNA-mRNA interactions. Only interactions
recognized by at least 4/6 reference databases (miRWalk, miRanda,
miRDB, PITA, RNA22 and Targetscan) were considered valid. A
lncRNA-miRNA-mRNA regulatory network was constructed based on
cytoplasmic co-expression relationships. Cytoscape software
(version 3.8.0; http://cytoscape.org/) facilitated the visualization
of the lncRNA-mRNA co-expression and ceRNA networks for nuclear and
cytoplasmic lncRNAs, respectively (20). Finally, functional characterization
of mRNAs present in both networks was achieved using Gene Ontology
(GO) (https://geneontology.org/) and Kyoto
Encyclopedia of Genes and Genomes (KEGG) (https://www.kegg.jp/) pathway enrichment analyses,
using the Database for Annotation, Visualization, and Integrated
Discovery (DAVID; http://david.ncifcrf.gov/tools.jsp).
In situ hybridization (ISH)
Two tissue microarrays (cat. nos. HBreD080CS01 and
TFBrec-01) were purchased from Shanghai Outdo Biotech Co., Ltd.,
containing 217 breast cancer tissues and 24 adjacent non-tumor
tissues. The expression of lncRNA CTC-537E7.2 was evaluated
utilizing the ISH Test Kit (Boster Biological Biotechnology; cat.
no. MK11221) according to the manufacturer's protocols. In brief,
the paraffin-embedded tissue sections were deparaffinized and
rehydrated. Endogenous peroxidase activity was blocked by 3%
hydrogen peroxide for 10 min and then digested with protease K. The
digoxigenin-labeled oligonucleotide probe was added at a
concentration of 1.5–2 µg/ml and incubated overnight at 37°C. Next,
the sections were treated with a blocking reagent at 37°C for 30
min, followed by incubation with biotinylated rat anti-Digoxigenin
at 37°C for 60 min. Subsequently, the sections were treated with
Sterptavidin-Biotin-Amplified Complex at 37°C for 20 min, followed
by the application of biotinylated peroxidase at 37°C for 20 min.
Finally, sections were stained using 3,3′-diaminobenzidine.
Oligonucleotide probes marked with DIG-dUTP at the 3′ end were
purchased from Boster Biological Biotechnology (cat. no. MK1122).
The sequences for these probes were as follows:
5′-AGGTACAGTCATGTGCCGCATAATGACATTCAGTCAATGA-3′;
5′-ATATATGAGGTGGTCCTGTAAGGTGATAATGGAGCTGAAA-3′; and
5′-TGTAACATCATAGCACAACCAATCACCTTTTCTATATTTA-3′.
ISH results were captured using a tissue microarray
scanner (Aperio VERSA 8; Leica Biosystems). The captured images
were analyzed using ImageScope software (v.11.2.0.780; Leica
Biosystems), which automatically detects regions of interest on the
tissue sections based on staining intensity: Dark brown signifies
strong positivity; light brown indicates moderate positivity; light
yellow shows weak positivity; and blue marks negative staining.
Quantitative analyses were performed based on the intensity levels,
encompassing both the area (in pixels) and the % of positively
stained regions. To quantify the expression of lncRNA CTC-537E7.2,
a semi-quantitative method known as the histoscore (H-score) was
used (21). This scoring system
combines the staining intensity (with scores ranging from 0 for
negative, 1 for weak, 2 for moderate and 3 for strong) and the % of
positive cells at each intensity level. Specifically, the H-score
was calculated as follows: H-SCORE=∑(I × Pi)=(% of cells of weak
intensity × 1) + (% of cells of moderate intensity × 2) + (% of
cells of strong intensity × 3), where I=intensity of staining and
Pi=% of stained tumor cells (22,23).
This method produces a score ranging from 0–300, serving as a
comprehensive quantitative indicator of lncRNA expression.
Statistical analysis
Statistical analyses were performed using R (version
3.5.1; http://www.r-project.org/foundation/) and incorporated
several packages such as ‘limma’, ‘pROC’, ‘ClusterProfiler’,
‘ggplot2’, ‘Cytoscape’, ‘ggstatsplot’ and ‘survival’. The
differential expression of mRNAs and lncRNAs was determined using
the ‘limma’ package. Correlation analysis was performed using
either Pearson or Spearman's correlation, depending on the data
distribution and the analysis requirements. ROC curve analysis was
used to evaluate the predictive power of each lncRNA regarding
clinical outcomes. The Wilcoxon rank-sum test was used to assess
the statistical differences in the expression of biomarkers across
several clinicopathological categories between two groups. For
comparisons involving >2 groups, the one-way ANOVA test with
Bonferroni's correction was used. Kaplan-Meier survival curves were
generated to compare survival times among groups based on lncRNA
expression levels, identifying those with statistically significant
impacts. The Kruskal-Wallis test was used to assess differences
between multiple groups in experimental data, followed by Dunn's
post hoc test for pairwise comparisons. The results are presented
as median (interquartile range). P<0.05 was considered to
indicate a statistically significant difference, unless stated
otherwise.
Results
Data source and processing
A total of 803 samples were extracted from the TCGA
database, which included 430 luminal A samples, 124 luminal B
samples, 37 HER2+ samples, 113 TNBC samples and 99
normal samples. Out of these, 689 samples had comprehensive
survival and clinical information available. A list of
immune-related genes was also compiled from the ImmPort database.
After removing duplicates, a list of 1,811 unique genes was
finalized for subsequent analysis.
Identification of differentially
expressed immune-related genes and lncRNAs
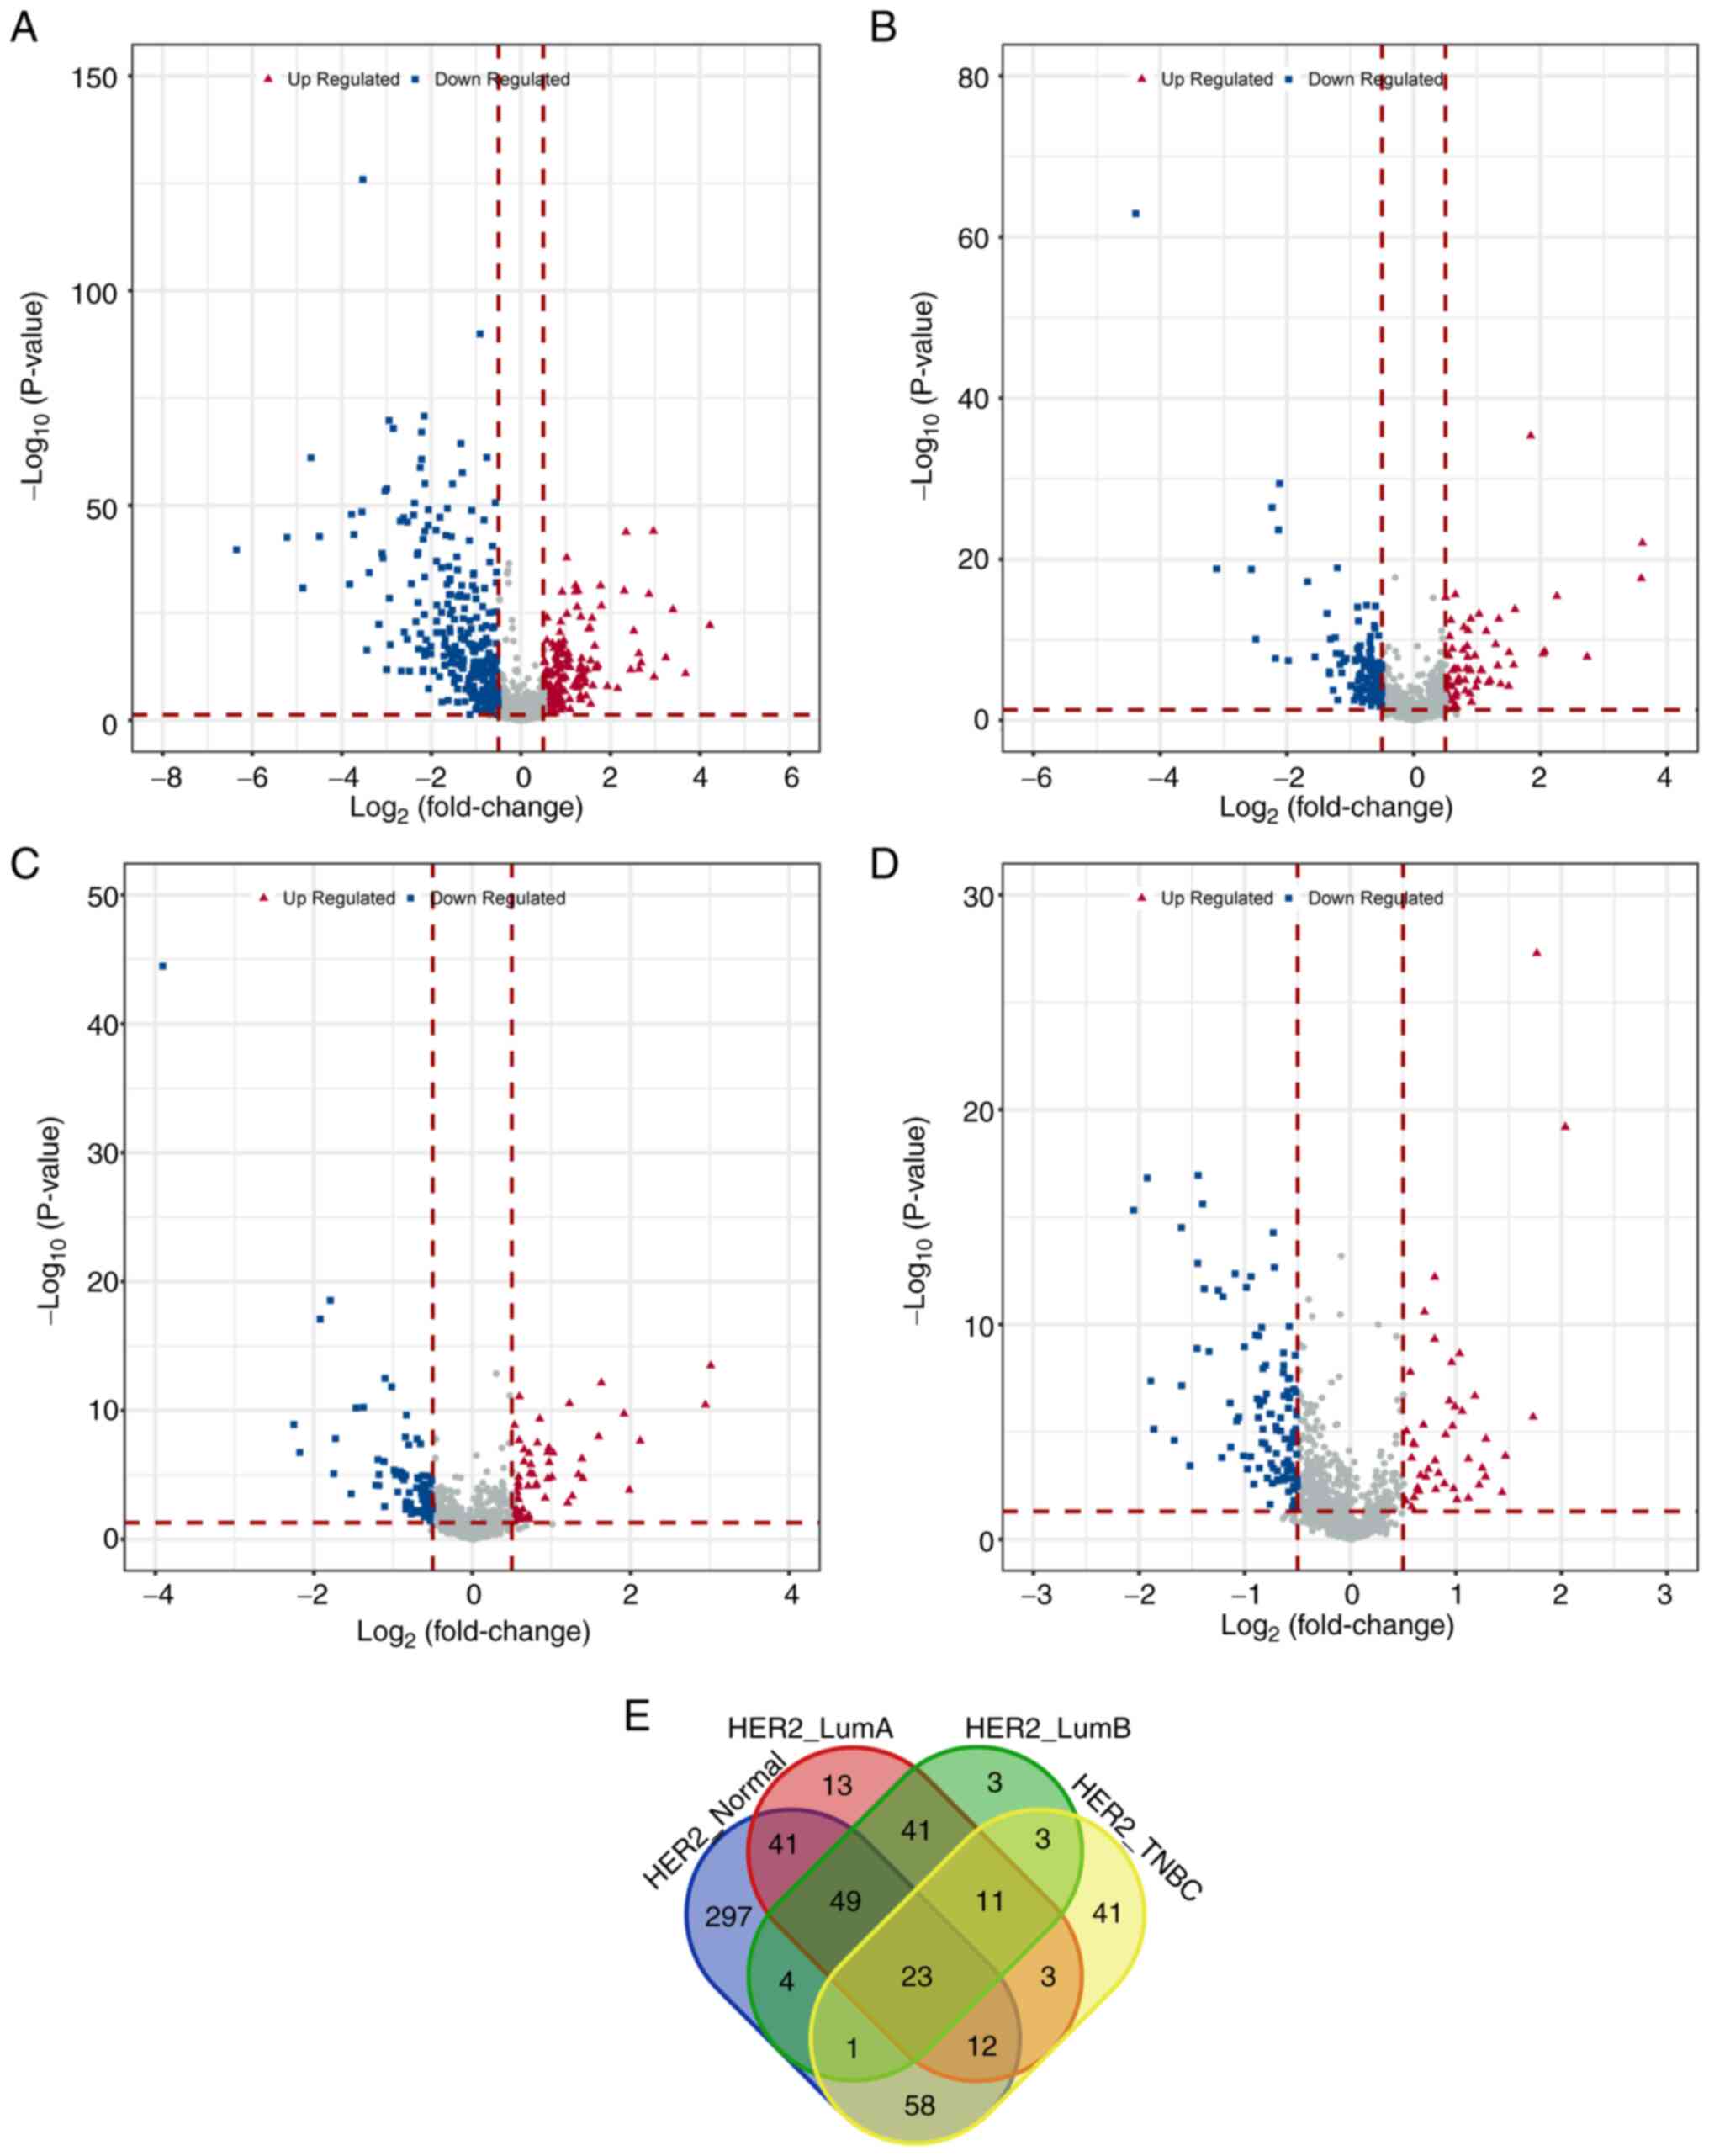
Differential gene expression analysis was performed
comparing the HER2+ breast cancer group with the luminal
A, luminal B, TNBC and normal sample groups. A total of 485 immune
genes were identified as differentially expressed in the
HER2+ breast cancer group compared with the normal
sample group, consisting of 185 upregulated and 300 downregulated
genes. In comparison with the luminal A breast cancer group, 193
immune genes exhibited differential expression (76 upregulated and
117 downregulated). Similarly, when compared with the luminal B
breast cancer group, 135 immune genes showed differential
expression (79 upregulated and 135 downregulated). Compared with
the TNBC group, 152 immune genes demonstrated differential
expression, with 43 upregulated and 109 downregulated genes
(Table I). The distribution of
these differential genes among each sample group was visually
represented using volcano plots (Fig.
1A-D). A Venn diagram analysis using online tool Venn
(http://bioinformatics.psb.ugent.be/webtools/Venn/)
revealed 23 shared differential immune genes among the four groups
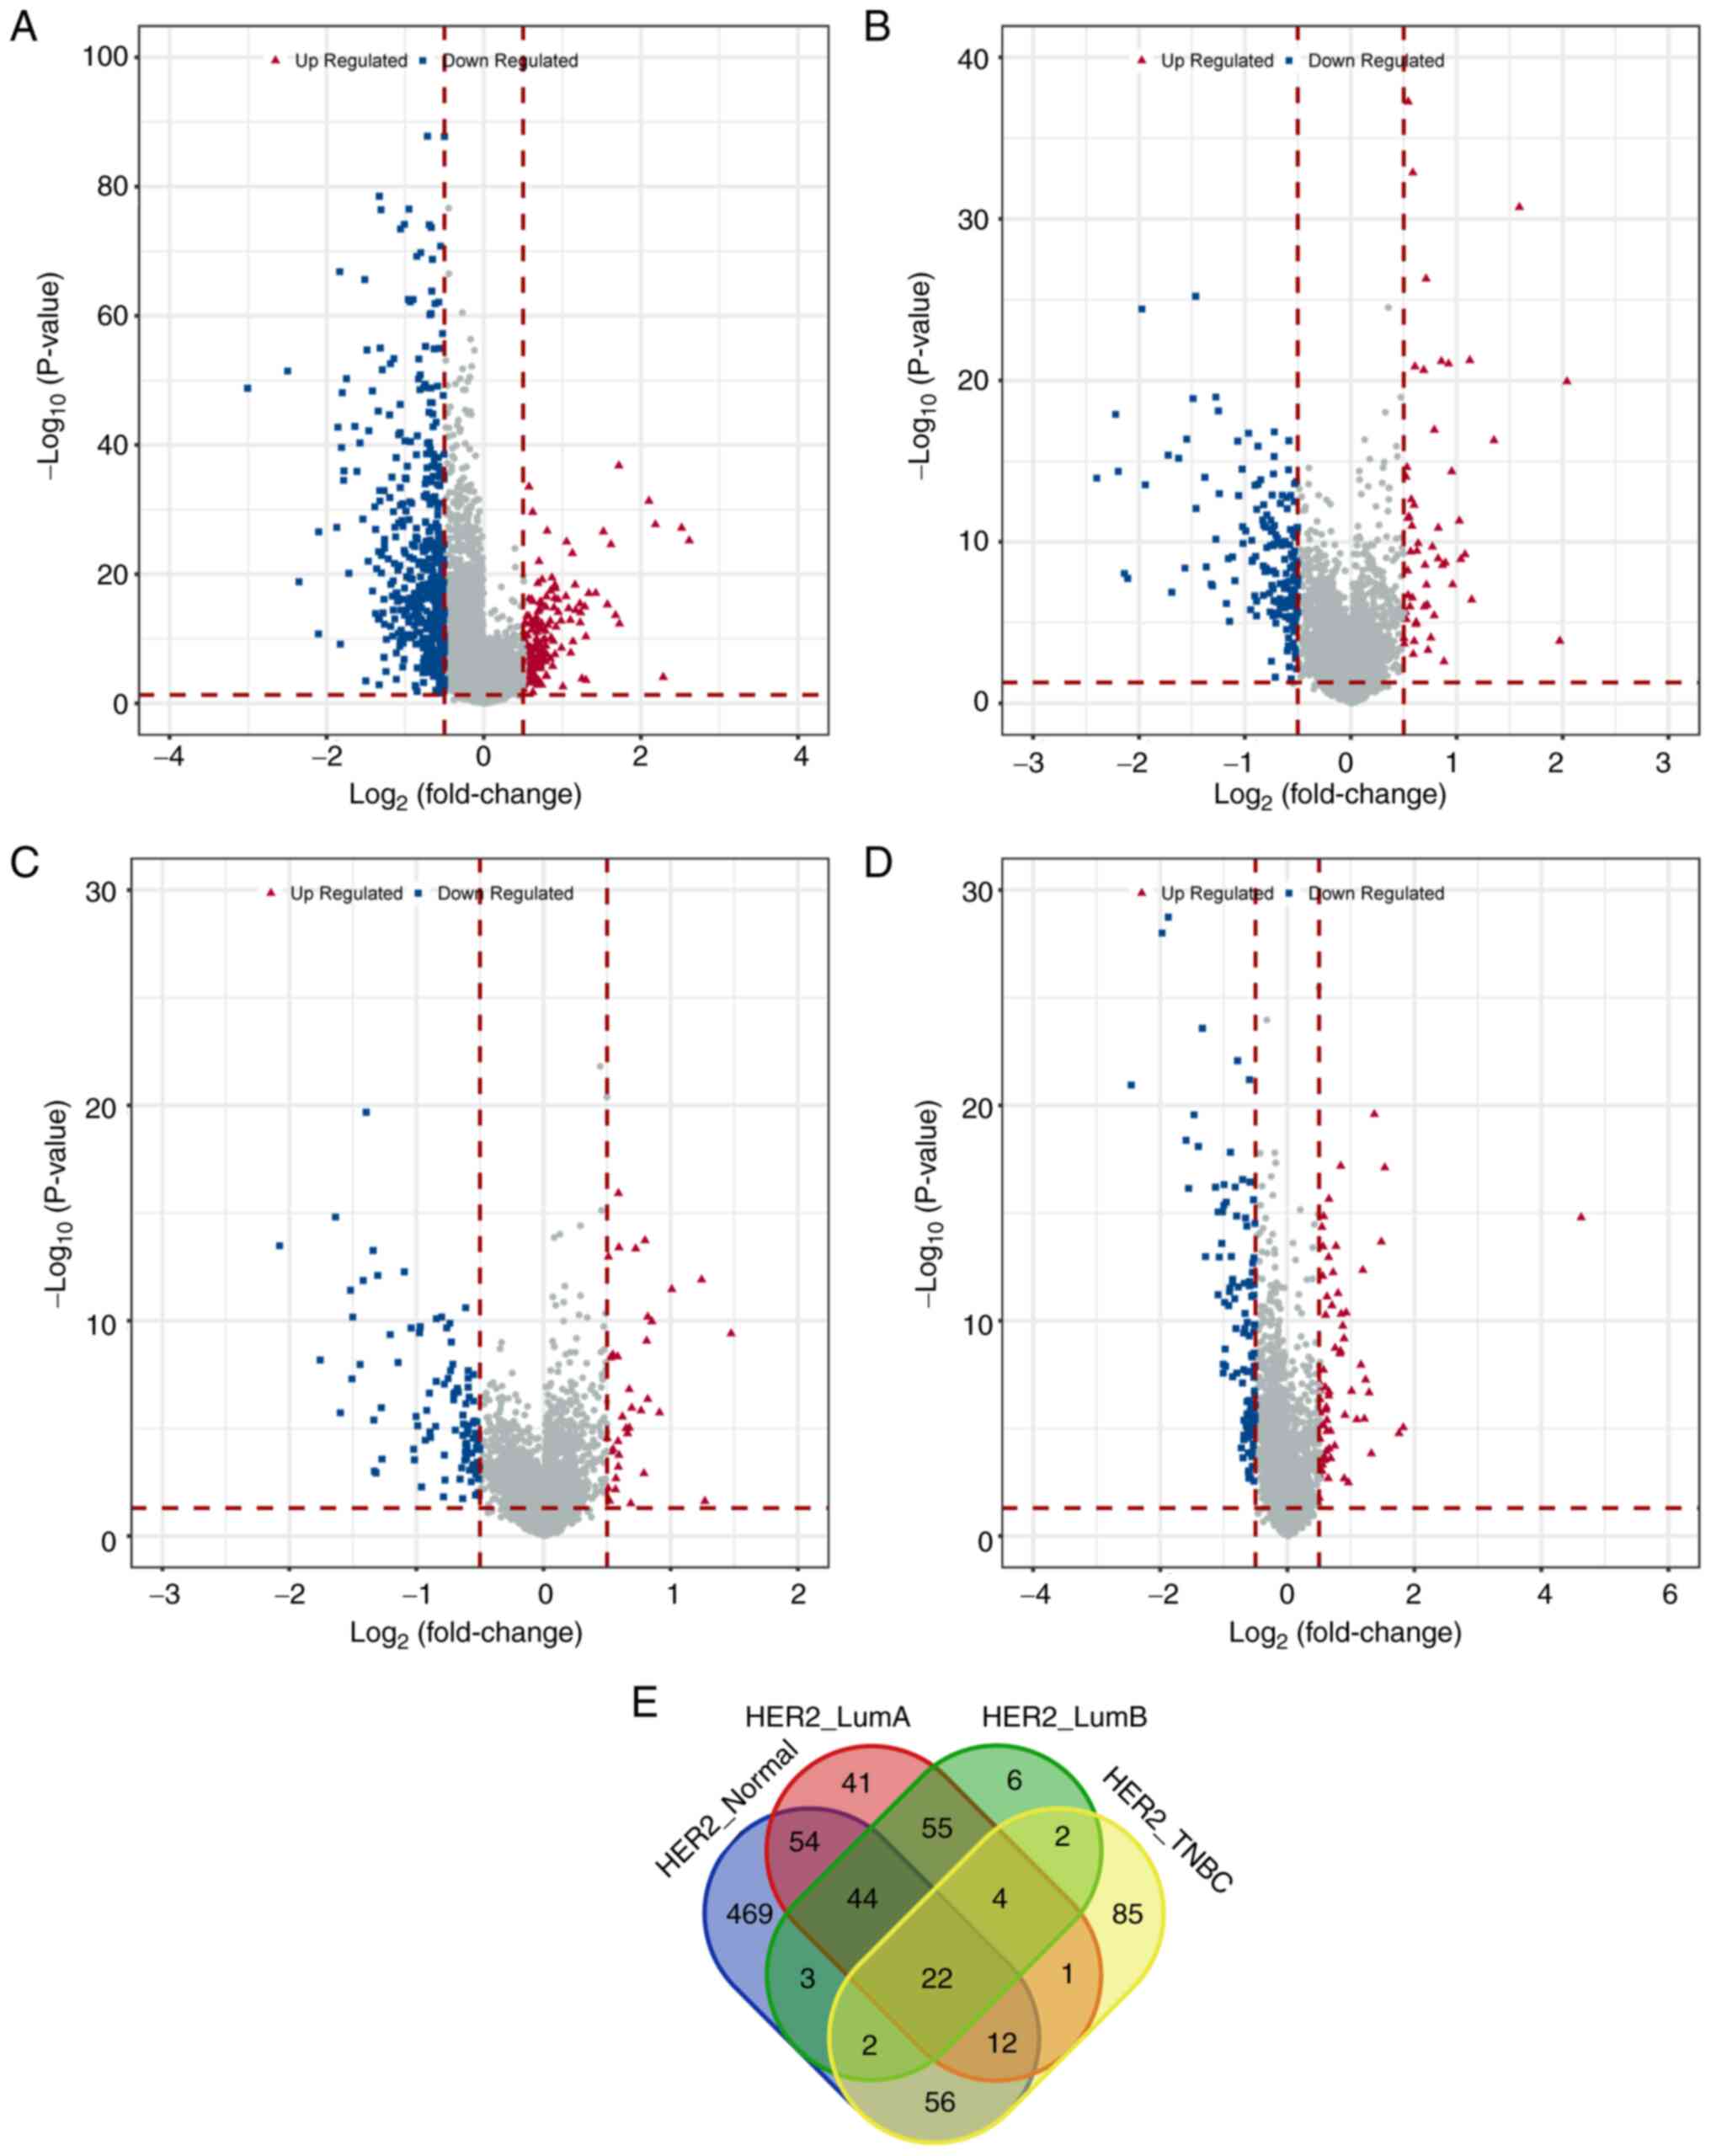
(Fig. 1E). Similarly, after
analyzing the differential lncRNAs, 662 lncRNAs were found to be
differentially expressed in the HER2+ breast cancer
group compared with the normal sample group. This included 158
upregulated and 504 downregulated lncRNAs. In comparison with the
luminal A breast cancer group, 233 lncRNAs exhibited differential
expression (55 upregulated and 178 downregulated). Similarly,
compared with the luminal B breast cancer group, 138 lncRNAs showed
differential expression (36 upregulated and 102 downregulated). In
contrast with the TNBC group, 184 lncRNAs demonstrated differential
expression, with 68 upregulated and 116 downregulated lncRNAs
(Table II). The distribution of
these differential lncRNAs was illustrated using volcano plots
(Fig. 2A-D). By comparing the
differential lncRNAs across the four groups, 22 commonly
differentially expressed lncRNAs were identified (Fig. 2E).
 | Table I.Number of differentially expressed
immune-related genes among each sample group. |
Table I.
Number of differentially expressed
immune-related genes among each sample group.
| Group | Upregulated | Downregulated | Total |
|---|
| HER2+
vs. normal | 185 | 300 | 485 |
| HER2+
vs. luminal A | 76 | 117 | 193 |
| HER2+
vs. luminal B | 56 | 79 | 135 |
| HER2+
vs. TNBC | 43 | 109 | 152 |
| Table II.Number of differentially expressed
long non-coding RNAs among each sample group. |
Table II.
Number of differentially expressed
long non-coding RNAs among each sample group.
| Group | Upregulated | Downregulated | Total |
|---|
| HER2+
vs. normal | 158 | 504 | 662 |
| HER2+
vs. luminal A | 55 | 178 | 233 |
| HER2+
vs. luminal B | 36 | 102 | 138 |
| HER2+
vs. TNBC | 68 | 116 | 184 |
Identification of immune-related
lncRNAs
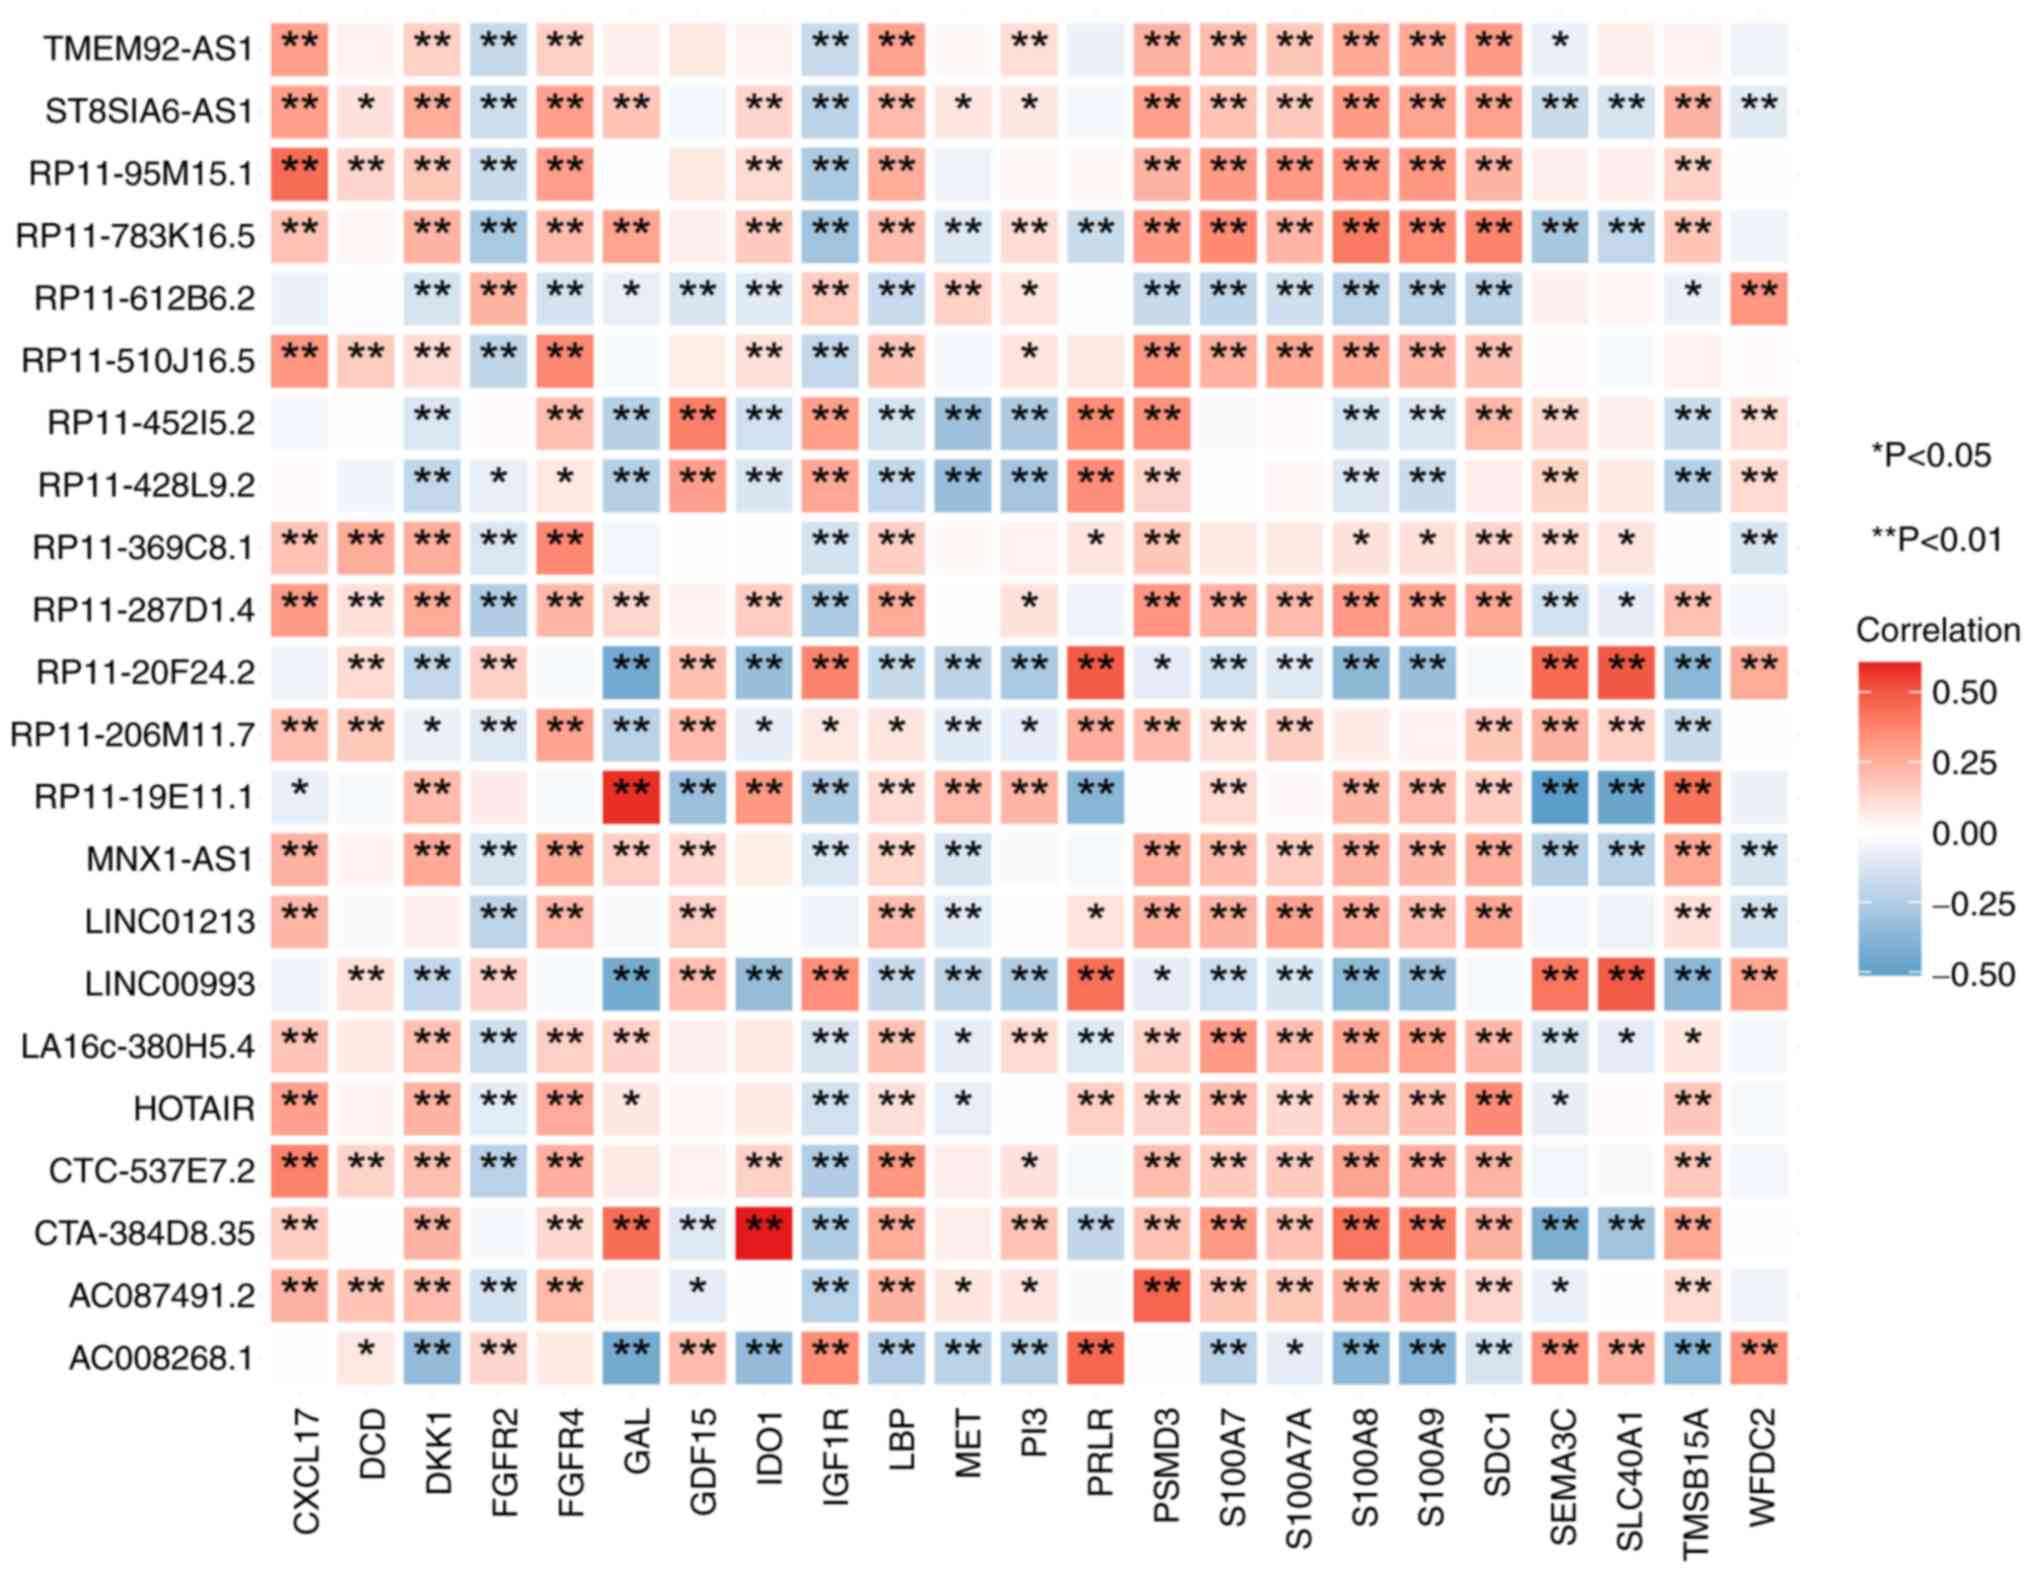
In total, 74 significantly correlated pairs
(differentially expressed immune-related genes and differentially
expressed lncRNAs exhibiting a correlated relationship meeting the
standard criteria of r>0.3 and P<0.05) were identified. These
pairs included 20 differential immune genes, encompassing C-X-C
motif chemokine ligand 17, Dermcidin, Dickkopf WNT signaling
pathway inhibitor 1, Fibroblast Growth Factor Receptor 4, Galanin,
Growth Differentiation Factor 15, Indoleamine 2,3-Dioxygenase 1,
Insulin-Like Growth Factor 1 Receptor, Lipopolysaccharide-Binding
Protein, Mesenchymal-Epithelial Transition Factor,
Phosphatidylinositol 3, Prolactin Receptor, Proteasome 26S Subunit,
Non-ATPase 3, S100 Calcium-Binding Protein A7, S100 Calcium-Binding
Protein A7A, S100 Calcium-Binding Protein A8, S100 Calcium-Binding
Protein A9, Syndecan 1, Semaphorin 3C, Solute Carrier Family 40
Member 1 and Thymosin Beta 15A, and 19 differential lncRNAs
(TMEM92-AS1, ST8SIA6-AS1, RP11-95M15.1, RP11-783K16.5,
RP11-612B6.2, RP11-510J16.5, RP11-45215.2, RP11-428L9.2,
RP11-369C8.1, RP11-287D1.4, RP11-20F24.2, RP11-206M11.7,
RP11-19E11.1, MNX1-AS1, LINC01213, LINCO0993, LA16C-380H5.4,
HOTAIR, CTC-537E7.2, CTA-384D8.35, AC087491.2 and AC008268.1). As a
result, a set of 19 immune-related differential lncRNAs was
obtained. The aforementioned findings were visualized using the R
package ‘ggplot2’, as depicted in Fig.
3.
Identification of 13 immune-related
differentially expressed lncRNAs as diagnostic biomarkers
Diagnostic lncRNAs were identified by constructing
ROC curves for 19 immune-related differential lncRNAs between
normal control and HER2+ samples. Out of these, 13
immune-related differential lncRNAs exhibited an AUC >0.7,
pointing to a promising predictive value for breast cancer survival
(Table III and Fig. S1). Therefore, all 13 immune-related
differential lncRNAs with diagnostic potential were included in the
analysis, namely AC008268.1 (AUC=0.709), CTA-384D8.35 (AUC=0.909),
CTC-537E7.2 (AUC=0.788), HOTAIR (AUC=0.942), LA16c-380H5.4
(AUC=0.879), LINC00993 (AUC=0.717), RP11-95M15.1 (AUC=0.826),
RP11-287D1.4 (AUC=0.915), RP11-510J16.5 (AUC=0.854), RP11-612B6.2
(AUC=0.883), RP11-783K16.5 (AUC=0.963), ST8SIA6-AS1 (AUC=0.913) and
TMEM92-AS1 (AUC=0.844).
| Table III.Predictive value of 13 diagnostic
long non-coding RNAs. |
Table III.
Predictive value of 13 diagnostic
long non-coding RNAs.
| lncRNAs | AUC | 95% CI | P-value | Sensitivity | Specificity |
|---|
| AC008268.1 | 0.709 | 0.6089–0.8096 |
1.78×10⁻⁴ | 0.622 | 0.798 |
| CTA-384D8.35 | 0.909 | 0.8426–0.9756 |
2.34×10⁻¹³ | 0.865 | 0.889 |
| CTC-537E7.2 | 0.788 | 0.692–0.8845 |
2.42×10⁻⁷ | 0.676 | 0.889 |
| HOTAIR | 0.942 | 0.8937–0.9895 |
2.66×10⁻¹⁵ | 0.919 | 0.889 |
| LA16c-380H5.4 | 0.879 | 0.8197–0.9390 |
1.09×10⁻¹¹ | 0.865 | 0.737 |
| LINC00993 | 0.717 | 0.6156–0.8176 |
1.04×10⁻⁴ | 0.622 | 0.778 |
| RP11-95M15.1 | 0.826 | 0.7271–0.9246 |
5.34×10⁻⁹ | 0.757 | 0.909 |
| RP11-287D1.4 | 0.915 | 0.8528–0.9773 |
1.04×10⁻¹³ | 0.838 | 0.869 |
| RP11-510J16.5 | 0.854 | 0.7666–0.9418 |
2.23×10⁻¹⁰ | 0.784 | 0.889 |
| RP11-612B6.2 | 0.883 | 0.8064–0.9594 |
6.97×10⁻¹² | 0.838 | 0.869 |
| RP11-783K16.5 | 0.963 | 0.9345–0.9918 | 0 | 0.865 | 0.949 |
| ST8SIA6-AS1 | 0.913 | 0.8384–0.9869 |
1.45X10⁻¹³ | 0.838 | 0.970 |
| TMEM92-AS1 | 0.844 | 0.7565–0.9311 |
7.32×10⁻¹⁰ | 0.838 | 0.758 |
lncRNA CTC-537E7.2 is a prognostic
biomarker for patients with HER2+ breast cancer
To elucidate prognostic biomarkers for patients with
HER2+ breast cancer, the optimal threshold value of each
diagnostic lncRNA was used to stratify the HER2+ samples
into high and low expression groups. Subsequently, Kaplan-Meier
survival curves were generated using the R package ‘survival’.
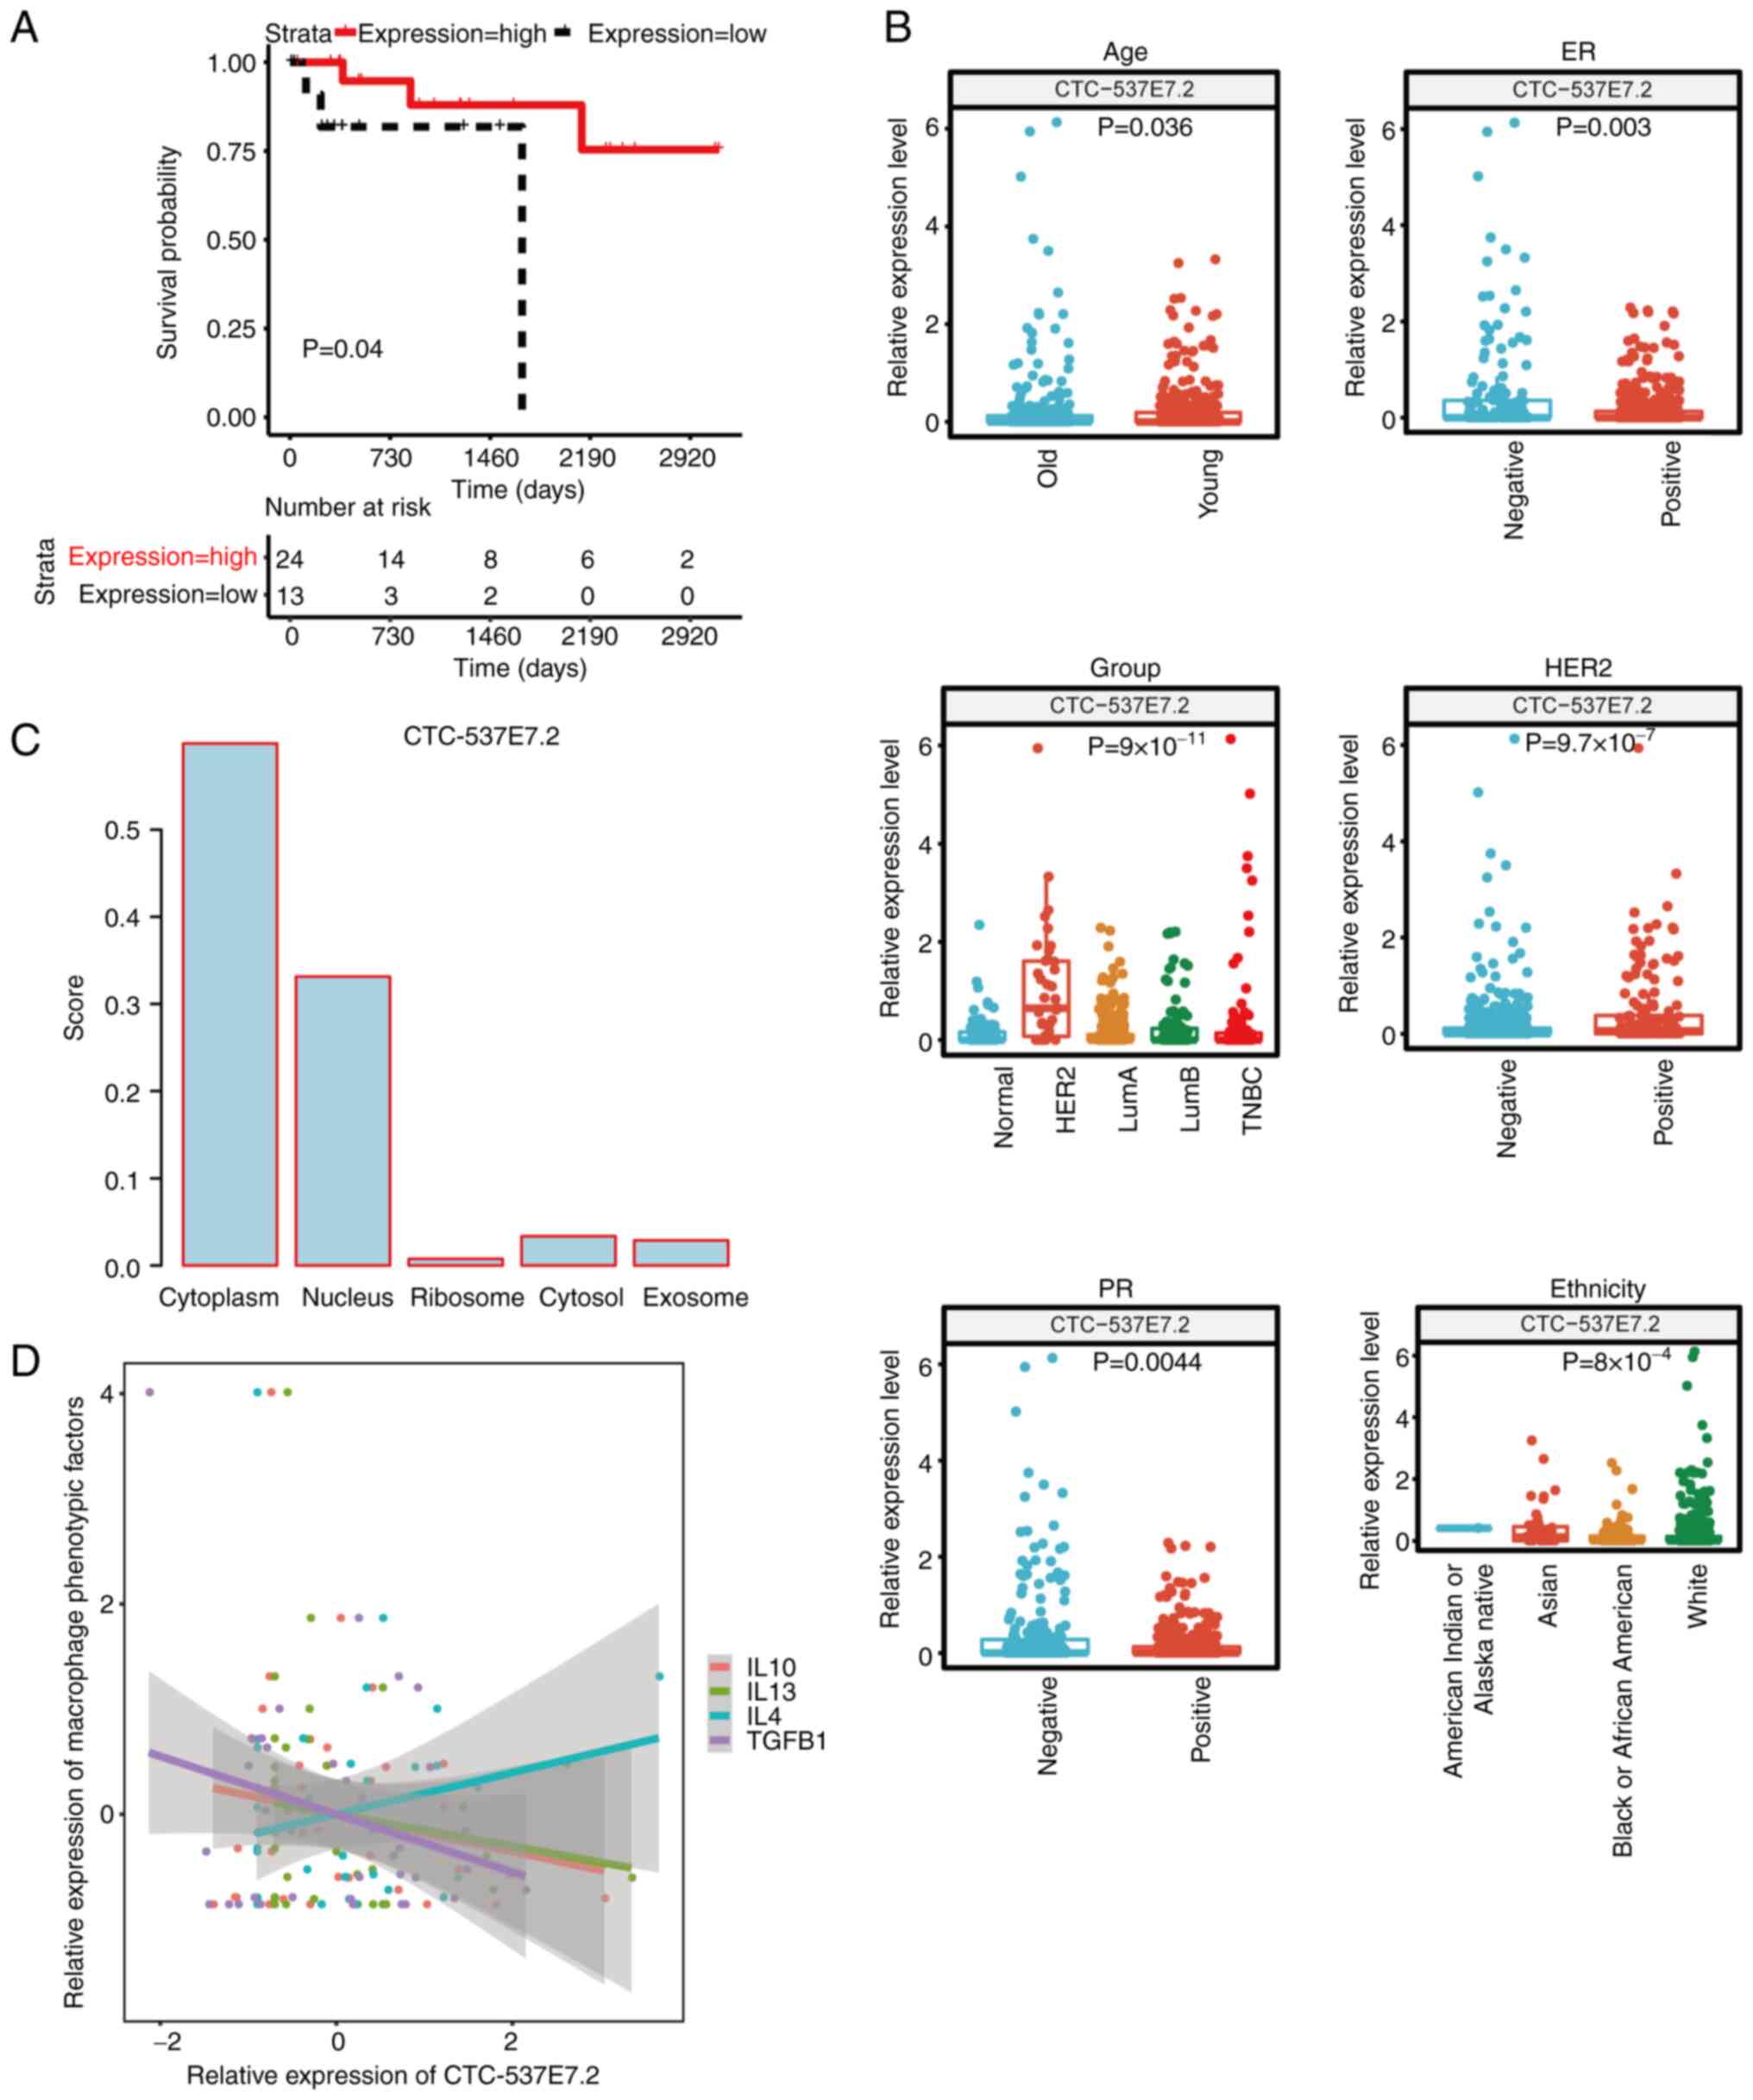
Notably, among these lncRNAs, CTC-537E7.2 was significant
associated with prognosis in HER2+ patients (P=0.04),
establishing itself as a promising prognostic biomarker (Fig. 4A). Patients with elevated levels of
CTC-537E7.2 exhibited notably extended overall survival compared
with those with lower expression.
Correlations between lncRNA
CTC-537E7.2 and clinical and pathological characteristics
To further assess the association between prognostic
biomarkers and clinicopathological factors, a correlation analysis
was performed. Using the R package ‘ggplot2’, box plots were
generated to visualize the expression values of the biomarker
across different clinicopathological factors (Fig. 4B). The results revealed significant
differences (P<0.05) in the expression of lncRNA CTC-537E7.2
across several sample groups concerning six clinicopathological
factors, namely ER, PR, HER2, age, group and ethnicity.
Subcellular localization of lncRNA
CTC-537E7.2
According to the subcellular localization prediction
of lncRNA CTC-537E7.2, the LncLocator database assigned the highest
score to the cytoplasm (0.598853; Fig.
4C). Conversely, the iLoc-lncRNA database identified the
nucleus as having the highest score (0.905448) for this lncRNA
(data not shown). These results indicate that lncRNA CTC-537E7.2 is
expressed in both the cytoplasm and nucleus.
Correlation analysis of lncRNA
CTC-537E7.2 and immune cells
To evaluate the potential association between lncRNA
CTC-537E7.2 and immune cells in HER2+ breast cancer
samples, the CIBERSORT algorithm was initially used to assess the
proportions of immune cell populations within the samples. This
analysis provided insights into 22 distinct immune cell types
across all 37 HER2+ breast cancer samples. Following
this, correlation analyses were performed to evaluate the
relationship between the expression levels of lncRNA CTC-537E7.2
and each specific immune cell type. Noteworthy results revealed
significant associations between lncRNA CTC-537E7.2 and four immune
cell types: M0 Macrophages (r=−0.386; P=0.018), monocytes (r=0.340;
P=0.039), neutrophils (r=−0.332; P=0.045) and M2 macrophages
(r=0.331; P=0.046; Table IV).
Neutrophils and macrophages serve dual roles in both promoting and
suppressing cancer development (24,25).
Macrophages, derived from monocytes (26), can transition from inactive M0
macrophages to polarized phenotypes (27), primarily classified as classically
activated (M1) and alternatively activated (M2) macrophages
(28). M2 macrophages, predominant
among tumor-associated macrophages, markedly contribute to tumor
progression and metastasis (24).
Notably, the present study found lncRNA CTC-537E7.2 shows a
positive correlation with M2 macrophages, which are known to be
activated by cytokines such as interleukin (IL)-4, IL-13, IL-10 and
transforming growth factor-β (TGF-β) (28). To further assess the relationship
between lncRNA CTC-537E7.2 and macrophages, the correlation between
lncRNA CTC-537E7.2 and phenotypic factors of M2 macrophages (IL-10,
TGF-β, IL-4, and IL-13) were analyzed. The correlation plot
revealed a positive correlation between lncRNA CTC-537E7.2 and
IL-4, whilst demonstrating negative correlations with other
phenotypic factors, including IL-10, TGF-β and IL-13 (Fig. 4D).
| Table IV.Immune cells associated with
biomarkers. |
Table IV.
Immune cells associated with
biomarkers.
| Immune cell | lncRNA | r | P-value |
|---|
| Macrophages M0 | CTC-537E7.2 | −0.385825165 | 0.018350539 |
| Monocytes | CTC-537E7.2 | 0.340359924 | 0.039277796 |
| Neutrophils | CTC-537E7.2 | −0.331519923 | 0.045024058 |
| Macrophages M2 | CTC-537E7.2 | 0.330639322 | 0.045631770 |
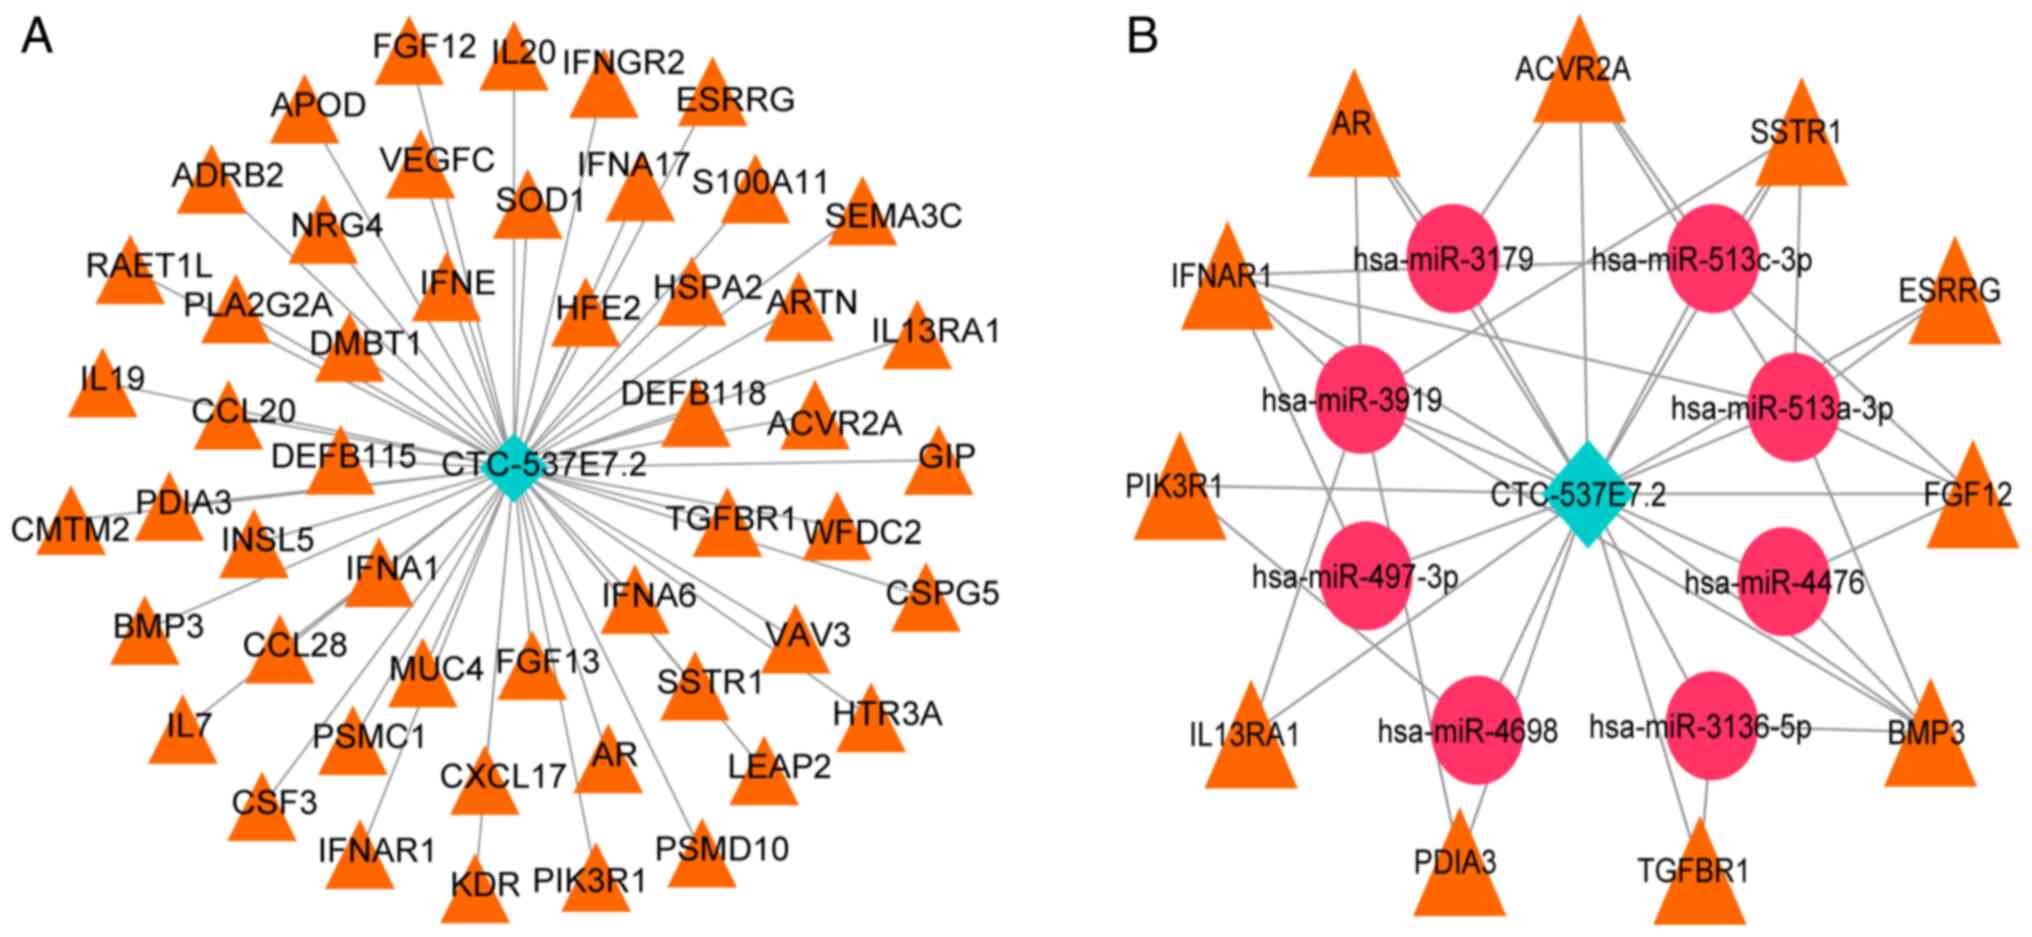
Construction of lncRNA-mRNA and ceRNA
network
Based on the subcellular localization findings for
lncRNA CTC-537E7.2, lncRNA-mRNA and ceRNA networks were
constructed. Nuclear lncRNAs directly modulate target gene
expression through binding, whilst cytoplasmic lncRNAs act as
ceRNAs, influencing gene expression via miRNA interactions
(29). Pearson correlation analysis
was performed on lncRNA CTC-537E7.2 and immune-related genes,
whereby, based on the parameters of r>0.3 and P<0.05, a total
of 51 lncRNA-mRNA pairs were identified, consisting of 1 lncRNA and
51 mRNAs. The LNCbaseV2 database was used for predictive analysis
for selected lncRNA CTC-537E7.2 and miRNAs relationship pairs with
a score >0.7, resulting in 13 pairs comprising 1 lncRNA and 13
miRNAs. The miRWalk2.0 database, with data integrated from six
databases: miRWalk, miRanda, miRDB, PITA, RNA22 and Targetscan, was
used to predict miRNA-mRNA relationship pairs for the 51 mRNAs
associated with lncRNA CTC-537E7.2. This approach identified 6,456
miRNA-mRNA relationship pairs, involving 48 mRNAs and 1,284 miRNAs.
Finally, by integrating the co-expression relationships, a ceRNA
network was formulated with 24 pairs, consisting of one lncRNA, 8
unique miRNAs and 11 distinct mRNAs. Visualization was achieved
using Cytoscape software (Fig.
5).
The results of GO and KEGG enrichment analyses were
considered significant when P<0.05 and counts ≥2. Within the
lncRNA-mRNA co-expression network, mRNAs were enriched across 40 GO
Biological Processes (BP), 8 Cellular Components (CC), 7 Molecular
Functions (MF) and 18 KEGG pathways (Fig. S2). In the ceRNA network, mRNAs
showed significant enrichment in 12 GO BP, 2 CC, 5 MF and 5 KEGG
pathways, including pathways such as Janus kinase-signal transducer
and activator of transcription (Jak-STAT) signaling related to
macrophage polarization (Fig. S3).
The top 10 GO and KEGG terms, selected by count value, are
presented due to the extensive number of enriched pathways.
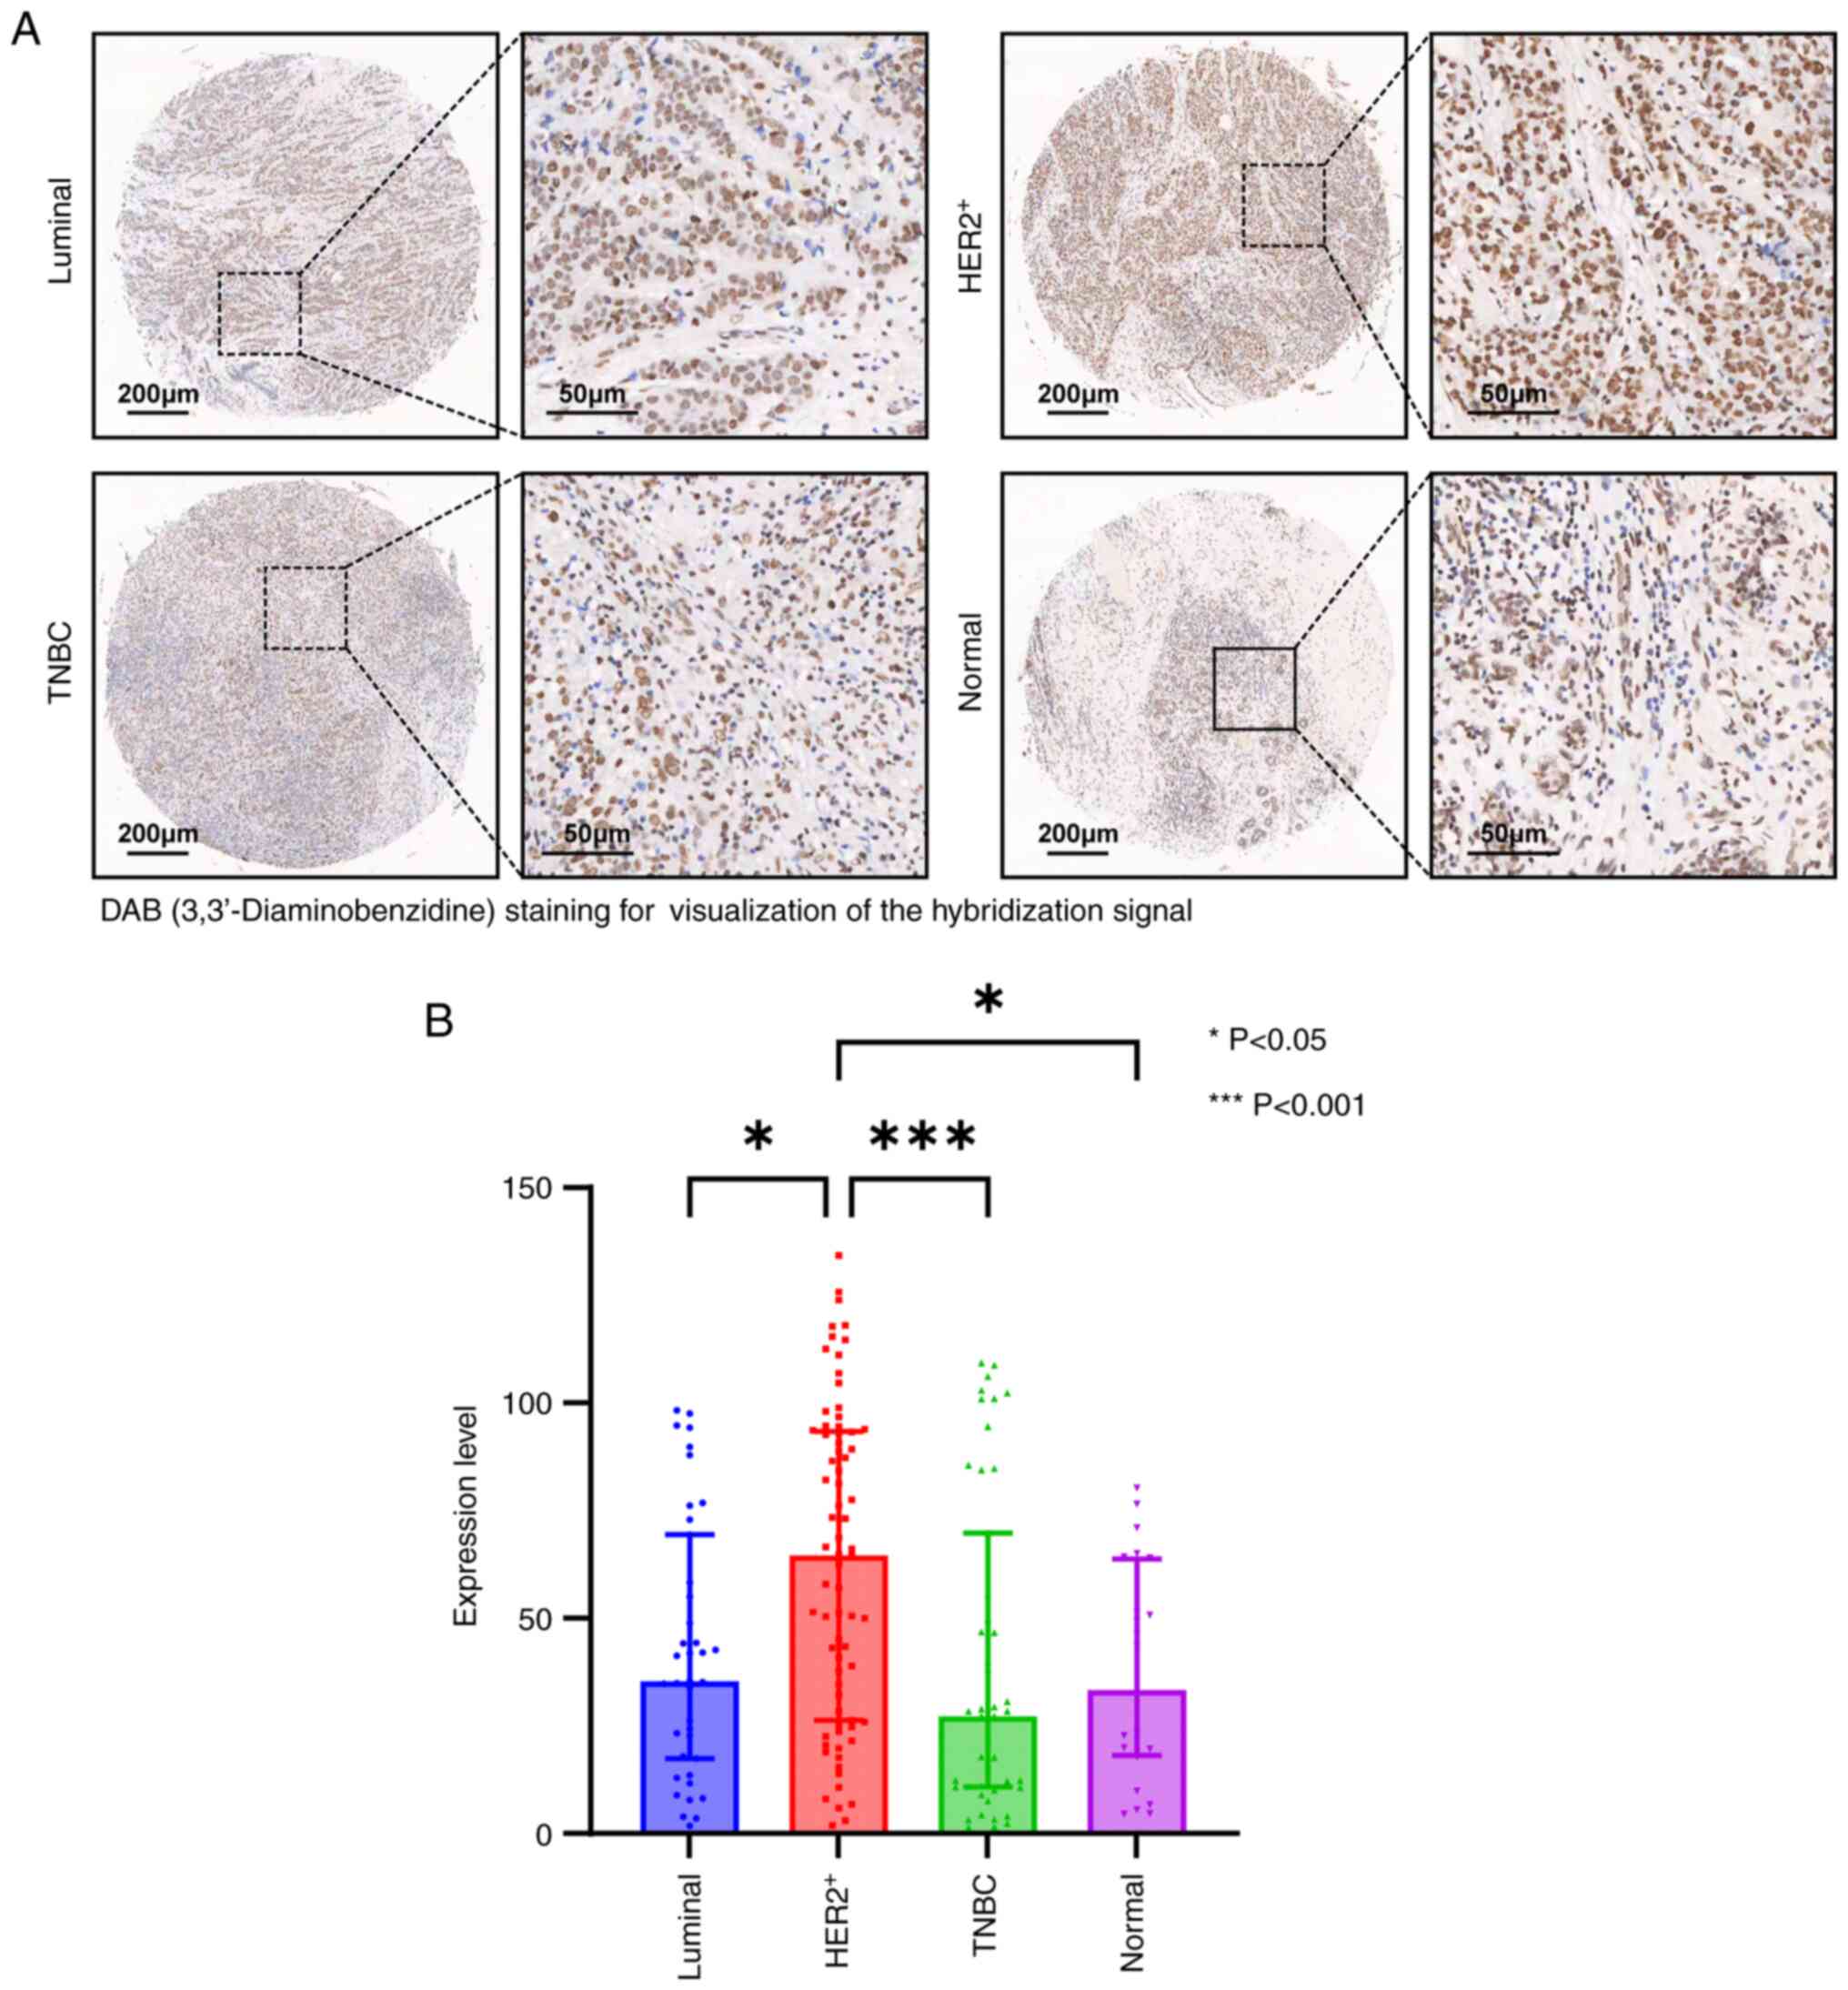
lncRNA CTC-537E7.2 expression in
tissue microarrays
ISH assays were performed to detect the expression
of lncRNA CTC-537E7.2 in tissue microarrays. Cases with severe
detachment during immunohistochemistry and those lost to follow-up
were excluded from the statistical analysis due to tissue chip
detachment issues. After the removal of invalid cases, 160 breast
cancer tissues and 24 paired cancer-adjacent tissue samples were
included in the statistical analysis. The analysis revealed
distinctive color reactions for lncRNA CTC-537E7.2 in both breast
cancer and adjacent tissues, primarily localized within the nuclei
of tumor cells and cancer-adjacent tissues, and occasionally
observed in the cytoplasm. The expression of lncRNA CTC-537E7.2
across different groups is summarized in Table V. Notably, compared with other
subtypes of breast cancer and adjacent normal tissues,
HER2+ breast cancer tissues exhibited significantly
higher staining signal intensity for lncRNA CTC-537E7.2 (P<0.05;
Fig. 6A and B).
| Table V.Expression levels of CTC-537E7.2
among different groups. |
Table V.
Expression levels of CTC-537E7.2
among different groups.
| Group | n | Median
(interquartile range) | H/Z | P-value |
|---|
| Luminal | 39 | 35.49
(17.48–69.45) | 17.700 | 0.0005 |
|
HER2+ | 74 | 64.74
(26.26–93.41) |
|
|
| TNBC | 47 | 27.29
(10.84–69.86) |
|
|
| Normal | 24 | 33.44
(18.15–63.79) |
|
|
| HER2+
vs. luminal |
|
| 2.657 | 0.0236 |
| HER2+
vs. TNBC |
|
| 3.662 | 0.0008 |
| HER2+
vs. normal |
|
| 2.809 | 0.0149 |
Discussion
Breast cancer ranks as a leading cause of cancer in
women and is characterized by its diverse nature (1). Specifically, HER2+ breast
cancers are known for their aggressive behavior, leading to poor
survival outcomes and a higher tendency for metastasis (4). Despite advancements in treatments such
as surgery, radiotherapy and targeted therapies, which have
significantly improved the outcomes for patients with breast
cancer, the prognosis for many remains less than optimal (30). Hence, there is an urgent need to
identify new prognostic biomarkers for breast cancer. In this
context, lncRNAs have emerged as critical players in cancer
development, progression and the immune response (13,14).
Additionally, their value as prognostic indicators in breast cancer
has been increasingly recognized in research (15).
The present study identified a novel biomarker,
lncRNA CTC-537E7.2, which may have prognostic significance in
HER2+ breast cancer. This immune-related lncRNA
demonstrated its potential as a prognostic indicator, marked by a
high AUC value (>0.7) and a significant correlation with OS.
Notably, lncRNA CTC-537E7.2 has not been documented in previous
research related to breast cancer or other cancers to the best of
our knowledge, which underscores its novelty and potential
significance in this context. The present analysis also assessed
the relationship between this biomarker and several clinical
characteristics in patients with HER2+ breast cancer.
Distinct variations in the expression levels of lncRNA CTC-537E7.2
were observed across different hormonal receptor statuses (ER and
PR) and HER2 expressions, as well as among different patient
subgroups. Notably, lncRNA CTC-537E7.2 was predominantly expressed
in the HER2+ group. Furthermore, ISH analysis revealed
that lncRNA CTC-537E7.2 expression was significantly elevated in
HER2+ breast cancer tissues compared with other breast
cancer subtypes and normal tissue. The results of the present study
indicate that the lncRNA CTC-537E7.2 appears to serve a
contributory role in the modulation of gene expression pertinent to
ER, PR and HER2, thereby potentially influencing the formation of
molecular subtypes. Additionally, the differential expression of
lncRNA CTC-537E7.2 across several molecular subtypes of breast
cancer also highlights the heterogeneity of the disease. However,
the findings of the present study indicated no significant
association between lncRNA CTC-537E7.2 expression and the
tumor-node-metastasis classification or tumor stage in the patient
cohort. This suggests that the alterations in lncRNA CTC-537E7.2
expression may not be directly linked to the stage of disease or
the timing of HER2-+ breast cancer diagnosis.
The correlation analysis in the present study
revealed significant associations between lncRNA CTC-537E7.2 and
specific immune cells, particularly highlighting a significant
correlation with monocytes and M2 macrophages. Macrophages, which
differentiate from monocytes, can develop into M1 or M2 phenotypes,
with M2 macrophages known for their role in promoting tumor growth
and metastasis (24). In the
present study, the levels of the lncRNA CTC-537E7.2 were shown to
be positively correlated with M2 macrophages, and also demonstrated
a significant positive correlation with IL-4 levels. IL-4 is a
critical cytokine for the polarization of M2 macrophages (31), and evidence suggests that IL-4 can
directly influence the induction of M2 macrophages (32). Moreover, a previous study indicated
that lncRNAs are implicated in the IL4-induced M2 macrophage
polarization in breast cancer (33). This suggests that the aberrant
upregulation of lncRNA CTC-537E7.2 could potentially enhance M2
macrophage activation via IL-4; however, detailed investigations
are needed to confirm this mechanism. Additionally, the results of
the enrichment analysis in the present study revealed an enrichment
in signaling pathways related to macrophage polarization, including
the Jak-STAT signaling pathway. This pathway is crucial for
regulating macrophage polarization through the action of STAT
protein family members induced by Jak, serving as key transcription
factors (34). Among these, STAT6
is known to enhance the transcription of genes related to M2
macrophage polarization (31). The
present study indicated that biomarker target genes may facilitate
macrophage polarization towards M2 through the Jak-STAT signaling
pathway. Notably, despite the known tumor-promoting activities of
M2 macrophages, the survival analysis in the present study
indicated that lncRNA CTC-537E7.2 acted as a protective factor in
the context of HER2+ breast cancer. This paradox could
be explained by the complex interactions within the breast cancer
microenvironment, which involves several cell types and signaling
pathways (35). Whilst lncRNA
CTC-537E7.2 may contribute to M2 macrophage promotion, it might
also engage in regulatory activities with other cell types that
mitigate the tumor-promoting effects of M2 macrophages, improving
patient survival outcomes. Additionally, the influence of lncRNA
CTC-537E7.2 on M2 macrophages might be modulated by other factors
within the tumor microenvironment. Therefore, despite the promotive
effects on M2 macrophages, the overall impact of lncRNA CTC-537E7.2
appears to be protective. This complex interaction underscores the
intricacy of the tumor microenvironment and highlights the
necessity for further research to clarify the mechanisms behind
these associations. Understanding these dynamics may lead to new
targeted therapeutic strategies for breast cancer.
The key strength of the present study lies in its
comprehensive use of population-based databases and advanced
high-throughput sequencing data, offering a robust foundation for
its findings. Notably, the focus on lncRNA CTC-537E7.2 as a
biomarker is unprecedented in cancer research, presenting it as a
potential novel prognostic indicator specifically for
HER2+ breast cancer, which necessitates further
exploration. Additionally, the present research contributes to the
expanding domain of tumor immunology, potentially aiding the
clinical advancement of antitumor immunotherapies. Despite these
advantages, the study still faces limitations: Primarily, the
sample size of HER2+ cases in TCGA is relatively small.
This limitation may restrict the generalizability of the
conclusions; secondly, constraints at the institution where the
present study was performed limited the access to diverse and
numerous breast cancer tissue samples, necessitating the use of
tissue microarrays from Shanghai Outdo Biotech Co., Ltd. rather
than samples collected by the authors; finally, the study did not
assess the detailed biological mechanisms through which lncRNA
CTC-537E7.2 influences the progression and development of
HER2+ breast cancer. Future research with a larger
sample collection will be essential to validate the results of the
present study, enhance their applicability, and explore the
immune-related pathways involving lncRNA CTC-537E7.2 for potential
therapeutic insights.
Supplementary Material
Supporting Data
Acknowledgements
Not applicable.
Funding
The present research was funded by the National Natural Science
Foundation of China (grant no. 82003149) and the Guangzhou Science
and Technology Program (grant no. 202102020265).
Availability of data and materials
The tissue microarray data generated in the present
study may be found in the public database Figshare under accession
number 25397776 or at the following URL: https://doi.org/10.6084/m9.figshare.25397776. All
other data generated in the present study may be requested from the
corresponding author.
Authors' contributions
BG and YM designed the study. YM downloaded the
datasets and performed the statistical analyses. XL performed the
experiments, analyzed the microarray data and drafted the
manuscript. BG and YM revised the manuscript. All authors read and
approved the final version of the manuscript. XL and YM confirm the
authenticity of all the raw data.
Ethics approval and consent to
participate
Ethical approval for the use of the tissue
microarray was granted by the Clinical Research Ethics Committee,
Shanghai Outdo Biotech Co., Ltd. (Shanghai, China; approval no.
SHXC2021YF01).
Patient consent for publication
Not applicable.
Competing interests
The authors declare that they have no competing
interests.
Glossary
Abbreviations
Abbreviations:
|
AUC
|
area under the curve
|
|
BP
|
Biological Process
|
|
CC
|
Cellular Component
|
|
CIBERSORT
|
Cell-type Identification by Estimating
Relative Subsets of RNA Transcripts
|
|
ER
|
estrogen receptor
|
|
FC
|
fold change
|
|
GO
|
Gene Ontology
|
|
HER2
|
human epidermal growth factor receptor
2
|
|
IL
|
interleukin
|
|
ISH
|
in situ hybridization
|
|
Jak-STAT
|
Janus kinase-signal transducer and
activator of transcription
|
|
KEGG
|
Kyoto Encyclopedia of Genes and
Genomes
|
|
lncRNA
|
long non-coding RNAs
|
|
miRNA
|
microRNA
|
|
MF
|
Molecular Function
|
|
OS
|
overall survival
|
|
PR
|
progesterone receptor
|
|
ROC
|
receiver operating characteristic
|
|
TCGA
|
The Cancer Genome Atlas
|
|
ImmPort
|
The Immunology Database and Analysis
Portal
|
|
TGF-β
|
transforming growth factor-β
|
References
|
1
|
Siegel RL, Miller KD, Fuchs HE and Jemal
A: Cancer statistics, 2022. CA Cancer J Clin. 72:7–33. 2022.
View Article : Google Scholar : PubMed/NCBI
|
|
2
|
Carey LA, Perou CM, Livasy CA, Dressler
LG, Cowan D, Conway K, Karaca G, Troester MA, Tse CK, Edmiston S,
et al: Race, breast cancer subtypes, and survival in the Carolina
Breast Cancer Study. JAMA. 295:2492–2502. 2006. View Article : Google Scholar : PubMed/NCBI
|
|
3
|
Cronin KA, Harlan LC, Dodd KW, Abrams JS
and Ballard-Barbash R: Population-based estimate of the prevalence
of HER-2 positive breast cancer tumors for early stage patients in
the US. Cancer Invest. 28:963–968. 2010. View Article : Google Scholar
|
|
4
|
Slamon DJ, Clark GM, Wong SG, Levin WJ,
Ullrich A and McGuire WL: Human breast cancer: Correlation of
relapse and survival with amplification of the HER-2/neu oncogene.
Science. 235:177–182. 1987. View Article : Google Scholar : PubMed/NCBI
|
|
5
|
Sun M and Kraus WL: From discovery to
function: The expanding roles of long noncoding RNAs in physiology
and disease. Endocr Rev. 36:25–64. 2015. View Article : Google Scholar : PubMed/NCBI
|
|
6
|
Ao X, Ding W, Li X, Xu Q, Chen X, Zhou X,
Wang J and Liu Y: Non-coding RNAs regulating mitochondrial function
in cardiovascular diseases. J Mol Med (Berl). 101:501–526. 2023.
View Article : Google Scholar : PubMed/NCBI
|
|
7
|
Chen YG, Satpathy AT and Chang HY: Gene
regulation in the immune system by long noncoding RNAs. Nat
Immunol. 18:962–972. 2017. View
Article : Google Scholar
|
|
8
|
Liu Y, Ding W, Wang J, Ao X and Xue J:
Non-coding RNA-mediated modulation of ferroptosis in cardiovascular
diseases. Biomed Pharmacother. 164:1149932023. View Article : Google Scholar : PubMed/NCBI
|
|
9
|
Sun M, Gadad SS, Kim DS and Kraus WL:
Discovery, annotation, and functional analysis of long noncoding
RNAs controlling cell-cycle gene expression and proliferation in
breast cancer cells. Mol Cell. 59:698–711. 2015. View Article : Google Scholar
|
|
10
|
Chen DQ, Zheng XD, Cao Y, HeX D, Nian WQ,
Zeng XH and Liu XY: Long non-coding RNA LINC00628 suppresses the
growth and metastasis and promotes cell apoptosis in breast cancer.
Eur Rev Med Pharmacol Sci. 21:275–283. 2017.
|
|
11
|
Jiang X, Zhou Y, Sun AJ and Xue JL: NEAT1
contributes to breast cancer progression through modulating miR-448
and ZEB1. J Cell Physiol. 233:8558–8566. 2018. View Article : Google Scholar
|
|
12
|
Ahmadpour ST, Orre C, Bertevello PS,
Mirebeau-Prunier D, Dumas JF and Desquiret-Dumas V: Breast cancer
chemoresistance: Insights into the regulatory role of lncRNA. Int J
Mol Sci. 24:158972023. View Article : Google Scholar
|
|
13
|
Denaro N, Merlano MC and Lo Nigro C: Long
noncoding RNAs as regulators of cancer immunity. Mol Oncol.
13:61–73. 2019. View Article : Google Scholar
|
|
14
|
Zhang L, Xu X and Su X: Noncoding RNAs in
cancer immunity: Functions, regulatory mechanisms, and clinical
application. Mol Cancer. 19:482020. View Article : Google Scholar : PubMed/NCBI
|
|
15
|
Shen Y, Peng X and Shen C: Identification
and validation of immune-related lncRNA prognostic signature for
breast cancer. Genomics. 112:2640–2646. 2020. View Article : Google Scholar : PubMed/NCBI
|
|
16
|
Lingle W, Erickson BJ, Zuley ML, Jarosz R,
Bonaccio E, Filippini J, Net JM, Levi L, Morris EA, Figler GG, et
al: 2016.The Cancer Genome Atlas Breast Invasive Carcinoma
Collection (TCGA-BRCA) (Version 3) [Data set]. The Cancer Imaging
Archive. https://doi.org/10.7937/K9/TCIA.2016.AB2NAZRP
|
|
17
|
Ritchie ME, Phipson B, Wu D, Hu Y, Law CW,
Shi W and Smyth GK: limma powers differential expression analyses
for RNA-sequencing and microarray studies. Nucleic Acids Res.
43:e472015. View Article : Google Scholar : PubMed/NCBI
|
|
18
|
Hanley JA and McNeil BJ: The meaning and
use of the area under a receiver operating characteristic (ROC)
curve. Radiology. 143:29–36. 1982. View Article : Google Scholar : PubMed/NCBI
|
|
19
|
Chen B, Khodadoust MS, Liu CL, Newman AM
and Alizadeh AA: Profiling tumor infiltrating immune cells with
CIBERSORT. Methods Mol Biol. 1711:243–259. 2018. View Article : Google Scholar
|
|
20
|
Shannon P, Markiel A, Ozier O, Baliga NS,
Wang JT, Ramage D, Amin N, Schwikowski B and Ideker T: Cytoscape: A
software environment for integrated models of biomolecular
interaction networks. Genome Res. 13:2498–2504. 2003. View Article : Google Scholar : PubMed/NCBI
|
|
21
|
Matkowski R, Gisterek I, Halon A, Lacko A,
Szewczyk K, Staszek U, Pudelko M, Szynglarewicz B, Szelachowska J,
Zolnierek A and Kornafel J: The prognostic role of
tumor-infiltrating CD4 and CD8 T lymphocytes in breast cancer.
Anticancer Res. 29:2445–2451. 2009.PubMed/NCBI
|
|
22
|
Yeo W, Chan SL, Mo FK, Chu CM, Hui JW,
Tong JH, Chan AW, Koh J, Hui EP, Loong H, et al: Phase I/II study
of temsirolimus for patients with unresectable Hepatocellular
Carcinoma (HCC)-a correlative study to explore potential biomarkers
for response. BMC Cancer. 15:3952015. View Article : Google Scholar : PubMed/NCBI
|
|
23
|
Azim HA Jr, Peccatori FA, Brohée S,
Branstetter D, Loi S, Viale G, Piccart M, Dougall WC, Pruneri G and
Sotiriou C: RANK-ligand (RANKL) expression in young breast cancer
patients and during pregnancy. Breast Cancer Res. 17:242015.
View Article : Google Scholar : PubMed/NCBI
|
|
24
|
Hu W, Li X, Zhang C, Yang Y, Jiang J and
Wu C: Tumor-associated macrophages in cancers. Clin Transl Oncol.
18:251–258. 2016. View Article : Google Scholar
|
|
25
|
Xiong S, Dong L and Cheng L: Neutrophils
in cancer carcinogenesis and metastasis. J Hematol Oncol.
14:1732021. View Article : Google Scholar
|
|
26
|
Terry RL and Miller SD: Molecular control
of monocyte development. Cell Immunol. 291:16–21. 2014. View Article : Google Scholar
|
|
27
|
Miao X, Leng X and Zhang Q: The current
state of nanoparticle-induced macrophage polarization and
reprogramming research. Int J Mol Sci. 18:3362017. View Article : Google Scholar
|
|
28
|
Biswas SK and Mantovani A: Macrophage
plasticity and interaction with lymphocyte subsets: Cancer as a
paradigm. Nat Immunol. 11:889–896. 2010. View Article : Google Scholar
|
|
29
|
Salmena L, Poliseno L, Tay Y, Kats L and
Pandolfi PP: A ceRNA Hypothesis: The Rosetta Stone of a Hidden RNA
Language? Cell. 146:353–358. 2011. View Article : Google Scholar
|
|
30
|
Maughan KL, Lutterbie MA and Ham PS:
Treatment of breast cancer. Am Fam Physician. 81:1339–1346.
2010.PubMed/NCBI
|
|
31
|
Yu T, Gan S, Zhu Q, Dai D, Li N, Wang H,
Chen X, Hou D, Wang Y, Pan Q, et al: Modulation of M2 macrophage
polarization by the crosstalk between Stat6 and Trim24. Nat Commun.
10:43532019. View Article : Google Scholar : PubMed/NCBI
|
|
32
|
Ghafouri-Fard S, Abak A, Tavakkoli Avval
S, Shoorei H, Taheri M and Samadian M: The impact of non-coding
RNAs on macrophage polarization. Biomed Pharmacother.
142:1121122021. View Article : Google Scholar : PubMed/NCBI
|
|
33
|
Zong S, Dai W, Guo X and Wang K:
LncRNA-SNHG1 promotes macrophage M2-like polarization and
contributes to breast cancer growth and metastasis. Aging (Albany
NY). 13:23169–23181. 2021. View Article : Google Scholar : PubMed/NCBI
|
|
34
|
Li H, Jiang T, Li MQ, Zheng XL and Zhao
GJ: Transcriptional regulation of macrophages polarization by
MicroRNAs. Front Immunol. 9:11752018. View Article : Google Scholar
|
|
35
|
Sánchez-González I, Bobien A, Molnar C,
Schmid S, Strotbek M, Boerries M, Busch H and Olayioye MA: miR-149
suppresses breast cancer metastasis by blocking paracrine
interactions with macrophages. Cancer Res. 80:1330–1341. 2020.
View Article : Google Scholar
|