Introduction
Gliomas are the most common type of primary
intracranial tumors in adults, accounting for ~81% of malignant
brain tumors in the United States between 2014–2018 (1). According to the 2021 World Health
Organization (WHO) classification of central nervous system (CNS)
tumors, gliomas are divided into grades 1–4, with grades 1 and 2
classed as low-grade gliomas and grades 3 and 4 classed as
high-grade gliomas (2). Currently,
treatment methods for gliomas include maximal safe resection,
chemoradiotherapy (3) and emerging
therapies, such as immunotherapy (4) and tumor-treating field therapy
(5). Treatment outcomes for gliomas
are influenced by several factors, including the tumor size,
location, type, pathological grade and genetic characteristics.
Some gliomas are challenging to resect and may respond poorly to
radiation and chemotherapy, often resulting in suboptimal treatment
outcomes (6).
Gliomas account for ~81% of all malignant brain
tumors and 30% of all brain and CNS tumors (7). The global incidence is estimated at
5–6 cases per 100,000 individuals annually, with glioblastoma (GBM)
being the most aggressive subtype, representing 45–50% of all
gliomas (2). Patients typically
present with neurological symptoms such as persistent headaches,
seizures, cognitive impairment and focal deficits, which vary
according to tumor location and progression (8,9).
High-grade gliomas, particularly GBM, are associated with a poor
prognosis, with a median survival of ~15 months despite standard
therapies (10). Diagnosis is
primarily based on MRI, but definitive confirmation requires
histopathological and molecular assessment, including isocitrate
dehydrogenase (IDH) mutation status and O6-methylguanine DNA
methyltransferase (MGMT) promoter methylation (11,12).
Given the aggressive nature of gliomas and the challenges in
treatment, ongoing research aims to identify novel biomarkers and
therapeutic targets to improve patient outcomes.
As a newly discovered tumor-related gene, DEP domain
containing 1 (DEPDC1) was first identified in bladder cancer by
Kanehira et al (13) in
2007. More recently, the overexpression of DEPDC1 has been widely
reported in malignant tumors originating from several organs,
including the liver (14), lung
(15), colon (16), breast (17), bone (18) and prostate (19). Previous research has demonstrated
that DEPDC1 serves a key role in tumorigenesis by contributing to
cellular functions, such as promoting cell proliferation and cell
cycle progression, while suppressing apoptosis (20–22).
However, few studies have investigated the role of DEPDC1 in the
development and prognosis of gliomas.
In the present study, the relationship between
DEPDC1 expression levels and the clinical characteristics of
gliomas was explored by analyzing online databases and further
examining the functional role of DEPDC1 through Gene ontology (GO)
and gene set enrichment analysis (GSEA). The present study aimed to
investigate the potential role of DEPDC1 in gliomas, with a focus
on its association with tumor progression and patient prognosis.
Understanding the implications of DEPDC1 expression could
potentially contribute to the development of targeted therapeutic
strategies for glioma management in the future.
Materials and methods
Data source
The present study utilized publicly available
datasets from the China Glioma Genome Atlas (CGGA), including
Cohort 1 (accession no. CGGA_325) and Cohort 2 (accession no.
CGGA_693), to analyze the expression of DEPDC1 in gliomas. The raw
Fastq data for these datasets are available under the BIGD
accession numbers PRJCA001746 (Cohort 1) and PRJCA001747 (Cohort
2). Cohort 1 and 2 consist of gene expression data and clinical
profiles of patients with glioma, providing valuable insights into
tumor biology and disease progression. The original studies
detailing these datasets can be obtained from previous CGGA
publications (23,24). Glioma gene expression and clinical
data were downloaded from the CGGA database (https://www.cgga.org.cn/download.jsp), which includes
variables such as the sex, age, WHO grade (2), IDH mutation status, 1p/19q co-deletion
status, MGMT promoter methylation status and survival information.
Additionally, the Glioma Longitudinal Analysis (GLASS) dataset
(http://synapse.org/glass) was used as
the validation cohort. To elucidate the relationship between DEPDC1
expression and glioma prognosis, the present study analyzed its
association with key clinical features using data from the CGGA
database. Specifically, two RNA sequencing datasets were used, CGGA
Cohort 1 and CGGA Cohort 2, comprising 325 and 693 glioma samples,
respectively.
In the CGGA Cohort 1 dataset, patients were divided
into a high expression level group (≥0.56) and a low expression
group (<0.56), using the median DEPDC1 expression as the cut-off
value. Similarly, for CGGA Cohort 2, the median DEPDC1 expression
value of 0.21 was used to stratify patients into high and low
expression groups. These thresholds were applied to assess the
prognostic significance of DEPDC1 expression in glioma
patients.
Relationship between DEPDC1 and
clinical features
The association between the expression of DEPDC1 and
common prognostic features was analyzed. The key features,
including WHO classification (grades 1–4), IDH mutation status
(wild type/mutant), primary vs. recurrent tumor status, 1p/19q
deletion status (coding/non-coding deletion), age, sex, MGMT
promoter methylation and DEPDC1 expression, were compared. Patients
with glioma were divided into two groups based on high or low
DEPDC1 expression levels, and survival curves were generated using
Kaplan-Meier analysis. The Kaplan-Meier analysis was performed
using overall survival (OS) as the survival metric, with time
measured in months from the initial diagnosis to either the last
follow-up or death.
Gene enrichment analysis
Differentially expressed genes (DEGs) between high
and low DEPDC1 expression groups was identified using the ‘samr’
package (version 3.0; http://cran.r-project.org/web/packages/samr/) in R
(log2 FC>2 and P<0.05 were the criteria for screening DEGs).
GSEA (https://www.gsea-msigdb.org/gsea/index.jsp) was
performed to identify signaling pathways significantly associated
with the DEPDC1 expression levels. GSEA methods evaluate gene
expression patterns across gene sets rather than focusing on
individual genes, which can provide a more comprehensive view of
enrichment pathways.
Construction of prediction model
Univariate and multivariate Cox proportional hazards
regression analyses were performed to assess the relationship
between variables and OS in CGGA and GLASS datasets. Variables with
P<0.05 in the multivariate Cox regression analysis were selected
to construct a prognostic risk model.
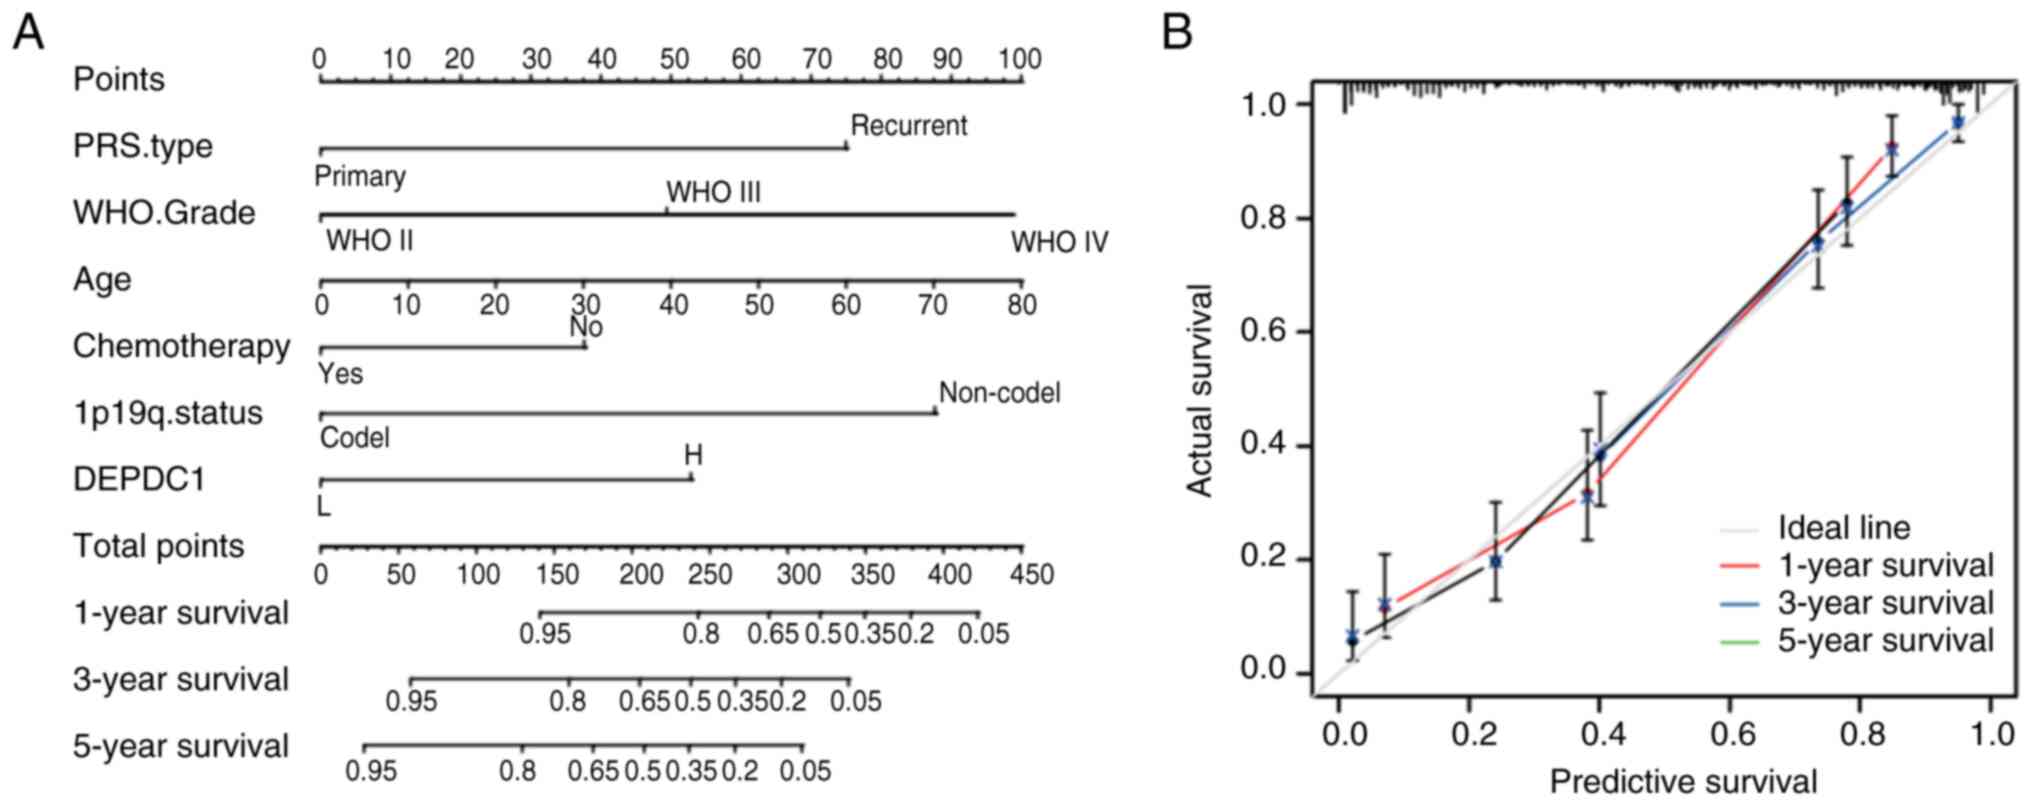
Build a nomogram
A nomogram was constructed in the training cohort
using the ‘rms’ package (version 6.7–0; http://cran.r-project.org/web/packages/rms) in R.
The upper portion of the nomogram represents the scoring system,
whereas the lower portion represents the prediction system. Based
on the scores for each factor and the total score, this tool
accurately predicts the 1-, 3- and 5-year survival rates of
patients with glioma. Calibration curves and C-index values were
used to evaluate the accuracy of the survival predictions.
Cell lines and agents
The human glioma U87 and LN229 cell lines were
obtained from the Chinese Academy of Medical Science (Beijing,
China). The U87 cell line is a glioblastoma of unknown origin that
has been identified as an ATCC type using short tandem repeat
profiling. Cells were cultured in DMEM supplemented with 10% fetal
bovine serum (FBS; Gibco; Thermo Fisher Scientific, Inc.) and 1%
penicillin-streptomycin (100 U/ml penicillin and 100 µg/ml
streptomycin; Gibco; Thermo Fisher Scientific, Inc.), and incubated
in a humidified, CO2-rich environment (5%
CO2) at 37°C. The β-actin antibody (cat. no.
20536-1-AP), MMP-2 (cat. no. 10373-2-AP), MMP-9 (cat. no.
10375-2-AP) and secondary antibody (cat. nos. SA00001-1 and
SA00001-2) were obtained from Proteintech Group, Inc., while the
DEPDC1 antibody (cat. no. ab197246) was purchased from Abcam.
Cell transfection
The lentiviral transduction in the present study was
performed using a 2nd generation lentiviral system. The 293T cell
line was used as the packaging cell line, obtained from American
Type Culture Collection. For transfection, 10 µg of lentiviral
plasmid, 5 µg of packaging plasmid (psPAX2) and 2.5 µg of envelope
plasmid (pMD2.G) were used in a 4:2:1 ratio. Transfection was
carried out at 37°C for 6 h, after which the medium was replaced
with fresh culture medium. Lentiviral particles were collected 48 h
post-transfection by harvesting the supernatant and filtering it
through a 0.45-µm filter. The multiplicity of infection used for
infecting target cells was 10. Transduction was carried out by
incubating the target cells with viral particles at 37°C for 24 h,
followed by a medium change. After 72 h, cells were subjected to
subsequent experiments.
To establish stable cell lines, puromycin selection
was performed using a concentration of 2 µg/ml for 7 days. Once the
selection was complete, cells were maintained in 1 µg/ml puromycin
for continued culture. U87 and LN229 cells were seeded at a density
of 2×10⁵ cells per well in 6-well plates and the DEPDC1
gene was silenced using pLKO.1 lentiviral transduction containing
DEPDC1-targeting shRNA in both cell lines. The DEPDC1-shRNA and
negative control shRNA were designed by Suzhou GenePharma Co.,
Ltd., using the following sequences: shDEPDC1 sense,
5′-GAACTATCAAGAGTAGTTCGT-3′ and antisense,
5′-UUGUUCUGAAUACAUCUCGTT-3′; and shCtrl sense,
5′-GUACCGCACGUCAUUCGUAUC-3′ and antisense,
5′-UACGAAUGACGUGCGGUACGU-3′.
Reverse transcription quantitative
polymerase chain reaction (RT-qPCR)
Total RNA was extracted from the transfected cells
using TRIzol® reagent (Invitrogen; Thermo Fisher
Scientific, Inc.) according to the manufacturer's protocol. Reverse
transcription was performed using the GoScript Reverse
Transcription System (Promega Corporation) and RT-qPCR was
performed with SYBR Premix Ex Taq II (Takara Bio, Inc.), following
the manufacturers' instructions. Relative mRNA levels of DEPDC1
were normalized against GAPDH using the 2−ΔΔCq formula
(25). The primer sequences were as
follows: DEPDC1 forward, 5′-TTCTAGATCTCCCTGAACCTCT-3′; and reverse,
5′-TGATGTAGCCACAAACAACCAAA-3′; and GAPDH forward,
5′-GGAGCGAGATCCCTCCAAAAT-3′; and reverse,
5′-GGCTGTTGTCATACTTCTCATGG-3′. The thermocycling conditions were as
follows: 95°C for 2 min; 40 cycles of 95°C for 10 sec, 60°C for 30
sec and 72°C for 30 sec. To ensure consistency and reliability,
each experiment included three technical replicates.
Western blotting
After transfection, cells were harvested for western
blot analysis. Total cellular protein was extracted using RIPA
buffer (Beyotime Institute of Biotechnology), quantified using a
BCA assay (Beyotime Institute of Biotechnology). Subsequently, 20
µg of each protein sample was loaded per lane and separated on a
10% SDS-PAGE gel. Following electrophoresis, proteins were
transferred onto PVDF membranes (Sigma-Aldrich; Merck KGaA) for
further analysis. Membranes were blocked with 5% bovine serum
albumin for 1 h at room temperature and incubated with the primary
antibodies anti-DEPDC1 (cat. no. ab197246; 1:1,000; Abcam),
anti-MMP-2 (cat. no. 10373-2-AP; 1:1,000; Proteintech Group, Inc.),
anti-MMP-9 (cat. no. 10375-2-AP; 1:1,000; Proteintech Group, Inc.)
and anti-β-actin (cat. no. 66009-1-Ig; 1:2,000; Proteintech Group,
Inc.) overnight at 4°C. After washing, the membranes were incubated
with HRP-conjugated goat anti-rabbit IgG (cat. no. SA00001-2;
Proteintech Group, Inc.) and HRP-conjugated goat anti-mouse IgG
(cat. no. SA00001-1; Proteintech Group, Inc.) antibodies at a
dilution of 1:5,000 at room temperature for 1.5 h, followed by
three 15-min washes with TBST (Tris-buffered saline with 0.1%
Tween-20; cat. no. P9416; Sigma-Aldrich). Protein expression levels
were detected using Image Lab software (version 6.1; Bio-Rad
Laboratories, Inc.) and visualized using the ECL Prime Western
Blotting Detection Reagent (cat. no. GERPN2232; MilliporeSigma).
The optical density of each strip was analyzed using ImageJ
software (version 1.53t; National Institutes of Health). All the
experiments were performed in triplicate.
Cell Counting Kit-8 (CCK-8)
experiment
The CCK-8 assay was performed to evaluate the
proliferation of U87 and LN229 cells following transfection.
Briefly, 1×10³ normal and transfected cells were seeded
into 96-well plates and cultured for 24, 48 or 72 h. Cell
proliferation was assessed using a CCK-8 kit (GLPBIO Technology
LLC) according to the manufacturer's protocol, and the absorbance
was measured at a wavelength of 450 nm after incubation with the
CCK-8 reagent for 2 h at 37°C.
Wound healing assay
A wound healing assay was performed to evaluate the
migration capacity of U87 and LN229 cells following transfection.
Briefly, 1×10⁶ cells were seeded in 6-well plates and
cultured for 24 h. A cross-shaped scratch was made on the monolayer
of cells using a sterile 10-µl pipette tip. The scratched area was
washed three times with PBS to remove the cell debris. The cells
were then cultured in a serum-free medium for an additional 24 h
and images of the wound area were captured. The wound area,
distance between wound edges and cell confluence were measured
using ImageJ software (version 1.53t; National Institutes of
Health). Scratch closed rate=(initial scratch width-scratch width
after 24 h)/initial scratch width ×100%. The assay was repeated
three times, and images were captured using an Olympus IX73
inverted fluorescence microscope (Olympus Corporation).
Transwell experiment
The invasive potential of U87 and LN229 cells after
transfection was assessed using a Transwell assay. Prior to
seeding, Matrigel was thawed on ice overnight at 4°C, diluted to a
final concentration of 2 mg/ml with cold serum-free medium and
50–100 µl was added to the upper chamber of each Transwell insert.
The plate was incubated at 37°C for 30–60 minto allow the Matrigel
to polymerize. Serum-free cells (1×10⁵ cells/well) were
seeded in the upper chambers, whereas the lower chambers contained
10% FBS, which served as a chemoattractant. The cells were cultured
at 37°C for 12 h and subsequently washed three times with PBS.
Cells on the lower surface of the membrane were fixed with 4%
paraformaldehyde at room temperature for 20 min and subsequently
stained with crystal violet at room temperature for 30 min.
Subsequently, the stained cells were imaged using an Olympus IX73
inverted microscope (Olympus Corporation) and counted using ImageJ
software (version 1.53t; National Institutes of Health). This assay
was performed in triplicate.
Statistical analysis
All statistical analyses were performed using the R
software (version 3.6.2; Institute for Statistical Computing,
Vienna, Austria), GraphPad Prism 9.0 (Dotmatics) or SPSS 18.0
(SPSS, Inc.). Kaplan-Meier analyses were performed using log-rank
tests to assess survival differences between the groups, and the
analyses were conducted using the ‘survival’ and ‘survminer’ R
software packages. c2 tests were used to evaluate the
differences in clinical and molecular characteristics between the
different DEPDC1 expression groups. Univariate and multivariate Cox
regression analyses were performed to identify the prognostic
factors. Unpaired t-tests were performed to test the significance
of differences between the two groups. P<0.05 was considered to
indicate a statistically significant difference.
Results
Expression of DEPDC1 and its
association with clinical characteristics and prognosis of
gliomas
With advancing research on gliomas, several
molecular markers have been identified as pivotal for understanding
the pathogenesis and diagnosis of gliomas, including IDH and 1p19q
status (26,27). To elucidate the relationship between
DEPDC1 expression and glioma prognosis, the association between
DEPDC1 expression and key clinical features of glioma was examined
in the present study using data from the CGGA Cohort 1 and 2
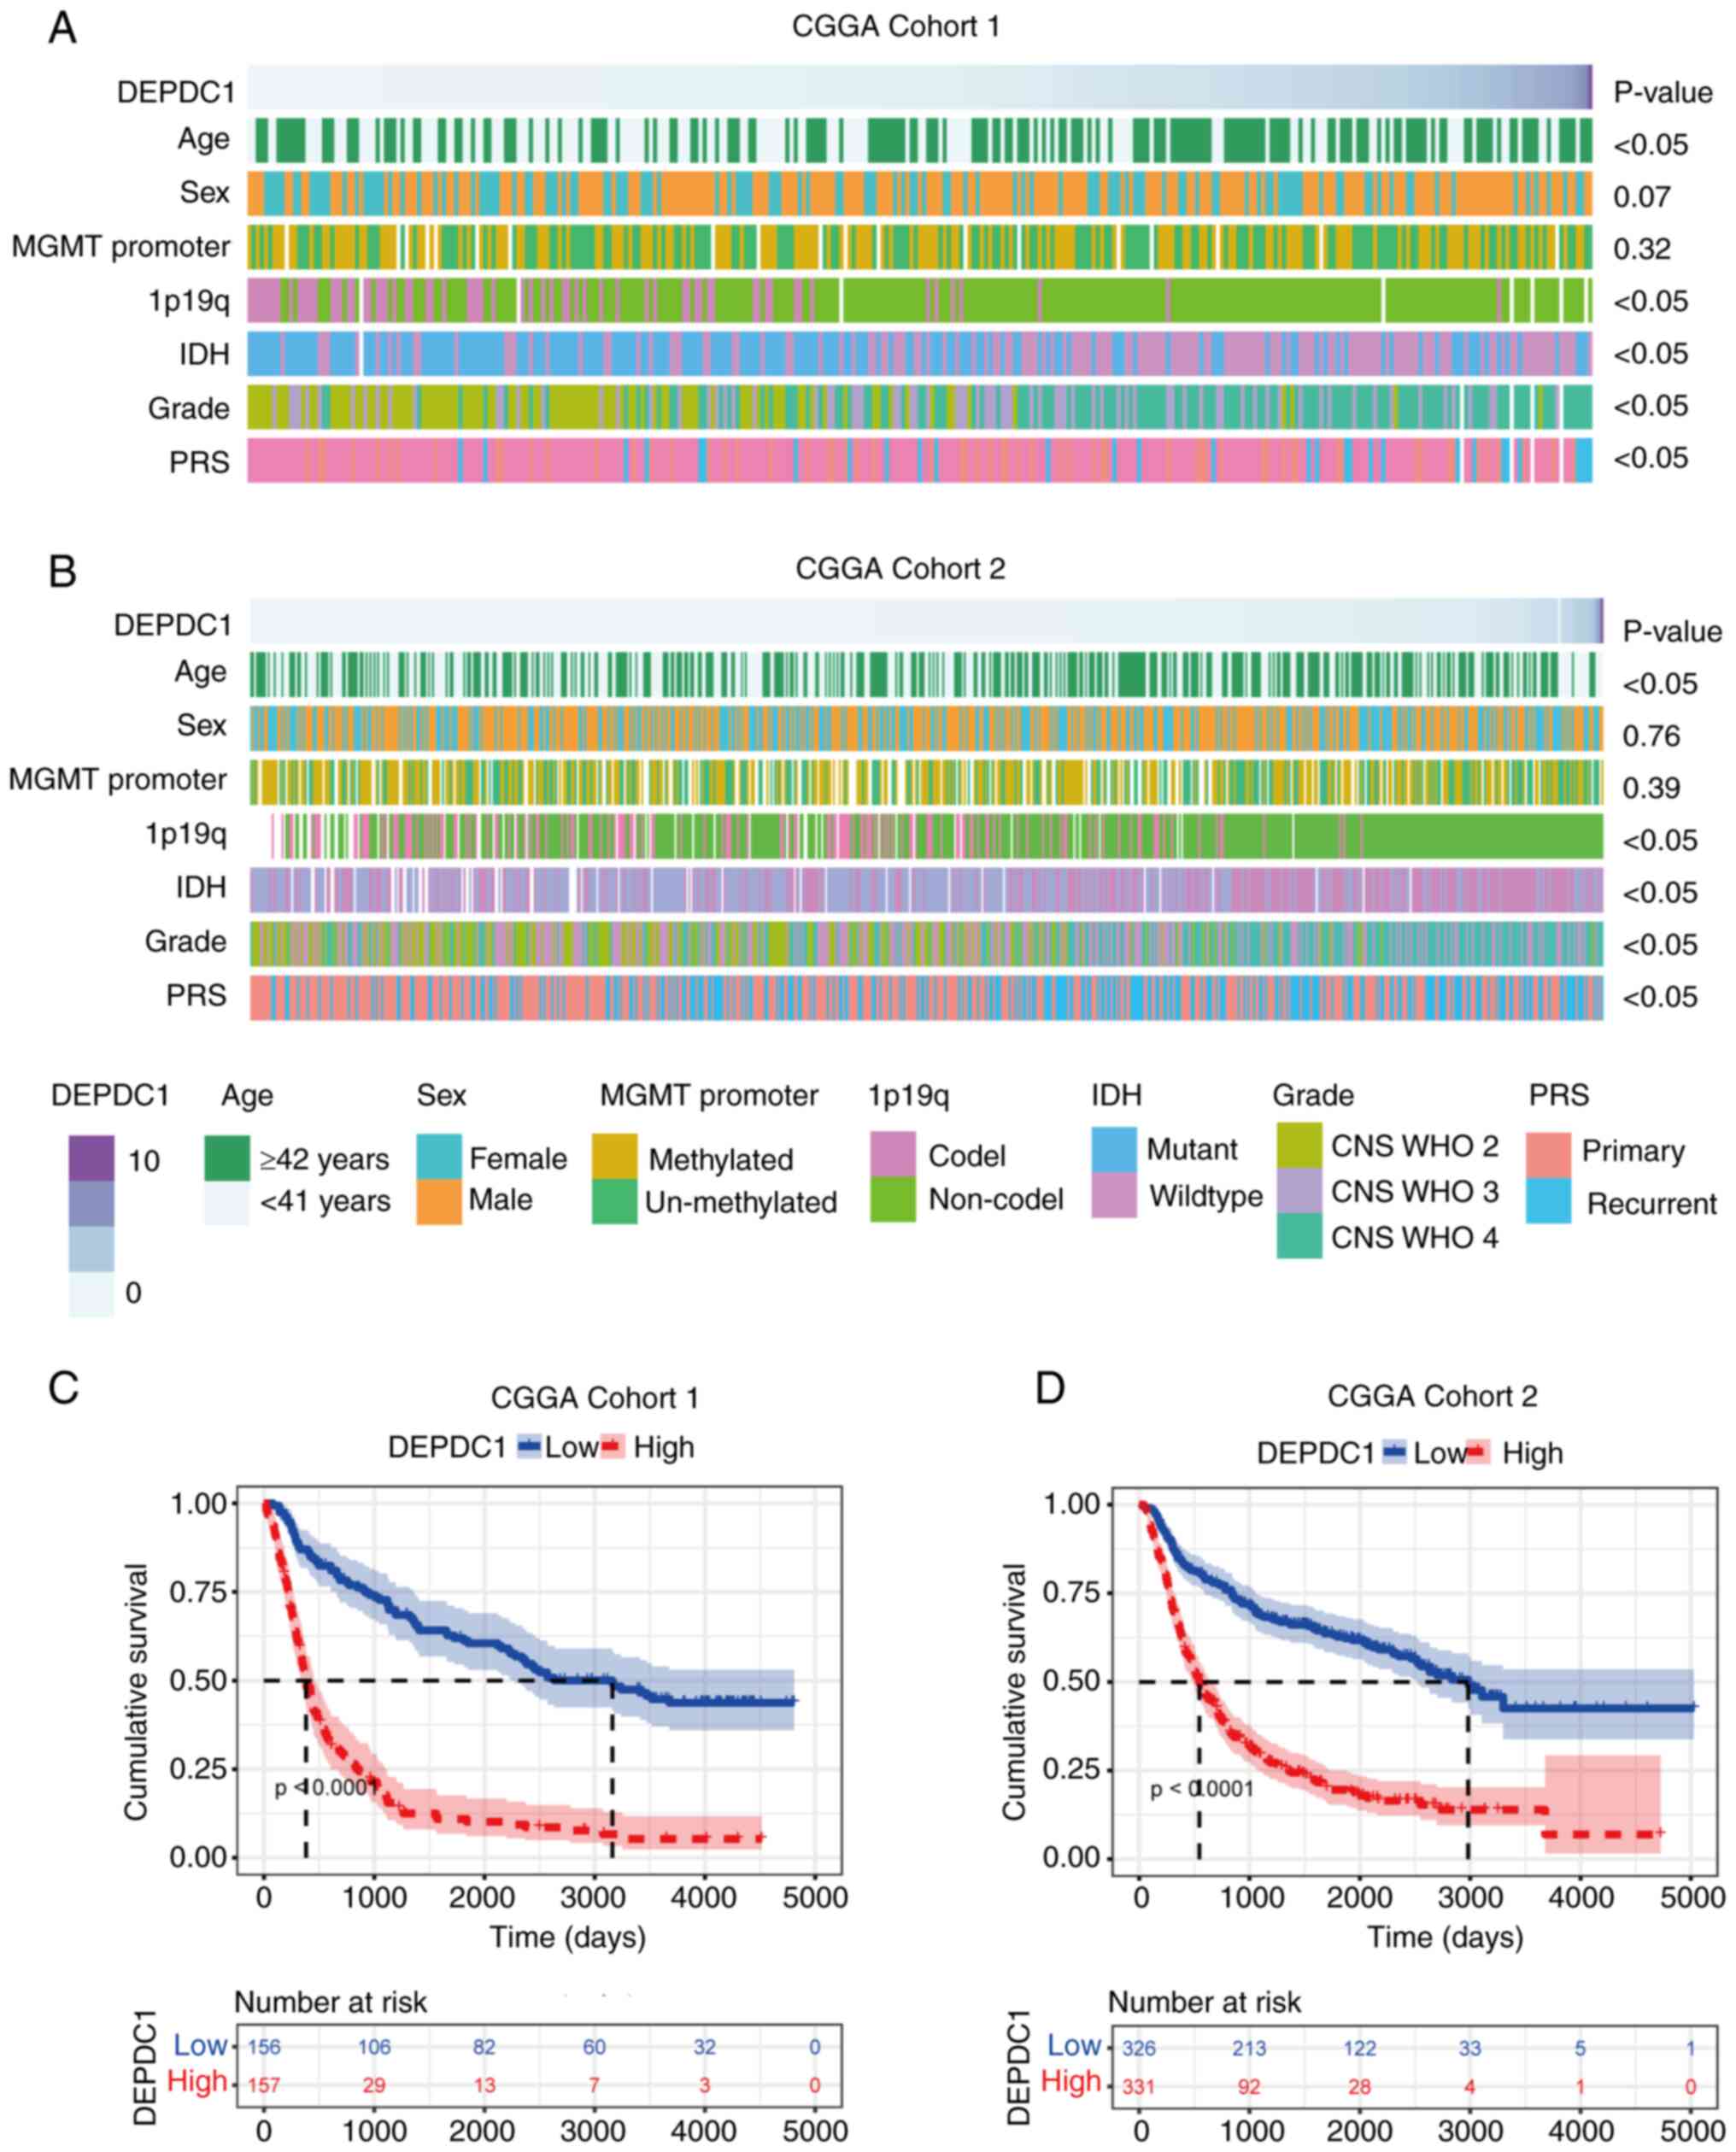
datasets. As shown in Fig. 1A and
B, the expression of DEPDC1 was significantly elevated in older
patients (≥42 years), patients with a high histological grade (CNS
WHO grades 3 and 4), those with IDH wild-type gliomas, patients
with 1p19q non-codel gliomas and those with recurrent tumors.
Although similar trends were observed in the GLASS dataset
(Fig. S1A), the association
between DEPDC1 and tumor recurrence was not statistically
significant. These findings suggest that expression of DEPDC1 is
enriched in patients with glioma with high malignancy.
To further investigate the prognostic implications
of DEPDC1 expression differences, a Kaplan-Meier survival analysis
was performed. As illustrated in Fig.
1C and D, patients from both the CGGA Cohort 1 and 2 datasets
were stratified into high and low DEPDC1 expression groups. The
analysis revealed that patients with low DEPDC1 expression had a
significantly improved prognosis compared with those patients with
high DEPDC1 expression (P<0.0001). These results were validated
using a GLASS cohort (Fig. S1B)
(P<0.0001), with outcomes consistent with those observed in CGGA
cohort 325 (Cohort 1) and CGGA cohort 693 (Cohort 2). Collectively,
these findings indicate that high expression of DEPDC1 is
associated with shorter survival times, suggesting it has potential
as a prognostic marker in gliomas.
GO analysis of DEGs and GSEA
enrichment analysis
To further investigate the potential mechanisms by
which DEPDC1 contributes to the deterioration of prognosis in
patients with glioma, the pathways that DEPDC1 modulates were
examined. Patients were divided into two groups based on the median
expression of DEPDC1, with the low expression group serving as the
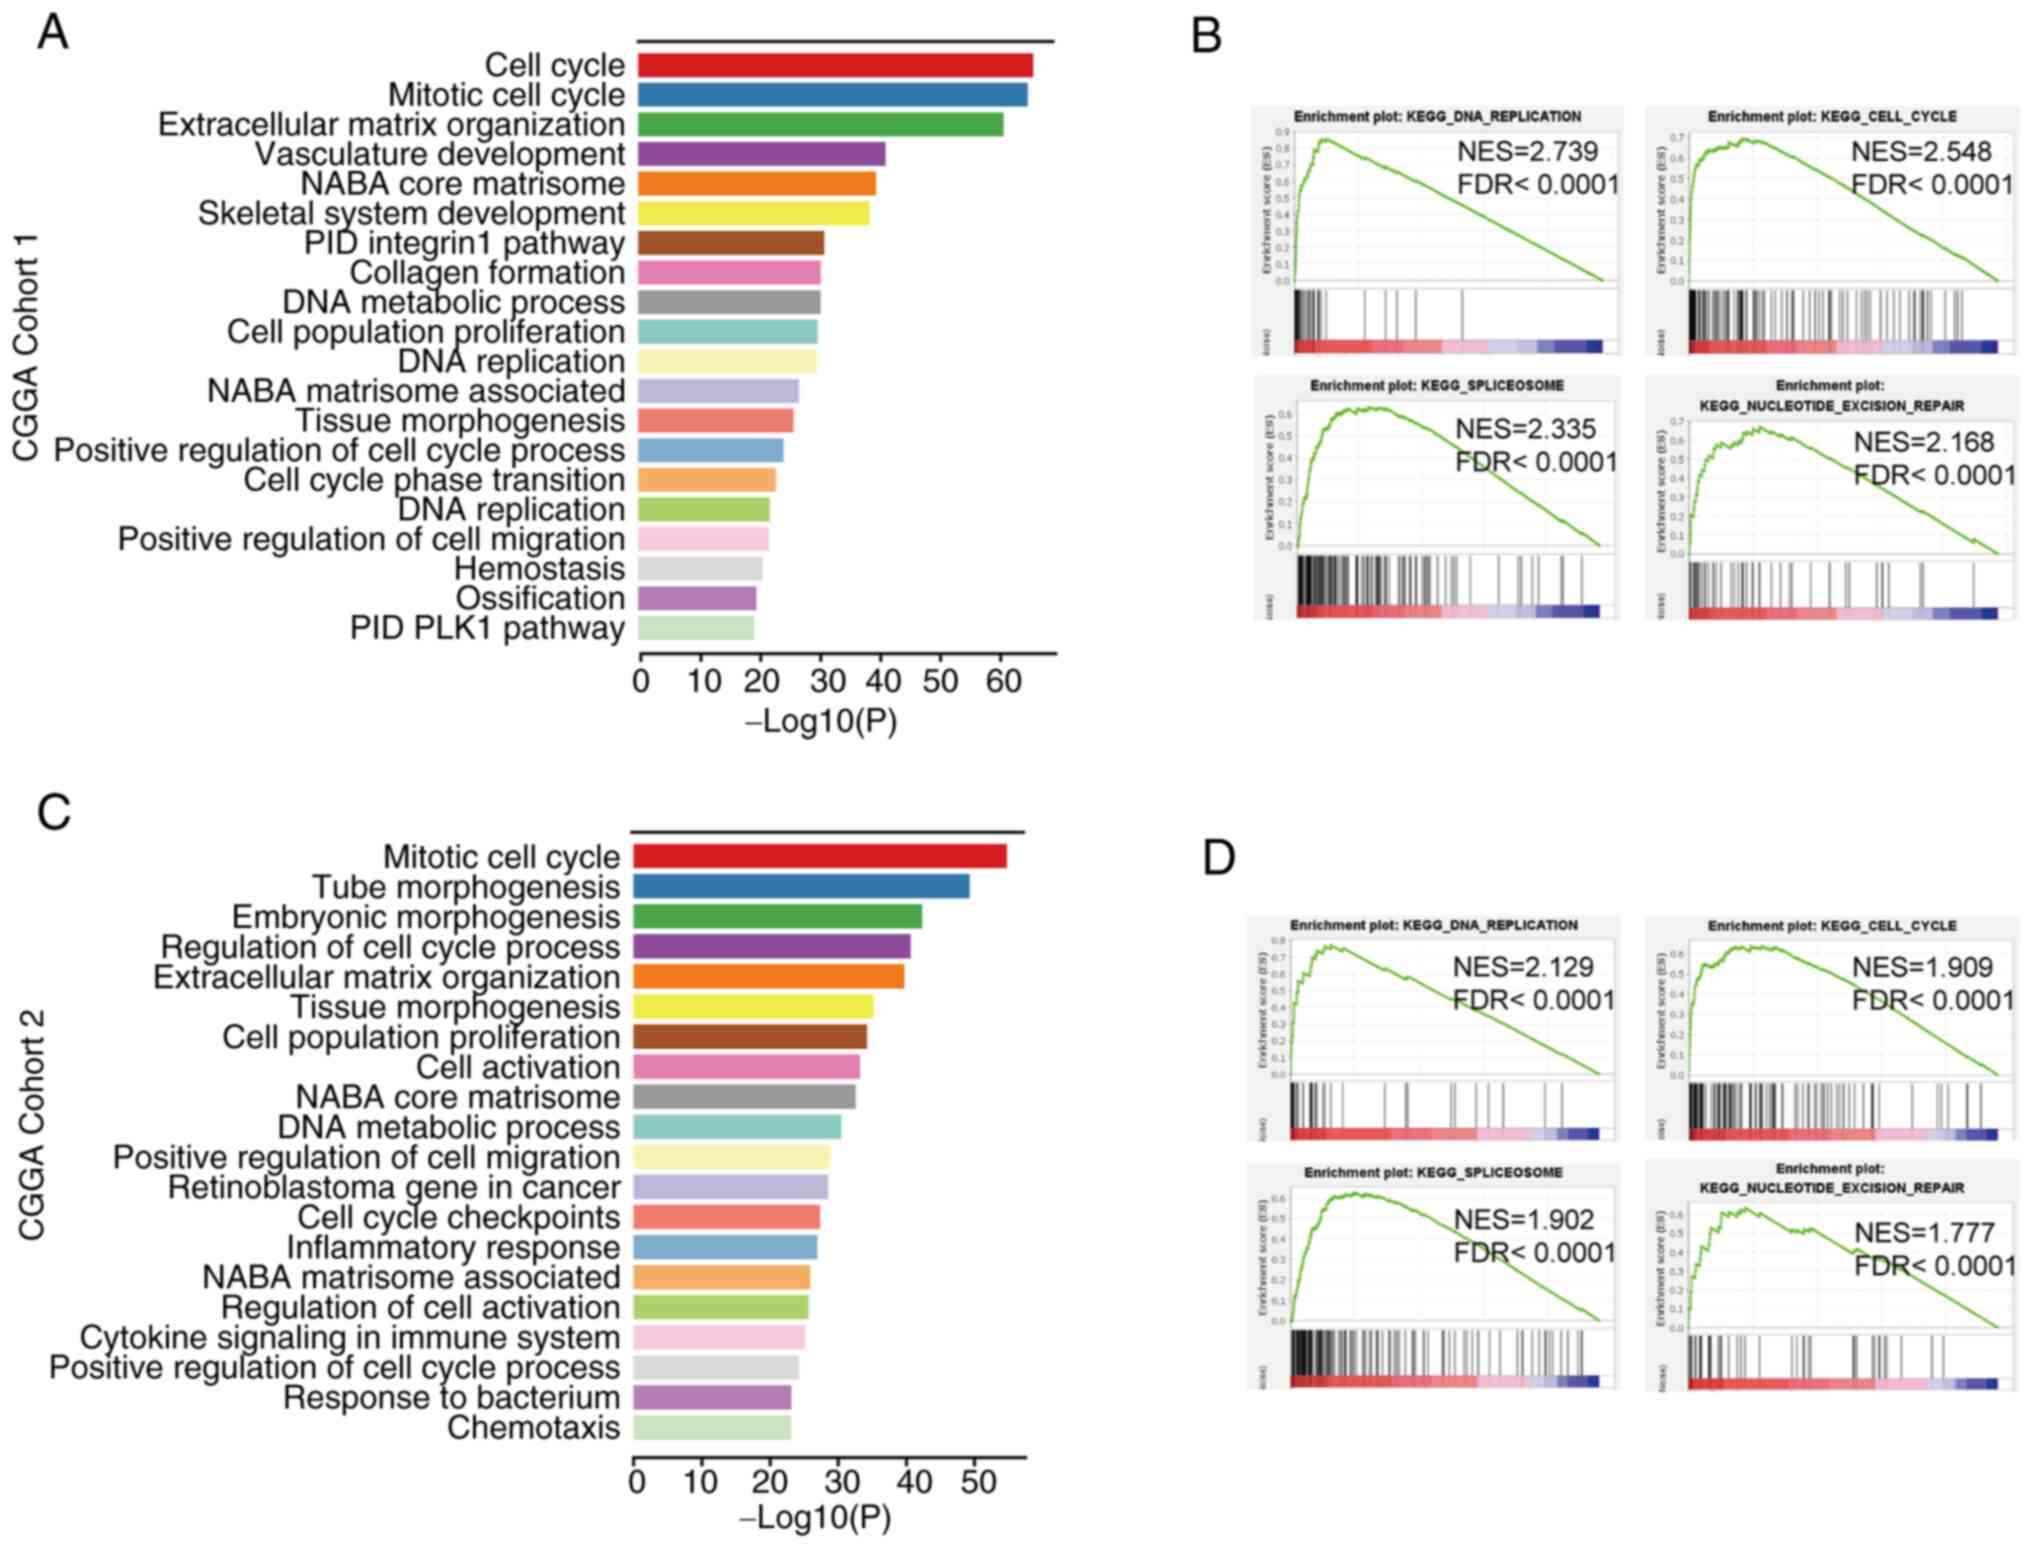
control. In CGGA Cohort 1, 957 genes were upregulated (log2 FC
>2; P<0.05). GO analysis was performed on the DEGs. GO
analysis revealed the top enriched pathways associated with DEPDC1
expression, with the top five pathways including ‘cell cycle’,
‘mitotic cell cycle’, ‘extracellular matrix organization’,
‘vasculature development’ and ‘NABA core matrisome’ (Fig. 2A). In CGGA Cohort 2, 324 genes were
upregulated in the high expression group (Log2 FC >2;
P<0.05). GO analysis identified DEPDC1-related pathways among
the significantly enriched terms, with the top five being ‘mitotic
cell cycle’, ‘tube morphogenesis’, ‘embryonic morphogenesis’,
‘regulation of cell cycle process’ and ‘extracellular matrix
organization’ (Fig. 2C). These
findings were consistent with the data shown in Fig. 2A. While ‘inflammatory response’ and
‘cytokine signaling in the immune system’ were not the
highest-ranked pathways by statistical significance, they were
highlighted due to their potential involvement in the glioma
microenvironment and immune regulation. Therefore, both datasets
predominantly showed enrichment in the cell cycle, vascular
development and immune-related pathways. GSEA was performed to
confirm these findings. As shown in Fig. 2B and D, the main enriched pathways
identified using GSEA included ‘cell cycle’, ‘DNA replication’,
‘spliceosome’ and ‘nucleotide excision repair’. These results
confirmed that DEPDC1 is closely associated with the glioma cell
cycle, immune response and vascular development. Similar results
were obtained for the GLASS dataset (Fig. S2).
Expression of DEPDC1 is closely
associated with the cell cycle
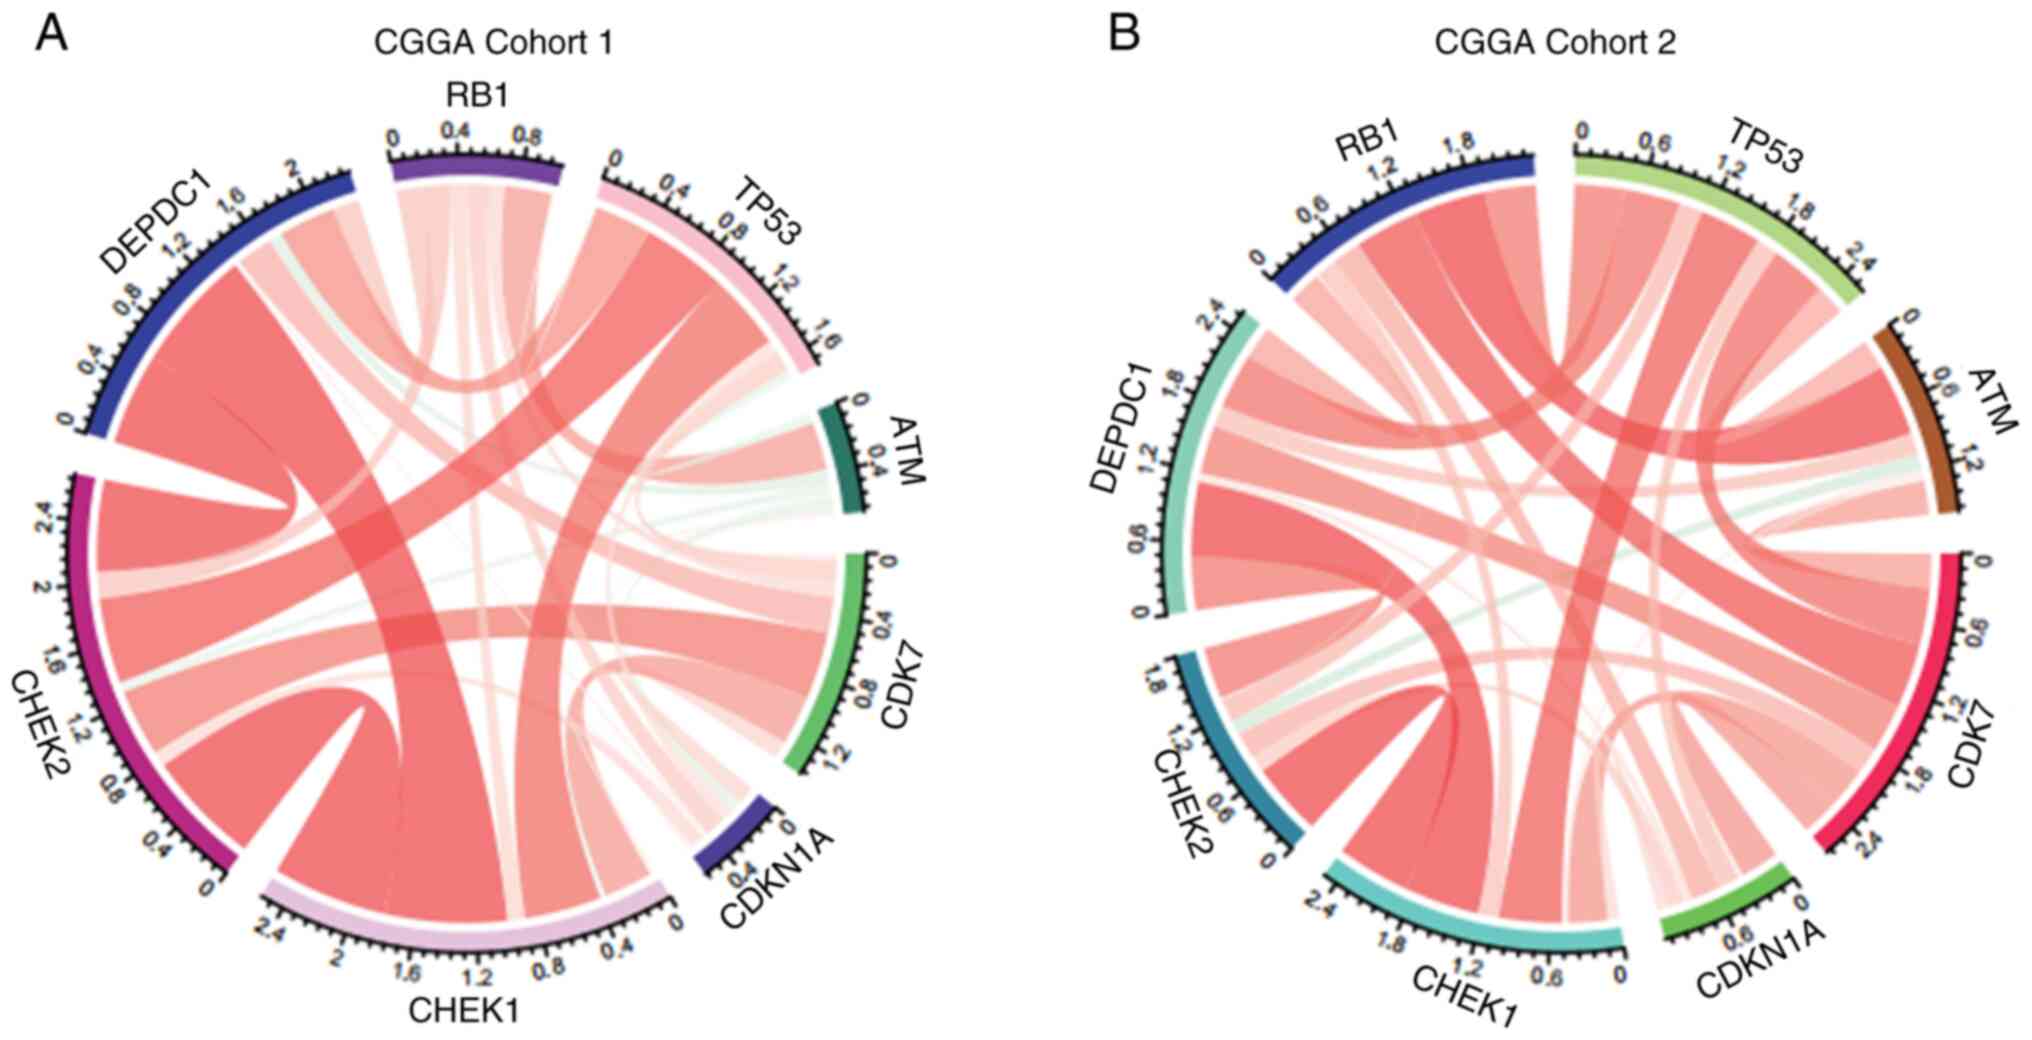
To further explore the mechanism through which
DEPDC1 regulates glioma cell proliferation, its relationship with
established cell cycle checkpoints was examined. The analysis
revealed that checkpoint kinase 1 (CHEK1), cyclin-dependent kinase
7 (CDK7) and tumor protein 53 (TP53) were positively associated
with the expression of DEPDC1 in both CGGA Cohorts 1 and 2
(Fig. 3A and B). A similar trend
was observed in the GLASS cohort (Fig.
S3B), although the correlation between DEPDC1 and CDK7 appears
less pronounced compared with other cell cycle-related genes. These
results indicate that the expression of DEPDC1 may serve a role in
the regulation of glioma cell cycle progression.
DEPDC1 is an independent prognostic
factor in patients with glioma
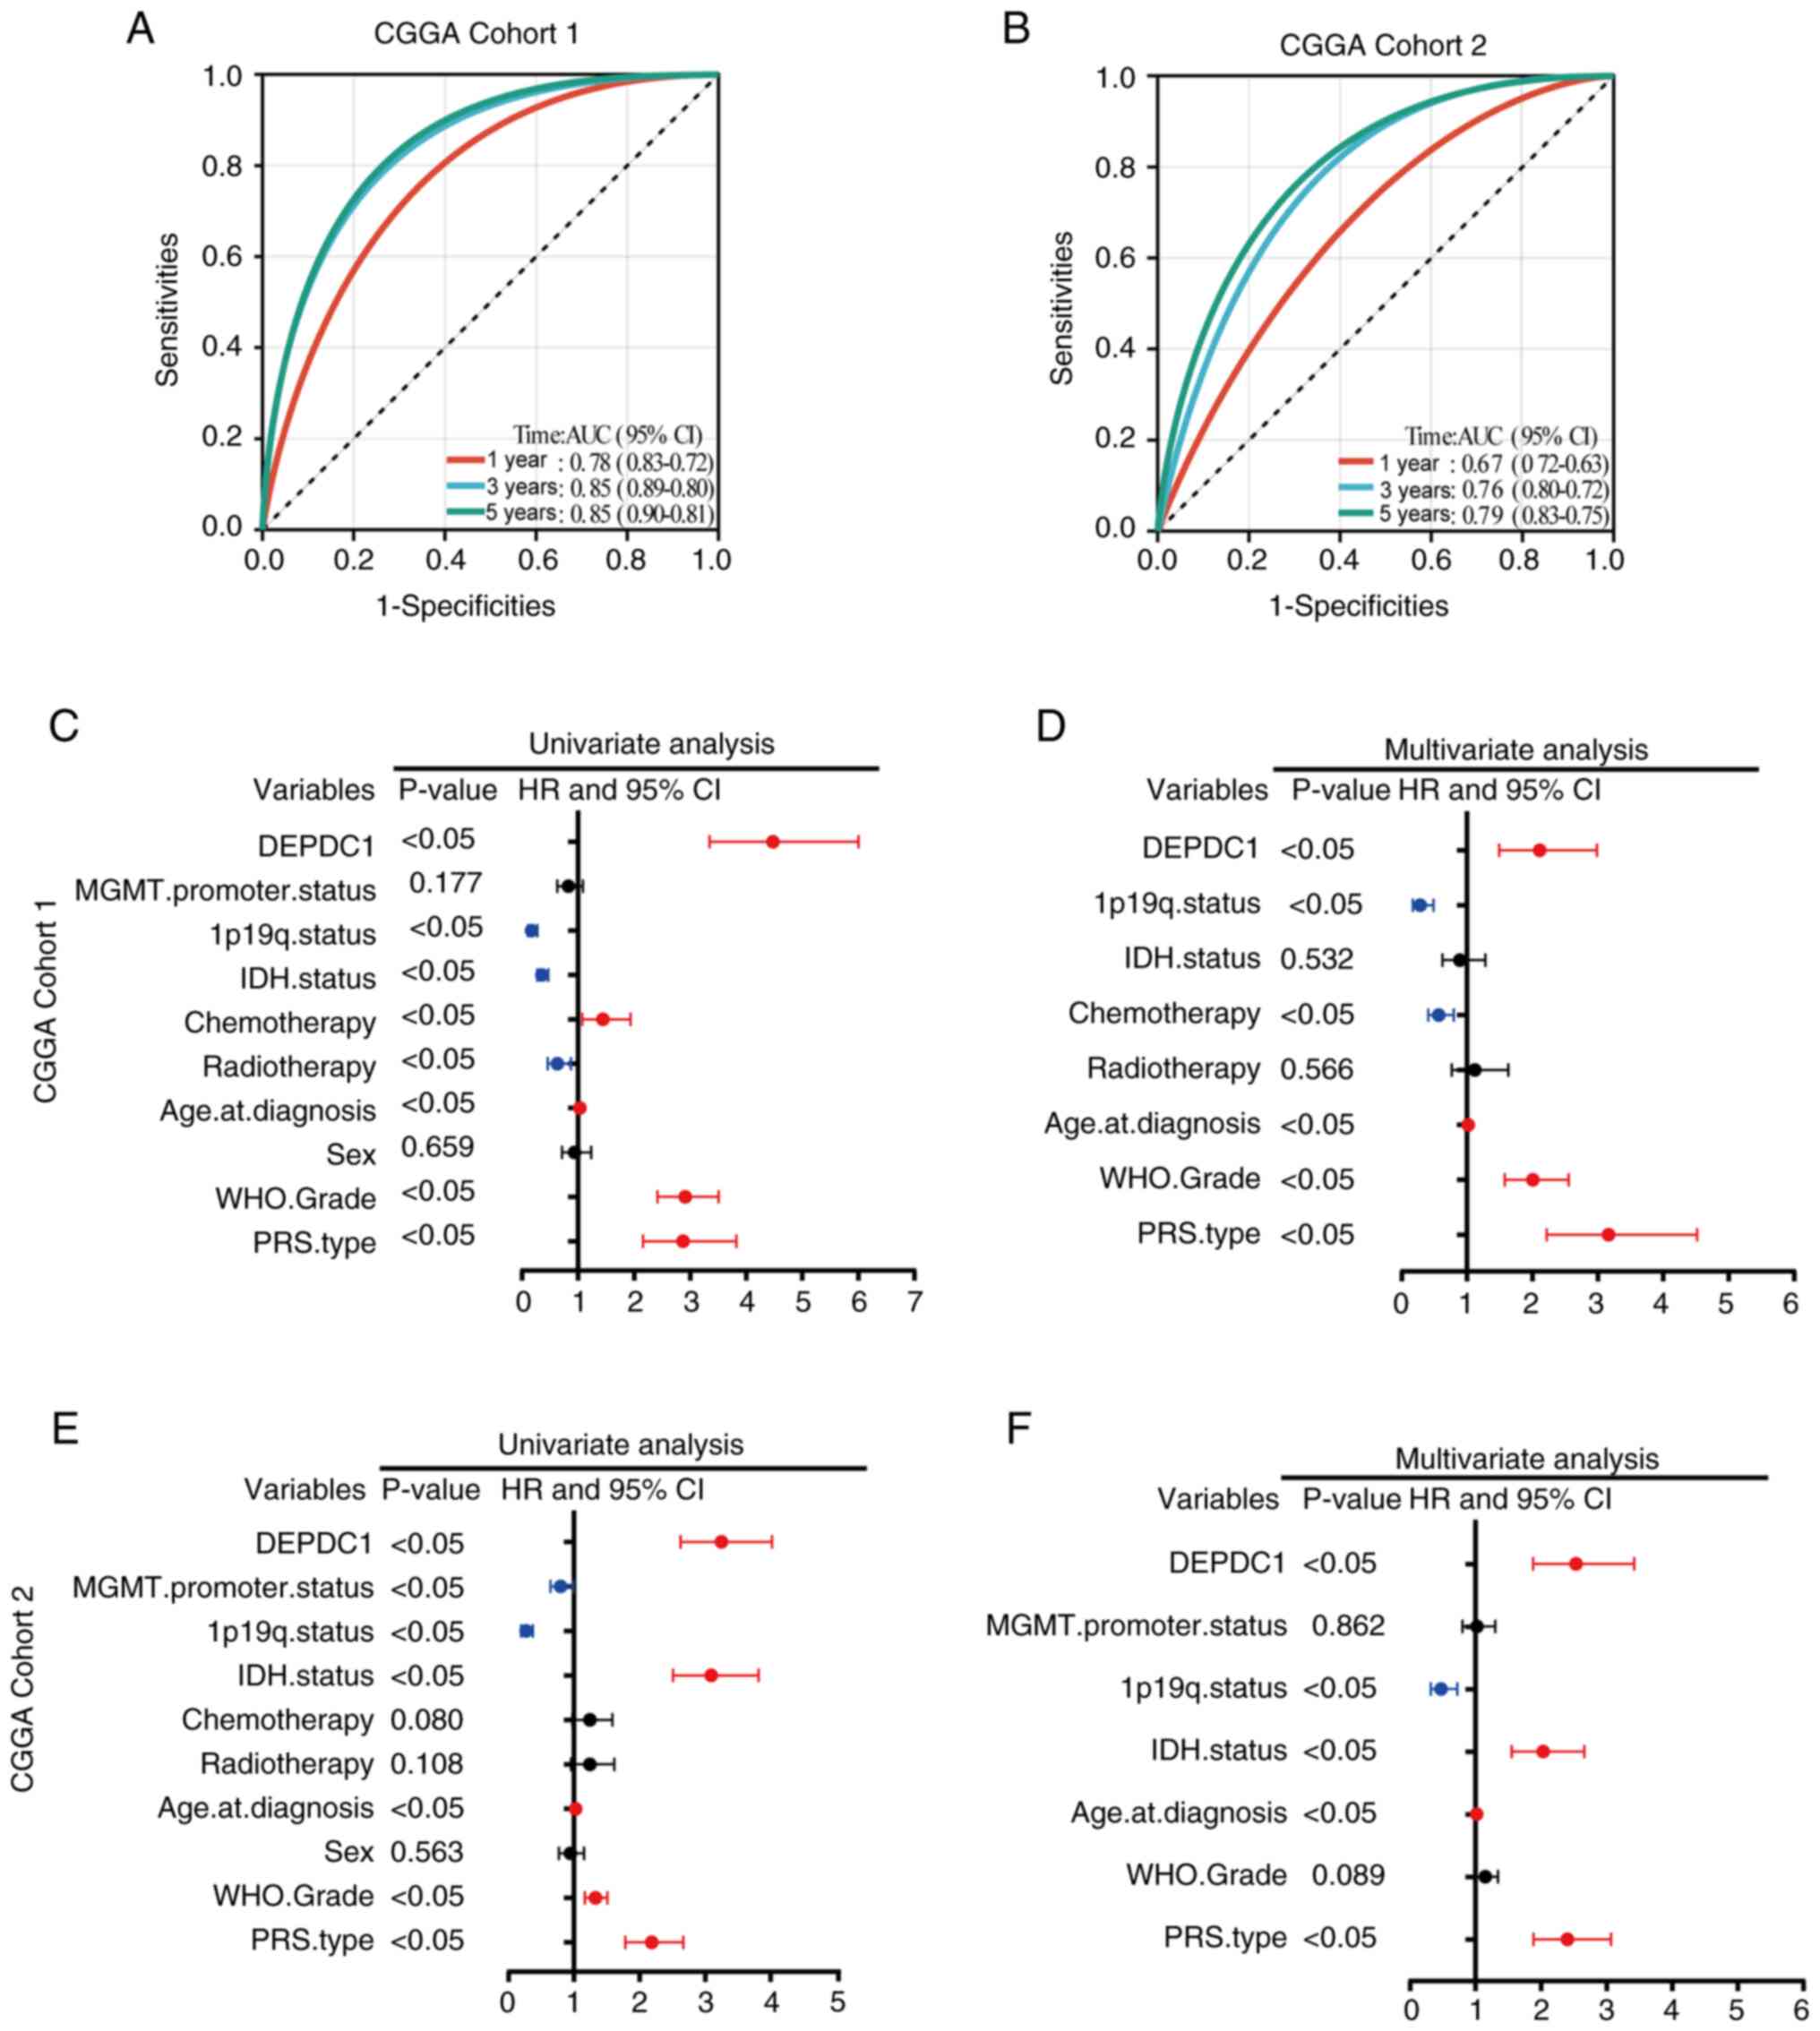
To further evaluate the role of DEPDC1 in the
prognosis of patients with glioma, receiver operating
characteristic analysis was used to assess the ability of DEPDC1
expression to predict patient outcomes. As shown in Fig. 4A, in CGGA Cohort 1, the area under
the curve (AUC) was 0.78 at 1 year, 0.85 at 3 years and 0.85 at 5
years. As shown in Fig. 4B, in CGGA
Cohort 2, the AUC reached 0.67 at 1 year, 0.76 at 3 years and 0.79
at 5 years, respectively. Similarly, in the GLASS dataset (Fig. S3A), the AUC values were 0.61 at 1
year, 0.75 at 3 years, and 0.85 at 5 years. In CGGA Cohort 1
(CGGA_325), the AUC values were 0.78 at 1 year, 0.85 at 3 years and
0.85 at 5 years (Fig. 4A), while in
the CGGA Cohort 2, the AUC values were 0.67 at 1 year, 0.76 at 3
years and 0.79 at 5 years (Fig.
4B). Univariate and multivariate Cox regression analyses of
CGGA Cohorts 1 and 2 indicated that DEPDC1 is an independent
prognostic factor for patients with glioma (Fig. 4C-F). Similar results were observed
for the GLASS dataset (Fig. S3C and
D). These results suggested that expression of DEPDC1 is an
independent prognostic factor for OS.
Individualized prediction model shows
high accuracy
Independent prognostic indicators of OS were
selected and integrated into multivariate regression analysis to
construct a prediction model. In the CGGA Cohort 1 dataset,
patients were divided into a high expression group (≥0.56) and low
expression group (<0.56), with the median DEPDC1 expression as
the cut-off value. High and low expression of DEPDC1 contributed to
risk scores from 0 to 100 (Fig.
5A). In CGGA Cohort 1, the C-index of the nomogram was 0.810.
The calibration plot demonstrated a good agreement between the
predicted and observed 1-, 3- and 5-year OS probabilities (Fig. 5B). Similar results were validated in
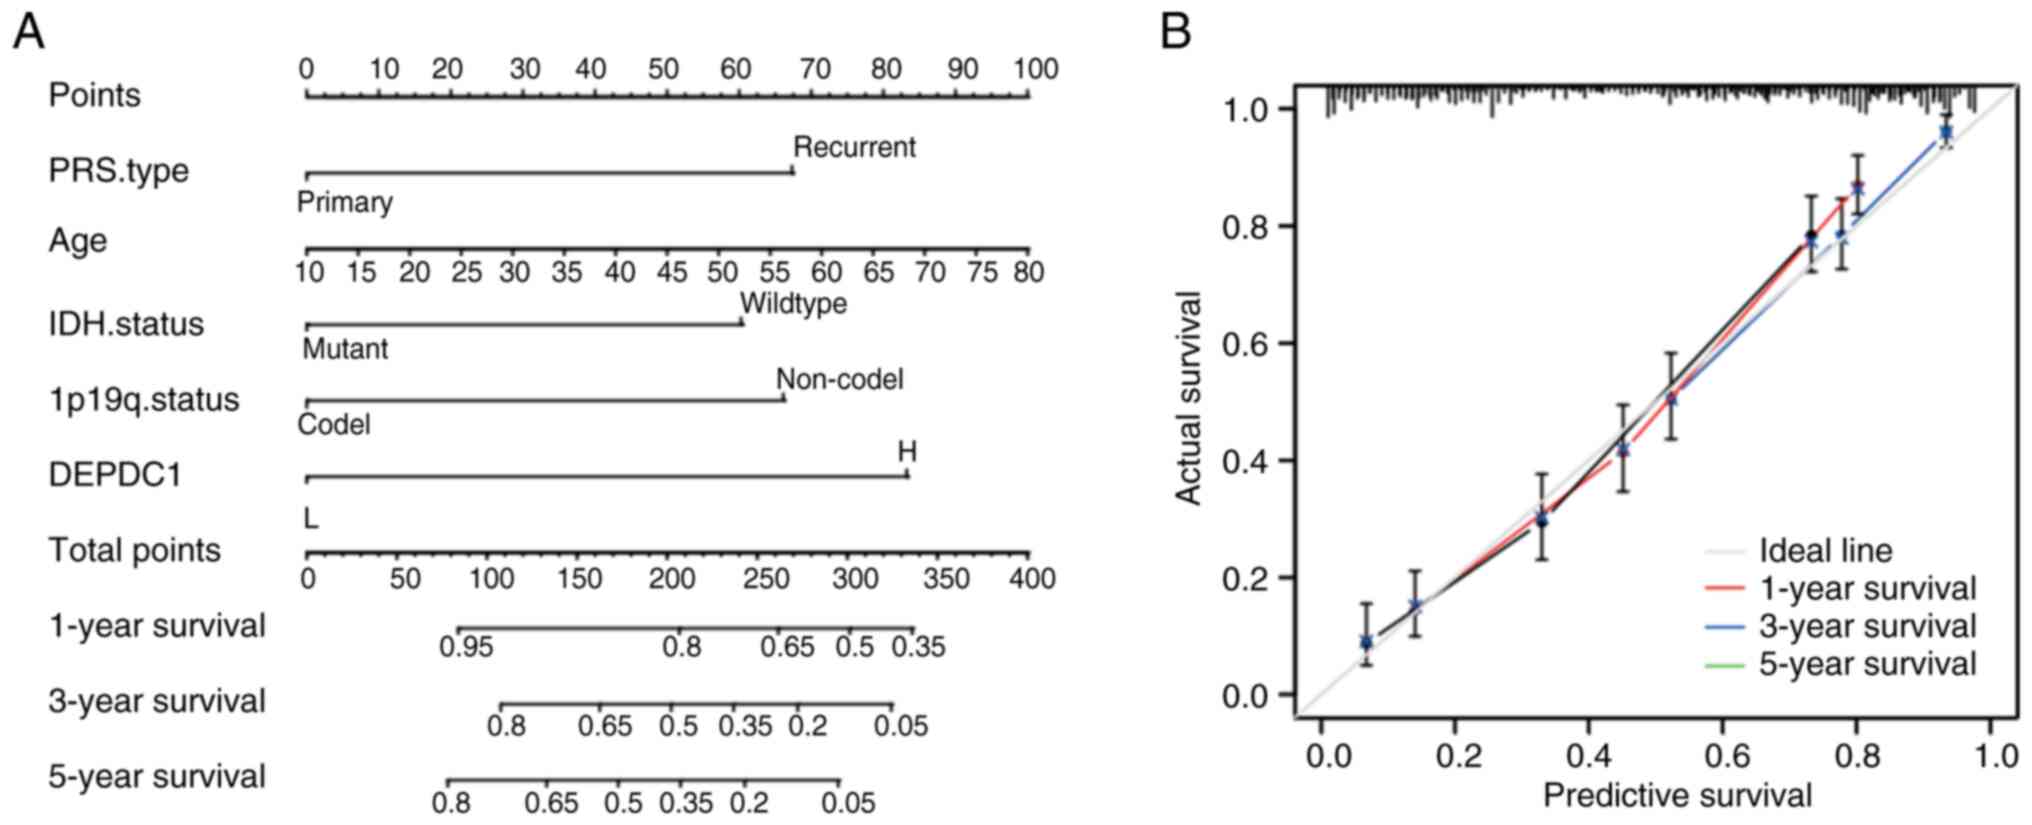
the CGGA Cohort 2 (Fig. 6) and
GLASS datasets (Fig. S4), with
C-indices of 0.771 and 0.763, respectively, indicating the high
accuracy of the DEPDC1 score.
Expression of DEPDC1 is associated
with the proliferation and invasion of gliomas
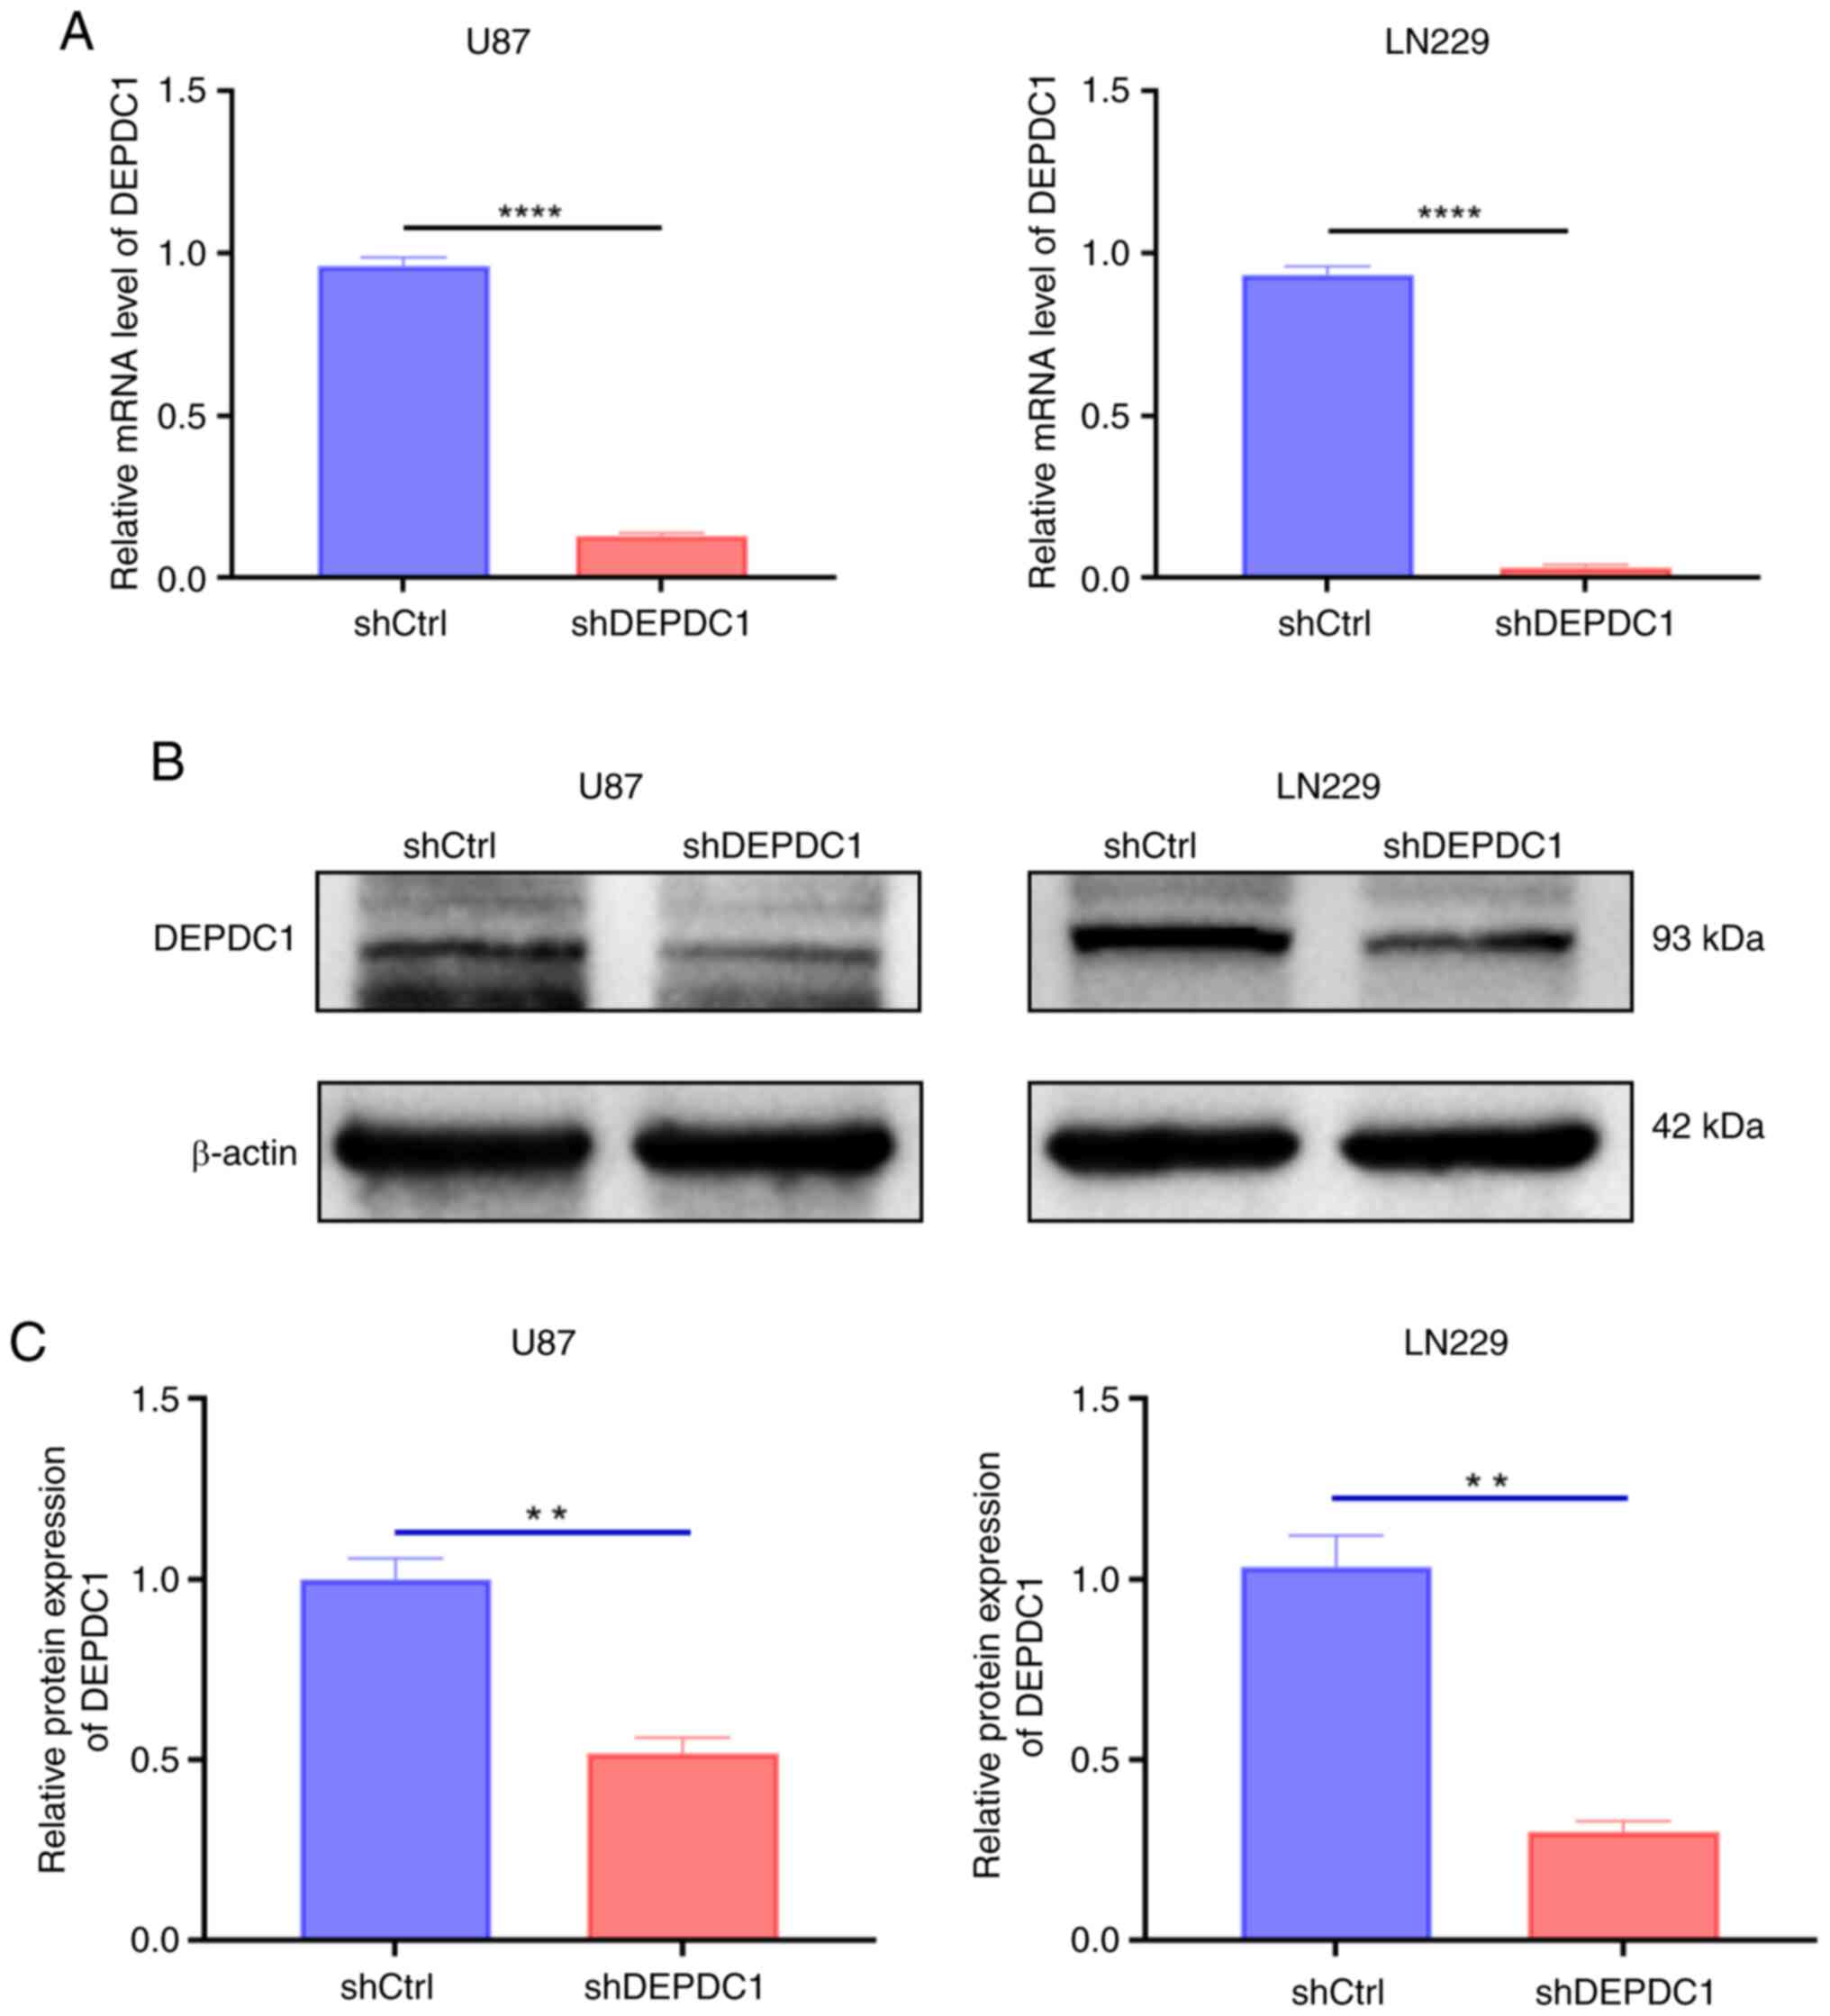
To investigate the expression levels of DEPDC1 in
U87 and LN229 cells, shRNA was used to interfere with DEPDC1
expression in both cell lines. As shown in Fig. 7A, RT-qPCR analysis indicated that
DEPDC1 mRNA levels decreased significantly after silencing with
shDEPDC1 compared with the control shRNA. Correspondingly, western
blot analysis demonstrated that the protein expression levels also
showed qualitative and semi-quantitative reductions, as shown in
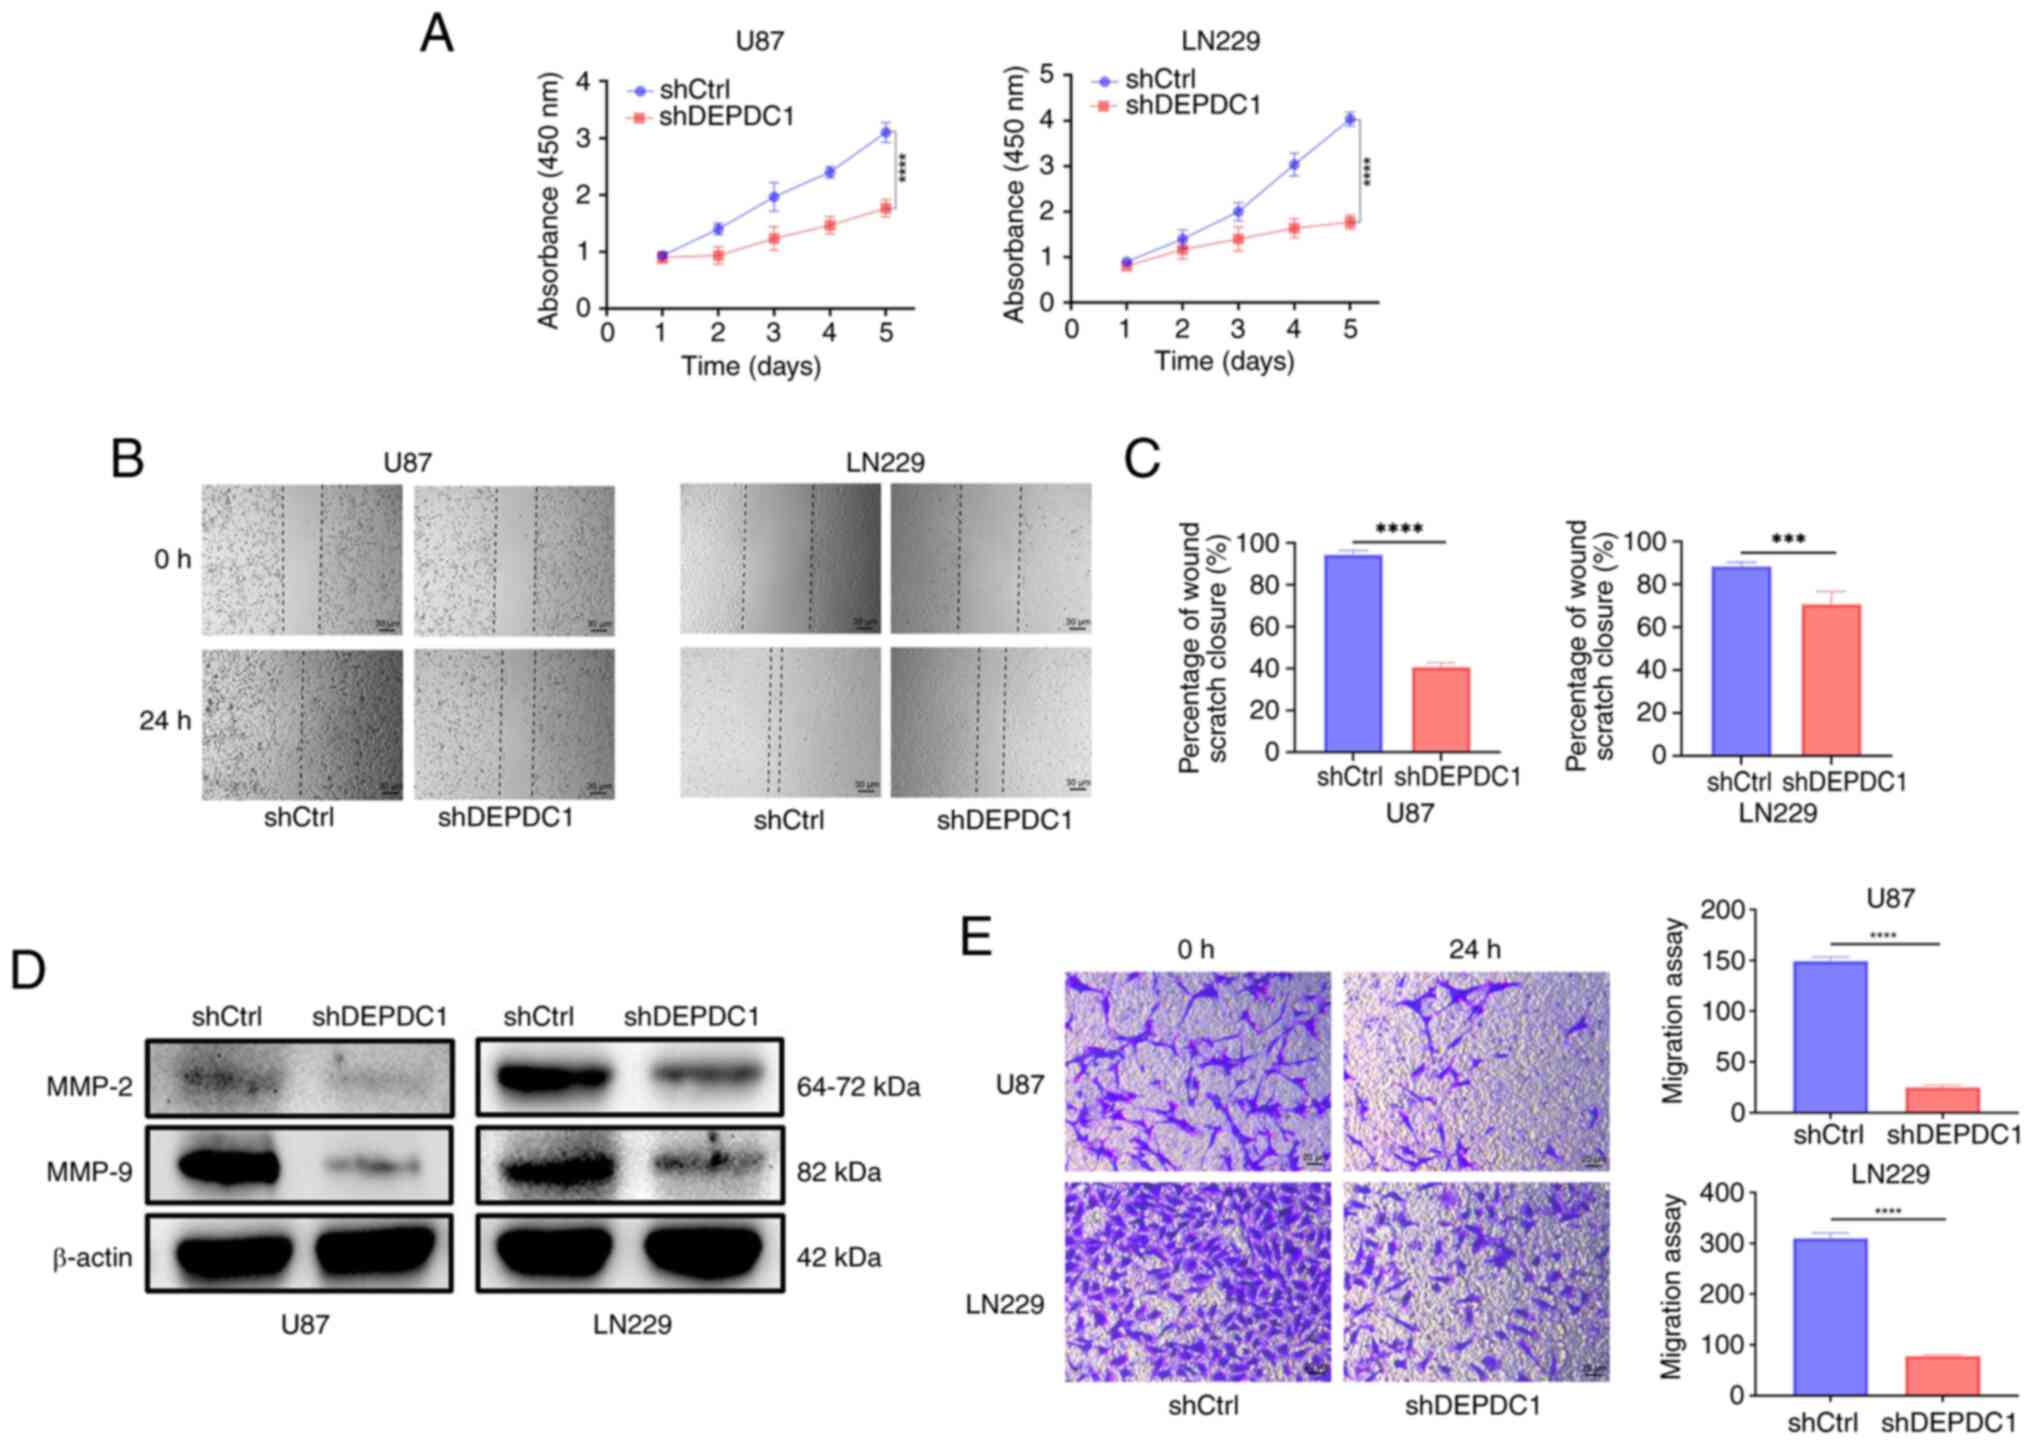
Fig. 7B and C. To further examine
the impact of DEPDC1 expression on glioma cell proliferation and
invasion, CCK-8, wound healing and Transwell invasion assays were
performed. As shown in Fig. 8A, the
proliferation rate of glioma cells was significantly reduced over
the first 5 days following DEPDC1 silencing compared with the
control shRNA. In addition, Fig. 8B
shows wound healing assay results for U87 and LN229 cells,
comparing cell migration over a 24 h period. At 0 h, the wound
areas were similar in all groups. After 24 h, the shCtrl cells
migrated more compared with the shDEPDC1 cells, indicating that
DEPDC1 knockdown reduced migration. Furthermore, Fig. 8C shows the invasion assay results
for U87 and LN229 cells. At 0 h, the number of invading cells was
similar between groups. After 24 h, fewer cells had invaded in the
shDEPDC1 group compared with the shCtrl group, indicating that
DEPDC1 knockdown reduces invasion. Additionally, migration-related
proteins MMP-2 and MMP-9 were markedly decreased after DEPDC1
silencing, as shown in Fig 8D.
Fig. 8E demonstrates that the
invasive ability of glioma cells in both cell lines was
significantly impaired by DEPDC1 silencing compared with the
control shRNA, as observed in the Transwell assay.
Discussion
Previous studies have indicated that DEPDC1
upregulation is closely associated with a poor prognosis in several
malignant tumors, including hepatocellular carcinoma (28–31),
lung adenocarcinoma (15,32), colorectal cancer (33,34),
breast cancer (35) and
osteosarcoma (36). A notable study
further demonstrated that DEPDC1 is markedly upregulated in 29 out
of 33 human cancer types and is associated with OS,
disease-specific survival and progression-free survival in multiple
tumor types (37). In the present
study, expression levels of DEPDC1 were assessed in gliomas with
several typical prognostic characteristics by performing
association analysis based on data from patients with glioma from
the CGGA and GLASS databases. The results demonstrated that DEPDC1
is highly expressed in more aggressive gliomas, particularly in
patients of older age (≥42 years), those with high histological
grades (CNS WHO 3,4), those with IDH wild-type gliomas, patients
with 1p/19q codeletion and cases with tumor recurrence.
Kaplan-Meier analysis was performed to examine the relationship
between the expression of DEPDC1 and patient prognosis, further
confirming that high DEPDC1 expression significantly affects
survival time. Furthermore, DEPDC1 expression was observed in human
glioma U87 and LN229 cell lines. Additionally, DEPDC1 knockdown
inhibited the proliferation, migration and invasion of glioma
cells. This suggested that DEPDC1 serves a role in promoting glioma
progression. The reduced cell motility and invasion observed after
DEPDC1 knockdown were consistent with previous studies on
DEPDC1-related tumor genes (17,38,39).
These findings indicate that DEPDC1 may contribute to glioma
malignancy and could be a potential target for further
investigation.
To further investigate the potential mechanisms by
which DEPDC1 contributes to glioma progression, its relationship
with cell cycle regulation, immune response and vascular
development was examined through GO and GSEA enrichment analyses of
DEGs from two CGGA database cohorts, with results corroborated in
the GLASS dataset. The findings suggest that DEPDC1 influences
glioma cell proliferation and apoptosis through the expression of
several specific RNAs or proteins, such as cyclin dependent kinase
1, CHEK1 and RB transcriptional corepressor 1, were affected by
DEPDC1 knockdown. These findings suggest that DEPDC1 may regulate
glioma progression through pathways involving cell cycle control
and DNA damage response (40).
Additionally, DEPDC1 may induce generation of specific T
lymphocytes, potentially affecting immune system function (41) and promoting the overexpression of
angiogenic factors, leading to increased glioma proliferation and
blood vessel density (42).
In view of the relationship between DEPDC1
expression and the cell cycle, its association with several
recognized cell cycle checkpoints was investigated. The results
demonstrate expression of DEPDC1 was positively associated with
CHEK1, CDK7 and TP53 expression. CHEK1 is a key signal transduction
factor in the genome integrity checkpoint, and its mutations have
been implicated in various cancer types, including colon, stomach
and endometrial carcinomas (43).
Similarly, abnormal CDK7 expression or function (44) and TP53 mutations (45) are associated with the occurrence and
progression of multiple cancer types, including breast, colorectal,
ovarian, head and neck and lung cancers. Thus, DEPDC1 may influence
glioma progression by modulating the expression of these genes,
contributing to cell cycle regulation and affecting tumor
proliferation, malignancy and potential prognosis. As demonstrated
in previous studies, DEPDC1 serves an important role in regulating
the cell cycle and tumor progression across different cancer types
via various signaling pathways. For instance, Huang et al
(19) showed that in prostate
cancer, DEPDC1 enhances E2F1 transcriptional activity, thereby
upregulating cyclin D1 and CDK2, leading to a more frequent
G1-S phase cell cycle transition. Similarly, Wang et
al (16) reported that DEPDC1
promotes SUZ12 polycomb repressive complex 2 subunit expression to
drive proliferation, invasion and epithelial-mesenchymal transition
of colorectal cancer. These findings suggest a potential mechanism
through which DEPDC1 regulates cell cycle progression. However,
further investigations are needed to elucidate the specific
mechanism of action of DEPDC1 in glioma cell cycle regulation.
In the present study, univariate and multivariate
Cox regression analyses were performed and demonstrated that DEPDC1
serves as an independent prognostic factor in patients with glioma.
To evaluate the accuracy of DEPDC1 as a prognostic marker, a
prediction model was constructed based on 1-, 3- and 5-year
survival rates using a nomogram calibrated against the CGGA
database observations. These results indicate that high DEPDC1
expression adversely affects patient prognosis. If this prediction
model is highly accurate, it may support clinical decision making,
potentially improving patient outcomes.
The present study has certain limitations. The
results demonstrated that DEPDC1 is closely associated with key
genes in multiple cell cycle signaling pathways. However, the
molecular interaction mechanisms have not been further elucidated
in animal experiments and patient-derived glioma samples.
Additionally, as patients with high-grade glioma generally have a
worse prognosis, the functional role of DEPDC1 was only evaluated
in two high-grade glioma cell lines. Therefore, the functions of
DEPDC1 observed in the present study may not apply to low-grade
gliomas. These limitations should be addressed in animal models and
glioma cell lines of various grades.
In summary, the expression of DEPDC1 is closely
associated with glioma cell cycle regulation and serves as an
independent prognostic indicator, with higher expression levels
linked to worse outcomes. DEPDC1 knockdown reduces glioma cell
proliferation and migration, suggesting it has potential as a
target for individualized tumor treatment.
Supplementary Material
Supporting Data
Acknowledgements
Not applicable.
Funding
Funding: No funding was received.
Availability of data and materials
The data generated in the present study may be
requested from the corresponding author.
Authors' contributions
HL and YL contributed to conceptualization, formal
analysis, investigation, data curation and writing of the original
draft. HZ contributed to methodology, formal analysis and reviewing
of the original draft. HZ, HL and YL confirm the authenticity of
all the raw data. XW contributed to conceptualization, reviewing
the draft, supervision, project administration and funding
acquisition. All authors read and approved the final version of the
manuscript, and agree to be accountable for all aspects of the
work.
Ethics approval and consent to
participate
Not applicable.
Patient consent for publication
Not applicable.
Competing interests
The authors declare that they have no competing
interests.
References
|
1
|
Ostrom QT, Cioffi G, Waite K, Kruchko C
and Barnholtz-Sloan JS: CBTRUS statistical report: Primary brain
and other central nervous system tumors diagnosed in the United
States in 2014–2018. Neuro Oncol. 23:iii1–iii105. 2021. View Article : Google Scholar : PubMed/NCBI
|
|
2
|
Louis DN, Perry A, Wesseling P, Brat DJ,
Cree IA, Figarella-Branger D, Hawkins C, Ng HK, Pfister SM,
Reifenberger G, et al: The 2021 WHO classification of tumors of the
central nervous system: A summary. Neuro Oncol. 23:1231–1251. 2021.
View Article : Google Scholar : PubMed/NCBI
|
|
3
|
Nicholson JG and Fine HA: Diffuse glioma
heterogeneity and its therapeutic implications. Cancer Discov.
11:575–590. 2021. View Article : Google Scholar : PubMed/NCBI
|
|
4
|
Zeng J, Li X, Sander M, Zhang H, Yan G and
Lin Y: Oncolytic Viro-Immunotherapy: An emerging option in the
treatment of gliomas. Front Immunol. 12:7218302021. View Article : Google Scholar : PubMed/NCBI
|
|
5
|
Stupp R, Taillibert S, Kanner A, Read W,
Steinberg D, Lhermitte B, Toms S, Idbaih A, Ahluwalia MS, Fink K,
et al: Effect of tumor-treating fields plus maintenance
temozolomide vs maintenance temozolomide alone on survival in
patients with glioblastoma: A randomized clinical trial. JAMA.
318:2306–2316. 2017. View Article : Google Scholar : PubMed/NCBI
|
|
6
|
Brown CE, Hibbard JC, Alizadeh D,
Blanchard MS, Natri HM, Wang D, Ostberg JR, Aguilar B, Wagner JR,
Paul JA, et al: Locoregional delivery of IL-13Rα2-targeting CAR-T
cells in recurrent high-grade glioma: A phase 1 trial. Nat Med.
30:1001–1012. 2024. View Article : Google Scholar : PubMed/NCBI
|
|
7
|
Ostrom QT, Cioffi G, Waite K, Kruchko C
and Barnholtz-Sloan JS: CBTRUS statistical report: Primary brain
and other central nervous system tumors diagnosed in the United
States in 2014–2018. Neuro Oncol. 23:iii1–iii105. 2021. View Article : Google Scholar : PubMed/NCBI
|
|
8
|
Rees JH: Diagnosis and treatment in
neuro-oncology: An oncological perspective. Br J Radiol. 84(Spec No
2): S82–S89. 2011. View Article : Google Scholar : PubMed/NCBI
|
|
9
|
Huse JT and Holland EC: Targeting brain
cancer: Advances in the molecular pathology of malignant glioma and
medulloblastoma. Nat Rev Cancer. 10:319–331. 2010. View Article : Google Scholar : PubMed/NCBI
|
|
10
|
Stupp R, Mason WP, van den Bent MJ, Weller
M, Fisher B, Taphoorn MJ, Belanger K, Brandes AA, Marosi C, Bogdahn
U, et al: Radiotherapy plus concomitant and adjuvant temozolomide
for glioblastoma. N Engl J Med. 352:987–996. 2005. View Article : Google Scholar : PubMed/NCBI
|
|
11
|
Weller M, Stupp R, Reifenberger G, Brandes
AA, van den Bent MJ, Wick W and Hegi ME: MGMT promoter methylation
in malignant gliomas: Ready for personalized medicine? Nat Rev
Neurol. 6:39–51. 2010. View Article : Google Scholar : PubMed/NCBI
|
|
12
|
Ellingson BM, Wen PY and Cloughesy TF:
Modified criteria for radiographic response assessment in
glioblastoma clinical trials. Neurotherapeutics. 14:307–320. 2017.
View Article : Google Scholar : PubMed/NCBI
|
|
13
|
Kanehira M, Harada Y, Takata R, Shuin T,
Miki T, Fujioka T, Nakamura Y and Katagiri T: Involvement of
upregulation of DEPDC1 (DEP domain containing 1) in bladder
carcinogenesis. Oncogene. 26:6448–6455. 2007. View Article : Google Scholar : PubMed/NCBI
|
|
14
|
Li Y, Tian Y, Zhong W, Wang N, Wang Y,
Zhang Y, Zhang Z, Li J, Ma F, Zhao Z and Peng Y: Artemisia argyi
essential oil inhibits hepatocellular carcinoma metastasis via
suppression of DEPDC1 dependent Wnt/β-catenin signaling pathway.
Front Cell Dev Biol. 9:6647912021. View Article : Google Scholar : PubMed/NCBI
|
|
15
|
Wang W, Li A, Han X, Wang Q, Guo J, Wu Y,
Wang C and Huang G: DEPDC1 up-regulates RAS expression to inhibit
autophagy in lung adenocarcinoma cells. J Cell Mol Med.
24:13303–13313. 2020. View Article : Google Scholar : PubMed/NCBI
|
|
16
|
Wang Q, Jiang S, Liu J, Ma G, Zheng J and
Zhang Y: DEP domain containing 1 promotes proliferation, invasion,
and epithelial-mesenchymal transition in colorectal cancer by
enhancing expression of suppressor of zest 12. Cancer Biother
Radiopharm. 36:36–44. 2021.PubMed/NCBI
|
|
17
|
Zhang L, Du Y, Xu S, Jiang Y, Yuan C, Zhou
L, Ma X, Bai Y, Lu J and Ma J: DEPDC1, negatively regulated by
miR-26b, facilitates cell proliferation via the up-regulation of
FOXM1 expression in TNBC. Cancer Lett. 442:242–251. 2019.
View Article : Google Scholar : PubMed/NCBI
|
|
18
|
Shen L, Li H, Liu R, Zhou C, Bretches M,
Gong X, Lu L, Zhang Y, Zhao K, Ning B, et al: DEPDC1 as a crucial
factor in the progression of human osteosarcoma. Cancer Med.
12:5798–5808. 2023. View Article : Google Scholar : PubMed/NCBI
|
|
19
|
Huang L, Chen K, Cai ZP, Chen FC, Shen HY,
Zhao WH, Yang SJ, Chen XB, Tang GX and Lin X: DEPDC1 promotes cell
proliferation and tumor growth via activation of E2F signaling in
prostate cancer. Biochem Biophys Res Commun. 490:707–712. 2017.
View Article : Google Scholar : PubMed/NCBI
|
|
20
|
Yang Y, Jiang Y, Jiang M, Zhang J, Yang B,
She Y, Wang W, Deng Y and Ye Y: Protocadherin 10 inhibits cell
proliferation and induces apoptosis via regulation of DEP domain
containing 1 in endometrial endometrioid carcinoma. Exp Mol Pathol.
100:344–352. 2016. View Article : Google Scholar : PubMed/NCBI
|
|
21
|
Mi Y, Zhang C, Bu Y, Zhang Y, He L, Li H,
Zhu H, Li Y, Lei Y and Zhu J: DEPDC1 is a novel cell cycle related
gene that regulates mitotic progression. BMB Rep. 48:413–418. 2015.
View Article : Google Scholar : PubMed/NCBI
|
|
22
|
Sendoel A, Maida S, Zheng X, Teo Y,
Stergiou L, Rossi CA, Subasic D, Pinto SM, Kinchen JM, Shi M, et
al: DEPDC1/LET-99 participates in an evolutionarily conserved
pathway for anti-tubulin drug-induced apoptosis. Nat Cell Biol.
16:812–820. 2014. View
Article : Google Scholar : PubMed/NCBI
|
|
23
|
Zhao Z, Zhang KN, Wang Q, Li G, Zeng F,
Zhang Y, Wu F, Chai R, Wang Z, Zhang C, et al: Chinese glioma
genome atlas (CGGA): A comprehensive resource with functional
genomic data from chinese glioma patients. Genomics Proteomics
Bioinformatics. 19:1–12. 2021. View Article : Google Scholar : PubMed/NCBI
|
|
24
|
Zhang K, Liu X, Li G, Chang X, Li S, Chen
J, Zhao Z, Wang J, Jiang T and Chai R: Clinical management and
survival outcomes of patients with different molecular subtypes of
diffuse gliomas in China (2011–2017): A multicenter retrospective
study from CGGA. Cancer Biol Med. 19:1460–1476. 2022. View Article : Google Scholar : PubMed/NCBI
|
|
25
|
Livak KJ and Schmittgen TD: Analysis of
relative gene expression data using real-time quantitative PCR and
the 2(−Delta Delta C(T)) method. Methods. 25:402–408. 2001.
View Article : Google Scholar : PubMed/NCBI
|
|
26
|
Chakrabarty S, LaMontagne P, Shimony J,
Marcus DS and Sotiras A: MRI-based classification of IDH mutation
and 1p/19q codeletion status of gliomas using a 2.5D hybrid
multi-task convolutional neural network. Neurooncol Adv.
5:vdad0232023.PubMed/NCBI
|
|
27
|
Wesseling P, van den Bent M and Perry A:
Oligodendroglioma: Pathology, molecular mechanisms and markers.
Acta Neuropathol. 129:809–827. 2015. View Article : Google Scholar : PubMed/NCBI
|
|
28
|
Amisaki M, Yagyu T, Uchinaka EI, Morimoto
M, Hanaki T, Watanabe J, Tokuyasu N, Sakamoto T, Honjo S and
Fujiwara Y: Prognostic value of DEPDC1 expression in tumor and
non-tumor tissue of patients with hepatocellular carcinoma.
Anticancer Res. 39:4423–4430. 2019. View Article : Google Scholar : PubMed/NCBI
|
|
29
|
Yuan SG, Liao WJ, Yang JJ, Huang GJ and
Huang ZQ: DEP domain containing 1 is a novel diagnostic marker and
prognostic predictor for hepatocellular carcinoma. Asian Pac J
Cancer Prev. 15:10917–10922. 2014. View Article : Google Scholar : PubMed/NCBI
|
|
30
|
Bin X, Luo Z, Wang J and Zhou S:
Identification of a five immune term signature for prognosis and
therapy options (Immunotherapy versus Targeted Therapy) for
patients with hepatocellular carcinoma. Comput Math Methods Med.
2023:89589622023. View Article : Google Scholar : PubMed/NCBI
|
|
31
|
Zhang L, Li Y, Dai Y, Wang D, Wang X, Cao
Y, Liu W and Tao Z: Glycolysis-related gene expression profiling
serves as a novel prognosis risk predictor for human hepatocellular
carcinoma. Sci Rep. 11:188752021. View Article : Google Scholar : PubMed/NCBI
|
|
32
|
Shao F, Ling L, Li C, Huang X, Ye Y, Zhang
M, Huang K, Pan J, Chen J and Wang Y: Establishing a
metastasis-related diagnosis and prognosis model for lung
adenocarcinoma through CRISPR library and TCGA database. J Cancer
Res Clin Oncol. 149:885–899. 2023. View Article : Google Scholar : PubMed/NCBI
|
|
33
|
Zhu Y, Sun L, Yu J, Xiang Y, Shen M, Wasan
HS, Ruan S and Qiu S: Identification of biomarkers in colon cancer
based on bioinformatic analysis. Transl Cancer Res. 9:4879–4895.
2020. View Article : Google Scholar : PubMed/NCBI
|
|
34
|
Shen X and Han J: Overexpression of gene
DEP domain containing 1 and its clinical prognostic significance in
colorectal cancer. J Clin Lab Anal. 34:e236342020. View Article : Google Scholar : PubMed/NCBI
|
|
35
|
Kim J: In silico analysis of
differentially expressed genesets in metastatic breast cancer
identifies potential prognostic biomarkers. World J Surg Oncol.
19:1882021. View Article : Google Scholar : PubMed/NCBI
|
|
36
|
Yang M, Zhang H, Gao S and Huang W: DEPDC1
and KIF4A synergistically inhibit the malignant biological behavior
of osteosarcoma cells through Hippo signaling pathway. J Orthop
Surg Res. 18:1452023. View Article : Google Scholar : PubMed/NCBI
|
|
37
|
Jia B, Liu J, Hu X, Xia L and Han Y:
Pan-cancer analysis of DEPDC1 as a candidate prognostic biomarker
and associated with immune infiltration. Ann Transl Med.
10:13552022. View Article : Google Scholar : PubMed/NCBI
|
|
38
|
Harada Y, Kanehira M, Fujisawa Y, Takata
R, Shuin T, Miki T, Fujioka T, Nakamura Y and Katagiri T:
Cell-permeable peptide DEPDC1-ZNF224 interferes with
transcriptional repression and oncogenicity in bladder cancer
cells. Cancer Res. 70:5829–5839. 2010. View Article : Google Scholar : PubMed/NCBI
|
|
39
|
Zhou C, Wang P, Tu M, Huang Y, Xiong F and
Wu Y: DEPDC1 promotes cell proliferation and suppresses sensitivity
to chemotherapy in human hepatocellular carcinoma. Biosci Rep.
39:BSR201909462019. View Article : Google Scholar : PubMed/NCBI
|
|
40
|
Feng X, Zhang C, Zhu L, Zhang L, Li H, He
L, Mi Y, Wang Y, Zhu J and Bu Y: DEPDC1 is required for cell cycle
progression and motility in nasopharyngeal carcinoma. Oncotarget.
8:63605–63619. 2017. View Article : Google Scholar : PubMed/NCBI
|
|
41
|
Obara W, Ohsawa R, Kanehira M, Takata R,
Tsunoda T, Yoshida K, Takeda K, Katagiri T, Nakamura Y and Fujioka
T: Cancer peptide vaccine therapy developed from oncoantigens
identified through genome-wide expression profile analysis for
bladder cancer. Jpn J Clin Oncol. 42:591–600. 2012. View Article : Google Scholar : PubMed/NCBI
|
|
42
|
Guo W, Li H, Liu H, Ma X, Yang S and Wang
Z: DEPDC1 drives hepatocellular carcinoma cell proliferation,
invasion and angiogenesis by regulating the CCL20/CCR6 signaling
pathway. Oncol Rep. 42:1075–1089. 2019.PubMed/NCBI
|
|
43
|
Alorjani M, Aburub M, Al-Trad B, Hamad MA,
AbuAlarja M, Bashir SA, Al-Batayneh K and Zoubi MA: The prevalence
of CHEK1 and CHEK2 mutations in prostate cancer: A retrospective
cohort Study. Med Arch. 77:8–12. 2023. View Article : Google Scholar : PubMed/NCBI
|
|
44
|
Chen Y, Zhang S, Li Z, Yin B, Liu Y and
Zhang L: Discovery of a dual-target inhibitor of CDK7 and HDAC1
that induces apoptosis and inhibits migration in colorectal cancer.
ChemMedChem. 18:e2023002812023. View Article : Google Scholar : PubMed/NCBI
|
|
45
|
Landsburg DJ, Morrissette JJ, Nasta SD,
Barta SK, Schuster SJ, Svoboda J, Chong EA and Bagg A: TP53
mutations predict for poor outcomes in patients with newly
diagnosed aggressive B-cell lymphomas in the current era. Blood
Adv. 7:7243–7253. 2023. View Article : Google Scholar : PubMed/NCBI
|