Introduction
Gastric cancer (GC) is one of the most common
malignancies. Data from the International Agency for Research on
Cancer indicated that in 2020, the global incidence of GC accounted
for 5.6% of all cancer cases and 7.7% of all cancer deaths, and it
is the third leading cause of cancer-related death worldwide
(1). The most common subtype of GC
is gastric adenocarcinoma (GAC) (2). At present, surgical resection,
chemotherapy and radiotherapy are the primary treatments for GC;
however, there is a need for more effective treatments for advanced
or recurrent GC (3). Thus, the use
of drugs that target key disease-causing molecules is an
increasingly attractive therapeutic approach.
Accelerated energy metabolism is one of the
characteristics of cancer cells, which typically relies on
increased glucose consumption and accelerated aerobic glycolysis
(4). Aerobic glycolysis refers to
the phenomenon in which tumor cells metabolize glucose through
glycolysis in an oxygen-rich environment, resulting in the
production of a significant amount of lactic acid. This phenomenon
is referred to as the Warburg effect (5), which has been hypothesized to be an
adaptive mechanism that supports the uncontrolled proliferation of
tumor cells. In this process, tumor cells rely on increased glucose
consumption as the carbon source for cell proliferation (6). In addition, the lactic acid produced
by this process is involved in various mechanisms of tumor
formation. It reduces T-cell activity and inhibits the cytotoxicity
of natural killer (NK) cells (7).
Furthermore, it promotes tumor angiogenesis and provides a suitable
microenvironment for tumor development (8). Abnormal glucose metabolism can
typically be observed in GC tissue (9,10), and
targeted inhibition of glycolysis has demonstrated a positive
effect in inhibiting the progress of GC (11,12).
Therefore, aerobic glycolysis may be an important therapeutic
target for GAC.
Ethylmalonic encephalopathy protein 1 (ETHE1) is a
hydrogen sulfide catabolic enzyme, the expression of which is
widely distributed in eukaryotic animal tissues (13). It has been reported that ETHE1
expression is upregulated in triple-negative breast cancer where it
increases the malignant behaviors of tumor cells (14). Furthermore, overexpression of ETHE1
has been shown to promote aerobic glycolysis and promote the
progression of colorectal cancer (15). However, to the best of our
knowledge, the role of ETHE1 in GAC has not yet been determined.
ETHE1 has been specifically implicated in energy metabolism and
mitochondrial function, which involves the glycolytic pathway
(16,17). Gene expression analysis of GC
samples has shown that ETHE1 is upregulated in GC tissues, where it
may be involved in tumor invasion, metastasis and carcinogenesis
(18,19). Based on these previous findings, it
was hypothesized that ETHE1 may be involved in aerobic glycolysis
in GAC. The present study assessed the association between ETHE1
expression levels in clinical tissue samples and GAC staging. In
addition, the regulatory effects of ETHE1 on GAC cell proliferation
and glycolysis were assessed by knocking down ETHE1 expression.
Materials and methods
Bioinformatics analysis
For pan-cancer analysis, the expression data of
ETHE1 in clinical samples from The Cancer Genome Atlas (TCGA) and
Genotype-Tissue Expression (GTEx) datasets were downloaded from the
University of California, Santa Cruz database (http://xena.ucsc.edu/); the details are shown in
Table SI. The difference in ETHE1
expression in tumor and normal tissues was analyzed using a
non-parametric test (Wilcoxon rank-sum test). The
immunohistochemical results of ETHE1 in GC tissues and normal
tissues from healthy controls were analyzed using the Human Protein
Atlas (HPA) database (https://www.proteinatlas.org/). Survival analysis was
performed based on the expression data of ETHE1 in patients with
stomach adenocarcinoma (STAD) from the data obtained from TCGA
using Kaplan-Meier analysis. Survival analysis results and survival
plots were generated using Gene Expression Profiling Interactive
Analysis (GEPIA; http://gepia.cancer–pku.cn/) (20), and the high and low cutoff values
were set to 50%. The Spearman correlation analysis was performed to
determine the correlation between ETHE1 expression in STAD and
immunomodulator expression using the TISIDB database (http://cis.hku.hk/TISIDB/index.php) (21). ETHE1 expression in regulatory T
cells (Tregs) and M2 macrophages in STAD tumor tissues and
paracancerous tissues were analyzed using GEPIA based on the data
from TCGA.
Patients and tissue samples
A total of 30 pairs of fresh cancerous and
paracancerous tissues from 30 patients with GAC who underwent
surgical resection at The Second Hospital of Dalian Medical
University (Dalian, China) were collected between April 15, 2023
and October 30, 2023. The patients were aged 39–85 (mean age, 65.7
years), 80% were men and 20% were women. These fresh tissues were
used to detect ETHE1 expression. In addition, the clinical
characteristics of 50 patients with GAC who had not received
preoperative chemotherapy or radiotherapy were collected from The
Second Hospital of Dalian Medical University between April 15, 2023
and October 30, 2023. These patients were aged 47–85 year (mean
age, 65.2 years), 78% were men and 22% were women. The
paraffin-embedded cancerous tissue samples of the 50 patients were
used to detect ETHE1 expression. The association between ETHE1
expression and the clinical characteristics of patients with GAC
was analyzed using a Yates's corrected χ2 test or
Fisher's exact test. All of the specimens were collected under a
protocol approved by the Ethics Committee of The Second Hospital of
Dalian Medical University (2023; approval no. 136). Each patient
provided written informed consent, and the study was performed in
accordance with The Declaration of Helsinki.
Cell lines
All cell lines were purchased from iCell Bioscience
Inc. The human GAC AGS cell line was cultured in Ham's F-12K medium
(Wuhan Servicebio Technology Co., Ltd.) supplemented with 10% FBS
(Zhejiang Tianhang Biotechnology Co., Ltd.), 1% penicillin and 1%
streptomycin. GES-1, SNU-1, NCI-N87 and MKN-45 cells were cultured
in RPMI-1640 medium (Beijing Solarbio Science & Technology Co.,
Ltd.) supplemented with 10% FBS. All of the cells were maintained
at 37°C in a humidified incubator supplied with 5% CO2
air.
Cell infection
The 2nd lentiviral system was used to infect the
NCI-N87 and MKN-45 cells. Short hairpin (sh)RNA constructs were
synthesized by General Biotech (Anhui) Co., Ltd. and were cloned
into the pLKO.1-EGFP-puro vector (Fenghbio). The sequences of the
shRNAs were: ETHE1-shRNA (708–728; sh708–728),
5′-ccgGATAGACTTTGCTGTTCCAGCttcaagagaGCTGGAACAGCAAAGTCTATCtttttt-3′,
ETHE1-shRNA (557–577; sh557-577),
5′-ccgCAGGAGACTGTCTGATCTACCttcaagagaGGTAGATCAGACAGTCTCCTGtttttt-3′,
and negative control (NC)-shRNA
5′-ccgTTCTCCGAACGTGTCACGTttcaagagaACGTGACACGTTCGGAGAAtttttt-3′. The
numbers 708–728 and 557–577 represent the target sequence position
of the shRNA. The uppercase letters represent ETHE1-specific
sequences, and the lowercase letters represent hairpin sequences.
The ETHE1-targeted interference vectors (14 µg), packaging plasmids
(10.5 µg) and envelope plasmids (3.5 µg) were co-transfected into
293T cells (iCell Bioscience Inc.) using Lipofectamine®
3000 (Invitrogen; Thermo Fisher Scientific, Inc.) to produce
lentiviral particles that were used to infect cells. The 293T cells
were cultured at 37°C with 5% CO2, and 48 h
post-transfection with the plasmid vectors, the supernatant
containing lentiviral particles was collected. Subsequently, 48 h
after transduction, stably infected cells were screened, and
subsequent experiments were performed 5 days later. In detail, the
NCI-N87 [multiplicity of infection (MOI)=10] and MKN-45 (MOI=20)
cells were seeded in 6-well plates and cultured in media containing
lentiviral particles (2×10⁸ TU/ml; NCI-N87 cell, 10
µl/well; MKN-45 cell, 20 µl/well) at 37°C and 5% CO2 for
24 h, the media were then replaced with fresh media and the cells
were cultured for a further 24 h. Control cells were transfected
with a lentivirus carrying a shRNA that lacked a specific target
sequence (NC-shRNA). The cells were cultured in complete culture
medium containing puromycin (NCI-N87, 1.5 µg/ml; MKN-45, 2.5 µg/ml)
for 5 days to screen for stably infected cells. The stably infected
NCI-N87 and MKN-45 cells were maintained in media containing 0.3
and 0.5 µg/ml puromycin, respectively.
Tumor xenograft model
A total of 10 male BALB/c nude mice (age, 6 weeks;
body weight, 17–19 g) supplied by Beijing Vital River Laboratory
Animal Technology Co., Ltd. The mice were randomly divided into the
following two groups: Control and sh708-728 (n=5/group).
The mice were reared under a 12-h light/dark cycle, at a
temperature of 22±1°C and a humidity level of 45–55%. The mice were
allowed to eat and drink freely, and their health and behavior were
monitored every 4–6 h. After 1 week of adaptive feeding, the mice
were subcutaneously injected with the NCI-N87 cell line
(2×10⁶ cells; 0.2 ml/mouse). The sh708-728
group received ETHE1-knockdown NCI-N87 cells, while the control
group was injected with cells infected with the NC-shRNA
lentivirus. Tumor volume was measured every 3 days following tumor
formation. At the end of the experiment (day 25), mice were
euthanized using CO2 with a volume displacement rate of
50%/min, followed by cervical dislocation. Tumor tissues were
collected for subsequent experiments.
For animal welfare reasons, the animals were kept in
a constant temperature and humidity environment, and the
experimental procedures were carried out by skilled experimenters
to reduce the temporary tension and pain caused by subcutaneous
injection. Based on the National Institutes of Health Guidelines
for Endpoints in Animal Study Proposals (22), humane endpoints in the study
included tumors growing to >15 mm in diameter, and ulceration or
infection of the growth site. A total of 10 animals were used in
the study, all of which were euthanized at the end of the
experiment. No animals were found dead during the experiment. All
the animal experiments were approved by the Animal Care and Welfare
Committee of Dalian Medical University (approval no. AEE23074).
Reverse transcription-quantitative
polymerase chain reaction (RT-qPCR)
Total RNA from clinical samples or cells (NCI-N87
and MKN-45) were extracted using TRIpure lysis buffer (Bioteke
Corporation) and cDNA was obtained by RT. The mixture including
oligo (dT)15 (Takara Biotechnology Co., Ltd.) and random
primers synthesized by General Biotech (Anhui) Co., Ltd. was heated
at 70°C for 5 min, and was cooled on ice for 2 min. Subsequently,
dNTP (Beijing Solarbio Science & Technology Co., Ltd.), buffer
(Beyotime Institute of Biotechnology), RNase inhibitor (Sangon
Biotech Co., Ltd.) and reverse transcriptase (Beyotime Institute of
Biotechnology) were added to the mixture, which was heated at 25°C
for 10 min and 42°C for 50 min, before the reaction was terminated
by heating at the mixture at 80°C for 10 min. qPCR was performed
using SYBR GREEN (Beijing Solarbio Science & Technology Co.,
Ltd.) and 2X Taq PCR MasterMix (Beijing Solarbio Science &
Technology Co., Ltd.) on a fluorescence quantifier (Exicycler™ 96,
Bioneer Corporation). The qPCR thermocycling conditions were as
follows: Initial denaturation at 95°C for 5 min(), followed by 40
cycles at 95°C for 10 sec (denaturation), 60°C for 10 sec
(annealing) and 72°C for 15 sec (extension). The mRNA levels were
quantified using the 2−ΔΔCq(Cq test-Cq reference)
formula (23). The sequences of the
primers used were: ETHE1 forward, 5′-GTCATCTCCCGCCTTAGTG-3′ and
reverse, 5′-CGGATCAACAGGGCATCT-3′; and GAPDH forward,
5′-GACCTGACCTGCCGTCTAG-3′ and reverse, 5′-AGGAGTGGGTGTCGCTGT-3′.
GAPDH was used as the internal control gene.
Western blot analysis
Total protein was extracted from clinical samples or
cells (NCI-N87 and MKN-45) using RIPA lysis buffer (Beijing
Solarbio Science & Technology Co., Ltd.), and the protein
concentration was determined using a BCA protein concentration
assay kit (Beijing Solarbio Science & Technology Co., Ltd.).
Protein samples (20 µg) were loaded onto SDS-gels (5% stacking gel,
8–12% separation gel), resolved using SDS-PAGE and transferred to
PVDF membranes (MilliporeSigma). The membranes were then blocked
using a blocking solution (cat. no. SW3010; Beijing Solarbio
Science & Technology Co., Ltd.) for 1 h and washed.
Subsequently, the membranes were incubated with primary antibodies
(1:1,000) overnight at 4°C and with the secondary antibody
(1:3,000) for 1 h at room temperature. After washing, enhanced
chemiluminescence solution (Beijing Solarbio Science &
Technology Co., Ltd.) was added to the membranes, which were
exposed in a dark room and imaged using a gel imaging system
(WD-9413B; Beijing Liuyi Biotechnology Co., Ltd.). The antibodies
used in the present study are listed in Table I.
 | Table I.Antibody information. |
Table I.
Antibody information.
| A, Western
blotting |
|---|
|
|---|
| Antibody name | Provider | Cat. no. |
|---|
| ETHE1 antibody | ABclonal Biotech
Co., Ltd. | A10142 |
| Cyclin D1
antibody | ABclonal Biotech
Co., Ltd. | A19038 |
| Cyclin-dependent
kinase 4 antibody | ABclonal Biotech
Co., Ltd. | A16813 |
| Glucose transporter
type 1 antibody | ABclonal Biotech
Co., Ltd. | A6982 |
| Lactate
dehydrogenase A antibody | ABclonal Biotech
Co., Ltd. | A1146 |
| Hexokinase 2
antibody | ABclonal Biotech
Co., Ltd. | A0994 |
| Pyruvate kinase
isozyme type M2 antibody | ABclonal Biotech
Co., Ltd. | A20991 |
| GAPDH | Proteintech Group,
Inc. | 60004-1-Ig |
| Goat Anti-Rabbit
IgG-HRP | Beijing Solarbio
Science & Technology Co., Ltd. | SE134 |
| Goat Anti-Mouse
IgG-HRP | Beijing Solarbio
Science & Technology Co., Ltd. | SE131 |
|
| B,
Immunohistochemistry |
|
| Antibody
name |
Provider | Cat.
no. |
|
| Ki67 antibody | Proteintech Group,
Inc. | 27309-1-AP |
| ETHE1 antibody | Abcam | ab174302 |
| Goat Anti-Rabbit
IgG-HRP | Thermo Fisher
Scientific, Inc. | 31460 |
Immunohistochemistry
Tumor tissue was fixed in 4% paraformaldehyde
overnight at room temperature, and dehydrated in an increasing
series of ethanol concentrations (70, 80, 90 and 100%). Dehydrated
tissues were permeabilized in xylene and embedded in paraffin.
Paraffin-embedded tissues were cut into 5-µm sections, which were
immersed in xylene, rehydrated in a descending series of ethanol
concentrations (95, 85 and 75%), boiled in antigen retrieval
solution (Beyotime Institute of Biotechnology) for 10 min, washed
in PBS buffer, and incubated with 3% H2O2
(Sinopharm Chemical Reagent Co., Ltd.) for 15 min at room
temperature to inactivate endogenous peroxidase activity.
Subsequently, the sections were blocked with 1% BSA (Sangon Biotech
Co., Ltd.) for 15 min at room temperature. After washing, the
sections were incubated with primary antibodies (Ki67 antibody,
1:1,000; ETHE1 antibody, 1:200) at 4°C overnight, followed by
incubation with a horseradish peroxidase-conjugated secondary
antibody (1:500) for 1 h at room temperature. The protein
expression was visualized using DAB (Fuzhou Maixin Biotechnology
Development Co., Ltd.). Finally, sections were counterstained with
hematoxylin (Beijing Solarbio Science & Technology Co., Ltd.)
and images were captured using a light micrograph system (DP73;
Olympus Corporation). Antibody details are provided in Table I.
Cell viability assay
Cells (NCI-N87 and MKN-45) were seeded in 96-well
plates (5×10³ cells/well) and cell viability was
assessed using a Cell Counting Kit-8 cell proliferation assay kit
(Nanjing KeyGen Biotech Co., Ltd.) according to the manufacturer's
protocol. Cells were incubated with CCK-8 reagent for 2 h at 37°C.
The absorbance was measured at 450 nm using a microplate reader
(800TS; BioTek; Agilent Technologies, Inc.).
EdU staining
Cells (NCI-N87 and MKN-45) were stained using a
kFluor488 Click-iT EdU imaging assay kit (Nanjing KeyGen Biotech
Co., Ltd.) according to the manufacturer's protocol. Briefly,
virally infected cells were incubated with EdU for 2 h at 37°C,
fixed with 4% paraformaldehyde for 15 min at room temperature, and
treated with the Click-iT reaction solution in the dark for 30 min
at room temperature. Nuclei were counterstained with DAPI for 5 min
at room temperature. Images were captured using a fluorescence
microscope (IX53; Olympus Corporation).
Flow cytometry
Cell cycle distribution and apoptosis were analyzed
using a flow cytometer (NovoCyte-D2060R; Agilent Technologies,
Inc.), and a Cell Cycle and Apoptosis Analysis Kit (BioSharp Life
Sciences) or an Annexin V-APC/PI double staining apoptosis
detection kit (Nanjing KeyGen Biotech Co., Ltd.), respectively,
according to the manufacturers' protocols. Briefly, cells (NCI-N87
and MKN-45) were incubated in PI/RNase A solution in the dark for
30 min at room temperature, and then the cell cycle distribution
was measured. In addition, the cells were incubated with 5-µl
Annexin V-APC and 5 µl PI dye in the dark for 10 min at room
temperature, and apoptosis was detected. Analysis was conducted
using NovoExpress software (version 1.5.6; Agilent Technologies,
Inc.).
TUNEL assay
The TUNEL assay was used to detect apoptosis. Cells
(NCI-N87 and MKN-45) grown on glass coverslips were fixed with 4%
paraformaldehyde for 10 min at room temperature and were then
permeabilized using 0.1% Triton X-100 for 15 min at room
temperature. Fluorescent labeling was performed using an In Situ
Cell Death Detection Kit (Roche Diagnostics) according to the
manufacturer's protocol. The cells were incubated with TUNEL
reaction liquid for 1 h at 37°C. For tissues, they were embedded in
paraffin and cut into 5-µm sections. The sections were dewaxed,
permeabilized and then labeled. The nuclei were counterstained with
DAPI (Shanghai Aladdin Biochemical Technology Co., Ltd.) for 5 min
at room temperature. The sections were sealed using antifading
mounting medium (Beijing Solarbio Science & Technology Co.,
Ltd.) and the images of the sections were captured using a
fluorescence micrograph system (three fields/sample).
Detection of caspase-3 and caspase-9
activity
Caspase-3 and caspase-9 activities in the NCI-N87
and MKN-45 cell lines were assessed using a caspase-3 activity
assay kit (cat. no. C1116; Beyotime Institute of Biotechnology) and
caspase-9 activity assay kit (cat. no. C1158; Beyotime Institute of
Biotechnology), respectively, according to the manufacturer's
protocol. Total protein was extracted using the lysis buffer
provided by the kits. A Bradford protein concentration assay kit
(Beyotime Institute of Biotechnology) was used to determine the
total protein concentration, which was used to normalize the data.
Caspase-3 and caspase-9 activity were assessed based on the
concentration of the product of pNA, which is catalyzed by both
caspase-3 and caspase-9. The absorbance of catalytic products was
measured at 405 nm using a microplate reader (800TS).
Detection of markers of
glycolysis
A glucose assay kit (cat. no. F006; Nanjing
Jiancheng Bioengineering Institute), lactic acid assay kit (cat.
no. A019; Nanjing Jiancheng Bioengineering Institute) and ATP assay
kit (cat. no. S0026; Beyotime Institute of Biotechnology) were used
to measure glucose consumption, lactate production and ATP content,
respectively. The cells (NCI-N87 and MKN-45 cell lines) were lysed
using ultrasonic processing (300 W, 3 sec, interval time 25 sec, 5
cycles) and a BCA protein concentration assay kit (Beyotime
Institute of Biotechnology) was used to detect total protein
concentration, which was used to normalize the data.
Statistical analysis
The in vitro experiments were repeated three
times. Data are presented as the mean ± SD. Statistical analyses
were performed using GraphPad Prism version 9.5.0 (Dotmatics). A
two-tailed unpaired Student's t-test or one-way ANOVA followed by a
Tukey's post hoc test was used to analyze the differences between
independent groups. P<0.05 was considered to indicate a
statistically significant difference.
Results
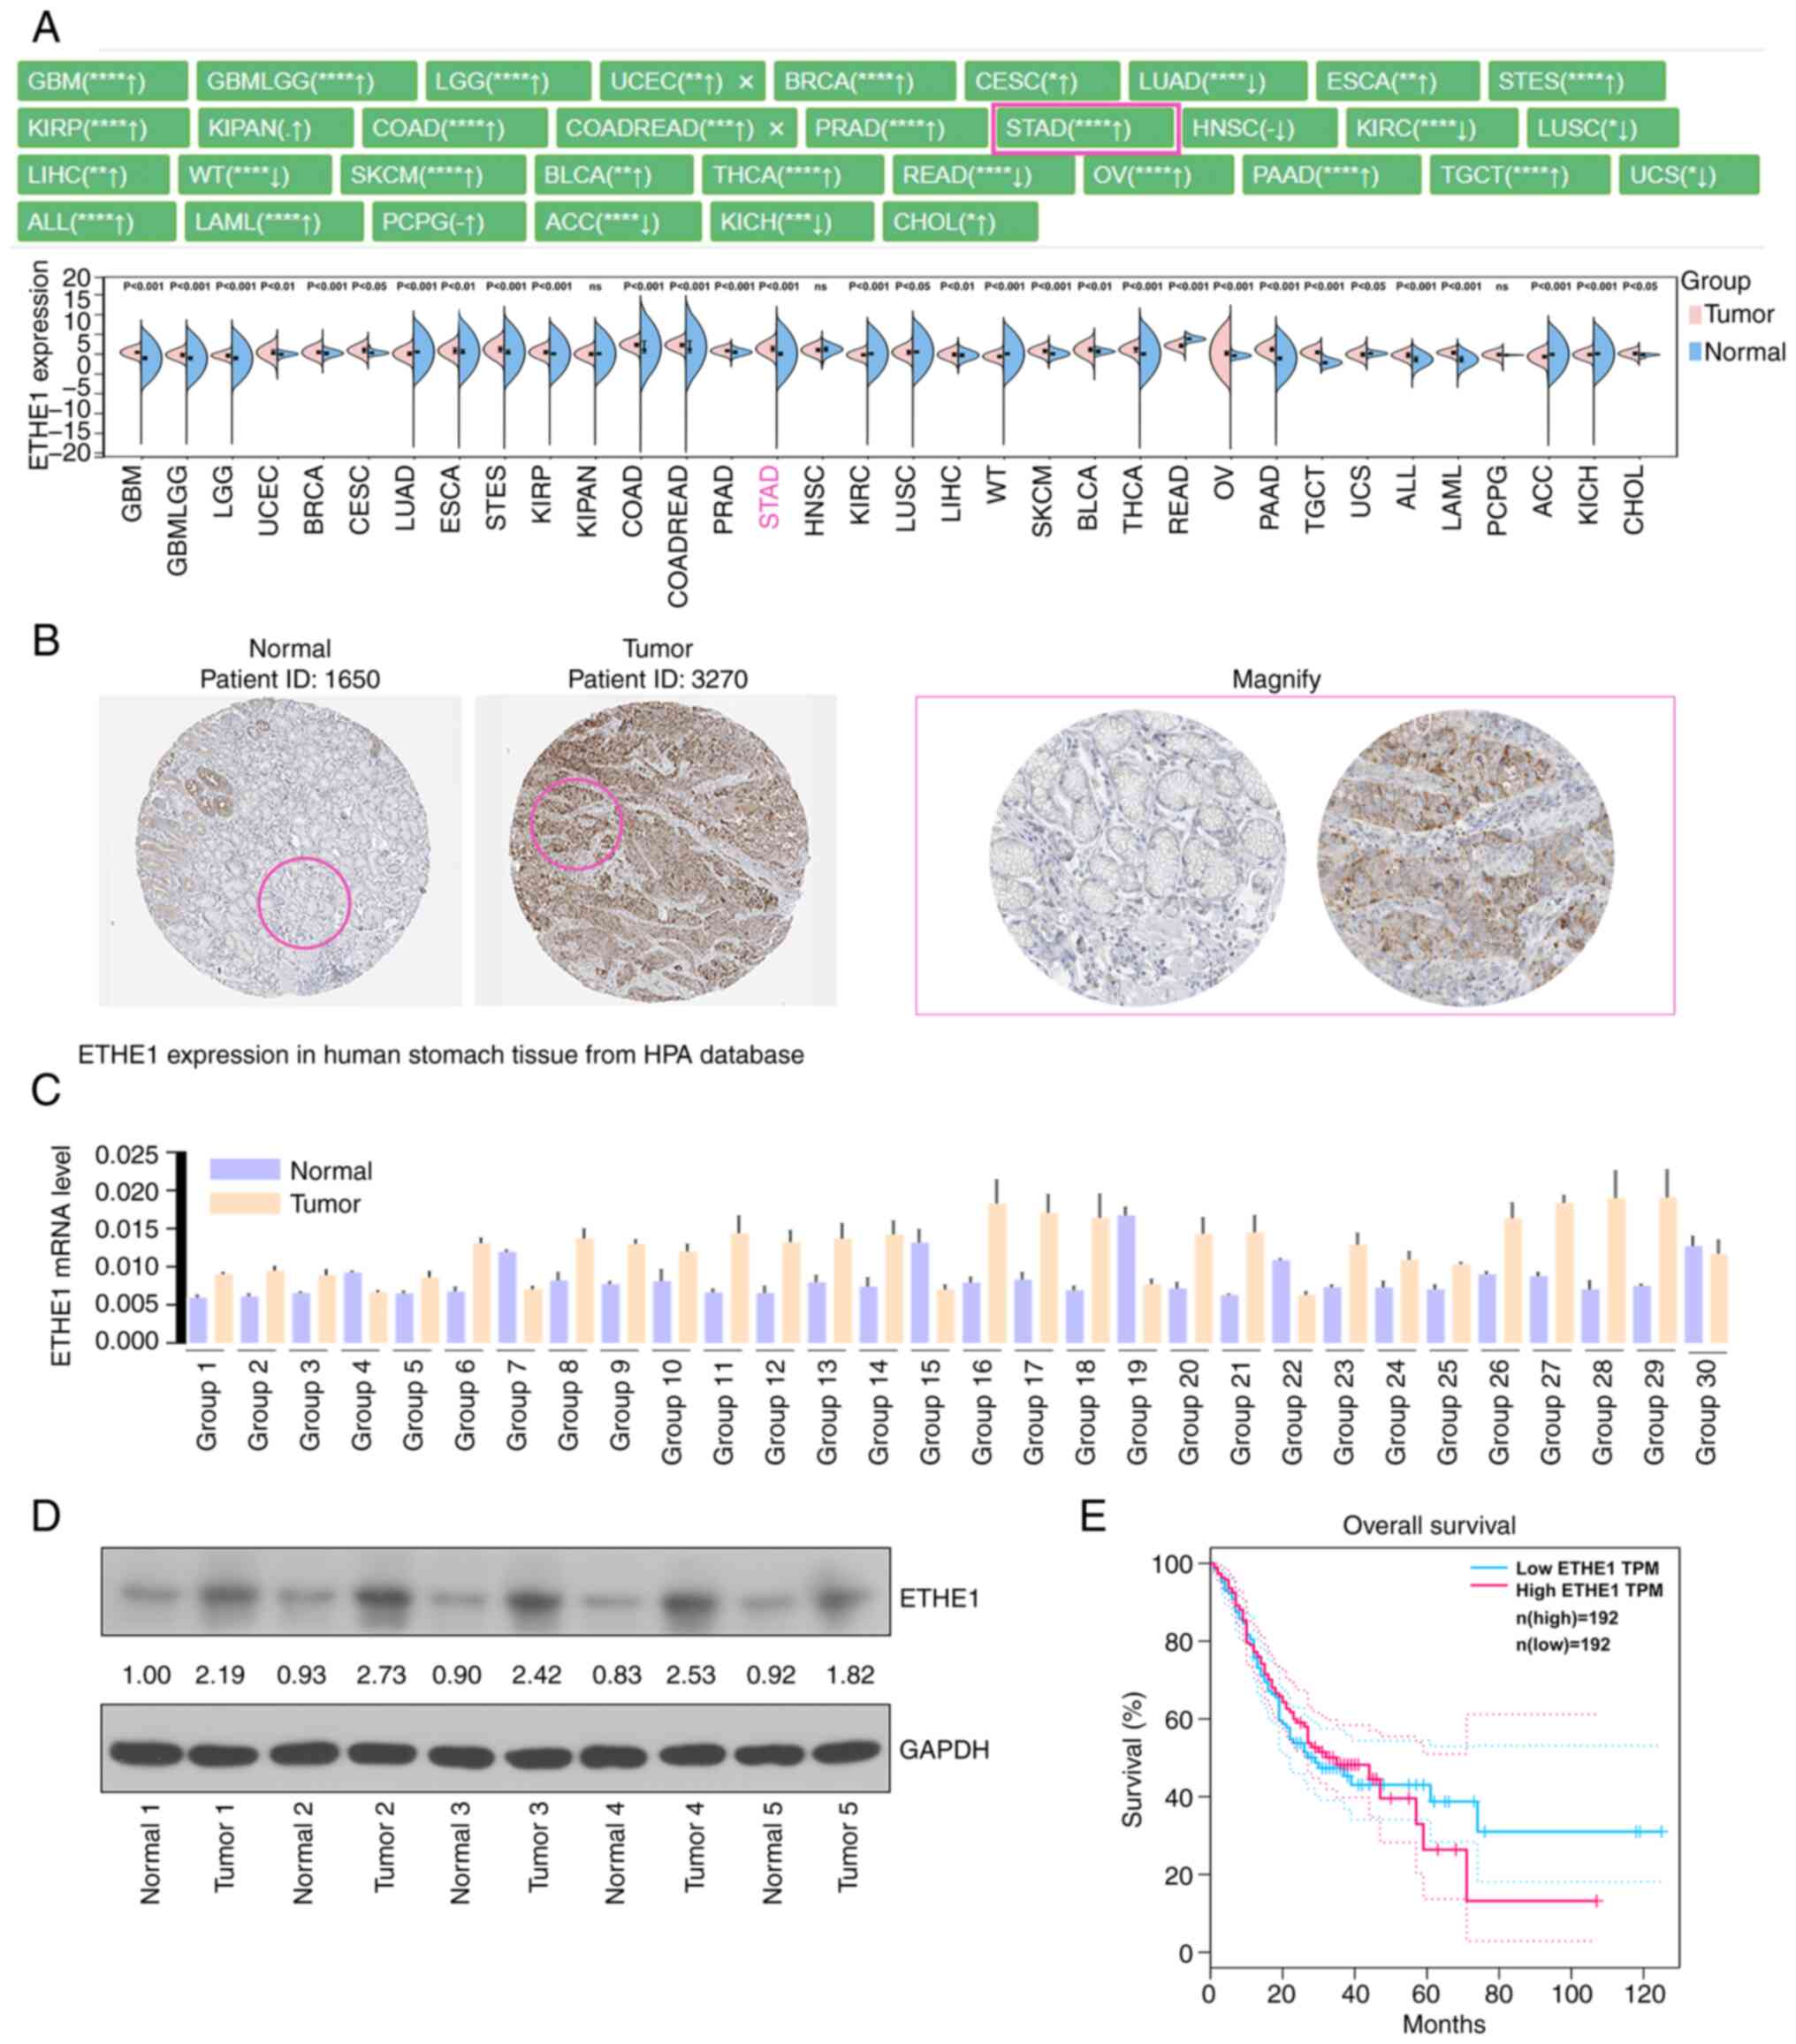
ETHE1 expression is upregulated in GAC
tissues and cells
Pan-cancer analysis showed that ETHE1 was
differentially expressed in multiple types of cancer, such as STAD.
Notably, the expression of ETHE1 in STAD samples was significantly
higher than that in healthy control samples (Fig. 1A). Furthermore, the
immunohistochemical results of ETHE1 in GC and normal tissues were
analyzed using the HPA database, and ETHE1 expression was
upregulated in tumor tissues (Fig.
1B). The present study detected the expression levels of ETHE1
in 30 pairs of GC tissues and paracancerous tissues. Analysis
showed that ETHE1 expression was generally higher in cancerous
tissues than that in paracancerous tissues (Fig. 1C and D). Additionally, upregulated
expression of ETHE1 was associated with a worse survival time
(Fig. 1E). The association between
ETHE1 expression levels and clinicopathological characteristics are
shown in Table II. A higher tumor
stage, lymph node metastasis or higher Tumor-Node-Metastasis (TNM)
stage was associated with higher expression of ETHE1, indicating a
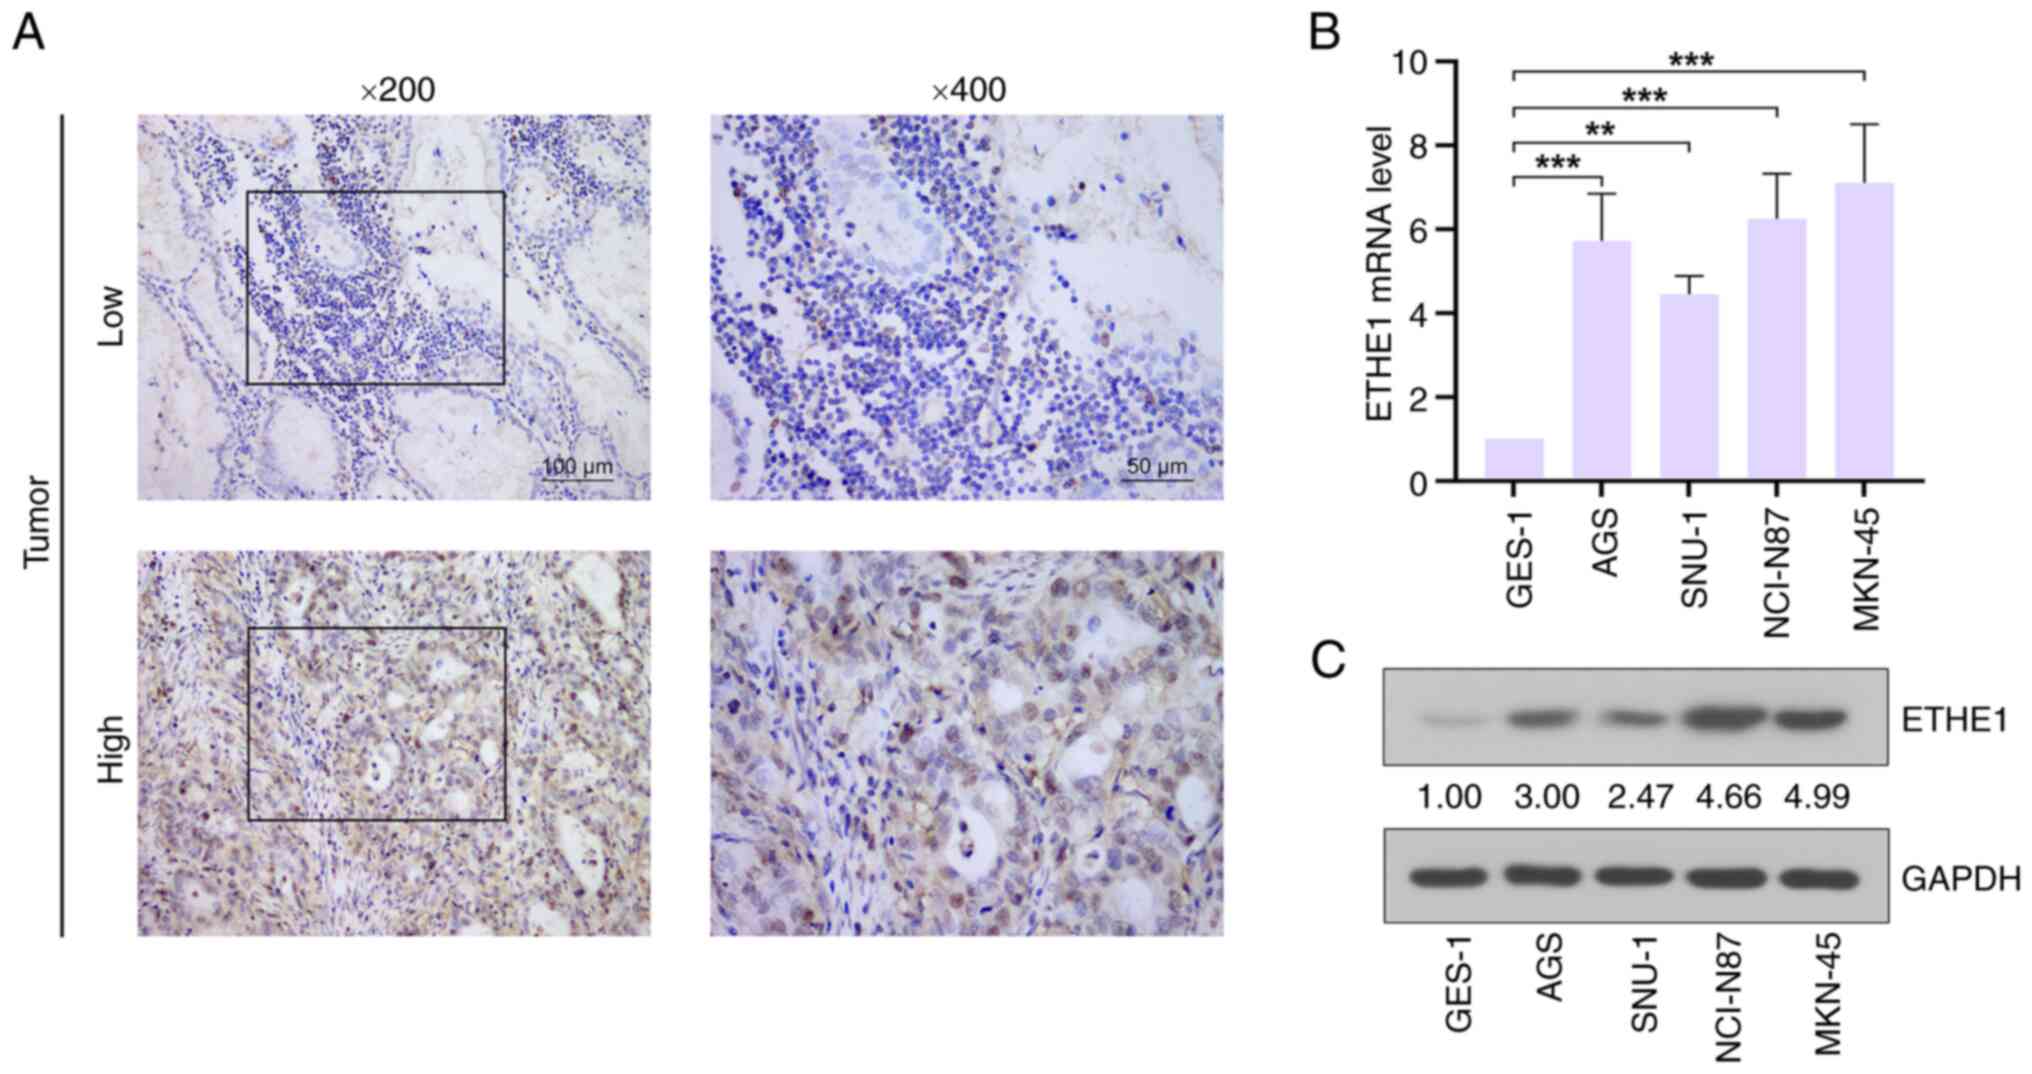
potential link between ETHE1 and GAC. Representative
immunohistochemical images of high and low ETHE1 expression in GAC
tissues are shown in Fig. 2A.
Furthermore, the expression levels of ETHE1 in GAC cell lines were
higher than those in the normal gastric mucosa cell line GES-1, and
the expression levels were relatively higher in NCI-N87 and MKN-45
cells than in AGS and SNU-1 cell lines (Fig. 2B and C). Therefore, these two cell
lines were selected for further study.
| Table II.Correlation between ETHE1 expression
levels and the clinicopathological characteristics of patients with
GAC. |
Table II.
Correlation between ETHE1 expression
levels and the clinicopathological characteristics of patients with
GAC.
|
|
| ETHE1
expression |
|
|---|
|
|
|
|
|
|---|
| Parameter | Cases | Low
(<Mediana) | High
(≥Mediana) | P-value |
|---|
| Sex |
|
|
| 0.267 |
|
Male | 39 | 6 | 33 |
|
|
Female | 11 | 4 | 7 |
|
| Age |
|
|
| 0.813 |
| ≤60
years | 14 | 3 | 11 |
|
| >60
years | 36 | 7 | 29 |
|
| T stage |
|
|
|
3.71074×10⁻⁵ |
|
T1-T2 | 5 | 5 | 0 |
|
|
T3-T4 | 45 | 5 | 40 |
|
| N stage |
|
|
| 0.032 |
| N0 | 7 | 4 | 3 |
|
| N1 | 43 | 6 | 37 |
|
| M stage |
|
|
| >0.99 |
| M0 | 48 | 10 | 38 |
|
| M1 | 2 | 0 | 2 |
|
| TNM stage |
|
|
| 0.033 |
|
I–II | 18 | 7 | 11 |
|
|
III–IV | 32 | 3 | 29 |
|
| Histopathological
grade |
|
|
| >0.99 |
| G1 | 1 | 1 | 0 |
|
|
G2-G3 | 49 | 9 | 40 |
|
| Tumor size |
|
|
| 0.126 |
| ≤3
cm | 13 | 5 | 8 |
|
| >3
cm | 37 | 5 | 32 |
|
| Tumor number |
|
|
| >0.99 |
|
Unifocal | 48 | 10 | 38 |
|
|
Multifocal | 2 | 0 | 2 |
|
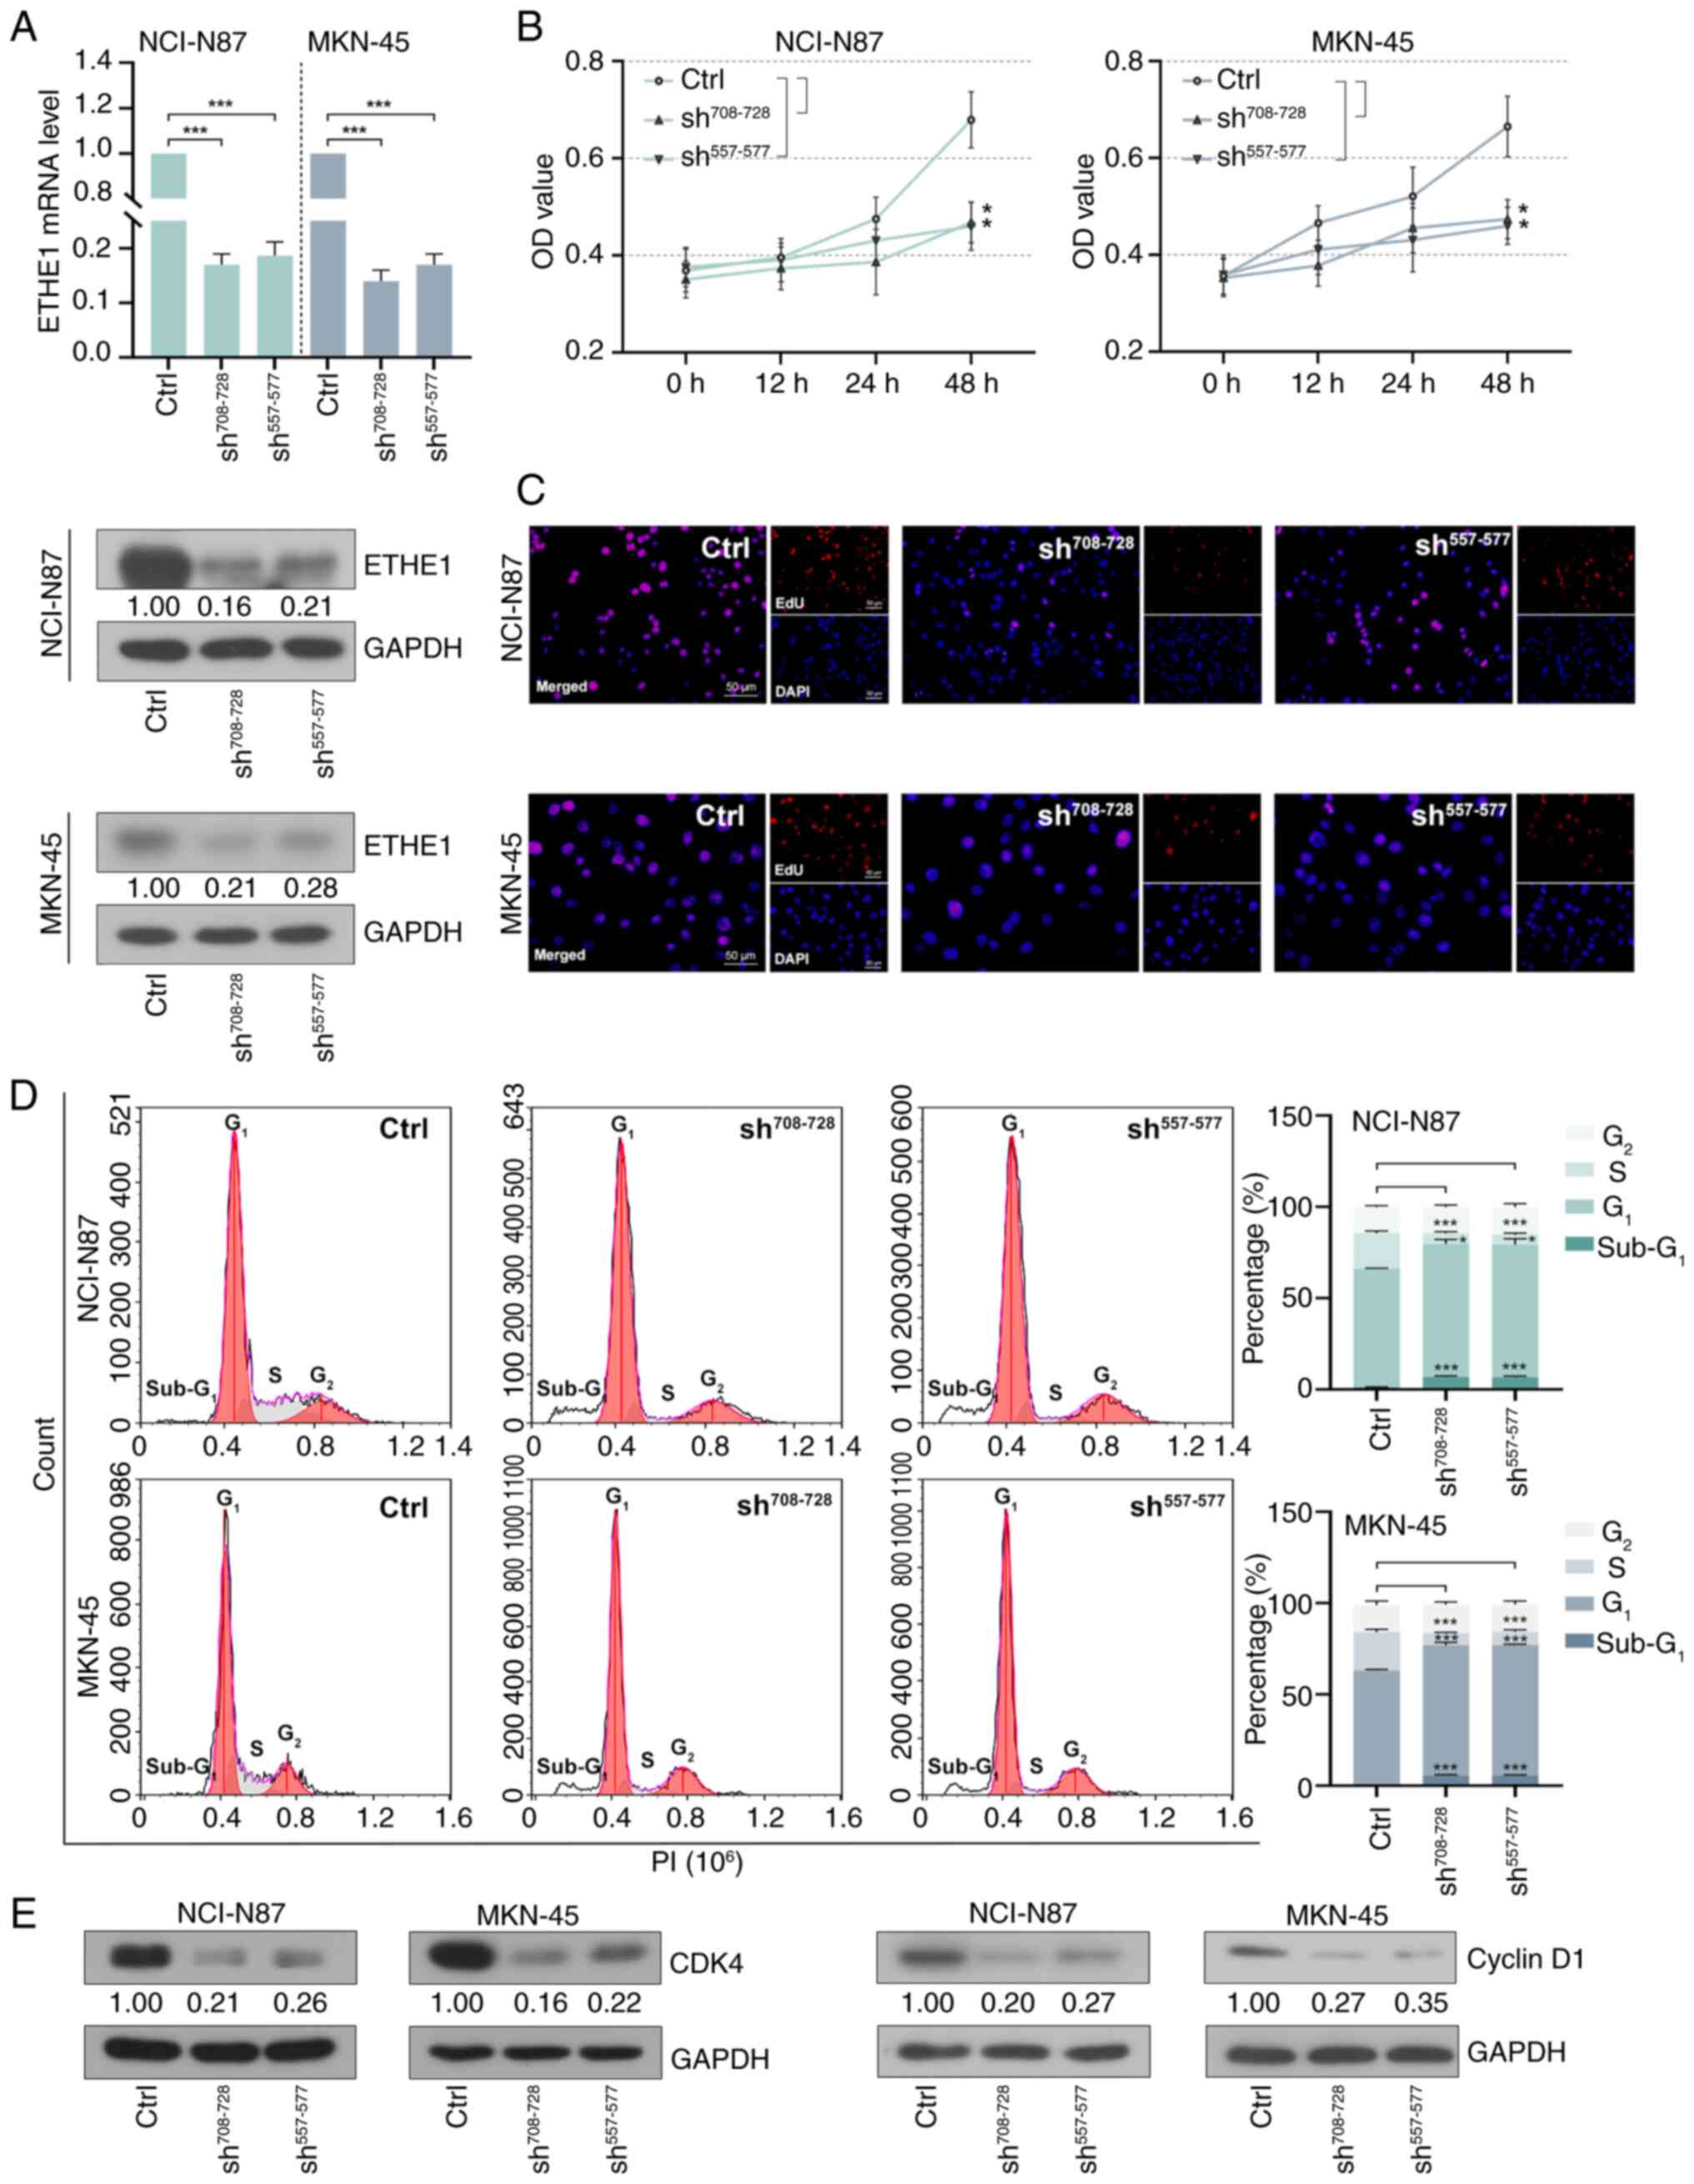
ETHE1 knockdown inhibits GAC cell
proliferation
As shown in Fig. 3A,
compared with in the control group, intracellular ETHE1 expression
was successfully knocked down ~4-fold. Cell proliferation was
inhibited following lentiviral infection for 48 h (Fig. 3B). Furthermore, the number of
EdU-positive cells was reduced, indicating that GAC cell
proliferation was reduced following ETHE1 knockdown (Fig. 3C). Cell cycle distribution was
measured using flow cytometry. As shown in Fig. 3D, the knockdown of ETHE1 resulted in
a decrease in the number of cells in the S phase, an increase in
the number of cells in the G1 phase, and no significant
effect on the number of cells in the G2 phase. In
addition, the proportion of cells in the sub-G1 phases
suggested the occurrence of apoptosis. Western blot analysis showed
that ETHE1 knockdown reduced the expression levels of cyclin D1 and
CDK4 (Fig. 3E).
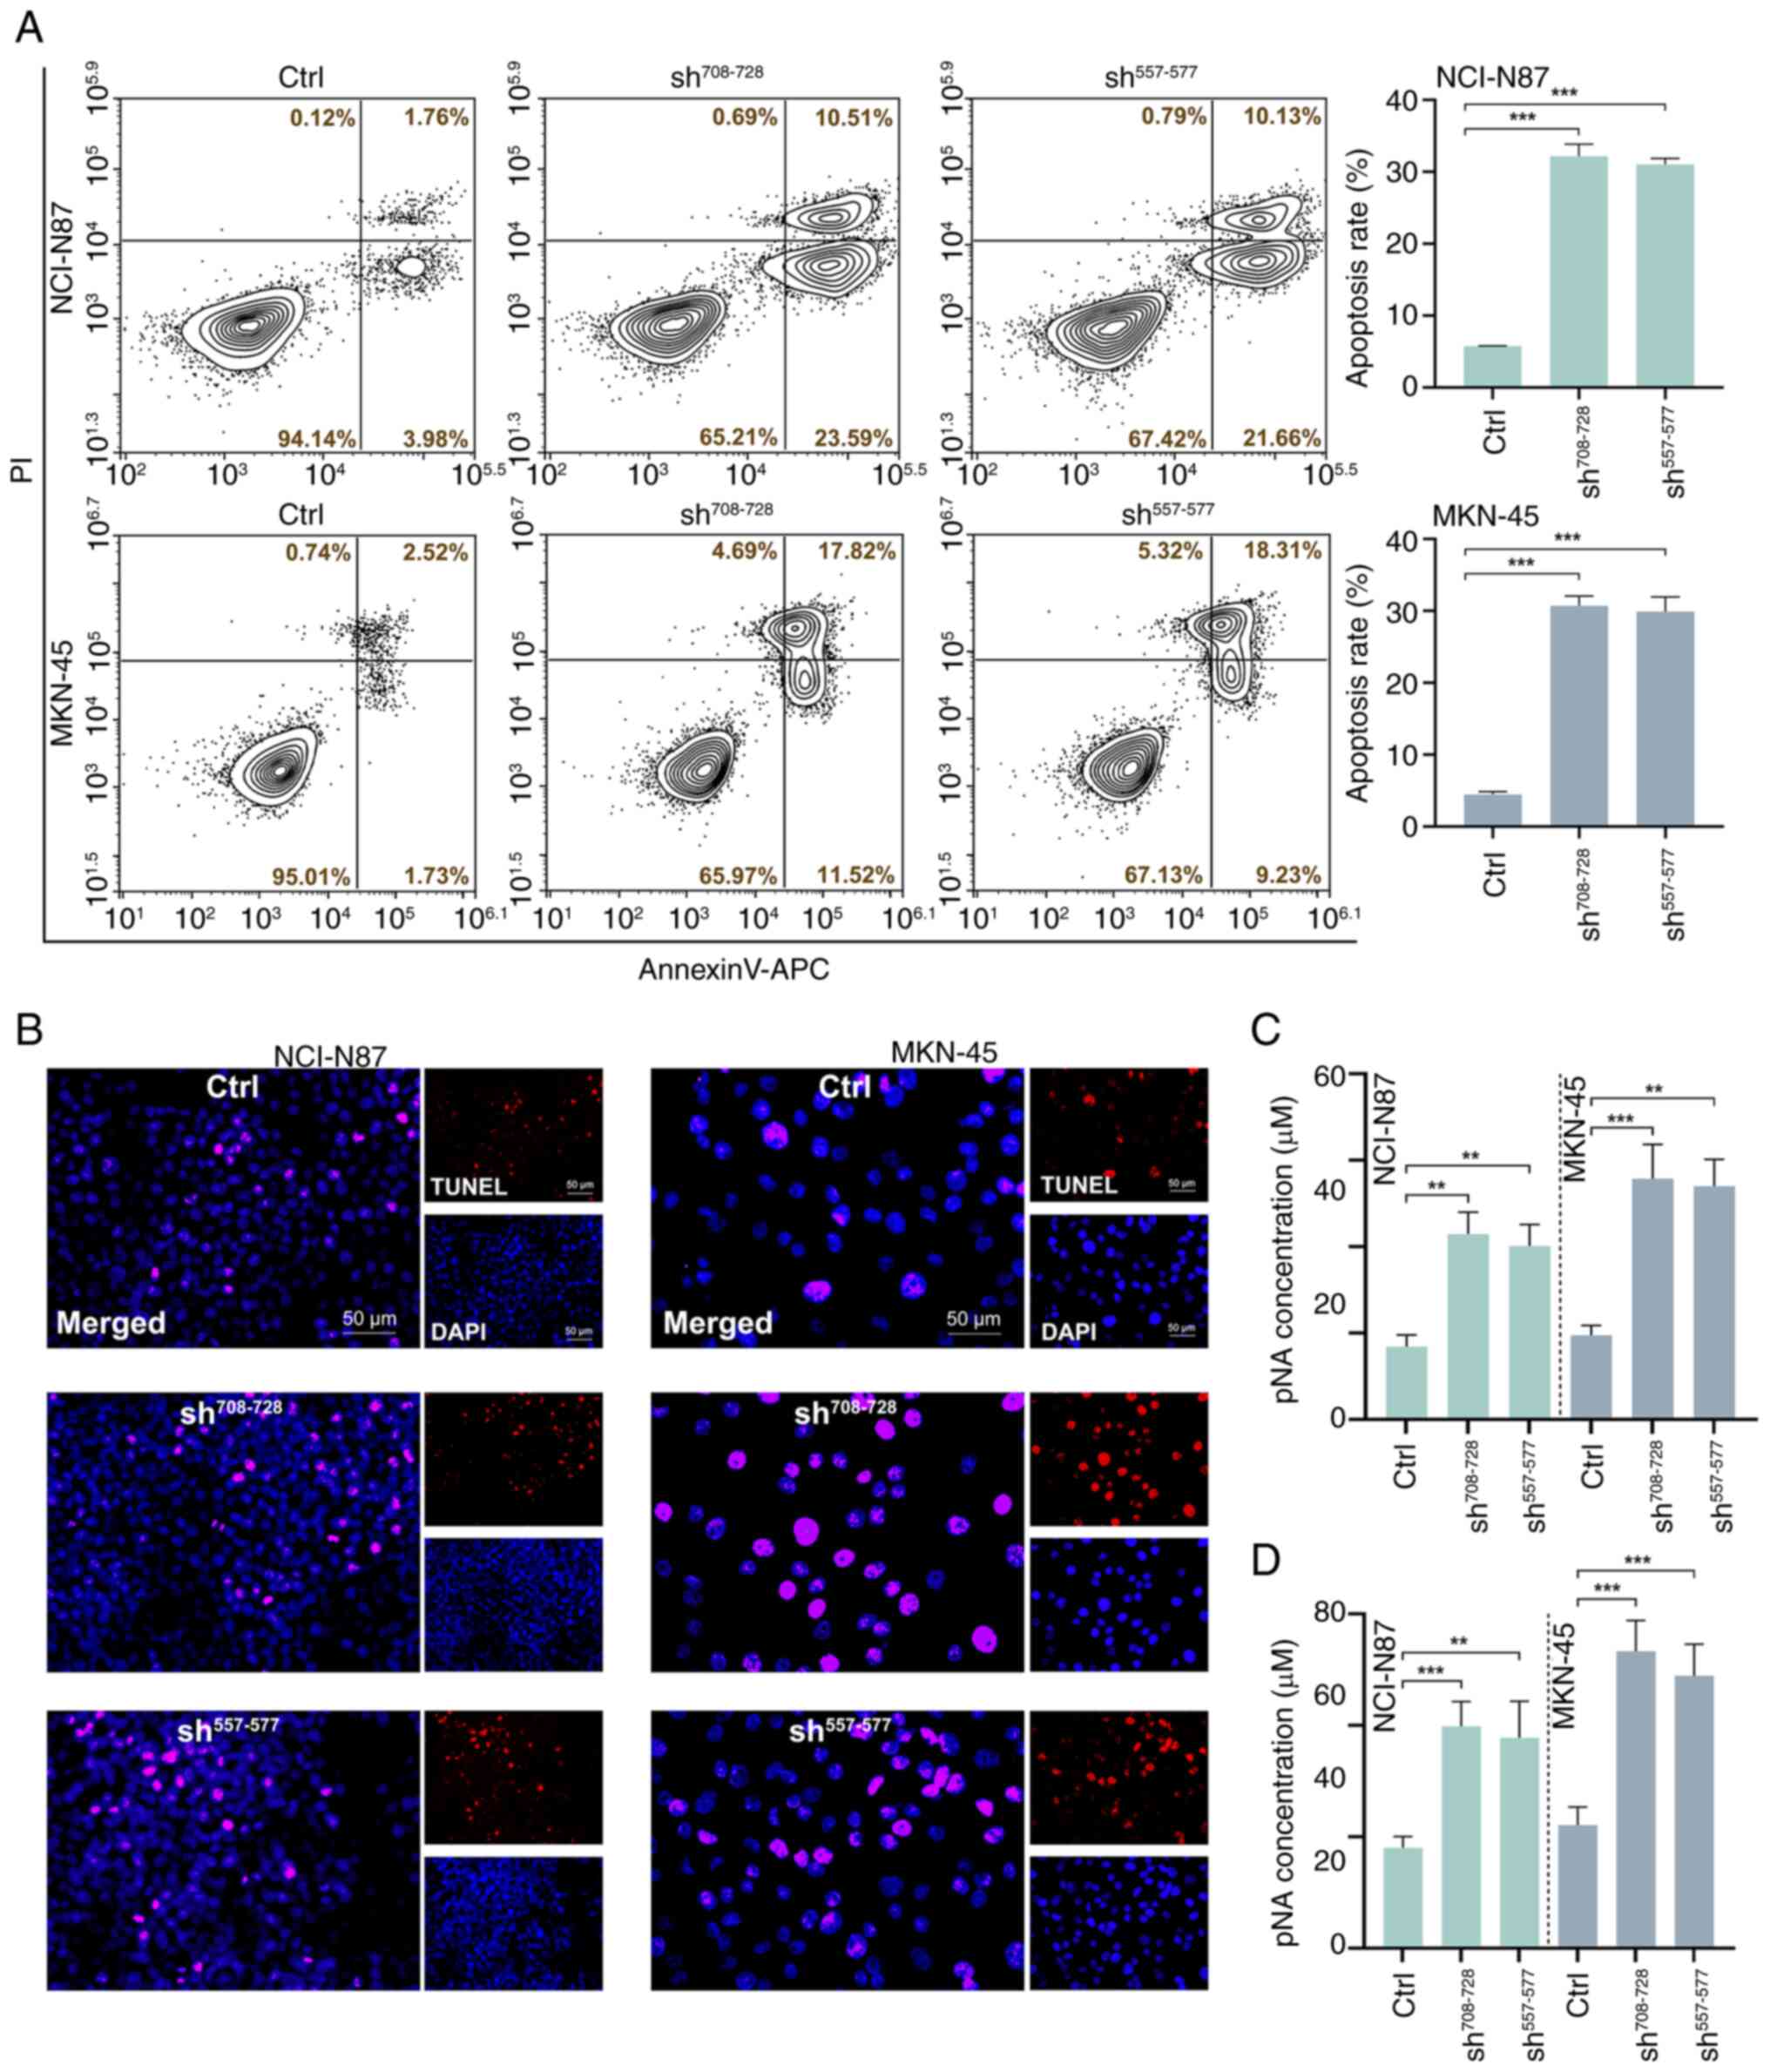
ETHE1 knockdown promotes GAC cell
apoptosis
Apoptosis was further measured using Annexin V-PI
staining combined with flow cytometry. As shown in Fig. 4A, compared with in the control
group, knockdown of ETHE1 increased the proportion of apoptotic GAC
cells. TUNEL staining also showed that ETHE1 knockdown promoted
apoptosis (Fig. 4B). Further
analysis of apoptosis-related enzyme activity revealed that
knockdown of ETHE1 resulted in an increase in caspase-3 and
caspase-9 activity (Fig. 4C and
D).
ETHE1 knockdown inhibits aerobic
glycolysis in GAC cells
Compared with in the control groups, knockdown of
ETHE1 reduced glucose consumption, lactic acid production and ATP
levels in GAC cells, as measured by the markers of glycolysis in
GAC cells (Fig. 5A-C). In addition,
knockdown of ETHE1 reduced the expression levels of
glycolysis-related molecules, including glucose transporter type 1
(GLUT1), lactate dehydrogenase A (LDHA), hexokinase 2 (HK2) and
pyruvate kinase isozyme type M2 (PKM2) (Fig. 5D).
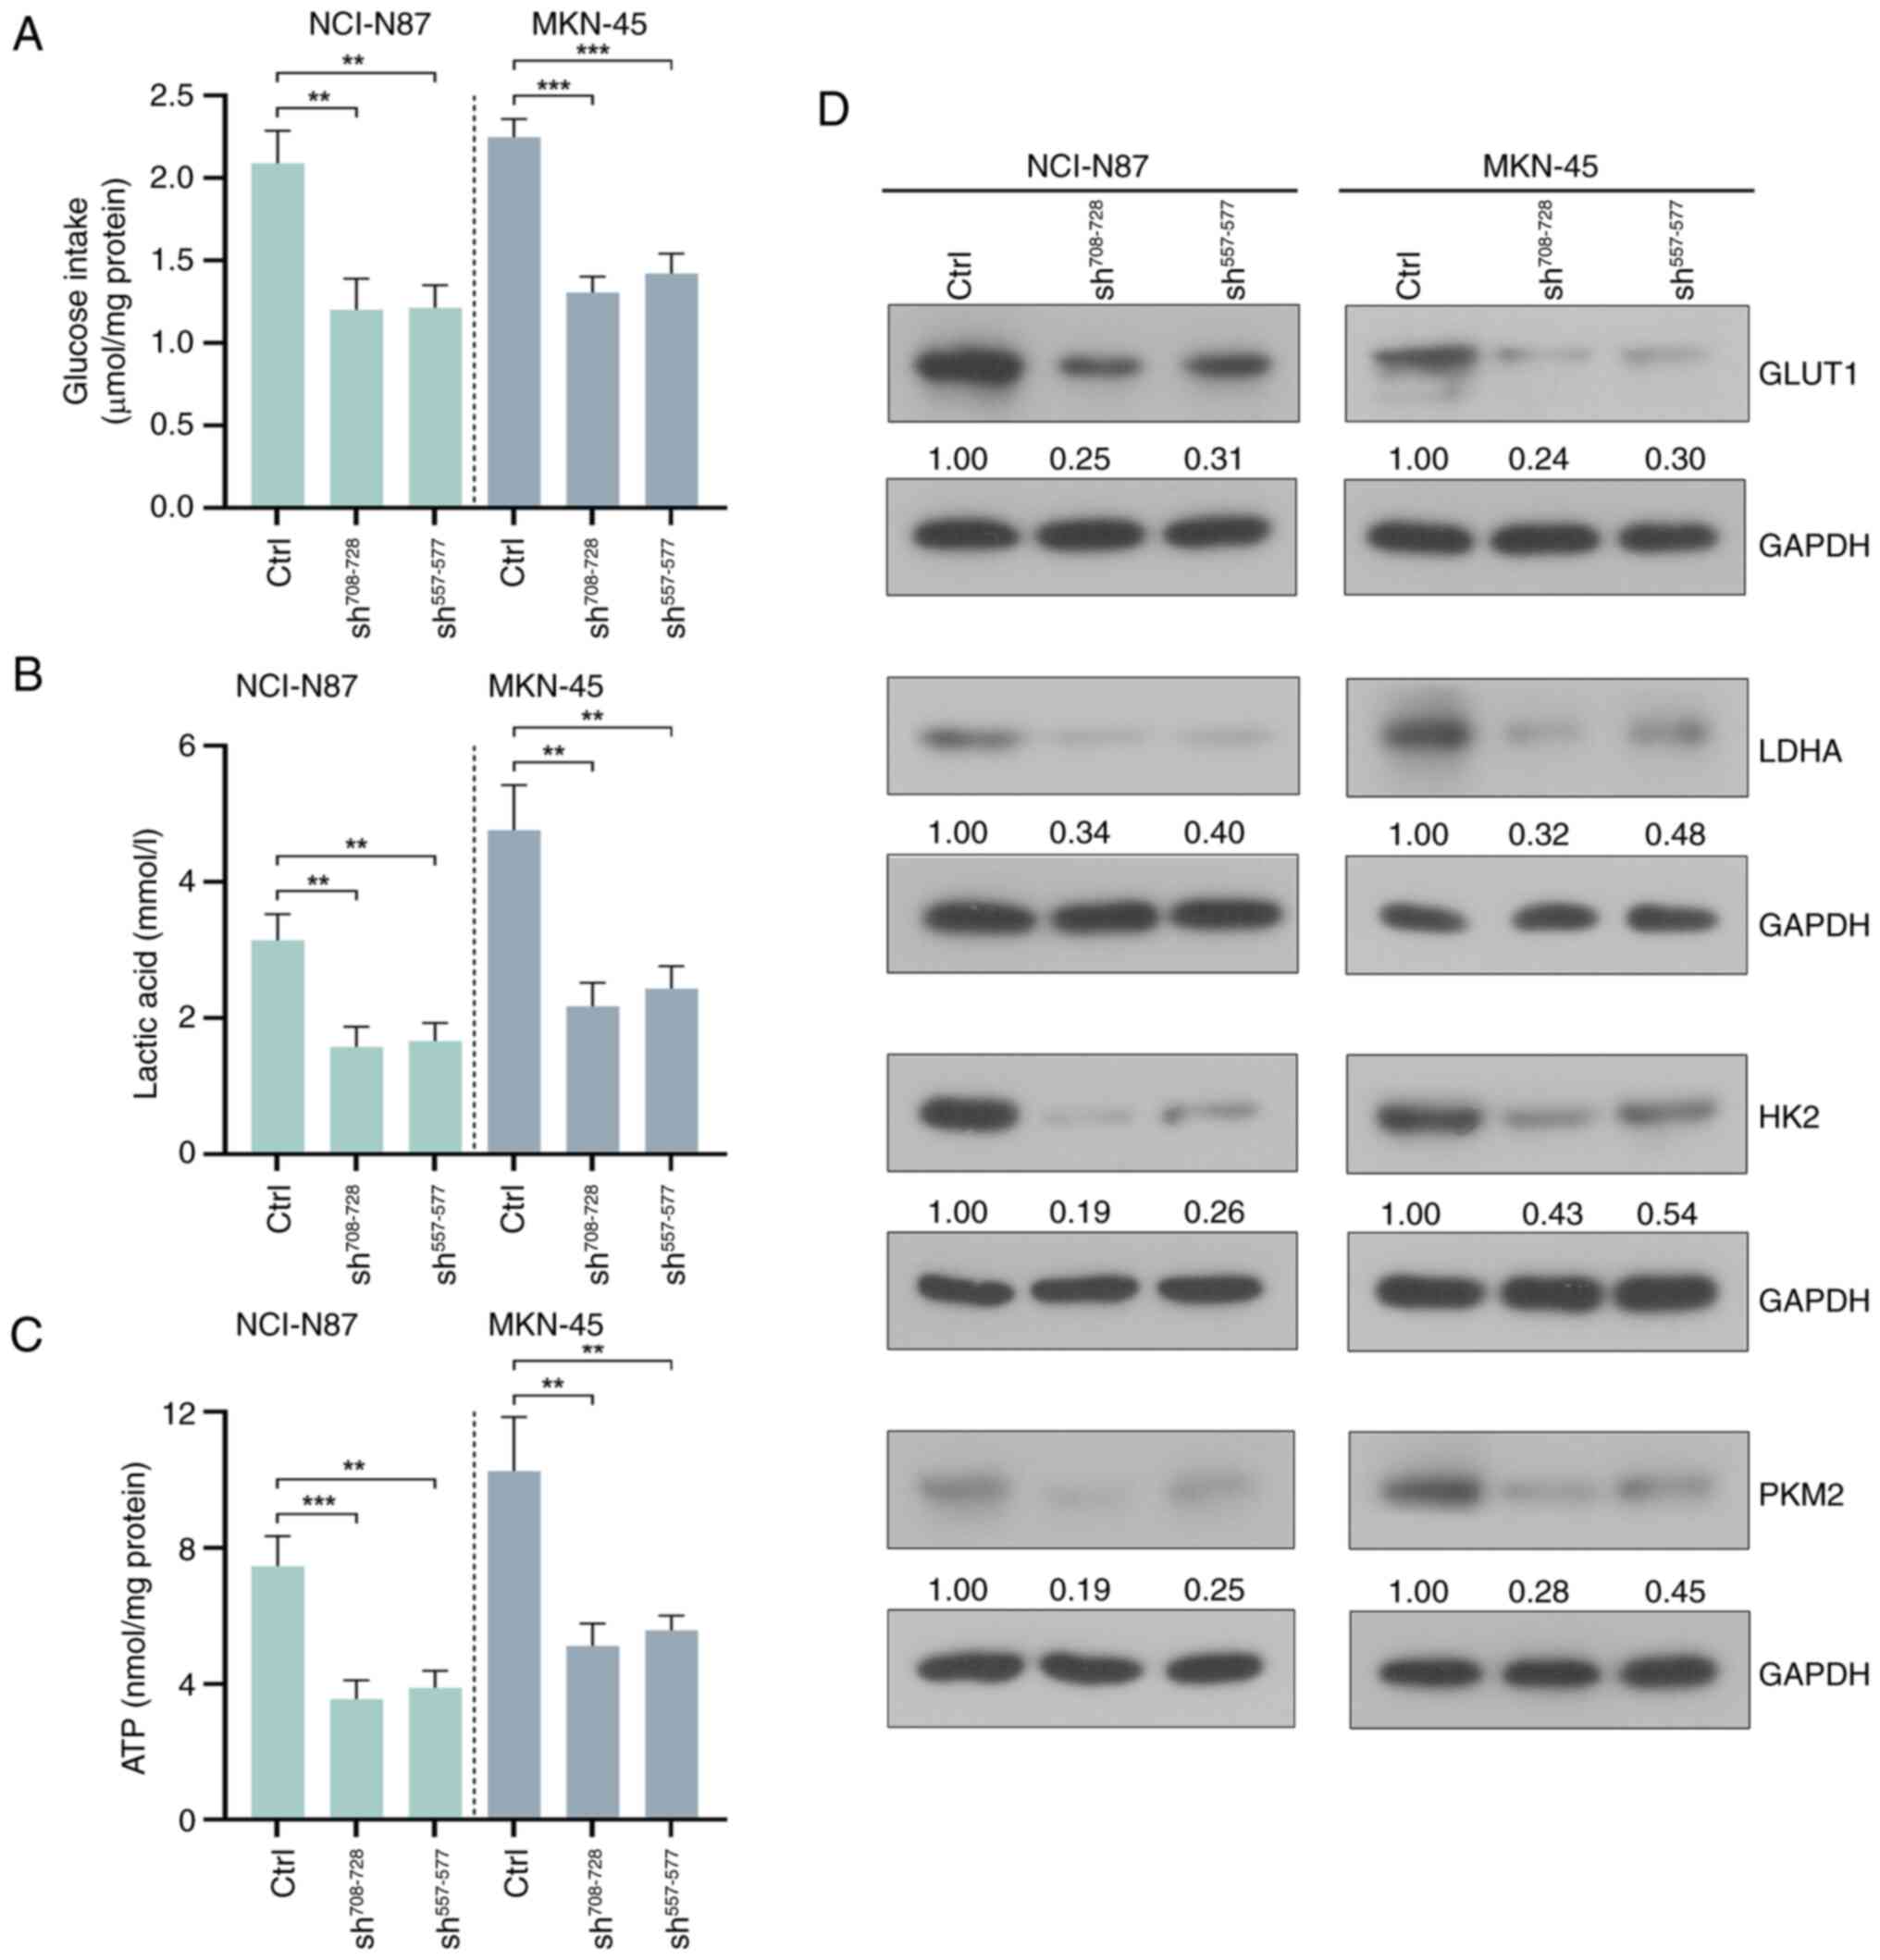 | Figure 5.ETHE1 knockdown inhibits aerobic
glycolysis in CAG cells. (A) Glucose consumption, (B) lactic acid
production and (C) ATP levels were detected using kits. (D) Western
blot analysis of GLUT1, LDHA, HK2 and PKM2. **P<0.01,
***P<0.001. Ctrl, control; GLUT1, glucose transporter type 1;
LDHA, lactate dehydrogenase A; HK2, hexokinase 2; PKM2, pyruvate
kinase isozyme type M2; sh, short hairpin. |
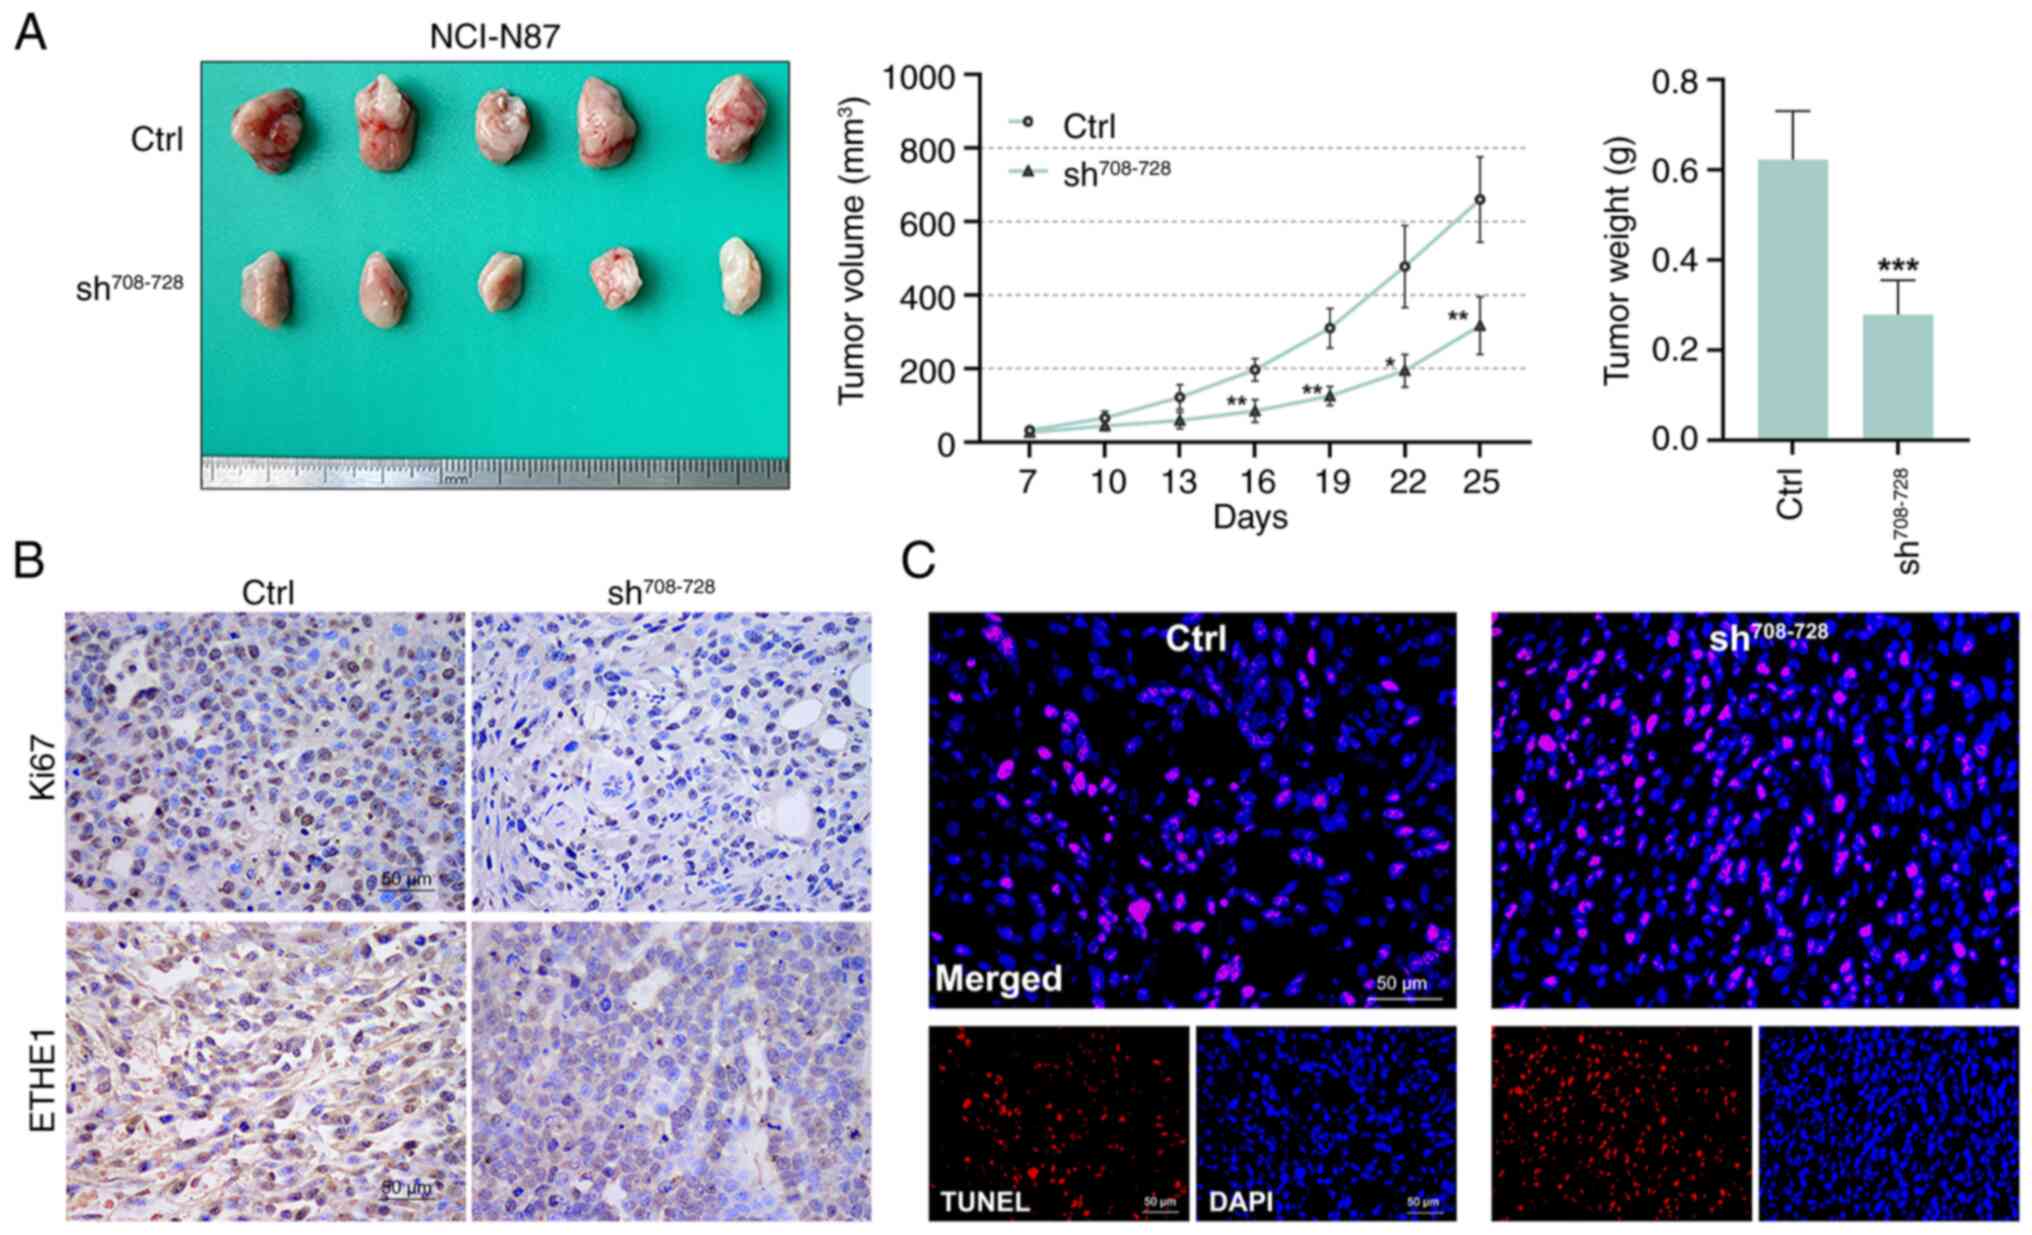
ETHE1 downregulation inhibits tumor
growth in vivo
The growth rate of tumors in the
sh708-728 group was lower than that in the control group
in vivo (Fig. 6A). Starting
from day 16, the tumor volume in the sh708-728 group was
smaller than that in the control group. The tumor weight of the
sh708-728 group was also lower than that of the control
group. Compared with in the control group, Ki67 and ETHE1
expression in the tumor tissues of the sh708-728 group
was reduced (Fig. 6B), whereas
apoptosis was increased (Fig.
6C).
ETHE1 is an important
immunomodulator
To further explore the value of ETHE1 in immune
regulation, the correlation between its expression and
immunomodulator expression was analyzed in STAD. The expression of
ETHE1 in STAD clinical samples was significantly positively
correlated with immunosuppressive factors, such as galectin 9
(LGALS9), nectin cell adhesion molecule 2 (PVRL2), IL-10 receptor
subunit β, CD274 and indoleamine 2,3-dioxygenase 1 (IDO1) (Fig. 7A). A negative correlation was
identified between ETHE1 expression and immune-promoting factors,
such as IL-6 receptor (IL6R), CD160, UL16 binding protein 1
(ULBP1), CD276 and CD40 (Fig. 7B).
ETHE1 expression was also positively correlated with chemokines,
such as C-X-C motif chemokine ligand (CXCL)5, CXCL3, CXCL16, CXCL1
and CXCL2 (Fig. 7C). These findings
suggested that ETHE1 may contribute to the development of STAD.
Although some correlations were not very strong (r value <0.3),
they were still statistically significant, thus indicating that
ETHE1 may be involved in the regulation of the expression of immune
regulatory factors. In addition, compared with in the normal
samples (paracancerous tissues, n=36), ETHE1 expression was
upregulated in Tregs and M2 macrophages in STAD tumor tissues
(n=414), suggesting that ETHE1 expression may mediate the malignant
behavior of STAD (Fig. 7D).
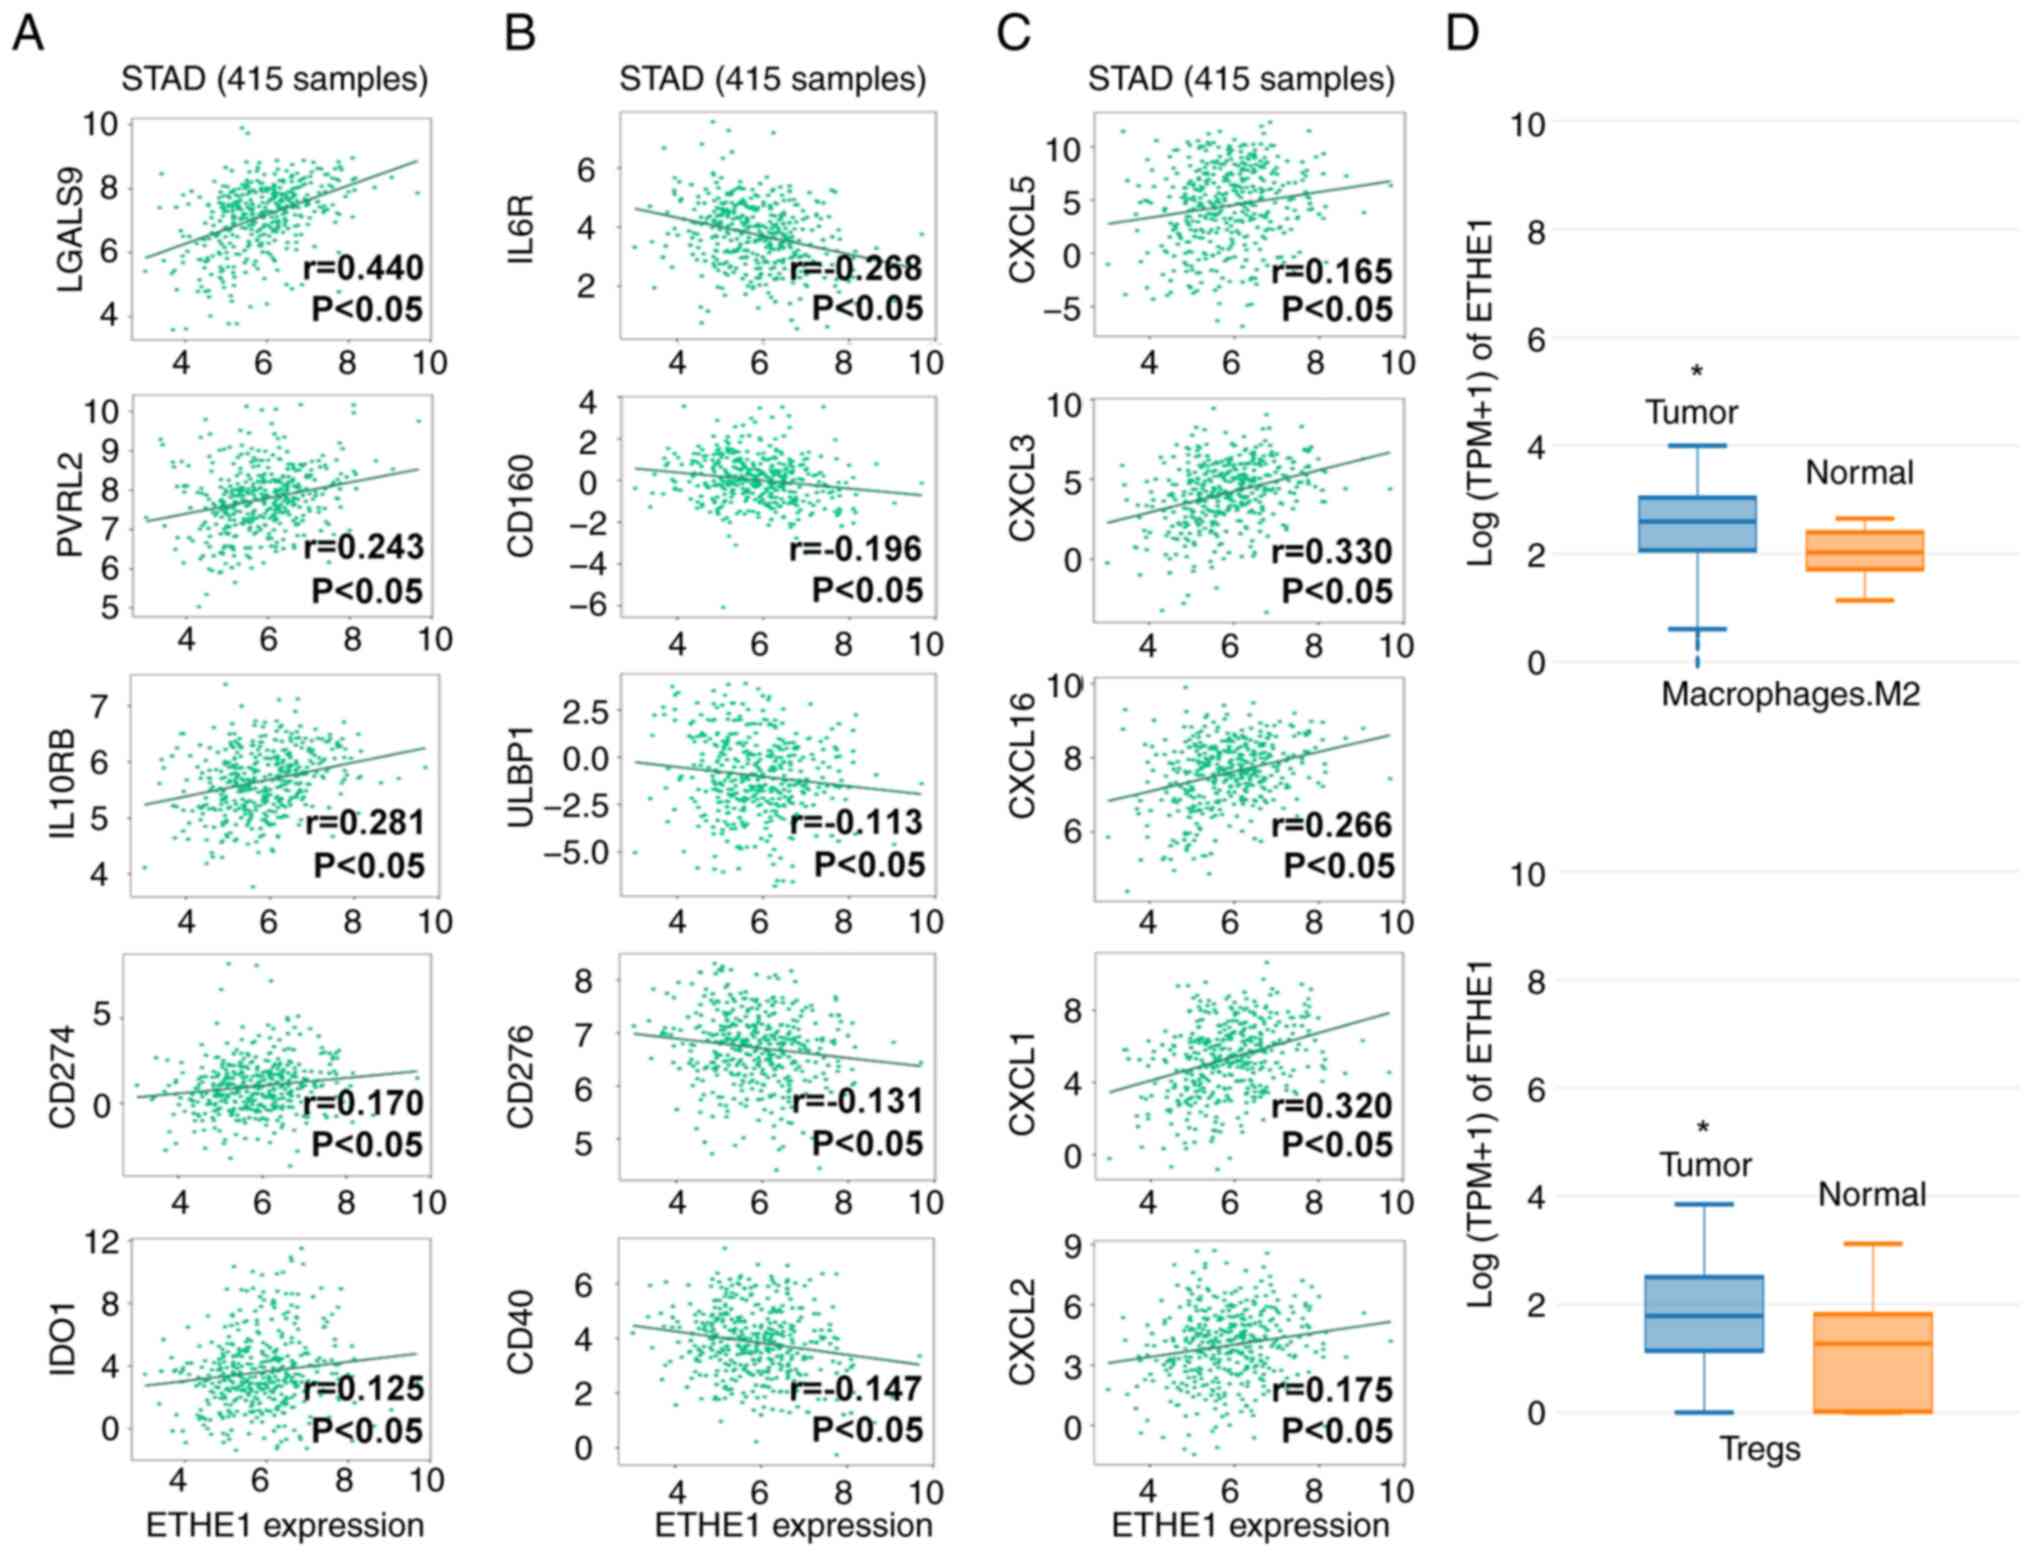 | Figure 7.Analysis of ETHE1 expression in
immune regulation of STAD. Correlation analysis of ETHE1 with (A)
immunosuppressive factors, (B) immune-promoting factors and (C)
chemokines in STAD using the TISIDB database. (D) Expression of
ETHE1 in M2 macrophages and Tregs in STAD tissues from using Gene
Expression Profiling Interactive Analysis database. *P<0.05 vs.
Normal. CXCL, C-X-C motif chemokine ligand; ETHEI, ethylmalonic
encephalopathy protein 1; IDO1, indoleamine 2,3-dioxygenase 1;
IL6R, IL-6 receptor; IL10RB, IL-10 receptor subunit β; LGALS9,
galectin 9; PVRL2, nectin cell adhesion molecule 2; STAD, stomach
adenocarcinoma; Tregs, regulatory T cells; ULBP1, UL16 binding
protein 1. |
Discussion
The high prevalence and mortality rate of GAC
highlights a need to investigate the underlying molecular
mechanisms. The results of the clinical sample analysis in the
present study showed that ETHE1 expression was upregulated in GAC
tissues, which was supported by the pan-cancer analysis from TCGA
and GTEx, as well as ETHE1 expression in samples from the HPA.
ETHE1 expression was associated with tumor stage, lymph node
metastasis and TNM stage. Therefore, high ETHE1 expression may be
predictive of a worse survival time, and it may serve a role in the
pathogenesis and progression of GAC. Therefore, the regulation of
tumorigenic behaviors by ETHE1 in GAC cells was assessed in the
present study.
Compared with in control cells, ETHE1 knockdown
reduced cyclin D1 and CDK4 levels in GAC cells. This resulted in a
decrease in the number of cells in the S phase and an increase in
the number of cells in the G1 phase, ultimately
inhibiting the proliferation of GAC cells. It has previously been
reported that ETHE1 deficiency does not affect the cell cycle of
fibroblasts, which may be attributed to differences in cell types
and the specific molecular mechanisms (17). It has also been suggested that ETHE1
serves a distinct role in tumor cells compared with in normal cells
(15). In the present study, in
GAC, ETHE1 was shown to exhibit a pronounced effect in promoting
cell proliferation, which is worthy of further attention. In
contrast to cell proliferation, inducing apoptosis is an effective
means of preventing cancer progression (24). It has previously been reported that
overexpression of ETHE1 can inhibit the apoptosis of hepatoma cells
(25). In the present study,
knockdown of ETHE1 significantly enhanced caspase-3 and caspase-9
activity, thereby promoting the apoptosis of GAC cells.
The present study showed that knockdown of ETHE1
reduced proliferation and enhanced apoptosis of GAC cells,
indicating that ETHE1 expression may promote the development of
GAC. Multiple studies have shown that ETHE1 is a mitochondrial
protein involved in regulating mitochondrial dynamics. Impaired
mitochondrial respiration in ethylmalonic encephalopathy is induced
by a mutation in the ETHE1 gene, and ETHE1-deficient mice induced
by acute depleted uranium have been shown to exhibit severe
mitochondrial dysfunction (16). In
a previous study, the mitochondrial protein expression profile of
patients with ETHE1 deficiency was shown to be altered, primarily
involving pathways such as oxidative phosphorylation and pyruvate
metabolism (26), which may be
closely related to the tumor microenvironment (TME). Increased
glycolysis in cancer cells and the resulting high-lactic acid
environment promote tumor growth (27–29).
Previous studies have shown that upregulated expression of ETHE1
increases aerobic glycolysis in colorectal cancer cell lines,
driving the growth of colorectal cancer tumors (15). In the present study, the expression
of GLUT1, LDHA, HK2 and PKM2, and the content of glycolytic
substrates and glycolytic products were determined. ETHE1 knockdown
reduced the levels of glycolytic markers, the consumption of
glucose, and the production of lactic acid and ATP. These results
suggested that the knockdown of ETHE1 prevented glucose uptake and
aerobic glycolysis in GAC cells; this may have reduced the energy
supply to GAC cells and restrained tumor growth. ETHE1 knockdown
also suppressed tumor growth in vivo. Taken together, it was
shown that ETHE1 may be a key factor in regulating aerobic
glycolysis in GAC cells, and ETHE1 knockdown effectively inhibited
GAC glycolysis, in turn reducing tumor proliferation and increasing
tumor cell apoptosis.
Analysis of data from the TISIDB database revealed
that the expression of ETHE1 was correlated with the expression of
multiple immunomodulatory genes. LGALS9 is a pro-survival factor
that induces immune escape by inhibiting immune responses
controlled by T and NK cells (30).
PVRL2 also inhibits anti-tumor immunity led by T cells NK cells
(31). IL10RB is a receptor for
IL-10, that mediates the inhibition of IL-10 on the antigen
presentation of monocytes (32).
CD274 (PD-L1) is a key immune checkpoint protein that binds to PD-1
on T cells, leading to tumor immune escape (33). IDO1 catalyzes the production of
kynurenine, an agonist of the endogenous aryl hydrocarbon receptor,
activating it, and contributing to immunosuppression and tumor
immune escape (34). ETHE1
expression was positively correlated with the aforementioned
immunosuppressive factors, suggesting the potential role of ETHE1
in tumor development.
IL-6 promotes T-cell proliferation after stimulation
by T-cell receptors, and IL6R is a receptor that mediates IL-6
signal transduction (35). CD160 is
an important NK cell-activating receptor that is expressed in
CD8+T cells (36,37).
Notably, there has been reported to be an increase in
CD160+ cells in the tumor tissues of patients with GC
undergoing immunotherapy (38).
ULBP1 is a ligand of the killer cell lectin like receptor k1
receptor, and the malignant phenotype of GC cells is enhanced
following ULBP1 downregulation (39). CD276 (B7-H3) induces T-cell
proliferation and IFN-γ production through a non-costimulatory
pathway, and CD276 has been shown to be positively associated with
the prognosis of patients with GC (40). CD40 is a member of the tumor
necrosis factor receptor superfamily and is widely expressed in
immune cells (41); activation of
CD40 allows dendritic cells to promote T-cell activation and
induces macrophages to destroy the tumor matrix (42). Notably, in the present study ETHE1
expression was negatively correlated with these immune-promoting
factors, suggesting that targeting ETHE1 may promote antitumor
immunity.
Chemokines bind to their cell surface receptors in
immune responses, thereby promoting receptor internalization and
signaling (43). The receptor of
CXCL5, CXCL3, CXCL1 and CXCL2 is C-X-C motif chemokine receptor
(CXCR)1, and the receptor of CXCL16 is CXCR6. Notably, activation
of CXCR1 and CXCR6 can promote the malignant phenotype of GC cells
(44,45). In the current study, ETHE1
expression was positively correlated with CXCL5, CXCL3, CXCL1,
CXCL2 and CXCL16, suggesting that the molecular mechanisms involved
in ETHE1-induced GAC development may involve chemokine signaling
pathways.
Tregs are important sources of immunosuppressive
factors. In the TME, Tregs are induced to differentiate by
conventional T cells; they inhibit antitumor immunity and thus
promote tumor development (46).
Furthermore, increased Treg infiltration is associated with a poor
prognosis in patients with GC (47). Macrophages are the most abundant
population of innate immune cells recruited to tumor immune sites,
and they tend to be more polarized toward the M2 phenotype in the
TME (48). In addition, patients
with GC with low levels of infiltration of M2 macrophages have a
better prognosis (49). Through
analysis of data obtained from TCGA using the GEPIA database, it
was revealed that the expression of ETHE1 in Tregs and M2
macrophages in STAD was significantly higher than that in Tregs and
M2 macrophages in normal tissues. Thus, targeting ETHE1 alongside
immunotherapy may improve outcomes for patients with GC.
The results of the present study indicated that
ETHE1 expression was upregulated in GAC tissues. Furthermore, its
expression levels showed a positive association with tumor stage,
lymph node metastasis and TNM classification. Knockdown of ETHE1
inhibited the GAC glycolytic process, leading to the suppression of
proliferation and the promotion of apoptosis of tumor cells in
vivo and in vitro. The current study primarily focused
on the effect of ETHE1 on tumor growth in GAC, but ETHE1 may not be
limited to this. It has been reported that overexpression of ETHE1
promotes metastasis of triple-negative breast cancer, rather than
tumor growth (14). ETHE1 may thus
serve different roles in different types of cancer, and its role in
GAC metastasis requires further exploration.
In conclusion, the knockdown of ETHE1 reduced tumor
cell proliferation and promoted tumor cell apoptosis by inhibiting
GAC cell aerobic glycolysis.
Supplementary Material
Supporting Data
Acknowledgements
Not applicable.
Funding
This research was funded by the Beijing Medical Award Foundation
(grant no. YXJL-2020-1152-0161).
Availability of data and materials
The data generated in the present study may be
requested from the corresponding author.
Authors' contributions
FFL conceptualized the present study, designed and
carried out the experiments, analyzed the data and wrote the
original draft. XD designed and carried out the experiment,
analyzed the data and wrote the original draft. MH and XYF carried
out the experiments, analyzed the data, provided the materials and
generated the figures. CMJ conceptualized the present study,
reviewed and edited the manuscript, and supervised this work. MH
and XYF confirm the authenticity of all the raw data. All authors
read and approved the final version of the manuscript.
Ethics approval and consent to
participate
All the specimens were collected under a protocol
approved by the Ethics Committee of The Second Hospital of Dalian
Medical University (2023; approval no. 136). Each patient
participated after providing written informed consent. The study
was performed in accordance with The Declaration of Helsinki. All
animal experiments have been approved by the Animal Care and
Welfare Committee of Dalian Medical University (approval no.
AEE23074).
Patient consent for publication
Not applicable.
Competing interests
The authors declare that they have no competing
interests.
References
|
1
|
Sung H, Ferlay J, Siegel RL, Laversanne M,
Soerjomataram I, Jemal A and Bray F: Global cancer statistics 2020:
GLOBOCAN estimates of incidence and mortality worldwide for 36
cancers in 185 countries. CA Cancer J Clin. 71:209–249. 2021.
View Article : Google Scholar : PubMed/NCBI
|
|
2
|
Ramezankhani R, Solhi R, Es HA, Vosough M
and Hassan M: Novel molecular targets in gastric adenocarcinoma.
Pharmacol Ther. 220:1077142021. View Article : Google Scholar : PubMed/NCBI
|
|
3
|
Smyth EC, Nilsson M, Grabsch HI, van
Grieken NC and Lordick F: Gastric cancer. Lancet. 396:635–648.
2020. View Article : Google Scholar : PubMed/NCBI
|
|
4
|
Ganapathy-Kanniappan S and Geschwind JF:
Tumor glycolysis as a target for cancer therapy: Progress and
prospects. Mol Cancer. 12:1522013. View Article : Google Scholar : PubMed/NCBI
|
|
5
|
Ngo DC, Ververis K, Tortorella SM and
Karagiannis TC: Introduction to the molecular basis of cancer
metabolism and the Warburg effect. Mol Biol Rep. 42:819–823. 2015.
View Article : Google Scholar : PubMed/NCBI
|
|
6
|
Liberti MV and Locasale JW: The Warburg
effect: How does it benefit cancer cells? Trends Biochem Sci.
41:211–218. 2016. View Article : Google Scholar : PubMed/NCBI
|
|
7
|
Huber V, Camisaschi C, Berzi A, Ferro S,
Lugini L, Triulzi T, Tuccitto A, Tagliabue E, Castelli C and
Rivoltini L: Cancer acidity: An ultimate frontier of tumor immune
escape and a novel target of immunomodulation. Semin Cancer Biol.
43:74–89. 2017. View Article : Google Scholar : PubMed/NCBI
|
|
8
|
Dhup S, Dadhich RK, Porporato PE and
Sonveaux P: Multiple biological activities of lactic acid in
cancer: Influences on tumor growth, angiogenesis and metastasis.
Curr Pharm Des. 18:1319–1330. 2012. View Article : Google Scholar : PubMed/NCBI
|
|
9
|
Ren Z, Rajani C and Jia W: The distinctive
serum metabolomes of gastric, esophageal and colorectal cancers.
Cancers (Basel). 13:7202021. View Article : Google Scholar : PubMed/NCBI
|
|
10
|
Chan AW, Gill RS, Schiller D and Sawyer
MB: Potential role of metabolomics in diagnosis and surveillance of
gastric cancer. World J Gastroenterol. 20:12874–12882. 2014.
View Article : Google Scholar : PubMed/NCBI
|
|
11
|
Han S, Yang S, Cai Z, Pan D, Li Z, Huang
Z, Zhang P, Zhu H, Lei L and Wang W: Anti-Warburg effect of
rosmarinic acid via miR-155 in gastric cancer cells. Drug Des Devel
Ther. 9:2695–2703. 2015.PubMed/NCBI
|
|
12
|
Wang YY, Zhou YQ, Xie JX, Zhang X, Wang
SC, Li Q, Hu LP, Jiang SH, Yi SQ, Xu J, et al: MAOA suppresses the
growth of gastric cancer by interacting with NDRG1 and regulating
the Warburg effect through the PI3K/AKT/mTOR pathway. Cell Oncol
(Dordr). 46:1429–1444. 2023. View Article : Google Scholar : PubMed/NCBI
|
|
13
|
Holdorf MM, Owen HA, Lieber SR, Yuan L,
Adams N, Dabney-Smith C and Makaroff CA: Arabidopsis ETHE1 encodes
a sulfur dioxygenase that is essential for embryo and endosperm
development. Plant Physiol. 160:226–236. 2012. View Article : Google Scholar : PubMed/NCBI
|
|
14
|
Yang SY, Liao L, Hu SY, Deng L, Andriani
L, Zhang TM, Zhang YL, Ma XY, Zhang FL, Liu YY and Li DQ: ETHE1
accelerates triple-negative breast cancer metastasis by activating
GCN2/eIF2α/ATF4 signaling. Int J Mol Sci. 24:145662023. View Article : Google Scholar : PubMed/NCBI
|
|
15
|
Witherspoon M, Sandu D, Lu C, Wang K,
Edwards R, Yeung A, Gelincik O, Manfredi G, Gross S, Kopelovich L
and Lipkin S: ETHE1 overexpression promotes SIRT1 and PGC1α
mediated aerobic glycolysis, oxidative phosphorylation,
mitochondrial biogenesis and colorectal cancer. Oncotarget.
10:4004–4017. 2019. View Article : Google Scholar : PubMed/NCBI
|
|
16
|
Liu S, Wang S, Zhao Y, Li J, Shu C, Li Y,
Li J, Lu B, Xu Z, Ran Y and Hao Y: Depleted uranium causes renal
mitochondrial dysfunction through the ETHE1/Nrf2 pathway. Chem Biol
Interact. 372:1103562023. View Article : Google Scholar : PubMed/NCBI
|
|
17
|
Sahebekhtiari N, Fernandez-Guerra P, Nochi
Z, Carlsen J, Bross P and Palmfeldt J: Deficiency of the
mitochondrial sulfide regulator ETHE1 disturbs cell growth,
glutathione level and causes proteome alterations outside
mitochondria. Biochim Biophys Acta Mol Basis Dis. 1865:126–135.
2019. View Article : Google Scholar : PubMed/NCBI
|
|
18
|
Oue N, Hamai Y, Mitani Y, Matsumura S,
Oshimo Y, Aung PP, Kuraoka K, Nakayama H and Yasui W: Gene
expression profile of gastric carcinoma: Identification of genes
and tags potentially involved in invasion, metastasis, and
carcinogenesis by serial analysis of gene expression. Cancer Res.
64:2397–2405. 2004. View Article : Google Scholar : PubMed/NCBI
|
|
19
|
Yasui W, Oue N, Ito R, Kuraoka K and
Nakayama H: Search for new biomarkers of gastric cancer through
serial analysis of gene expression and its clinical implications.
Cancer Sci. 95:385–392. 2004. View Article : Google Scholar : PubMed/NCBI
|
|
20
|
Tang Z, Li C, Kang B, Gao G, Li C and
Zhang Z: GEPIA: A web server for cancer and normal gene expression
profiling and interactive analyses. Nucleic Acids Res. 45:W98–W102.
2017. View Article : Google Scholar : PubMed/NCBI
|
|
21
|
Ru B, Wong CN, Tong Y, Zhong JY, Zhong
SSW, Wu WC, Chu KC, Wong CY, Lau CY, Chen I, et al: TISIDB: An
integrated repository portal for tumor-immune system interactions.
Bioinformatics. 35:4200–4202. 2019. View Article : Google Scholar : PubMed/NCBI
|
|
22
|
Guidelines for Endpoints in Animal Study
Proposals, . Animal Research Advisory Committee NIH (ed.);
|
|
23
|
Livak KJ and Schmittgen TD: Analysis of
relative gene expression data using real-time quantitative PCR and
the 2(−Delta Delta C(T)) method. Methods. 25:402–408. 2001.
View Article : Google Scholar : PubMed/NCBI
|
|
24
|
Gong Y, Fan Z, Luo G, Yang C, Huang Q, Fan
K, Cheng H, Jin K, Ni Q, Yu X and Liu C: The role of necroptosis in
cancer biology and therapy. Mol Cancer. 18:1002019. View Article : Google Scholar : PubMed/NCBI
|
|
25
|
Higashitsuji H, Higashitsuji H, Nagao T,
Nonoguchi K, Fujii S, Itoh K and Fujita J: A novel protein
overexpressed in hepatoma accelerates export of NF-kappa B from the
nucleus and inhibits p53-dependent apoptosis. Cancer Cell.
2:335–346. 2002. View Article : Google Scholar : PubMed/NCBI
|
|
26
|
Sathe G, Deepha S, Gayathri N, Nagappa M,
Sankaran BP, Taly AB, Khanna T, Pandey A and Govindaraj P:
Ethylmalonic encephalopathy ETHE1 p. D165H mutation alters the
mitochondrial function in human skeletal muscle proteome.
Mitochondrion. 58:64–71. 2021. View Article : Google Scholar : PubMed/NCBI
|
|
27
|
Watson MJ, Vignali PDA, Mullett SJ,
Overacre-Delgoffe AE, Peralta RM, Grebinoski S, Menk AV,
Rittenhouse NL, DePeaux K, Whetstone RD, et al: Metabolic support
of tumour-infiltrating regulatory T cells by lactic acid. Nature.
591:645–651. 2021. View Article : Google Scholar : PubMed/NCBI
|
|
28
|
Brand A, Singer K, Koehl GE, Kolitzus M,
Schoenhammer G, Thiel A, Matos C, Bruss C, Klobuch S, Peter K, et
al: LDHA-Associated lactic acid production blunts tumor
immunosurveillance by T and NK cells. Cell Metab. 24:657–671. 2016.
View Article : Google Scholar : PubMed/NCBI
|
|
29
|
Sonveaux P, Végran F, Schroeder T, Wergin
MC, Verrax J, Rabbani ZN, De Saedeleer CJ, Kennedy KM, Diepart C,
Jordan BF, et al: Targeting lactate-fueled respiration selectively
kills hypoxic tumor cells in mice. J Clin Invest. 118:3930–3942.
2008.PubMed/NCBI
|
|
30
|
Yıldırım C: Galectin-9, a pro-survival
factor inducing immunosuppression, leukemic cell transformation and
expansion. Mol Biol Rep. 51:5712024. View Article : Google Scholar : PubMed/NCBI
|
|
31
|
Murakami K and Ganguly S: The Nectin
family ligands, PVRL2 and PVR, in cancer immunology and
immunotherapy. Front Immunol. 15:14417302024. View Article : Google Scholar : PubMed/NCBI
|
|
32
|
Saraiva M, Vieira P and O'Garra A: Biology
and therapeutic potential of interleukin-10. J Exp Med.
217:e201904182020. View Article : Google Scholar : PubMed/NCBI
|
|
33
|
Gou Q, Dong C, Xu H, Khan B, Jin J, Liu Q,
Shi J and Hou Y: PD-L1 degradation pathway and immunotherapy for
cancer. Cell Death Dis. 11:9552020. View Article : Google Scholar : PubMed/NCBI
|
|
34
|
Cheong JE and Sun L: Targeting the
IDO1/TDO2-KYN-AhR pathway for cancer immunotherapy-challenges and
opportunities. Trends Pharmacol Sci. 39:307–325. 2018. View Article : Google Scholar : PubMed/NCBI
|
|
35
|
Fisher DT, Appenheimer MM and Evans SS:
The two faces of IL-6 in the tumor microenvironment. Semin Immunol.
26:38–47. 2014. View Article : Google Scholar : PubMed/NCBI
|
|
36
|
Zhang L, Zhang A, Zhu X, Tian X, Guo J, He
Q, Zhu L, Yuan S, Zhao C, Zhang X and Xu J: CD160 signaling is
essential for CD8+ T cell memory formation via upregulation of
4-1BB. J Immunol. 211:1367–1375. 2023. View Article : Google Scholar : PubMed/NCBI
|
|
37
|
Le Bouteiller P, Tabiasco J, Polgar B,
Kozma N, Giustiniani J, Siewiera J, Berrebi A, Aguerre-Girr M,
Bensussan A and Jabrane-Ferrat N: CD160: A unique activating NK
cell receptor. Immunol Lett. 138:93–96. 2011. View Article : Google Scholar : PubMed/NCBI
|
|
38
|
Wang J, Liang Y, Xue A, Xiao J, Zhao X,
Cao S, Li P, Dong J, Li Y, Xu Z and Yang L: Intratumoral CXCL13(+)
CD160(+) CD8(+) T cells promote the formation of tertiary lymphoid
structures to enhance the efficacy of immunotherapy in advanced
gastric cancer. J Immunother Cancer. 12:e0096032024. View Article : Google Scholar : PubMed/NCBI
|
|
39
|
Hu B, Tian X and Li Y, Liu Y, Yang T, Han
Z, An J, Kong L and Li Y: Epithelial-mesenchymal transition may be
involved in the immune evasion of circulating gastric tumor cells
via downregulation of ULBP1. Cancer Med. 9:2686–2697. 2020.
View Article : Google Scholar : PubMed/NCBI
|
|
40
|
Wu CP, Jiang JT, Tan M, Zhu YB, Ji M, Xu
KF, Zhao JM, Zhang GB and Zhang X: Relationship between
co-stimulatory molecule B7-H3 expression and gastric carcinoma
histology and prognosis. World J Gastroenterol. 12:457–459. 2006.
View Article : Google Scholar : PubMed/NCBI
|
|
41
|
Guo J, Xiao JJ, Zhang X and Fan KX: CD40
expression and its prognostic significance in human gastric
carcinoma. Med Oncol. 32:632015. View Article : Google Scholar : PubMed/NCBI
|
|
42
|
Vonderheide RH: CD40 agonist antibodies in
cancer immunotherapy. Annu Rev Med. 71:47–58. 2020. View Article : Google Scholar : PubMed/NCBI
|
|
43
|
Balkwill FR: The chemokine system and
cancer. J Pathol. 226:148–157. 2012. View Article : Google Scholar : PubMed/NCBI
|
|
44
|
Wang J, Hu W, Wu X, Wang K, Yu J, Luo B,
Luo G, Wang W, Wang H, Li J and Wen J: CXCR1 promotes malignant
behavior of gastric cancer cells in vitro and in vivo in AKT and
ERK1/2 phosphorylation. Int J Oncol. 48:2184–2196. 2016. View Article : Google Scholar : PubMed/NCBI
|
|
45
|
Han J, Fu R, Chen C, Cheng X, Guo T,
Huangfu L, Li X, Du H, Xing X and Ji J: CXCL16 promotes gastric
cancer tumorigenesis via ADAM10-Dependent CXCL16/CXCR6 axis and
activates akt and mapk signaling pathways. Int J Biol Sci.
17:2841–2852. 2021. View Article : Google Scholar : PubMed/NCBI
|
|
46
|
Li C, Jiang P, Wei S, Xu X and Wang J:
Regulatory T cells in tumor microenvironment: New mechanisms,
potential therapeutic strategies and future prospects. Mol Cancer.
19:1162020. View Article : Google Scholar : PubMed/NCBI
|
|
47
|
Qu Y, Wang X, Bai S, Niu L, Zhao G, Yao Y,
Li B and Li H: The effects of TNF-α/TNFR2 in regulatory T cells on
the microenvironment and progression of gastric cancer. Int J
Cancer. 150:1373–1391. 2022. View Article : Google Scholar : PubMed/NCBI
|
|
48
|
Zhang Q and Sioud M: Tumor-associated
macrophage subsets: Shaping polarization and targeting. Int J Mol
Sci. 24:74932023. View Article : Google Scholar : PubMed/NCBI
|
|
49
|
Wu Y, Hao Y, Zhuang Q, Ma X and Shi C:
AKR1B10 regulates M2 macrophage polarization to promote the
malignant phenotype of gastric cancer. Biosci Rep.
43:BSR202220072023. View Article : Google Scholar : PubMed/NCBI
|