Introduction
Lung cancer is a globally prevalent malignant tumor
and one of the most common causes of cancer-associated mortality.
Lung cancer is classified into two main types: Non-small cell lung
cancer (NSCLC) and small cell lung cancer, with NSCLC comprising
~85% of all cases (1). Among the
different subtypes of NSCLC, lung adenocarcinoma (LUAD) has the
highest incidence and prevalence. However, despite significant
advances in surgery, chemotherapy and targeted therapy, the
prognosis for patients with LUAD remains poor (2). Therefore, it is particularly urgent to
develop reasonable treatment strategies to improve the therapeutic
effect of lung adenocarcinoma. The invasion and metastasis of
tumors is a complex regulatory process influenced by multiple
factors, such as the activation of oncogenes, the inactivation of
tumor suppressor genes and mutations in signaling pathways
(3,4). Discovering molecular biological
markers associated with lung adenocarcinoma not only helps to
deepen the understanding of the disease, but also may provide
guidance for the future diagnosis and treatment of lung
adenocarcinoma.
The coagulation system is an inherent defense
mechanism of the human body, which can be activated through the
tissue factor pathway (extrinsic pathway) or the intrinsic pathway.
Tumor cells express procoagulant factors, including tissue factor,
which triggers the coagulation cascade and ultimately leads to the
generation of thrombin (5). The
activation of this coagulation and fibrinolysis system promotes the
invasion, metastasis and angiogenesis of malignant tumor cells
(6). Patients with malignant tumors
often exhibit a hypercoagulable state, and have a higher risk of
cancer-related thrombosis than healthy individuals (7), including deep vein thrombosis and
pulmonary thromboembolism, which significantly reduces the survival
rate and prognosis of patients (8).
A large amount of experimental evidence supports that patients with
malignant tumors often remain in a state of chronic
hypercoagulability and hyperfibrinolysis, which is the main cause
of the increased risk of thrombosis and bleeding (6). In particular, the prognosis of
patients with cancer is closely related to the effectiveness of
anticoagulant therapy. Specifically, patients with a better
prognosis have an extended survival period after receiving
anticoagulant treatment (9). The
association between biomarkers related to coagulation disorders and
the prognosis of various cancer types has previously been reported
(10). The role of the coagulation
cascade in the formation of the tumor microenvironment (TME) has
also been emphasized in research (11). Although the associations between the
coagulation system and multiple types of tumors, such as cutaneous
melanoma (12), gastric cancer
(13) and hepatocellular carcinoma
(14), have been confirmed, the
precise role of the coagulation system in LUAD has yet to be
elucidated.
The present study aimed to develop a specific
coagulation-related gene (CRG) prognostic model for LUAD, and to
offer novel insights and approaches for the prognostic assessment,
immune analysis and therapy of this disease. This model is intended
to facilitate the investigation of tumor prognosis, immune cell
infiltration, genetic mutations, tumor mutation burden (TMB) and
drug responses.
Materials and methods
Data collection
LUAD transcriptome data and associated clinical
information were sourced from The Cancer Genome Atlas (TCGA)
official data portal (https://gdc portal.nci.nih.gov/). The dataset included
582 samples, comprising 524 tumor samples and 58 normal tissue
samples. Following initial data screening, samples with missing or
zero prognostic information were excluded, resulting in the
selection of 507 tumor samples and 58 normal tissue samples for
detailed analysis.
Acquisition of CRGs in LUAD
A total of 138 CRGs were extracted from the
Molecular Signatures database (MsigDB; http://www.gsea-msigdb.org/gsea/msigdb) (Table SI). Differentially expressed genes
(DEGs) were identified using the limma package (version 3.54.2) in
R (https://cran.r-project.org) with gene
set normalization applied. The screening criteria were set to an
absolute value of the log2 fold change
(|log2FC|)>1.5 and adjusted P<0.05. The DEGs were
identified by comparing normal lung tissue samples with LUAD tissue
samples from TCGA database. The DEGs were visualized using the
ggplot2 package (version 3.4.2) and plotted as volcano plots.
Comparative analysis was performed to identify coagulation-related
DEGs specific to LUAD.
Enrichment analysis
Following the identification of differentially
expressed CRGs, enrichment analysis was performed using the
clusterProfiler package (version 4.6.2). The analyses included
three Gene Ontology (GO) categories, namely biological process
(BP), cellular component (CC) and molecular function (MF), as well
as Kyoto Encyclopedia of Genes and Genomes (KEGG) pathway analysis.
The aim of performing these analyses was to elucidate the molecular
mechanisms associated with CRGs. The criteria for statistical
significance were P<0.05 and q<0.05 in both the GO and KEGG
analyses. Additionally, gene set enrichment analysis (GSEA) was
conducted to assess model genes in high- and low-risk groups based
on risk scores, with statistical significance defined as P<0.05
and false discovery rate (FDR) <0.05.
Establishment and validation of the
CRG risk model
The survival package (version 3.5.5) was used to
identify CRGs significantly associated with overall survival (OS;
P<0.05). Univariate Cox regression analyses were performed to
calculate the hazard ratio (HR). The data from TCGA were randomly
divided into two essentially equal-sized groups: Training set
(n=254) and test set (n=253). Least absolute shrinkage and
selection operator (LASSO) regression analyses were then conducted
using the glmnet package (version 4.1.7) to refine the gene
selection. A risk model was developed using the training set data
and validated using the overall and test set data. The risk score
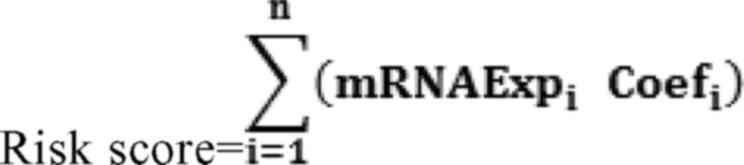
formula constructed was as follows:
The coefficient Coefi and expression
level Expri represent the Cox regression coefficient and
normalized expression level for each mRNA, respectively. Based on
the risk score, samples were divided into high- and low-risk
groups, with this stratification applied to the overall, test and
training sets. To compare OS rates, Kaplan-Meier (KM) curves were
generated using the survival package and survminer package (version
0.4.9). An analysis of progression-free survival (PFS) was also
performed. In addition, gene expression differences between the
high- and low-risk groups were visualized using the pheatmap
package (version 1.0.12) Receiver operating characteristic (ROC)
curves were constructed using the survival package, survminer
package (version 0.4.9) and timeROC package (version 0.4) to
evaluate the accuracy of the prognostic model and the 1-, 3- and
5-year survival rates. The protein expression of the four genes
included in the prognostic model was assessed in normal and LUAD
tissues using immunohistochemistry (IHC) data from the Human
Protein Atlas (HPA; http://www.proteinatlas.org/). Finally, principal
component analysis (PCA) was performed using the ggplot2 package in
R to analyze the distribution differences between high- and
low-risk groups, thereby assessing the accuracy and applicability
of the model.
Construction of nomogram
Univariate and multivariate Cox regression analyses
were performed using the survival package (version 3.5.5),
incorporating age, sex, tumor stage and TNM staging to compute risk
scores as independent risk factors. Subsequently, a nomogram was
constructed using the rms package (version 6.7.0), survcomp package
(version 1.48.0), regplot package (version 1.1) and survival
package. The accuracy of the model was further validated using
calibration curves.
Immune and TMB analyses
Initially, immune, ESTIMATE and stromal scoring was
conducted for high- and low-risk groups of LUAD using the limma
package and estimate package (version 1.0.13). CIBERSORT analysis
was then performed using the limma package, with immune cell
differences between the two groups visualized using the limma,
reshape2 package (version 1.4.4) and ggpubr package (version
0.6.0). To assess immune function differences between the two
groups, the limma GSVA package (version 1.46.0) and GSEABase
package (version 1.60.0) were used, with results visualized using
the reshape2 and ggpubr packages. Additionally, gene mutation
information was obtained from TCGA, and the mutation frequencies of
the most prevalent genes in the high- and low-risk groups were
visualized using the maftools package (version 2.14.0). TMB was
then compared between the two groups using the ggpubr and limma
packages. The analysis was performed using ‘futime’ as the time
variable and ‘fustat’ as the event variable. The variable TMB was
used to determine the cut off value; patients with a TMB value
lower than the cut off were assigned to the low TMB group, while
those with a TMB value higher than the cut off were assigned to the
high TMB group. The survival rates of these two groups are compared
to evaluate their association with risk scores. P<0.05 was
considered to indicate statistical significance.
Tumor immune dysfunction and exclusion
(TIDE) score and drug sensitivity analysis
The limma and ggpubr packages were used to visualize
differences in TIDE scores between the high- and low-risk groups.
Subsequently, drug sensitivity analysis was performed on the two
groups using the limma package, oncoPredict package (version 0.2)
and parallel package (version 4.2.2). The results of the drug
sensitivity analysis were then visualized as half-maximal
inhibitory concentration (IC50) values using the ggpubr
and ggplot2 packages.
Patients and specimens
Three pairs of LUAD samples and adjacent
non-cancerous tissues were collected from patients who underwent
curative resection between November 2024 and January 2025 at Jinan
Central Hospital (Jinan, China), including 2 female and 1 male
patient, aged between 50–70 years. All tissue samples were verified
by histopathological examination and stored in liquid nitrogen for
subsequent reverse transcription-quantitative PCR (RT-qPCR)
analysis. The inclusion criteria were as follows: i) Diagnosed with
LUAD through pathological examination; ii) had not undergone any
form of tumor treatment prior to surgery; and iii) had a complete
clinicopathological record. The study excluded patients meeting the
following criteria: i) Age <18 or >80 years; ii) pregnant or
breastfeeding; iii) had autoimmune diseases or other types of
malignancies; or iv) had received any antitumor therapy. The study
protocol was approved by the Ethics Committee of Jinan Central
Hospital (20241120026). All procedures were conducted in accordance
with applicable guidelines and regulations. All patients signed the
informed consent form.
RNA extraction and RT-qPCR
The A549 human LUAD and BEAS-2B normal human lung
epithelial cell lines were obtained from Wuhan Pricella
Biotechnology Co., Ltd. The cells were cultured in RPMI-1640 medium
(Gibco; Thermo Fisher Scientific, Inc.) supplemented with 10% fetal
bovine serum (Gibco; Thermo Fisher Scientific, Inc.) and 1%
penicillin, and maintained at 37°C with 5% CO2. The
medium was changed every 2 to 3 days. Total RNA was extracted from
the cells and tissues using TRIzol® reagent (Invitrogen;
Thermo Fisher Scientific, Inc.) and reverse transcribed into cDNA
using a reverse transcription kit (Takara Biotechnology Co., Ltd.).
The mRNA expression was quantified using RT-qPCR analysis using
10.0 µl SYBR™ Green (Hunan Accurate Bio-Medical Technology Co.,
Ltd.), 0.5 µl primer, 2 µl cDNA and 7.0 µl
diethylpyrocarbonate-treated water. The thermocycling conditions
were as follows: Initial denaturation at 95°C for 30 sec, followed
by 40 cycles of 95°C for 5 sec, 55°C for 30 sec and 72°C for 30
sec. β-actin was used as an internal control. The mRNA expression
levels were quantified using the 2−ΔΔCq method and
normalized against the expression levels of β-actin (15). Each experiment was repeated three
times. The sequences of the primers used are listed in Table I.
 | Table I.Primer sequences used for
quantitative PCR. |
Table I.
Primer sequences used for
quantitative PCR.
| Genes | Forward
(5′-3′) | (5′-3′) |
|---|
| β-actin |
CCTTCCTGGGCATGGAGTC |
TGATCTTCATTGTGCTGGGTG |
| MMP10 |
GAGTTTGACCCCAATGCCAG |
TCTTCCCCCTATCTCGCCTA |
| CTSV |
TCAGGCAGATGATGGGTTGC |
GCCCAACAAGAACCACACTG |
| F2 |
CACGGCTACGGATGTGTTCT |
AGTTCGTACCCAGACCCTCAG |
| MMP1 |
TTGCCGACAGAGATGAAGTCC |
CGTGTAGCACATTCTGTCCCT |
Statistical analysis
All statistical analyses were performed using R
software (version 4.2.2) and GraphPad_Prism (version 8.0.2;
Dotmatics). The Shapiro-Wilk test was used to assess whether the
data in the high- and low-risk groups followed a normal
distribution. The Mann-Whitney U test (Wilcoxon rank-sum test) was
used when comparing the two risk groups, as well as unpaired LUAD
and normal tissue from TCGA. Wilcoxon signed-rank analysis was used
to compare paired LUAD and normal tissues from TCGA. Differences
between paired primary tissues and between cell lines were analyzed
using paired and unpaired t-tests, respectively. The log-rank test
was employed to identify differences between KM curves. Univariate
and multivariate Cox regression analyses were performed to identify
prognostic risk factors associated with LUAD. P<0.05 was
considered to indicate a statistically significant difference.
Results
Identification of CRGs in patients
with LUAD
Fig. 1 provides an
overview of the workflow for the present study. Gene expression
data, clinical information and mutation data for patients with LUAD
were collected from TCGA. By comparing the expression of 138 known
CRGs between LUAD samples and adjacent normal tissue, 51
differentially expressed CRGs were identified (FDR <0.05, |log2
FC|>1.5), including 37 upregulated genes and 14 downregulated
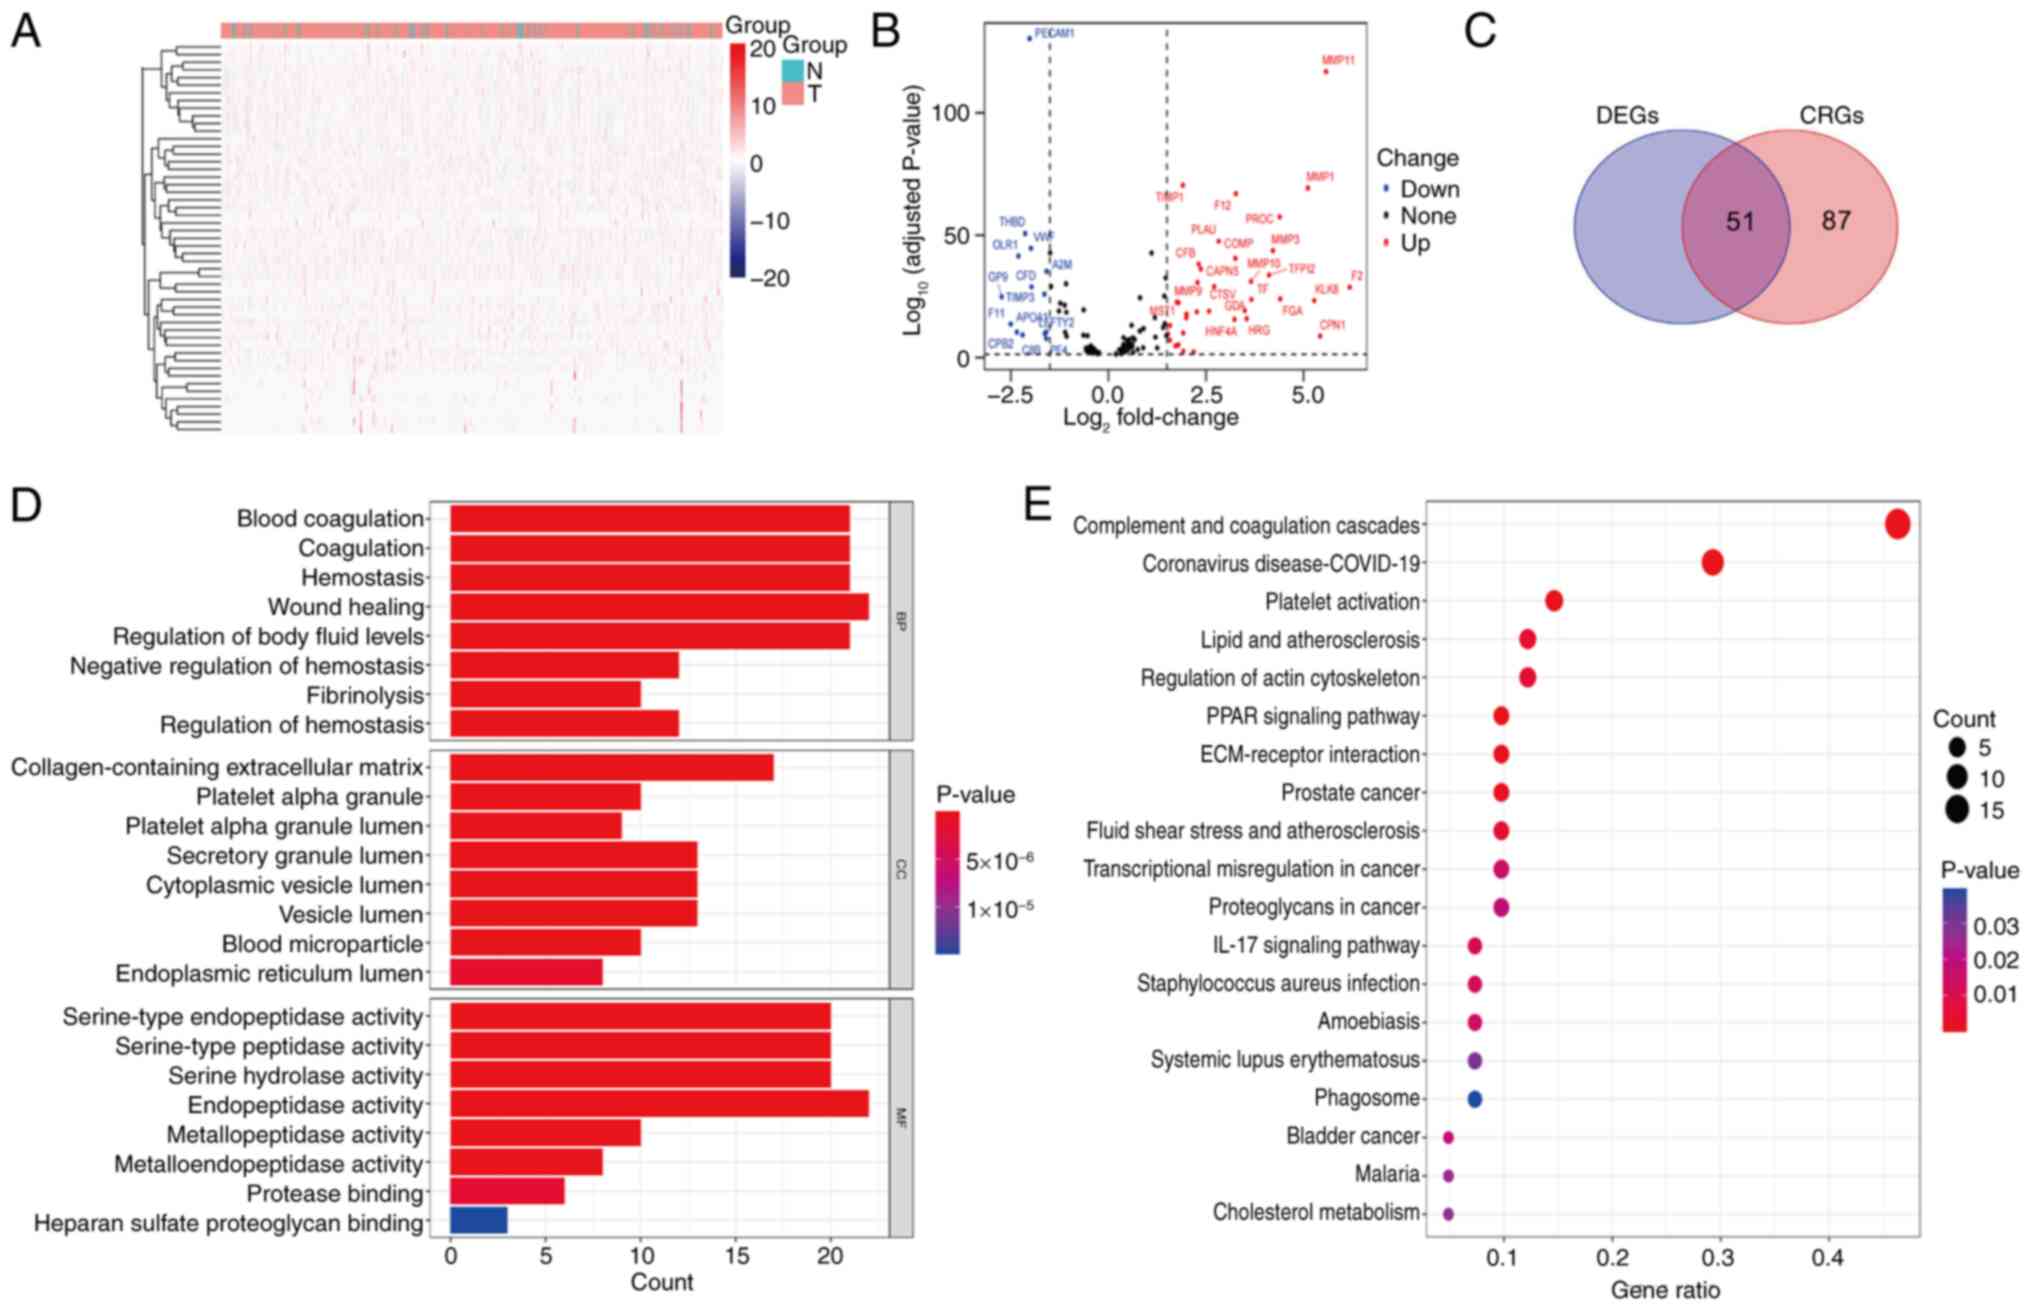
genes. Heatmaps and volcano plots were subsequently generated to
visualize the expression patterns of these genes in normal and LUAD
tissues (Fig. 2A and B). Further
analysis verified that all 51 DEGs were associated with the
coagulation process (Fig. 2C).
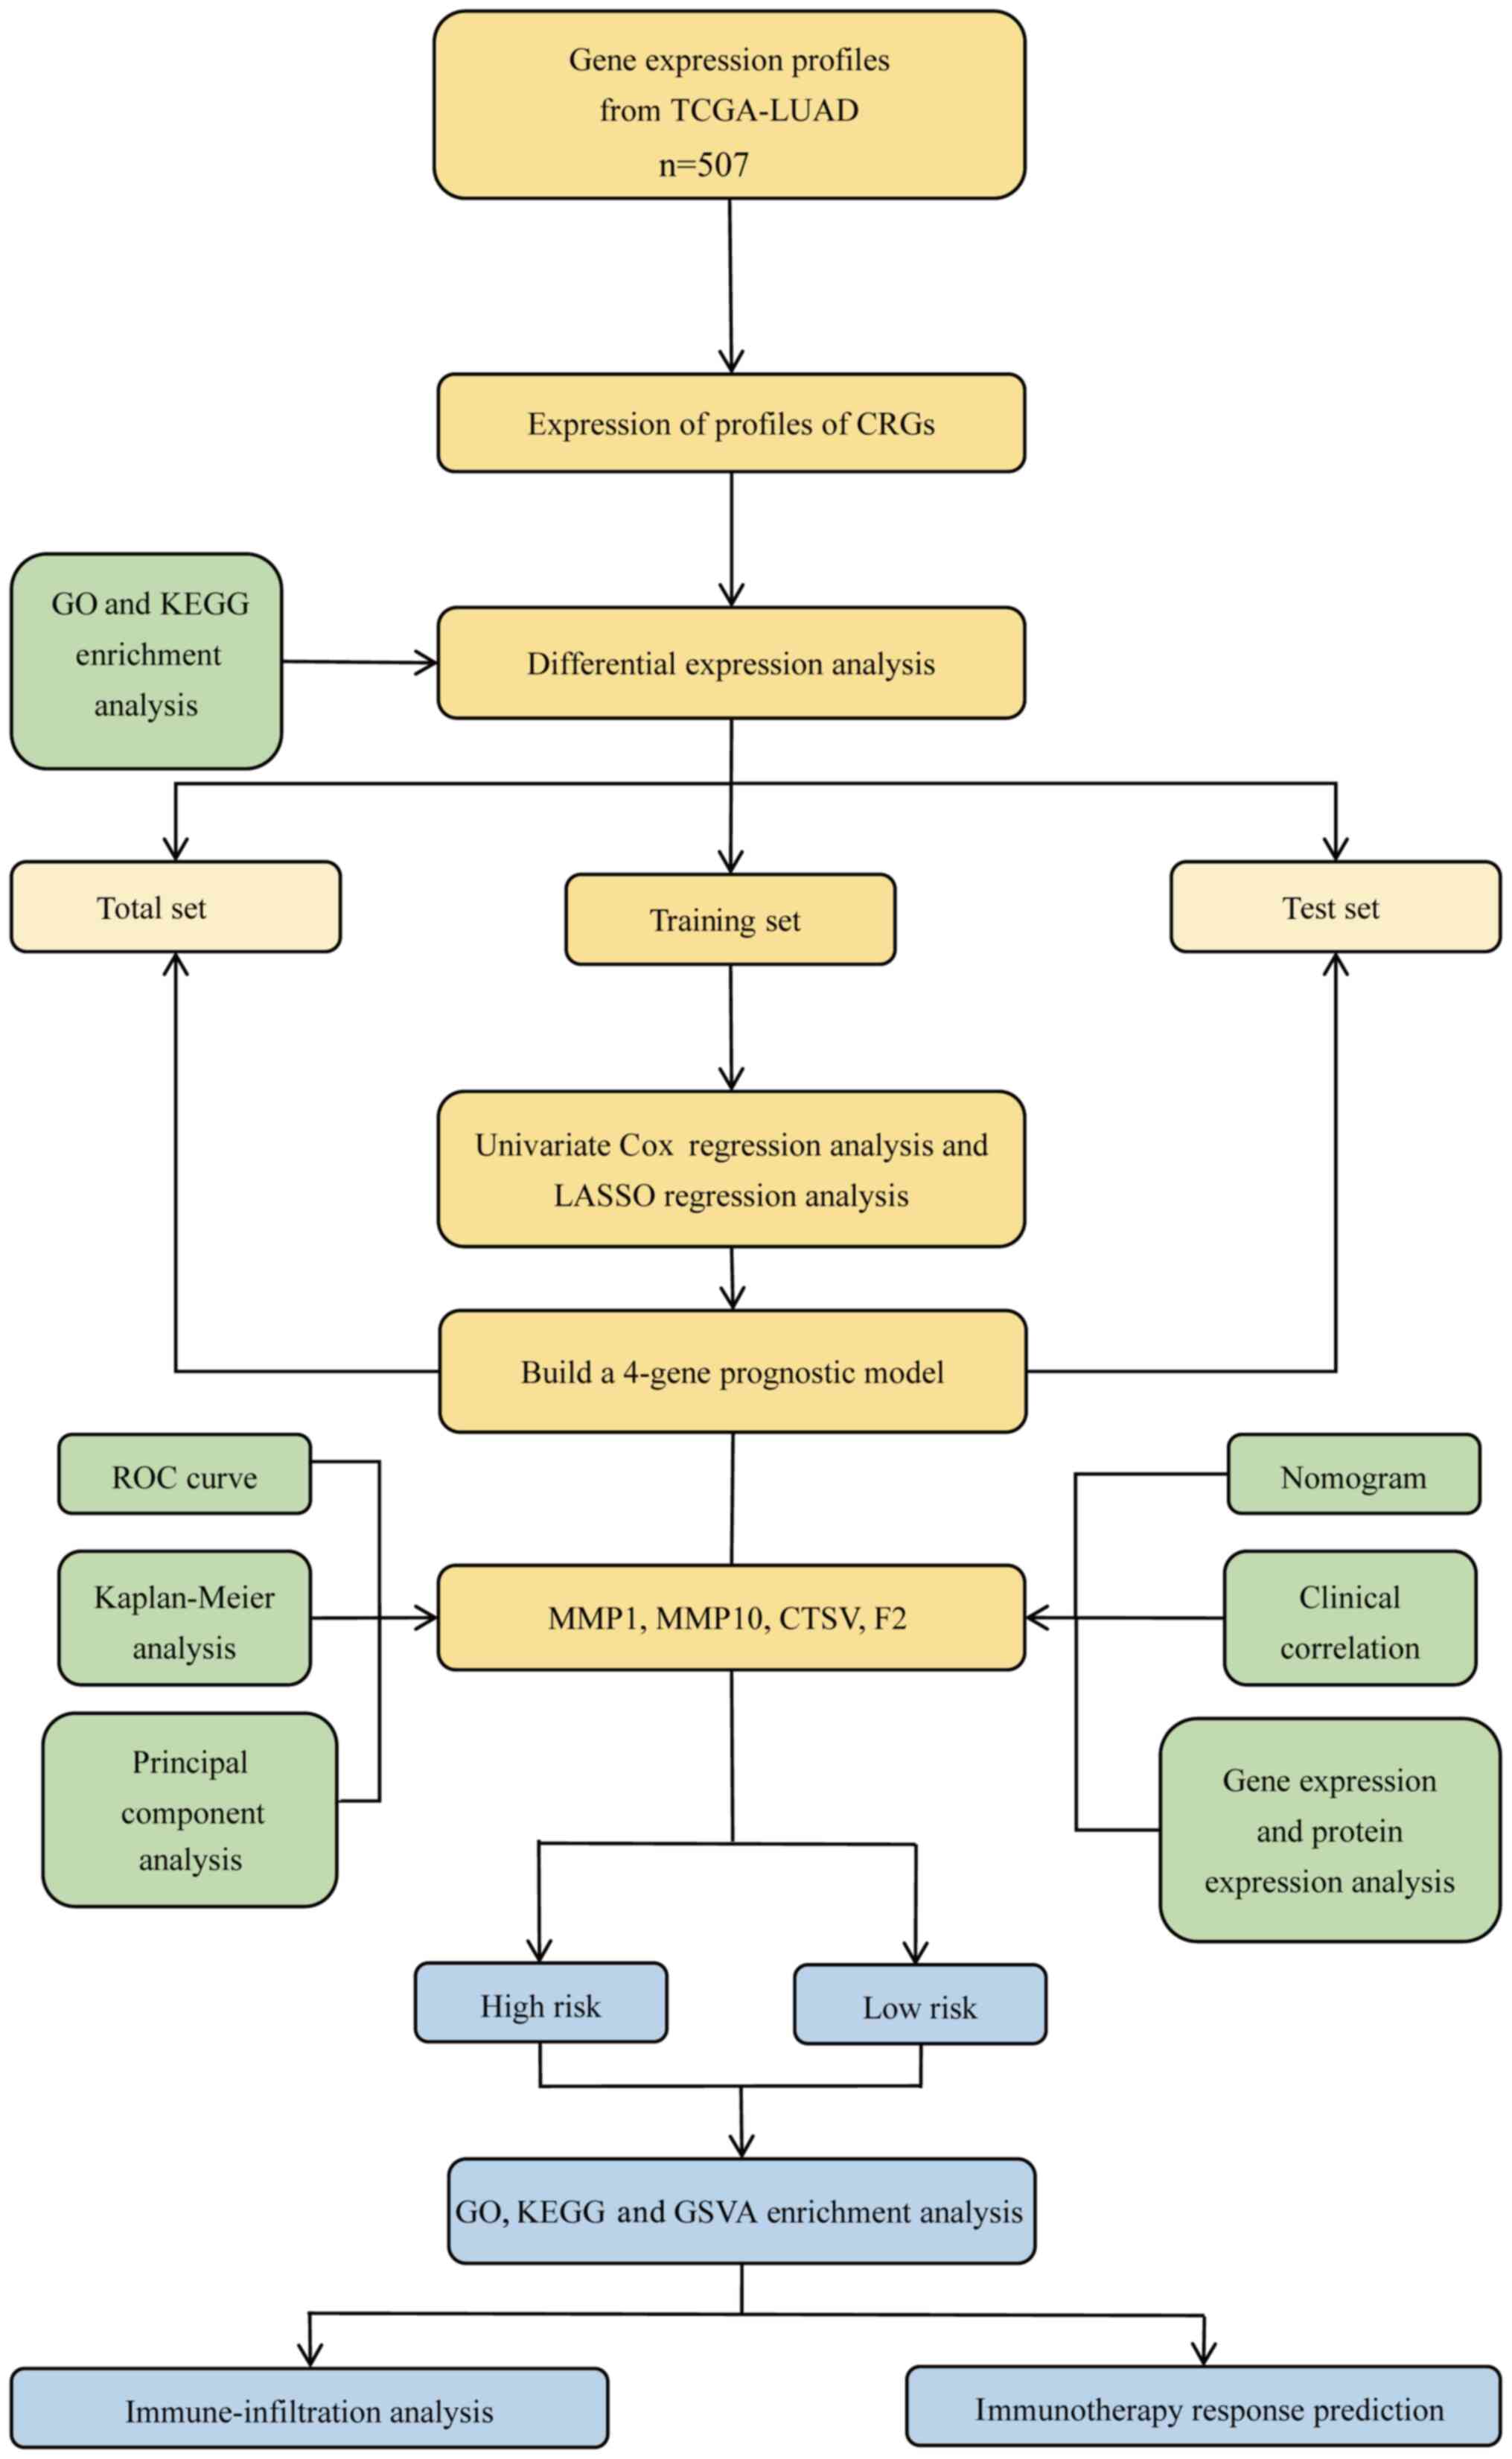 | Figure 1.Methodology flow chart. TCGA, The
Cancer Genome Atlas; LUAD, lung adenocarcinoma; CRGs,
coagulation-related genes; GO, Gene Ontology; KEGG, Kyoto
Encyclopedia of Genes and Genomes; LASSO, least absolute shrinkage
and selection operator; ROC, receiver operating characteristic;
MMP, matrix metalloproteinase; CTSV, cathepsin V; F2,
thrombin/coagulation factor II; GSVA, gene set variation
analysis. |
Enrichment analysis of CRGs
To explore the functions and potential mechanisms of
the 51 DEGs, GO analysis was performed. The results reveal a
significant enrichment of these CRGs in certain BPs, including
‘blood coagulation’, ‘coagulation’, ‘hemostasis’, ‘wound healing’
and ‘regulation of body fluid levels’. At the CC level, these genes
are predominantly enriched in ‘collagen-containing extracellular
matrix’, ‘secretory granule lumen’, ‘cytoplasmic vesicle lumen’ and
‘vesicle lumen’. In addition, MF analysis demonstrated that these
genes are closely associated with ‘serine-type endopeptidase
activity’, ‘serine-type peptidase activity’, ‘serine hydrolase
activity’ and ‘endopeptidase activity’ (Fig. 2D). KEGG analysis revealed that these
genes are significantly enriched in the ‘complement and coagulation
cascades’ pathway (Fig. 2E). These
findings reinforce the close association between coagulation
processes and the development and progression of LUAD.
Subsequently, a risk model based on the coagulation genes was
created, to further confirm the association between LUAD and
coagulation pathways.
Construction of a four-gene risk model
associated with coagulation metabolism
As noted above, 51 DEGs were identified through
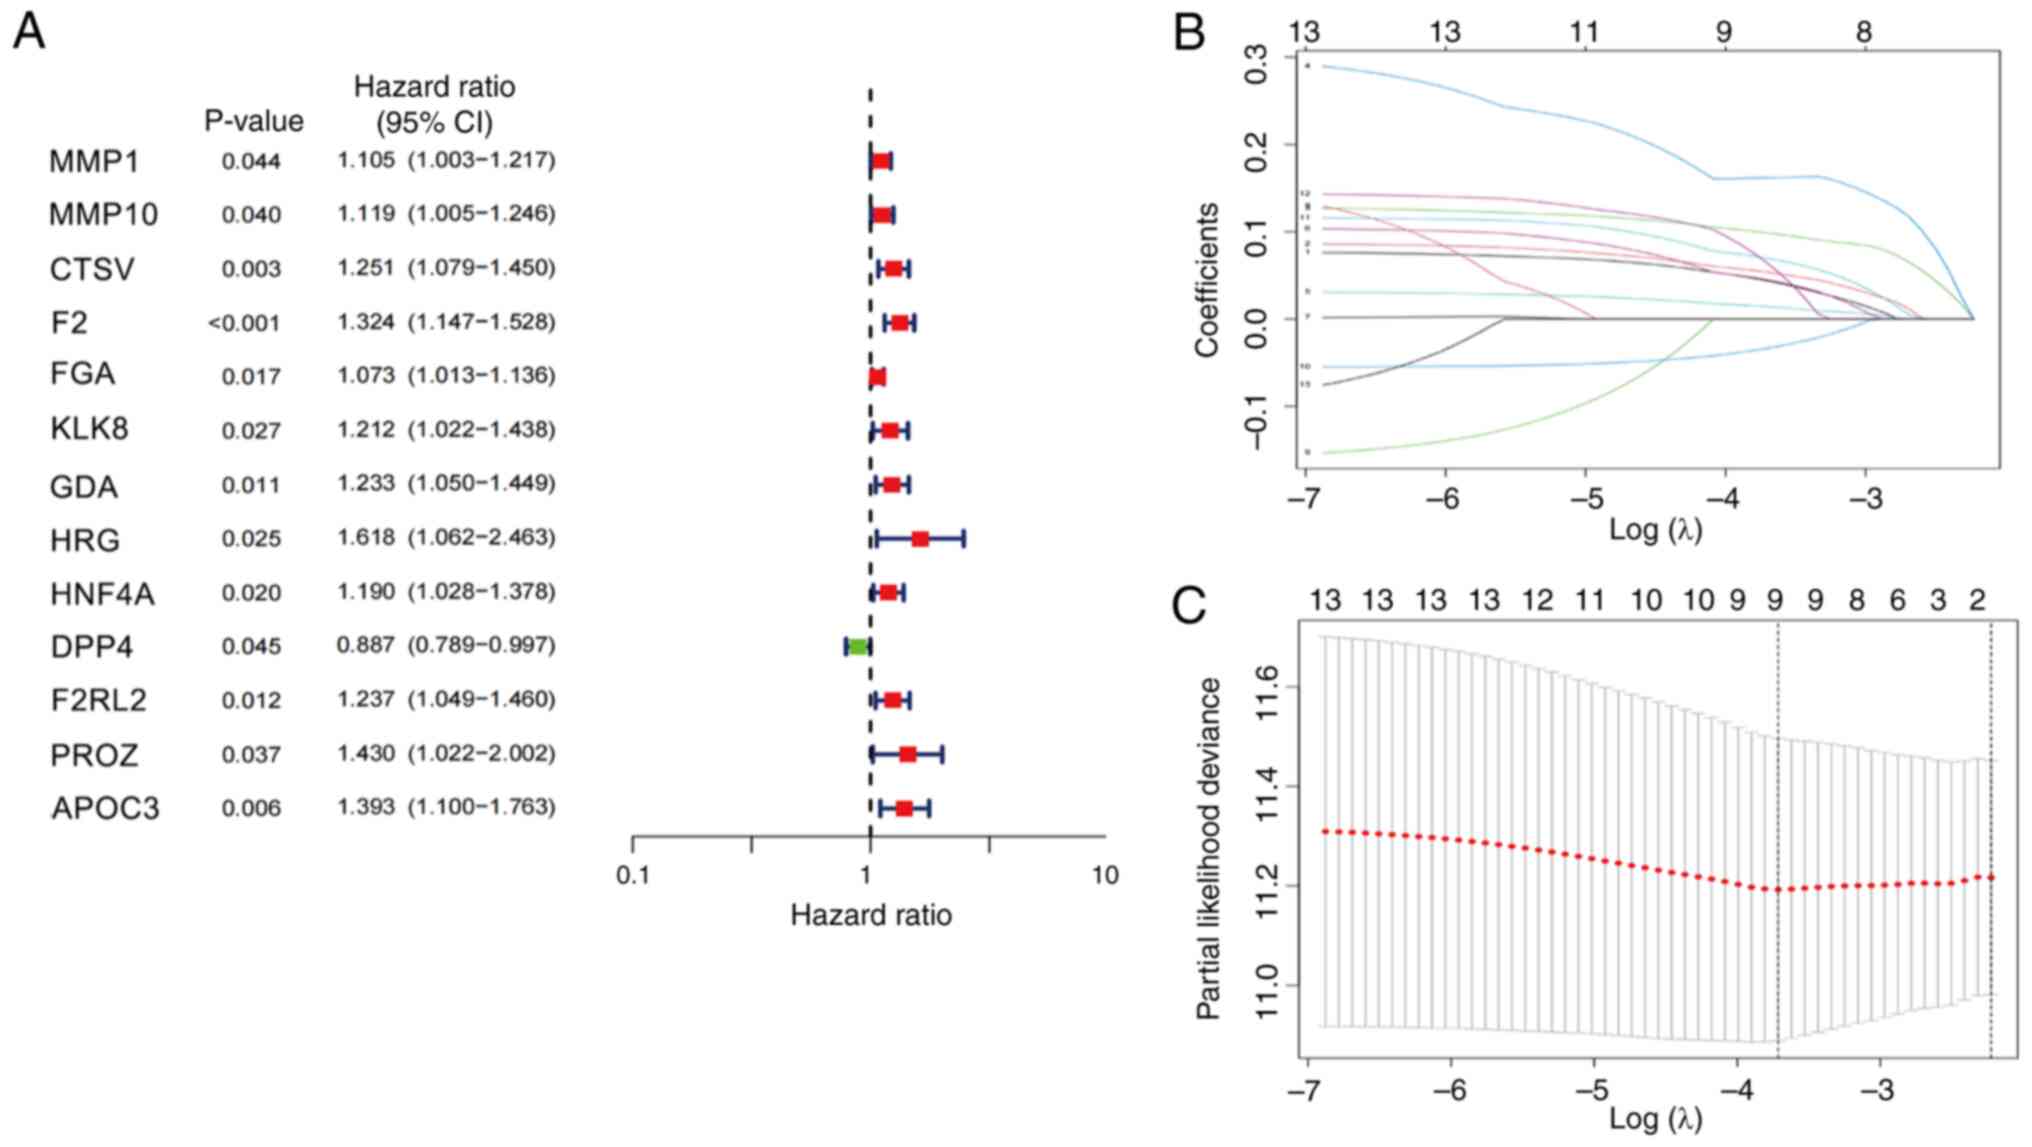
differential expression analysis. Subsequently, univariate Cox
regression analysis was performed, which revealed that 13 genes
were significantly associated with OS. Of these, matrix
metalloproteinase (MMP) 1 (HR, 1.105; P=0.044), MMP10 (HR, 1.119;
P=0.040), cathepsin V (CTSV; HR=1.251; P=0.003),
thrombin/coagulation factor II (F2; HR=1.324; P<0.001), FGA (HR,
1.073; P=0.017), KLK8 (HR, 1.212; P=0.027), GDA (HR, 1.233;
P=0.011), HRG (HR, 1.618; P=0.025), HNF4A (HR, 1.190; P=0.020),
F2RL2 (HR, 1.237; P=0.012), PROZ (HR, 1.430; P=0.037) and APOC3
(HR, 1.393; P=0.006) were classified as high-risk genes, while DPP4
(HR, 0.887; P=0.045) was classified as a low-risk gene (Fig. 3A). Subsequently, 507 eligible LUAD
samples from TCGA were randomly divided into training (n=254) and
test (n=253) sets in a 1:1 ratio (Table II). Based on analyses of age, sex,
tumor stage and TNM staging, no significant differences between the
training and test sets were identified. Within the training set,
LASSO regression analysis was employed to identify the most
prognostically relevant genes, which led to the construction of a
four-gene prognostic model comprising the MMP1, MMP10, CTSV and F2
genes (Fig. 3B and C). The risk
score formula for this model was as follows: Total risk
score=(0.0837569167784308 × MMP1) + (0.0878985239886888 × MMP10) +
(0.159310542027166 × CTSV + (0.258137401792528 × F2).
| Table II.Clinical characteristics of the three
sets of data randomly generated from The Cancer Genome Atlas
database. |
Table II.
Clinical characteristics of the three
sets of data randomly generated from The Cancer Genome Atlas
database.
| Clinical
features | Total set,
n=507a | Training set,
n=254 | Test set,
n=253 |
P-valueb |
|---|
| Age, years |
|
|
| 1 |
|
≤65 | 239 (47.14) | 120 (47.24) | 119 (47.04) |
|
|
>65 | 258 (50.89) | 130 (51.18) | 128 (50.59) |
|
| Sex |
|
|
| 0.8912 |
|
Female | 272 (53.65) | 135 (53.15) | 137 (54.15) |
|
|
Male | 235 (46.35) | 119 (46.85) | 116 (45.85) |
|
| Stage |
|
|
| 0.3882 |
| I | 272 (53.65) | 127 (50) | 145 (57.31) |
|
| II | 120 (23.67) | 65 (25.59) | 55 (21.74) |
|
|
III | 81 (15.98) | 45 (17.72) | 36 (14.23) |
|
| IV | 26 (5.13) | 13 (5.12) | 13 (5.14) |
|
| T stage |
|
|
| 0.6613 |
| T1 | 169 (33.33) | 80 (31.5) | 89 (35.18) |
|
| T2 | 271 (53.45) | 141 (55.51) | 130 (51.38) |
|
| T3 | 45 (8.88) | 21 (8.27) | 24 (9.49) |
|
| T4 | 19 (3.75) | 11 (4.33) | 8 (3.16) |
|
| N stage |
|
|
| 0.2544 |
| N0 | 327 (64.5) | 155 (61.02) | 172 (67.98) |
|
| N1 | 95 (18.74) | 52 (20.47) | 43 (17) |
|
| N2 | 71 (14) | 42 (16.54) | 29 (11.46) |
|
| N3 | 2 (0.39) | 1 (0.39) | 1 (0.4) |
|
| M stage |
|
|
| 0.9886 |
| M0 | 338 (66.67) | 170 (66.93) | 168 (66.4) |
|
| M1 | 25 (4.93) | 12 (4.72) | 13 (5.14) |
|
Individuals were classified on the basis of the risk
score calculated using this formula, with the average score as the
cutoff. Individuals with scores above the average were categorized
into the high-risk group, whereas those below the average were
placed in the low-risk group. In the total set, 253 individuals
were placed in the high-risk group, and 254 were categorized in the
low-risk group. In the training set, the high- and low-risk groups
each comprised 127 cases, whereas the test set contained 126
high-risk and 127 low-risk cases.
The Shapiro-Wilk test was employed to evaluate the
normality of the data in the high- and low-risk groups. This test
indicated that both datasets deviate significantly from the normal
distribution (high risk, W=0.6951, P<2.2×10⁻¹⁶; low
risk, W=0.96479, P=6.825×10⁻⁶). Since the data did not
meet the prerequisite of a normal distribution required for ANOVA,
a non-parametric test method was used, namely Wilcoxon's rank-sum
test. The Wilcoxon test result (W=64,262,
P<2.2×10⁻¹⁶) indicated that there was a significant
difference in the distribution of risk scores between the high- and
low-risk groups.
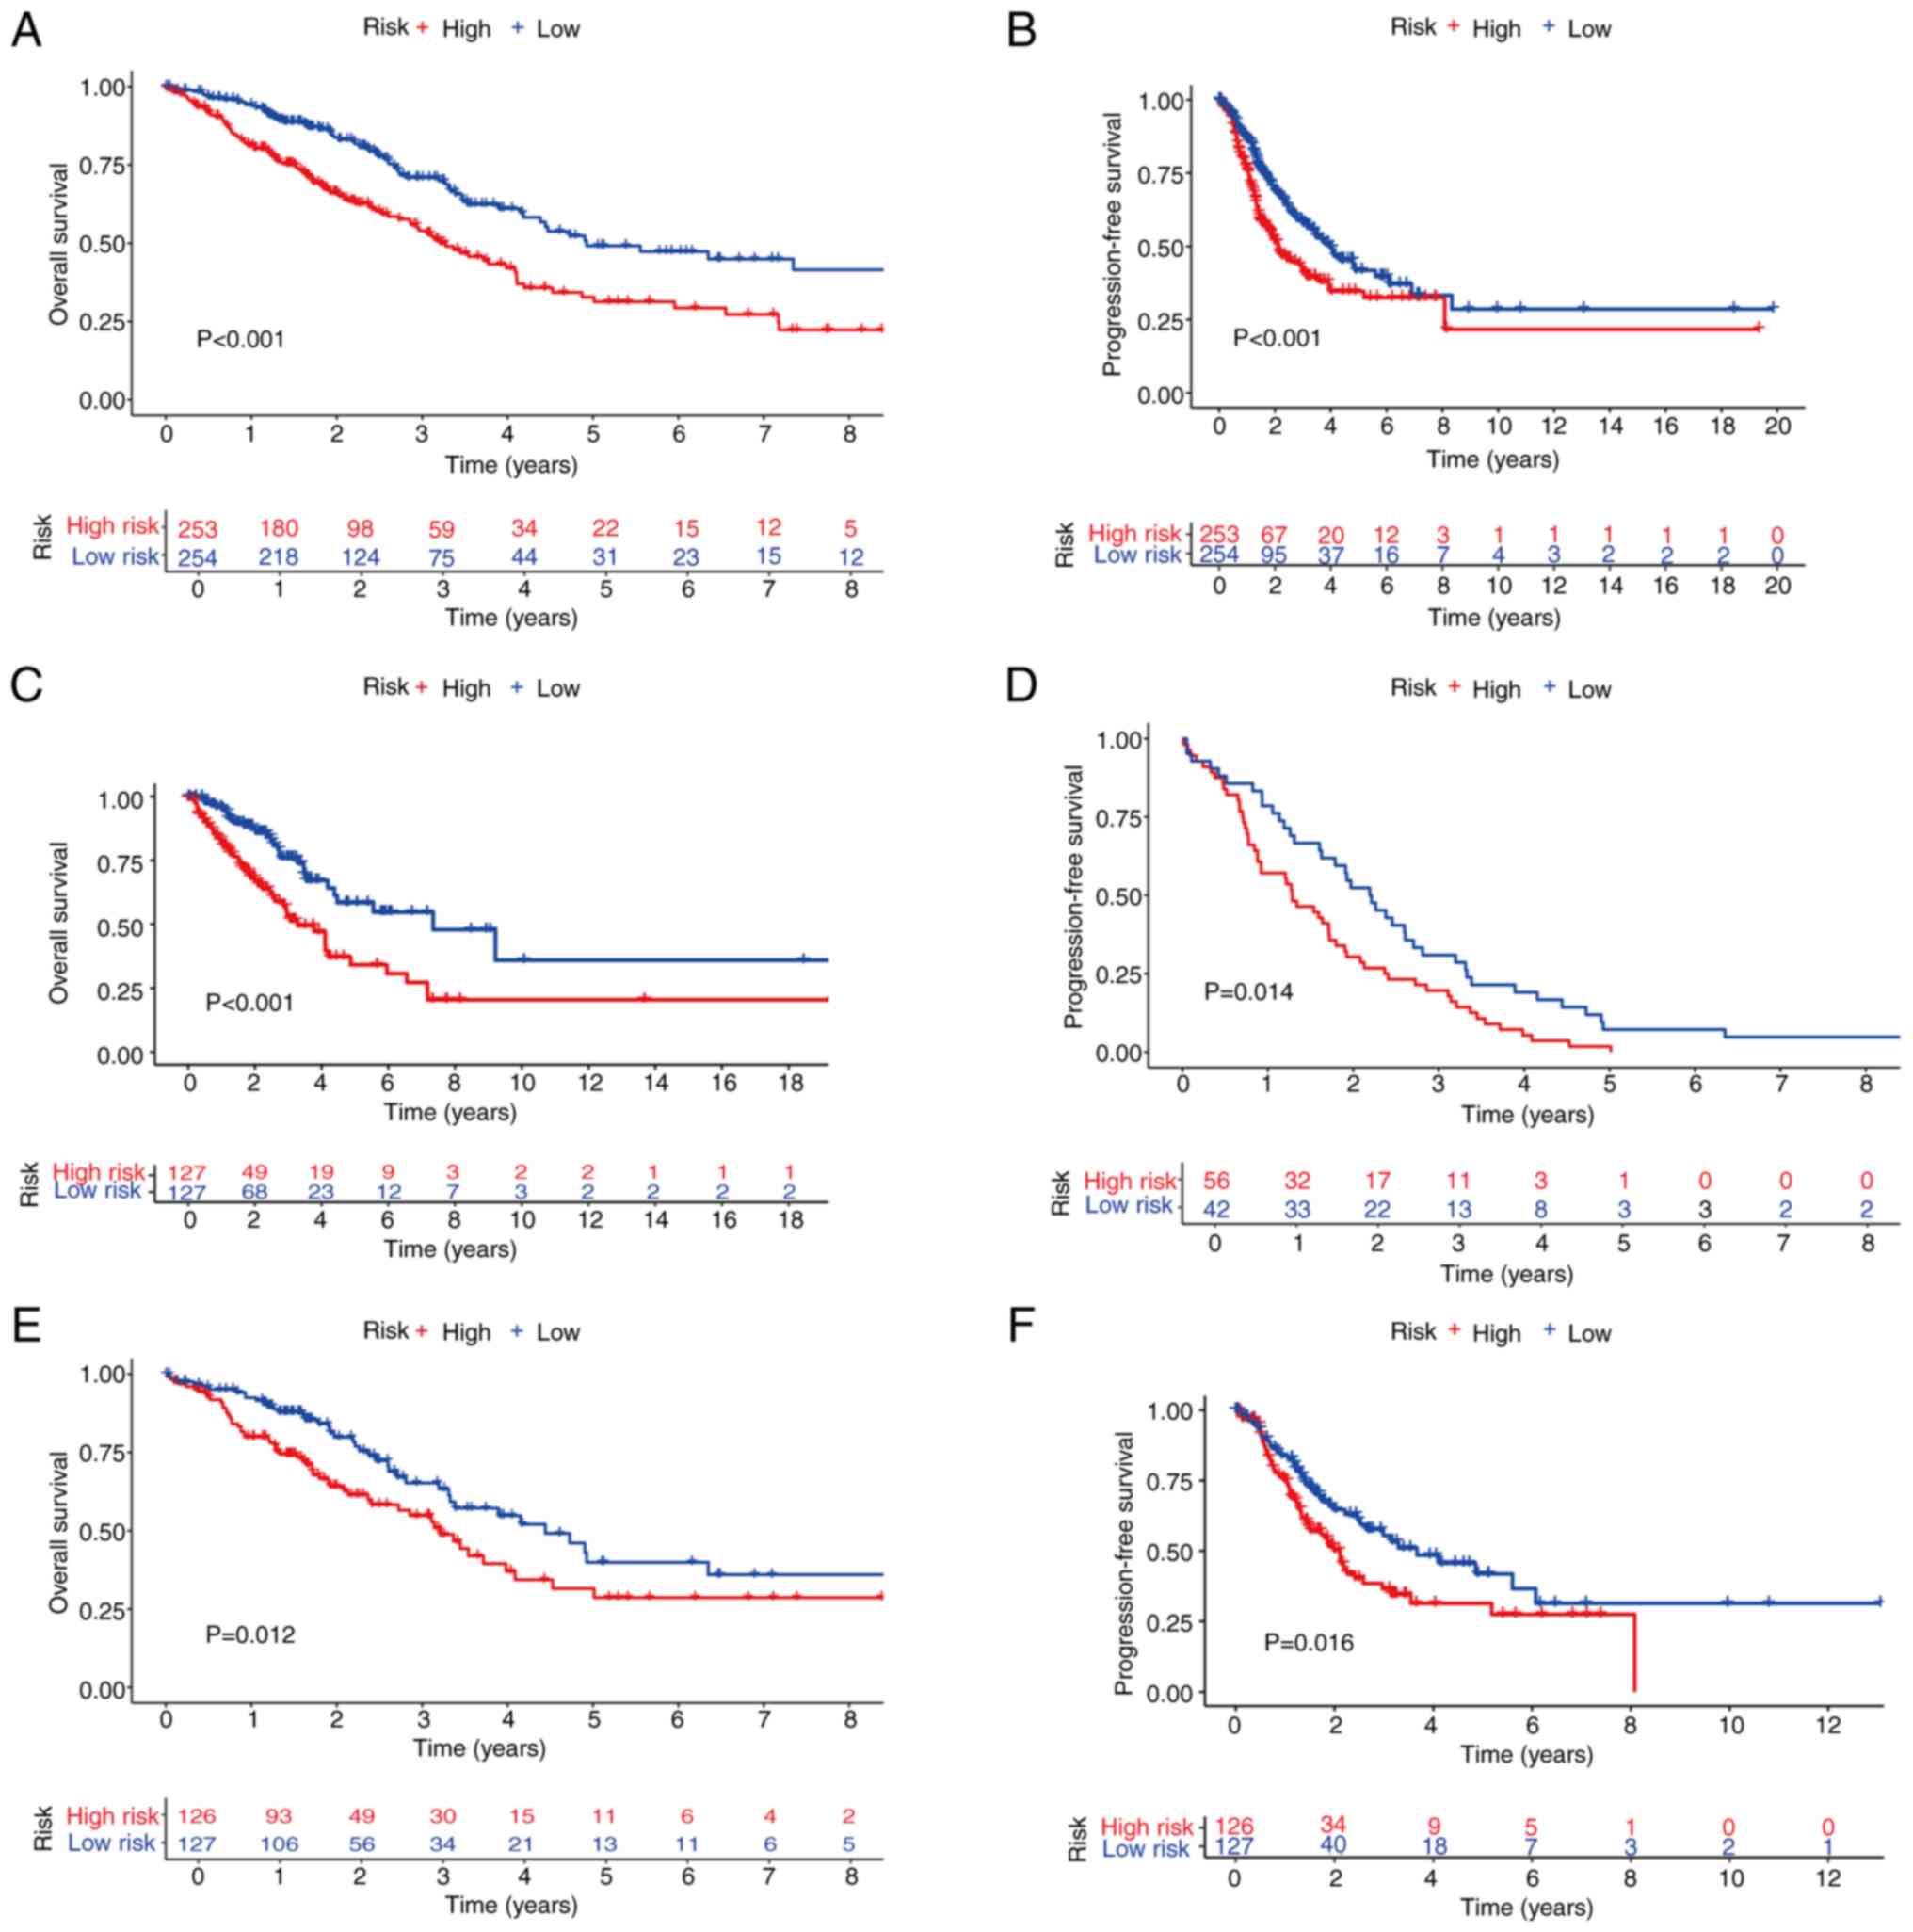
KM curves were subsequently generated to compare the
OS and PFS between the high- and low-risk groups in the total,
training and test sets. This analysis revealed that the OS of the
high-risk group was significantly lower compared with that of the
low-risk group in the total, training and test sets (Fig. 4A, C and E). Similarly, the PFS rates
were significantly shorter in the high-risk group compared with the
low-risk group in all three sets (Fig.
4B, D and F). There were significant statistical differences
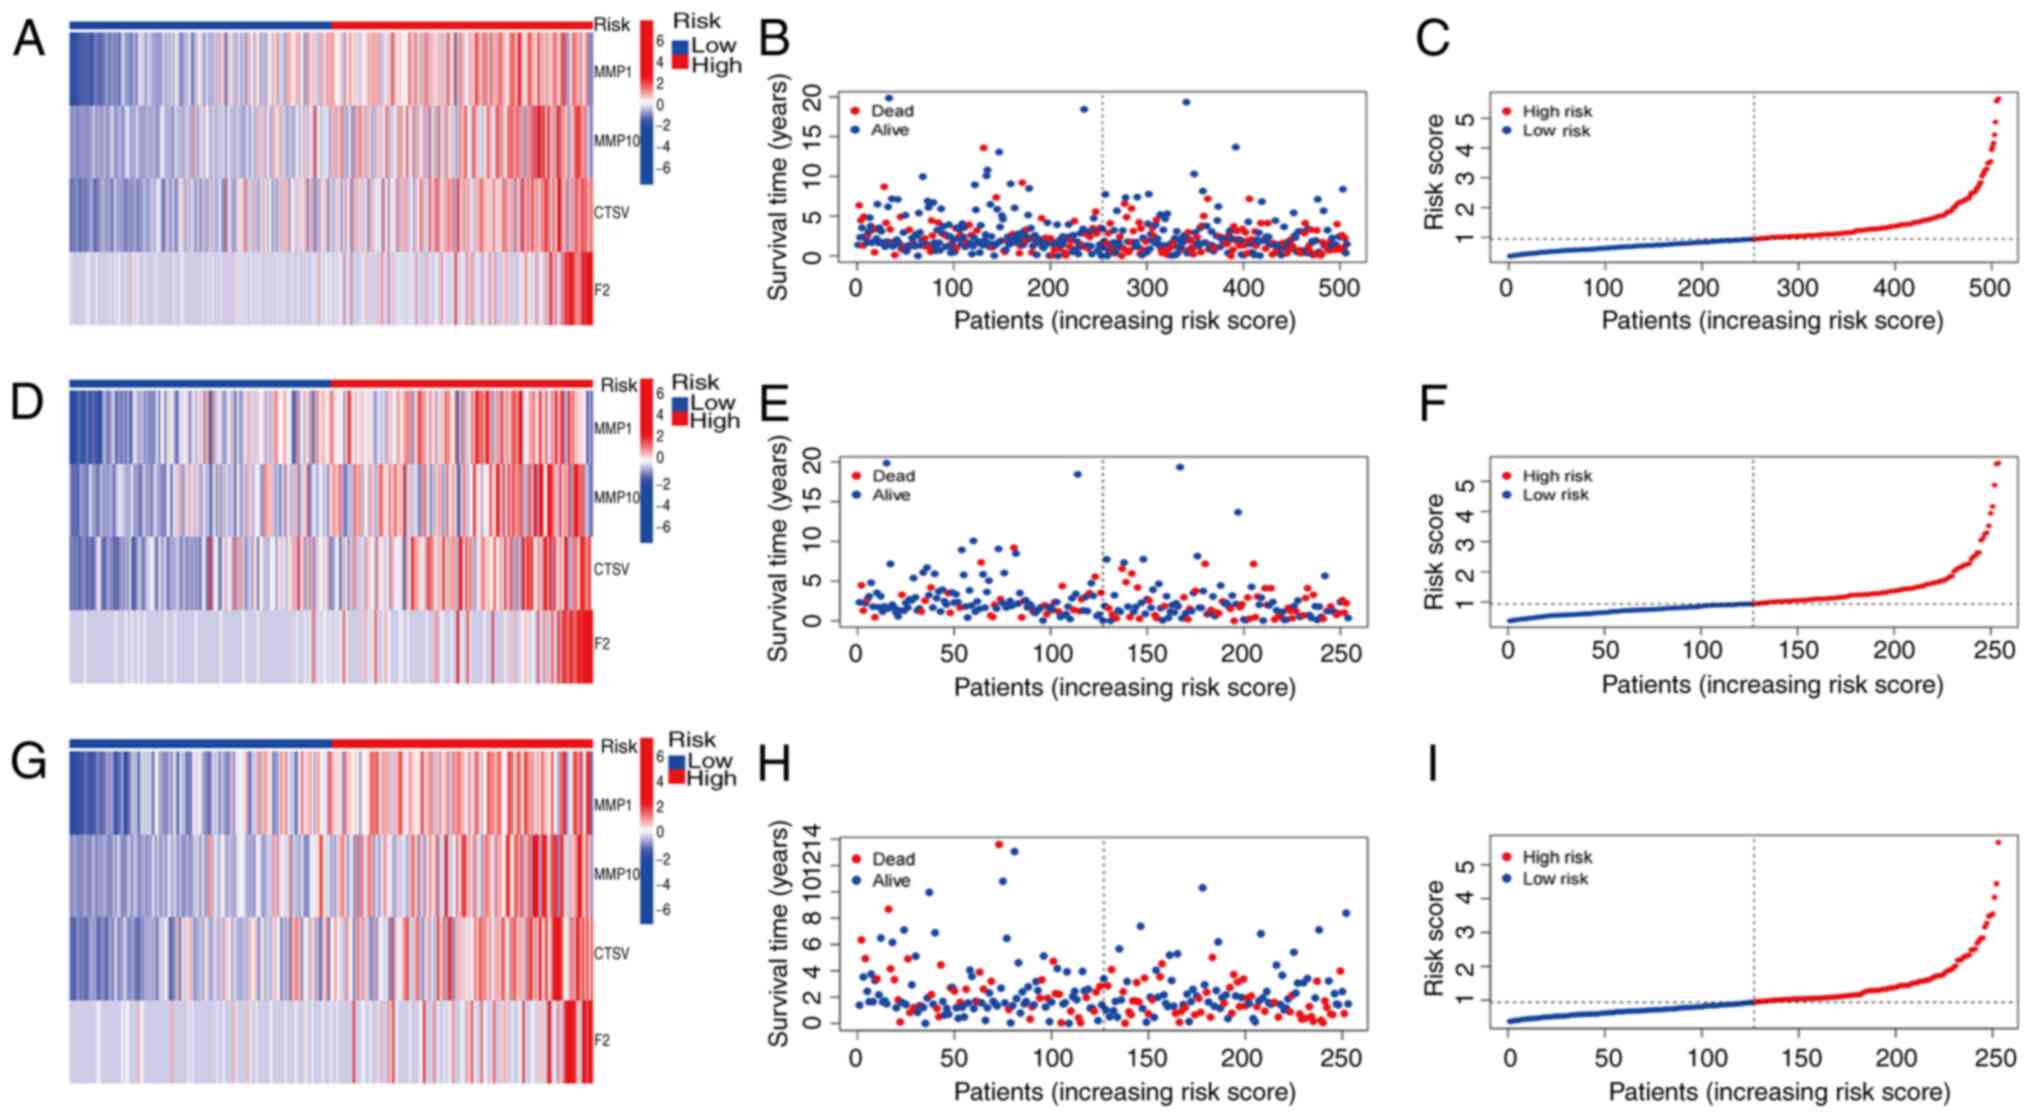
(P<0.05). Prognostic validation using heatmaps identified MMP1,
MMP10, CTSV and F2 as consistently high-risk genes across the total
set (Fig. 5A). Additionally, the
associations between risk scores and survival times between the
high- and low-risk groups in the total set were examined, which
revealed a significant reduction in survival time for patients with
high risk scores (Fig. 5B). Further
analysis of the OS risk score distribution in the total set
corroborated the accuracy of this model (Fig. 5C). Similar results were observed for
validation of the training and test sets (Fig. 5D-I).
Independent analysis of prognostic
factors according to the prognostic model
Univariate and multivariate Cox regression analyses
were performed to determine whether each risk factor functioned as
an independent prognostic indicator, distinct from other clinical
characteristics. Initially, univariate Cox regression analysis was
performed on the total set. The results revealed that age, sex,
tumor stage, T stage, M stage, N stage and the risk score were
significantly associated with prognosis. Specifically, tumor stage
(HR, 1.595; P<0.001), T stage (HR, 1.618; P<0.001), N stage
(HR, 1.732; P<0.001) and risk score (HR, 1.517; P<0.001) were
significantly associated with prognosis, and M stage (HR, 1.858;
P=0.034) was marginally significant (Fig. 6A). Subsequently, multivariate Cox
regression analysis was performed on the total set to assess the
independence of these factors. The results indicated that T stage
(HR, 1.362; P=0.010) and risk score (HR, 1.415; P<0.001) were
independent prognostic indicators. By contrast, tumor stage (HR,
1.246; P=0.301), sex (HR, 0.924; P=0.651), M stage (HR, 1.011;
P=0.984) and N stage (HR, 1.251; P=0.216) did not have significant
independent prognostic value (Fig.
6B). To evaluate the accuracy of the risk model, validation
analysis was subsequently performed using ROC curves. The area
under the ROC curve (AUC) values for 1-, 3- and 5-year survival
were 0.687, 0.634 and 0.622 respectively, demonstrating the
predictive capability of the model (Fig. 6C). In addition, ROC curve analysis
for different clinical characteristics revealed that the predictive
performance of the risk score (AUC, 0.687) was greater than that of
age (AUC, 0.490), sex (AUC, 0.550), T stage (AUC, 0.652), M stage
(AUC, 0.501) and N stage (AUC, 0.666) (Fig. 6D). Taken together, these findings
confirm that the risk score model was capable of outperforming
other clinical characteristics in terms of prognostic accuracy.
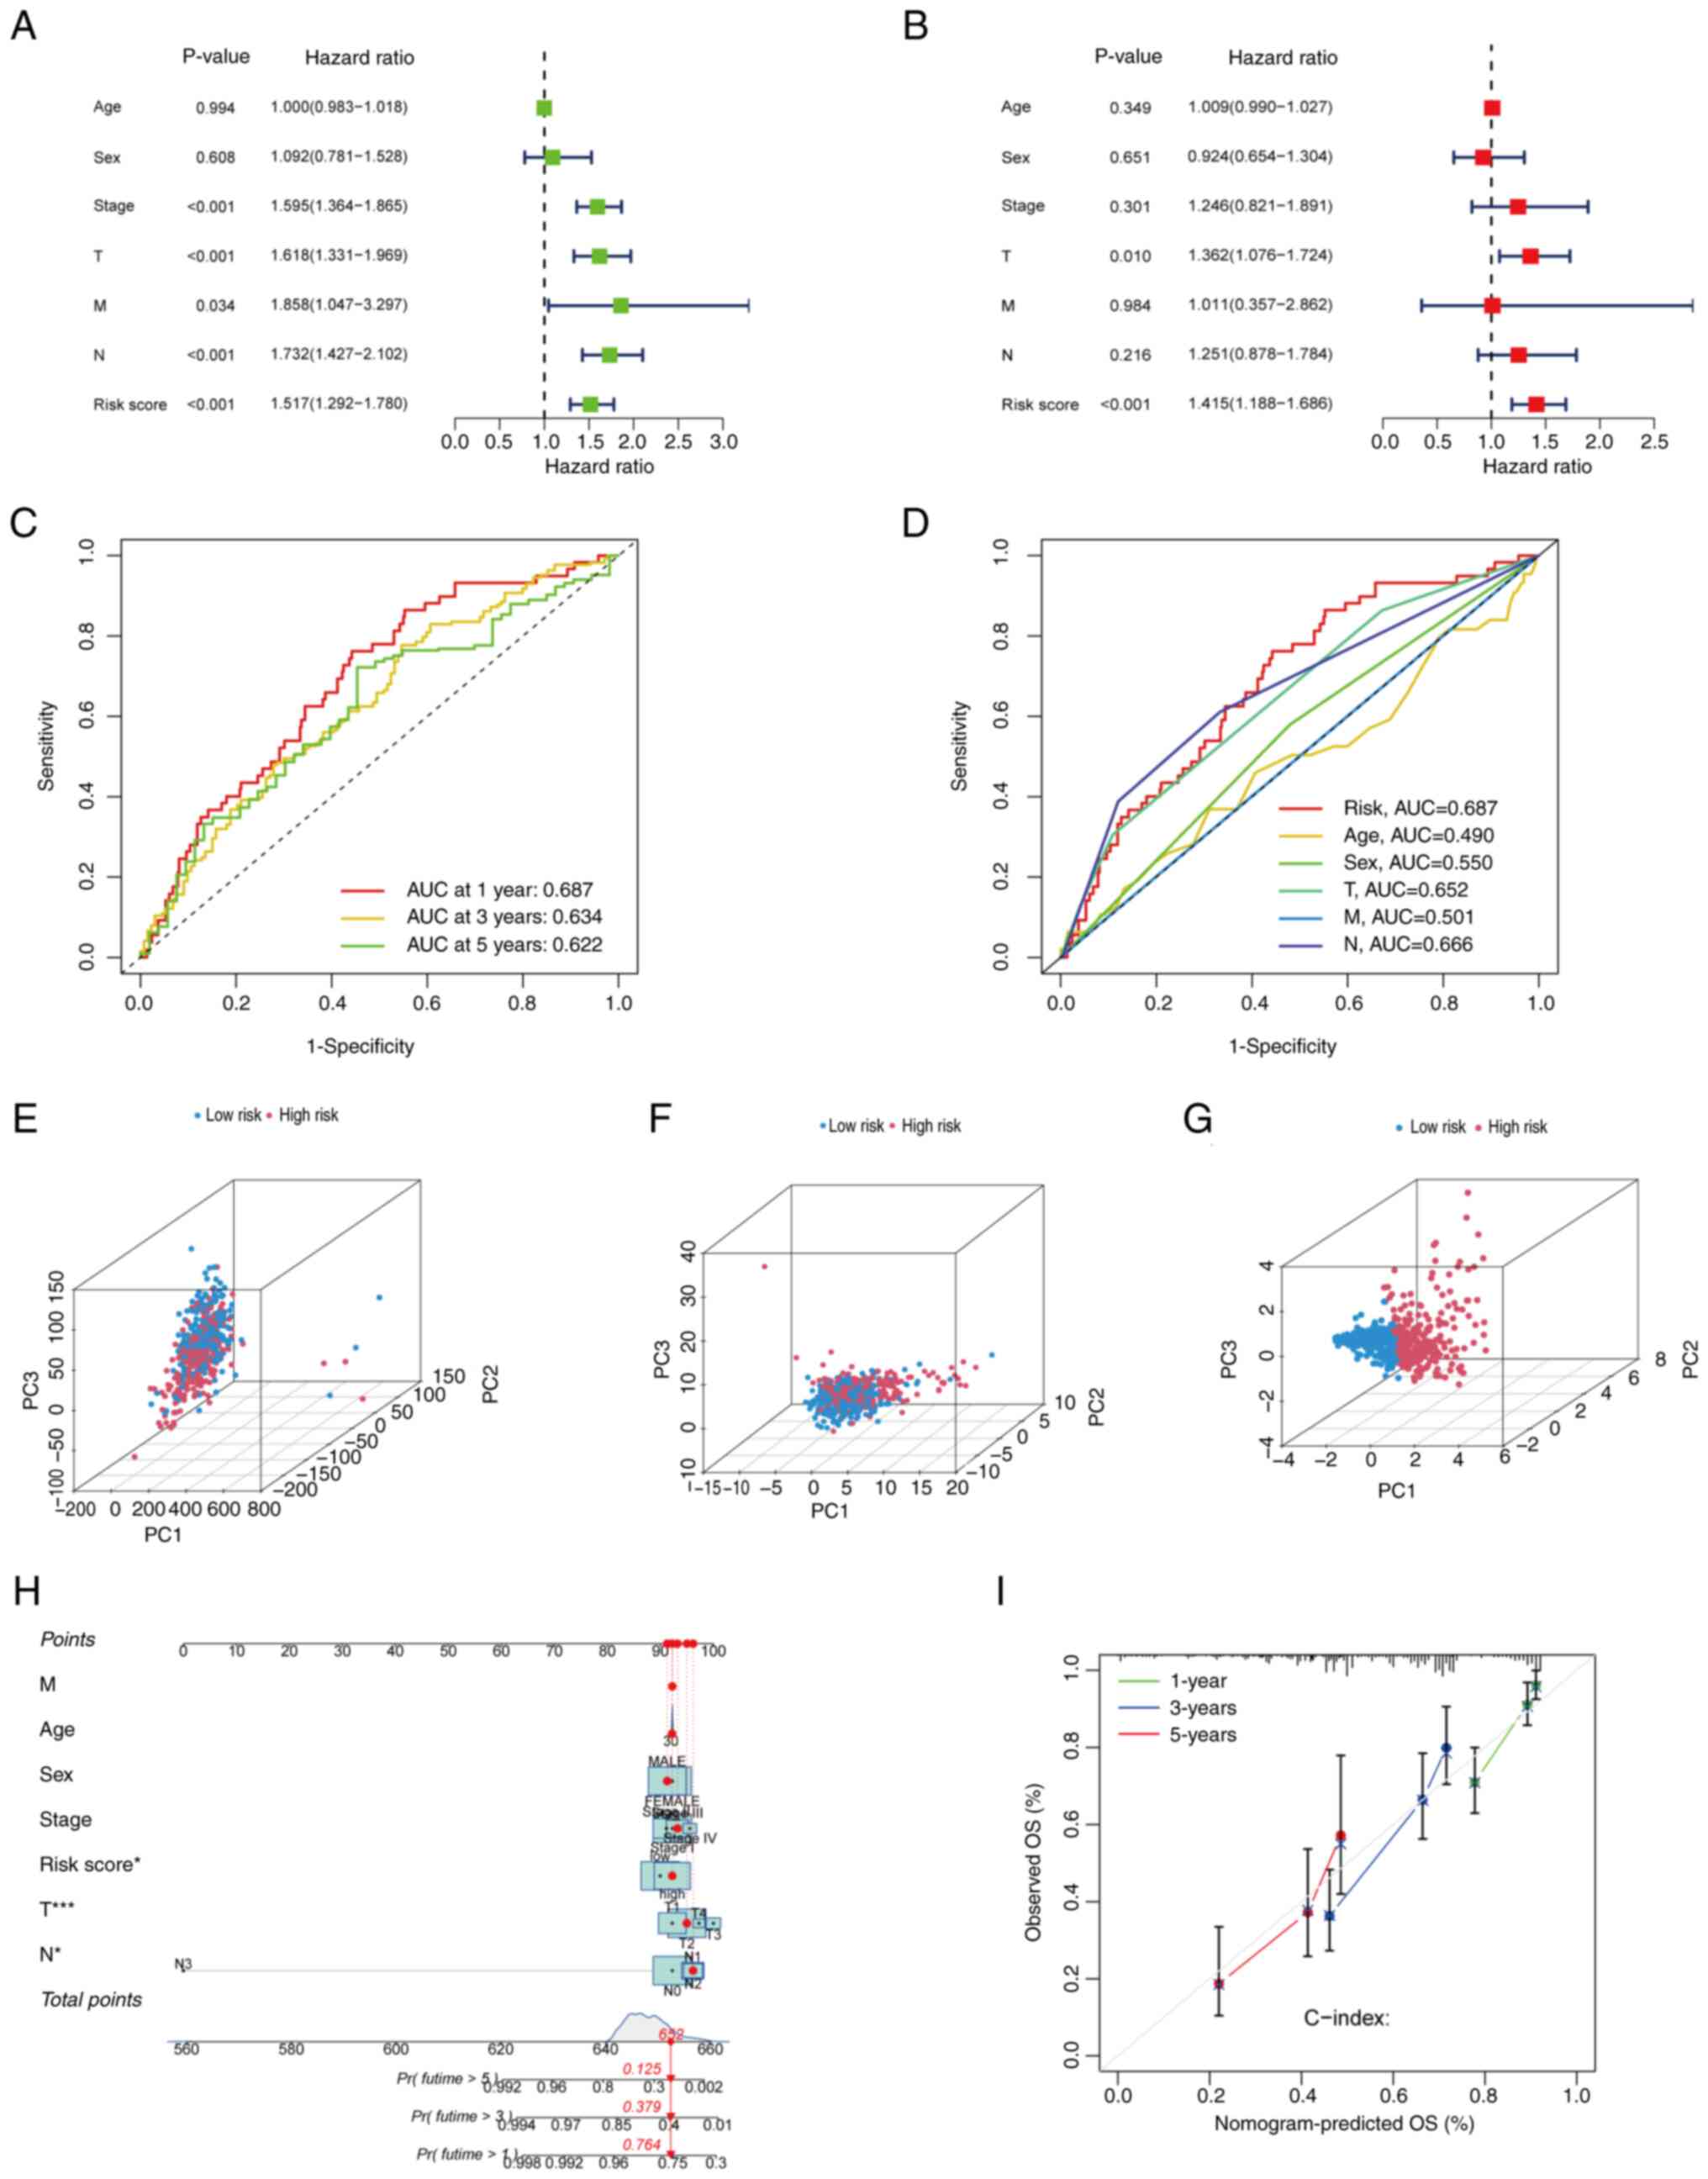 | Figure 6.Evaluation of the predictive ability
of the prognostic model. (A) Univariate and (B) multivariate Cox
regression analyses of clinical information and risk scores. (C)
ROC curves for the prediction of 1-, 3- and 5-year OS. (D) ROC
curves comparing the predictive performance of the risk score with
that of various clinical characteristics. Principal component
analysis showing the distribution of individual patients in the
high- and low-risk groups based on (E) genome-wide gene expression
profiles, (F) CRGs and (G) CRGs included in the prognostic model.
(H) Nomogram for prediction of the 1-, 3- and 5-year OS of patients
with LUAD from TCGA. (I) Calibration curve of the nomogram for
predicting 1-, 3- and 5-year OS in patients with LUAD from TCGA.
ROC, receiver operating characteristic; OS, overall survival; LUAD,
lung adenocarcinoma; TCGA, The Cancer Genome Atlas; AUC, area under
the curve; Pr(futime), probability of future time. |
PCA and nomogram construction
The present study employed PCA to further assess the
accuracy of the prognostic model. The distribution of samples from
patients with LUAD between the high- and low-risk groups was
compared at the genome-wide level (Fig.
6E), in CRGs (Fig. 6F) and in
genes included in the prognostic model (Fig. 6G). The results revealed significant
differences in the genome-wide distributions, with the genes
involved in the prognostic model exhibiting the highest level of
discrimination. Additionally, a nomogram for patients with LUAD was
constructed (Fig. 6H), which
incorporated variables including age, sex, the TNM, T, N and M
stages, and risk score. This nomogram was used to predict the 1-,
3- and 5-year survival rates of the patients. Calibration curves
were then constructed (Fig. 6I),
which demonstrated that the nomogram possessed high predictive
accuracy.
Associations between clinical
characteristics and risk scores
To investigate the associations between various
patient characteristics and risk scores in greater depth, heat maps
were constructed to assess the associations between gene expression
data derived from the model and various clinical and pathological
characteristics (Fig. 7A). This
analysis reaffirmed MMP1, MMP10, CTSV and F2 as high-risk genes,
and highlighted significant correlations between the risk score and
various clinical characteristics, particularly N stage (P<0.01),
tumor stage (P<0.01) and survival time (P<0.01). Furthermore,
KM analyses were performed between the high- and low-risk groups
within clinical characteristic sub-groups. In patients aged <65
or ≥65 years, of either sex, or with tumor stage I–II, T1-T2,
T3-T4, N0 or M0, the prognostic accuracy of the risk model in terms
of distinguishing between the high- and low-risk groups was
significant (Fig. 7B-M).
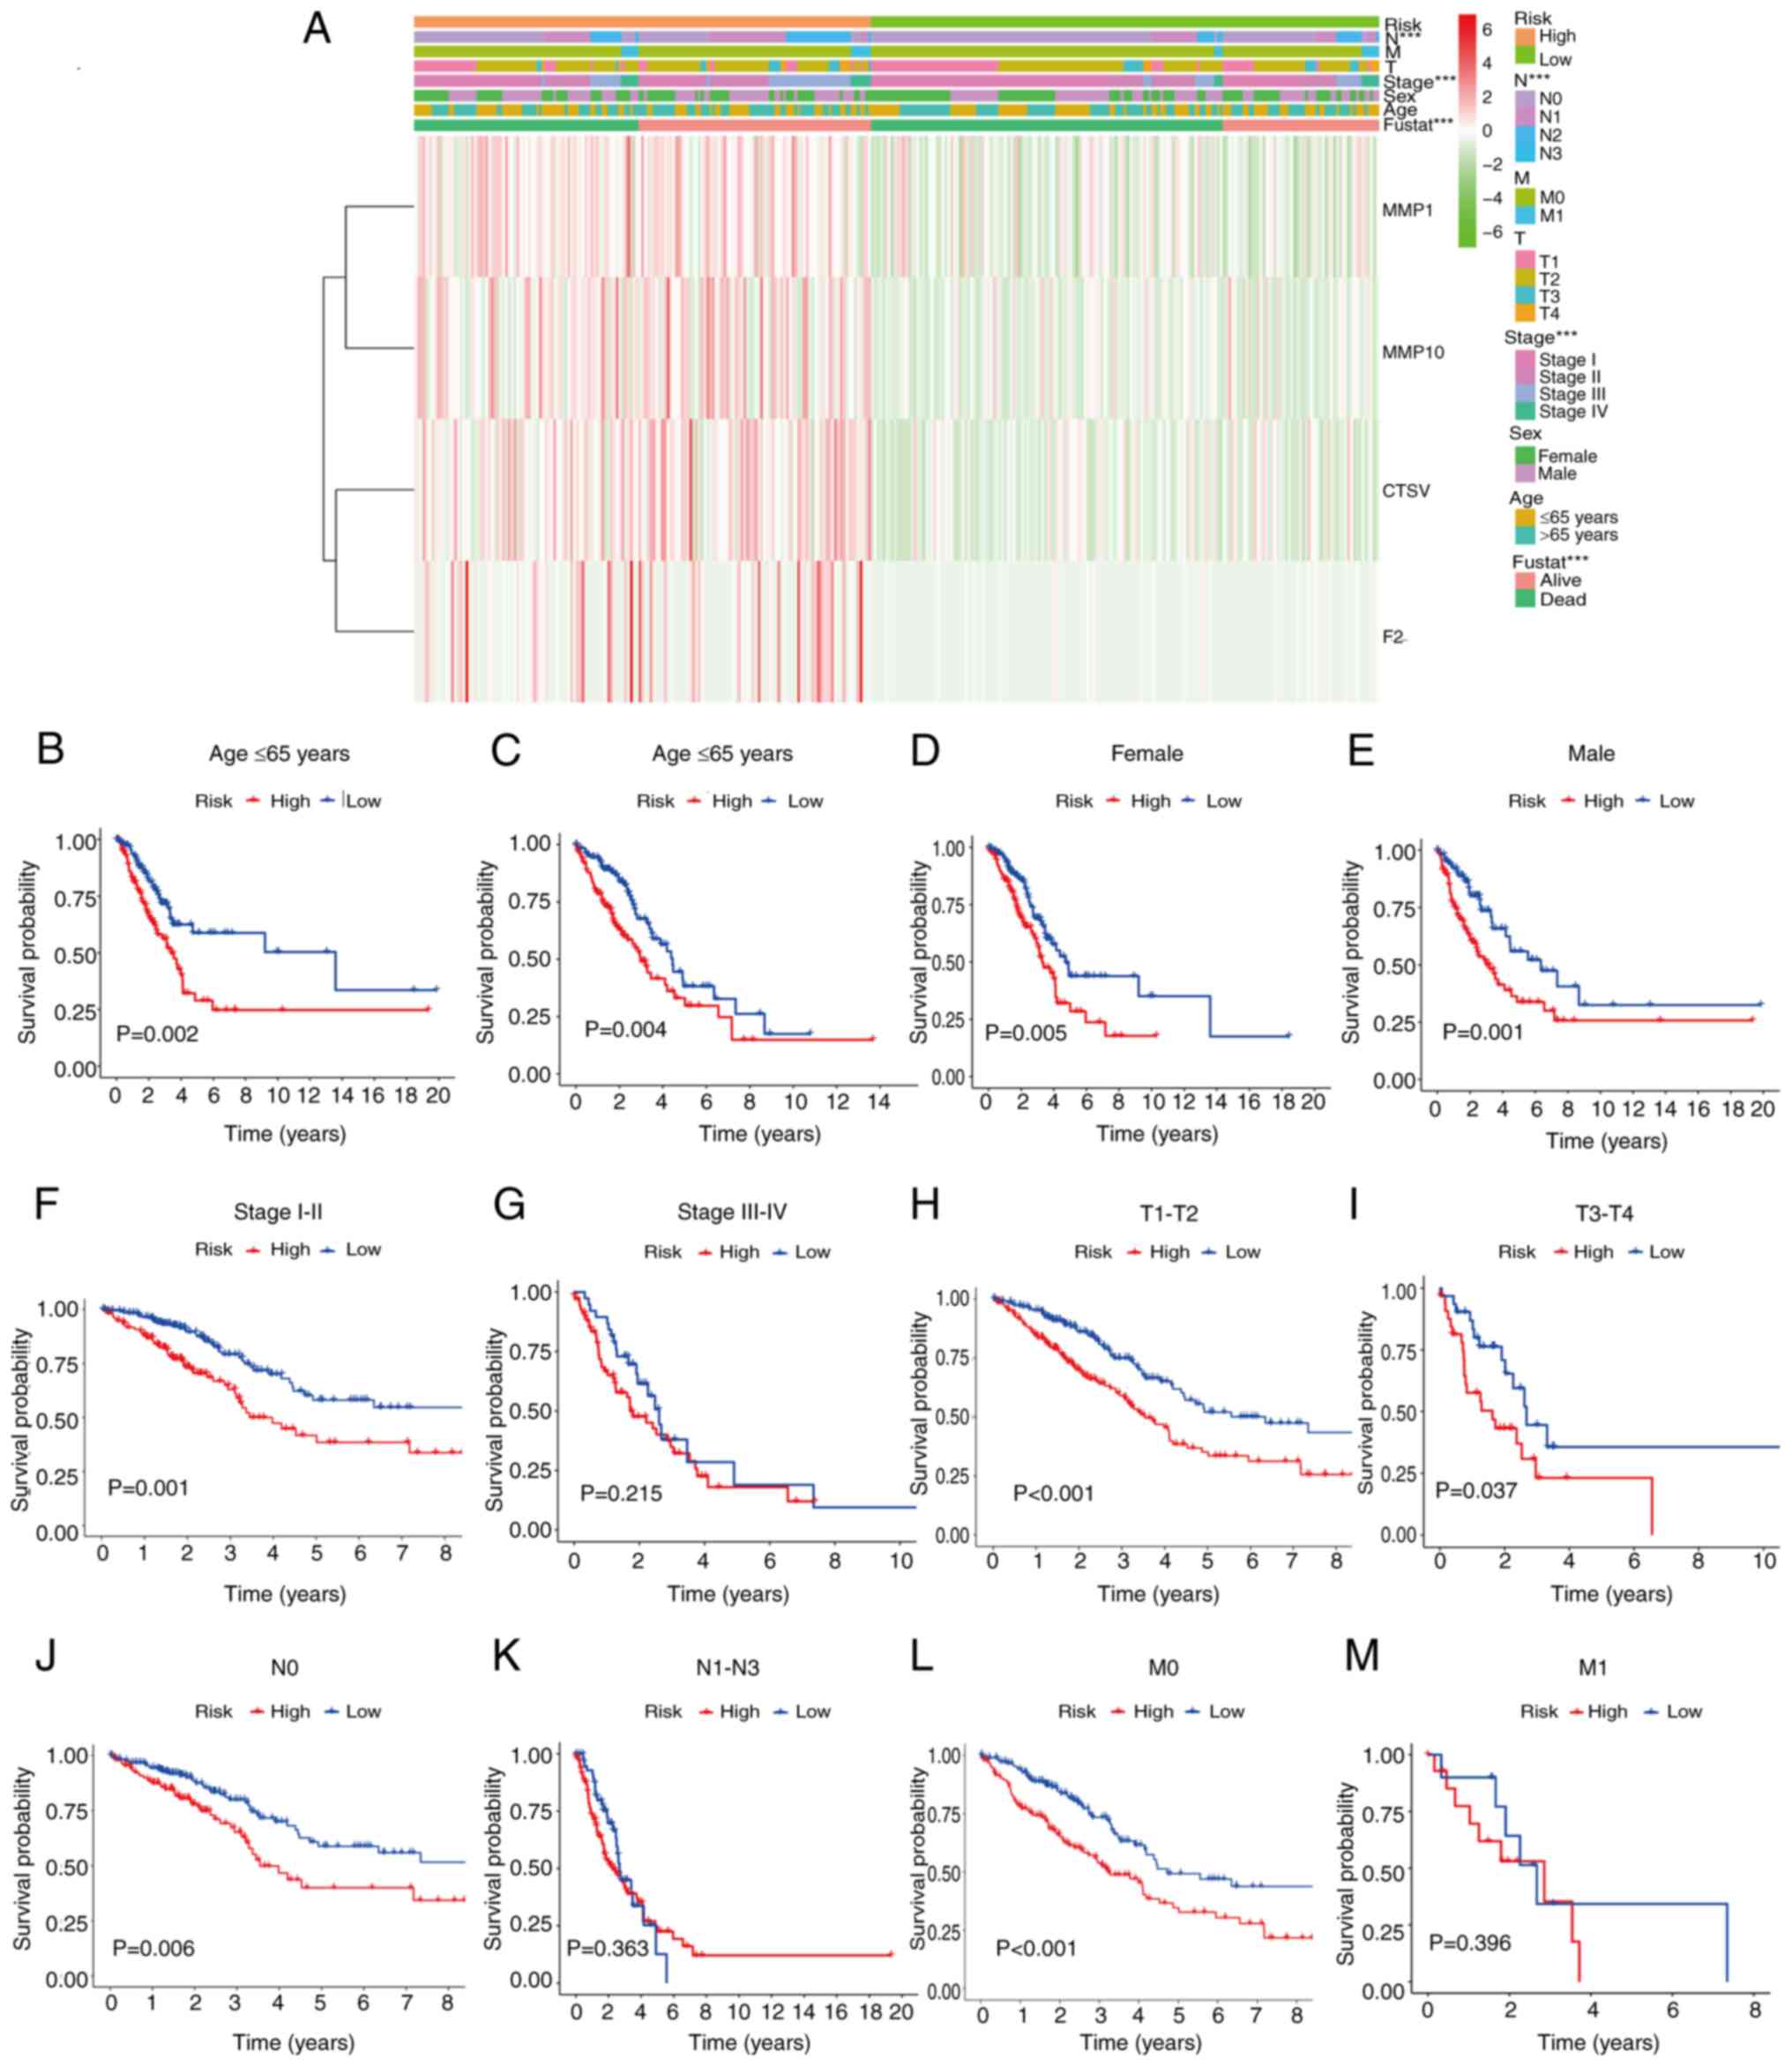 | Figure 7.Relationships between risk patterns
and clinical characteristics. (A) Associations between prognosis
and clinical characteristics based on data from TCGA. (B-M)
Kaplan-Meier survival curve analysis of the overall survival rates
in the high- and low-risk groups of patients from TCGA with
different clinical pathological characteristics: (B) Age ≤65 years,
(C) age >65 years, (D) female patients, (E) male patients, (F)
stage I–II, (G) stage III–IV, (H) T1-T2, (I) T3-T4, (J) N0, (K)
N1-N3, (L) M0 and (M) M1. ***P<0.001. TCGA, The Cancer Genome
Atlas; MMP, matrix metalloproteinase; CTSV, cathepsin V; F2,
thrombin/coagulation factor II; fustat, follow-up status. |
GO, KEGG and enrichment analyses
Based on the results obtained, the prognostic model
constructed from the genes MMP1, MMP10, CTSV and F2 demonstrated
high accuracy in terms of distinguishing between high- and low-risk
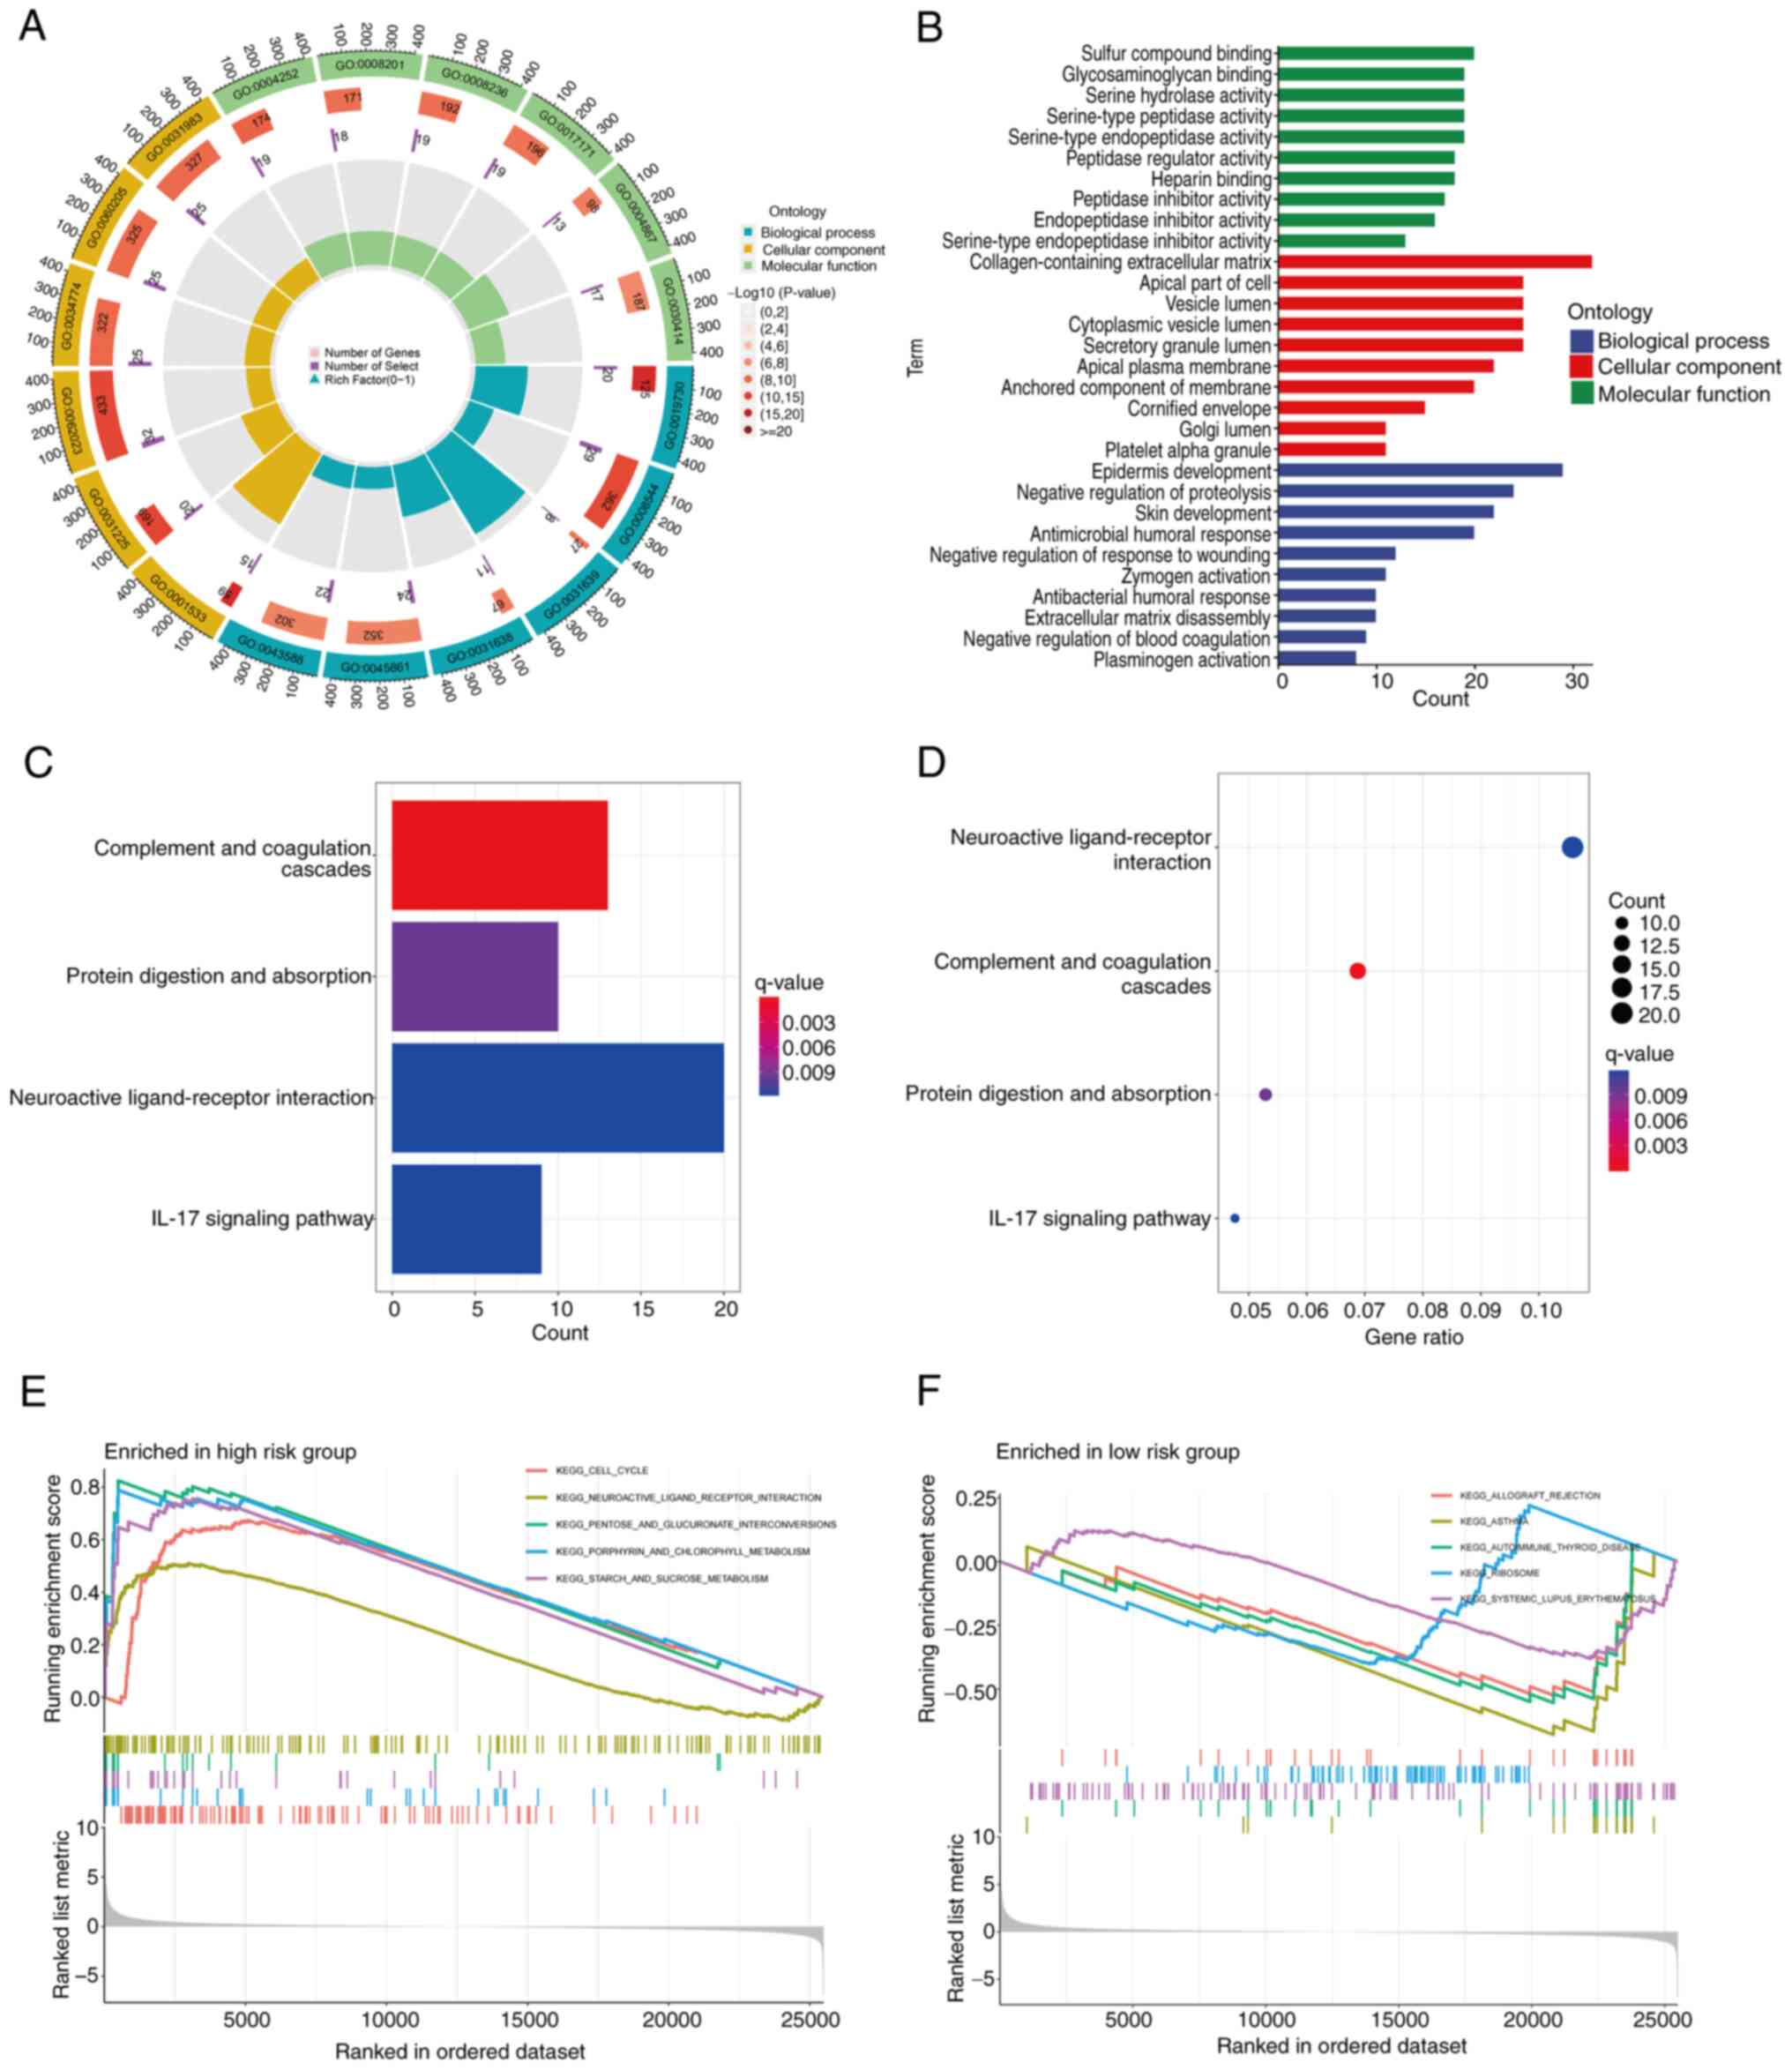
groups for patients with LUAD. GO enrichment analysis revealed that
these genes are primarily associated with ‘sulfur compound
binding’, ‘glycosaminoglycan binding’, ‘serine hydrolase activity’,
‘serine-type peptidase activity’ and ‘serine-type endopeptidase
activity’ at the BP level. At the CC level, these genes were found
to be significantly enriched in ‘collagen-containing extracellular
matrix’, ‘apical part of cell’, ‘vesicle lumen’, ‘cytoplasmic
vesicle lumen’ and ‘secretory granule lumen’. The analysis of MF
identified associations with ‘epidermis development’, ‘negative
regulation of proteolysis’, ‘skin development’ and ‘antimicrobial
humoral response’ Fig. 8A and B).
Furthermore, KEGG pathway enrichment analysis revealed that these
genes are primarily associated with ‘neuroactive ligand-receptor
interaction’ (Fig. 8C and D). To
further differentiate between the high- and low-risk groups, GSEA
was performed. This led to the identification of five significant
pathways based on P-value ranking. The GSEA analysis revealed that
the high-risk group was significantly enriched in the pathways
‘cell cycle’, ‘neuroactive ligand-receptor interaction’, ‘pentose
and gluconate interconversion’, ‘porphyrin and chlorophyll
metabolism’ and ‘starch and sucrose metabolism’. By contrast, the
low-risk group was enriched in the pathways ‘allograft rejection’,
‘asthma’, ‘autoimmune thyroid disease’, ‘ribosome’ and ‘systemic
lupus erythematosus’ (Fig. 8E and
F).
Immunological investigations
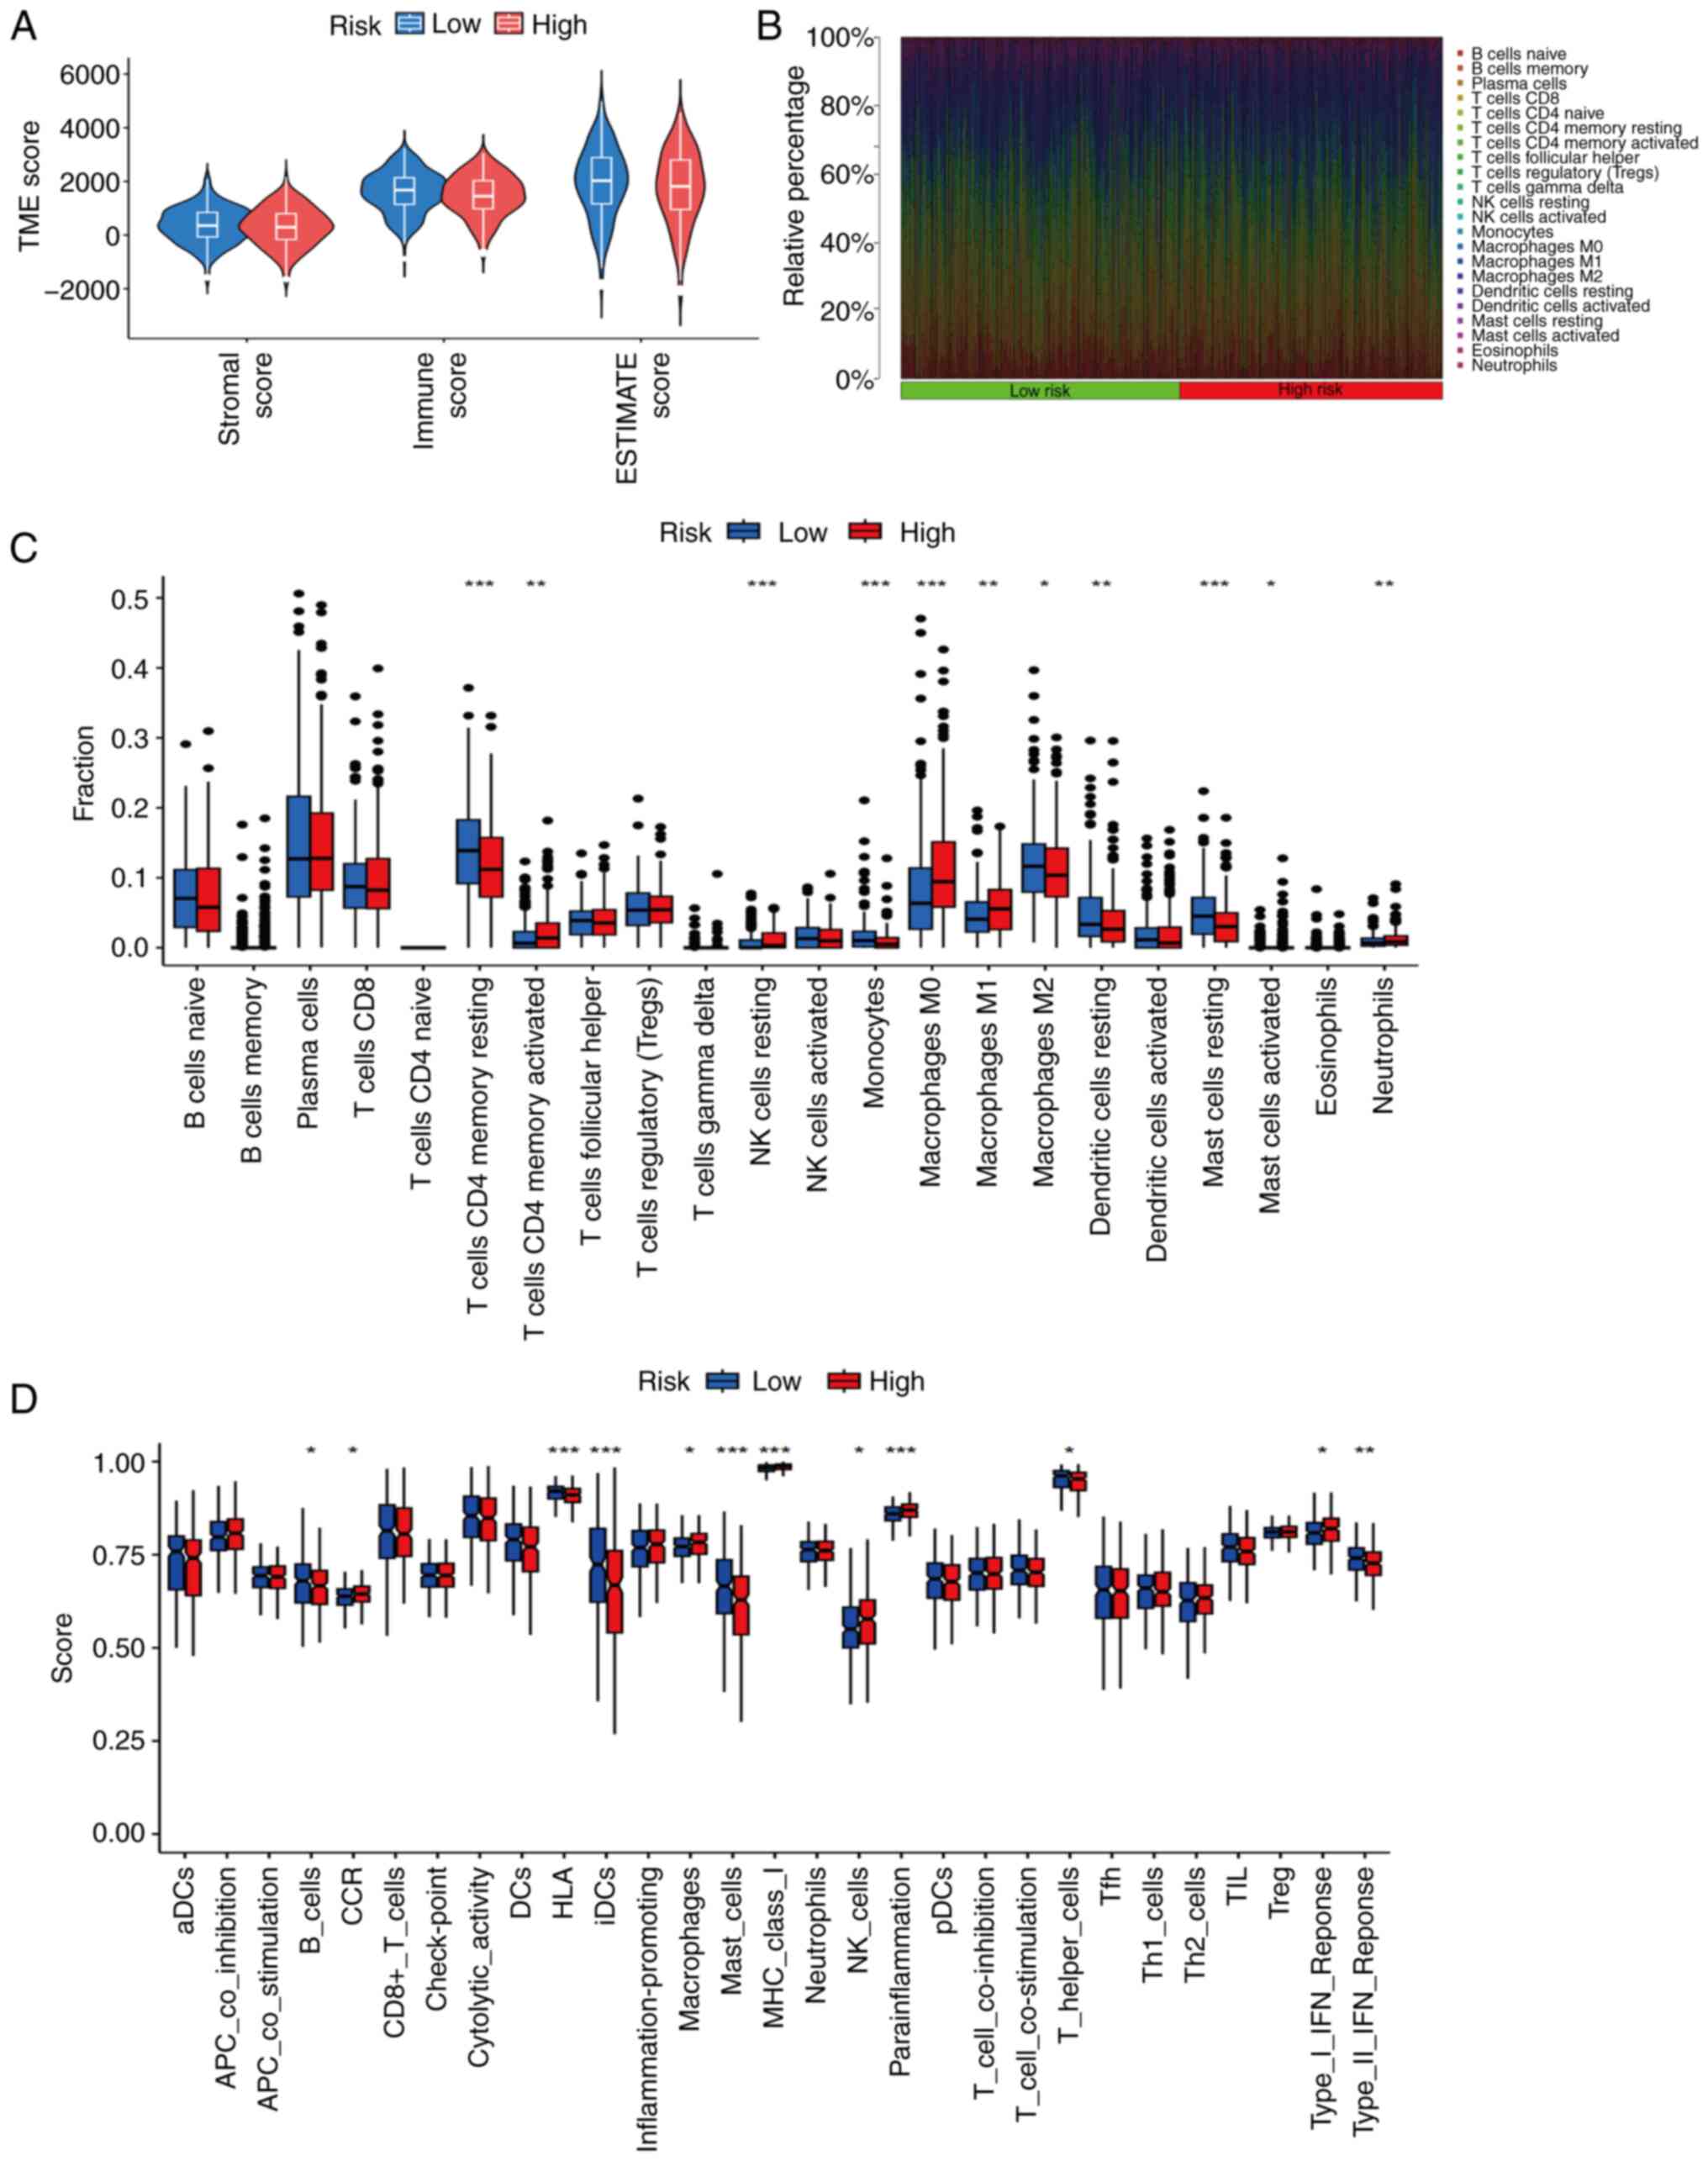
In terms of the TME, immune, ESTIMATE and stromal
scores were analyzed. The results revealed no significant
differences in TME scores between the high- and low-risk groups
(Fig. 9A). However, further
analysis detected significant differences in immune cell
infiltration between the two groups. The low-risk group exhibited
significantly higher proportions of resting CD4+ memory
T cells, monocytes, M2 macrophages, resting dendritic cells and
resting mast cells. By contrast, the high-risk group exhibited
significantly higher proportions of activated CD4+
memory T cells, resting natural killer (NK) cells, M0 macrophages,
M1 macrophages, activated mast cells and neutrophils (Fig. 9B and C). In addition, an analysis of
immune function revealed significant differences in the expression
of immune checkpoint molecules: The low-risk group was found to
have higher proportions of B cells, human leukocyte antigens,
interstitial dendritic cells, mast cells, helper T cells and type
II interferon (IFN) responses. By contrast, the high-risk group had
higher proportions of chemokine receptors, macrophages, MHC I
molecules, NK cells, parainflammatory cells and type I IFN
responses (Fig. 9D).
TMB and immune escape
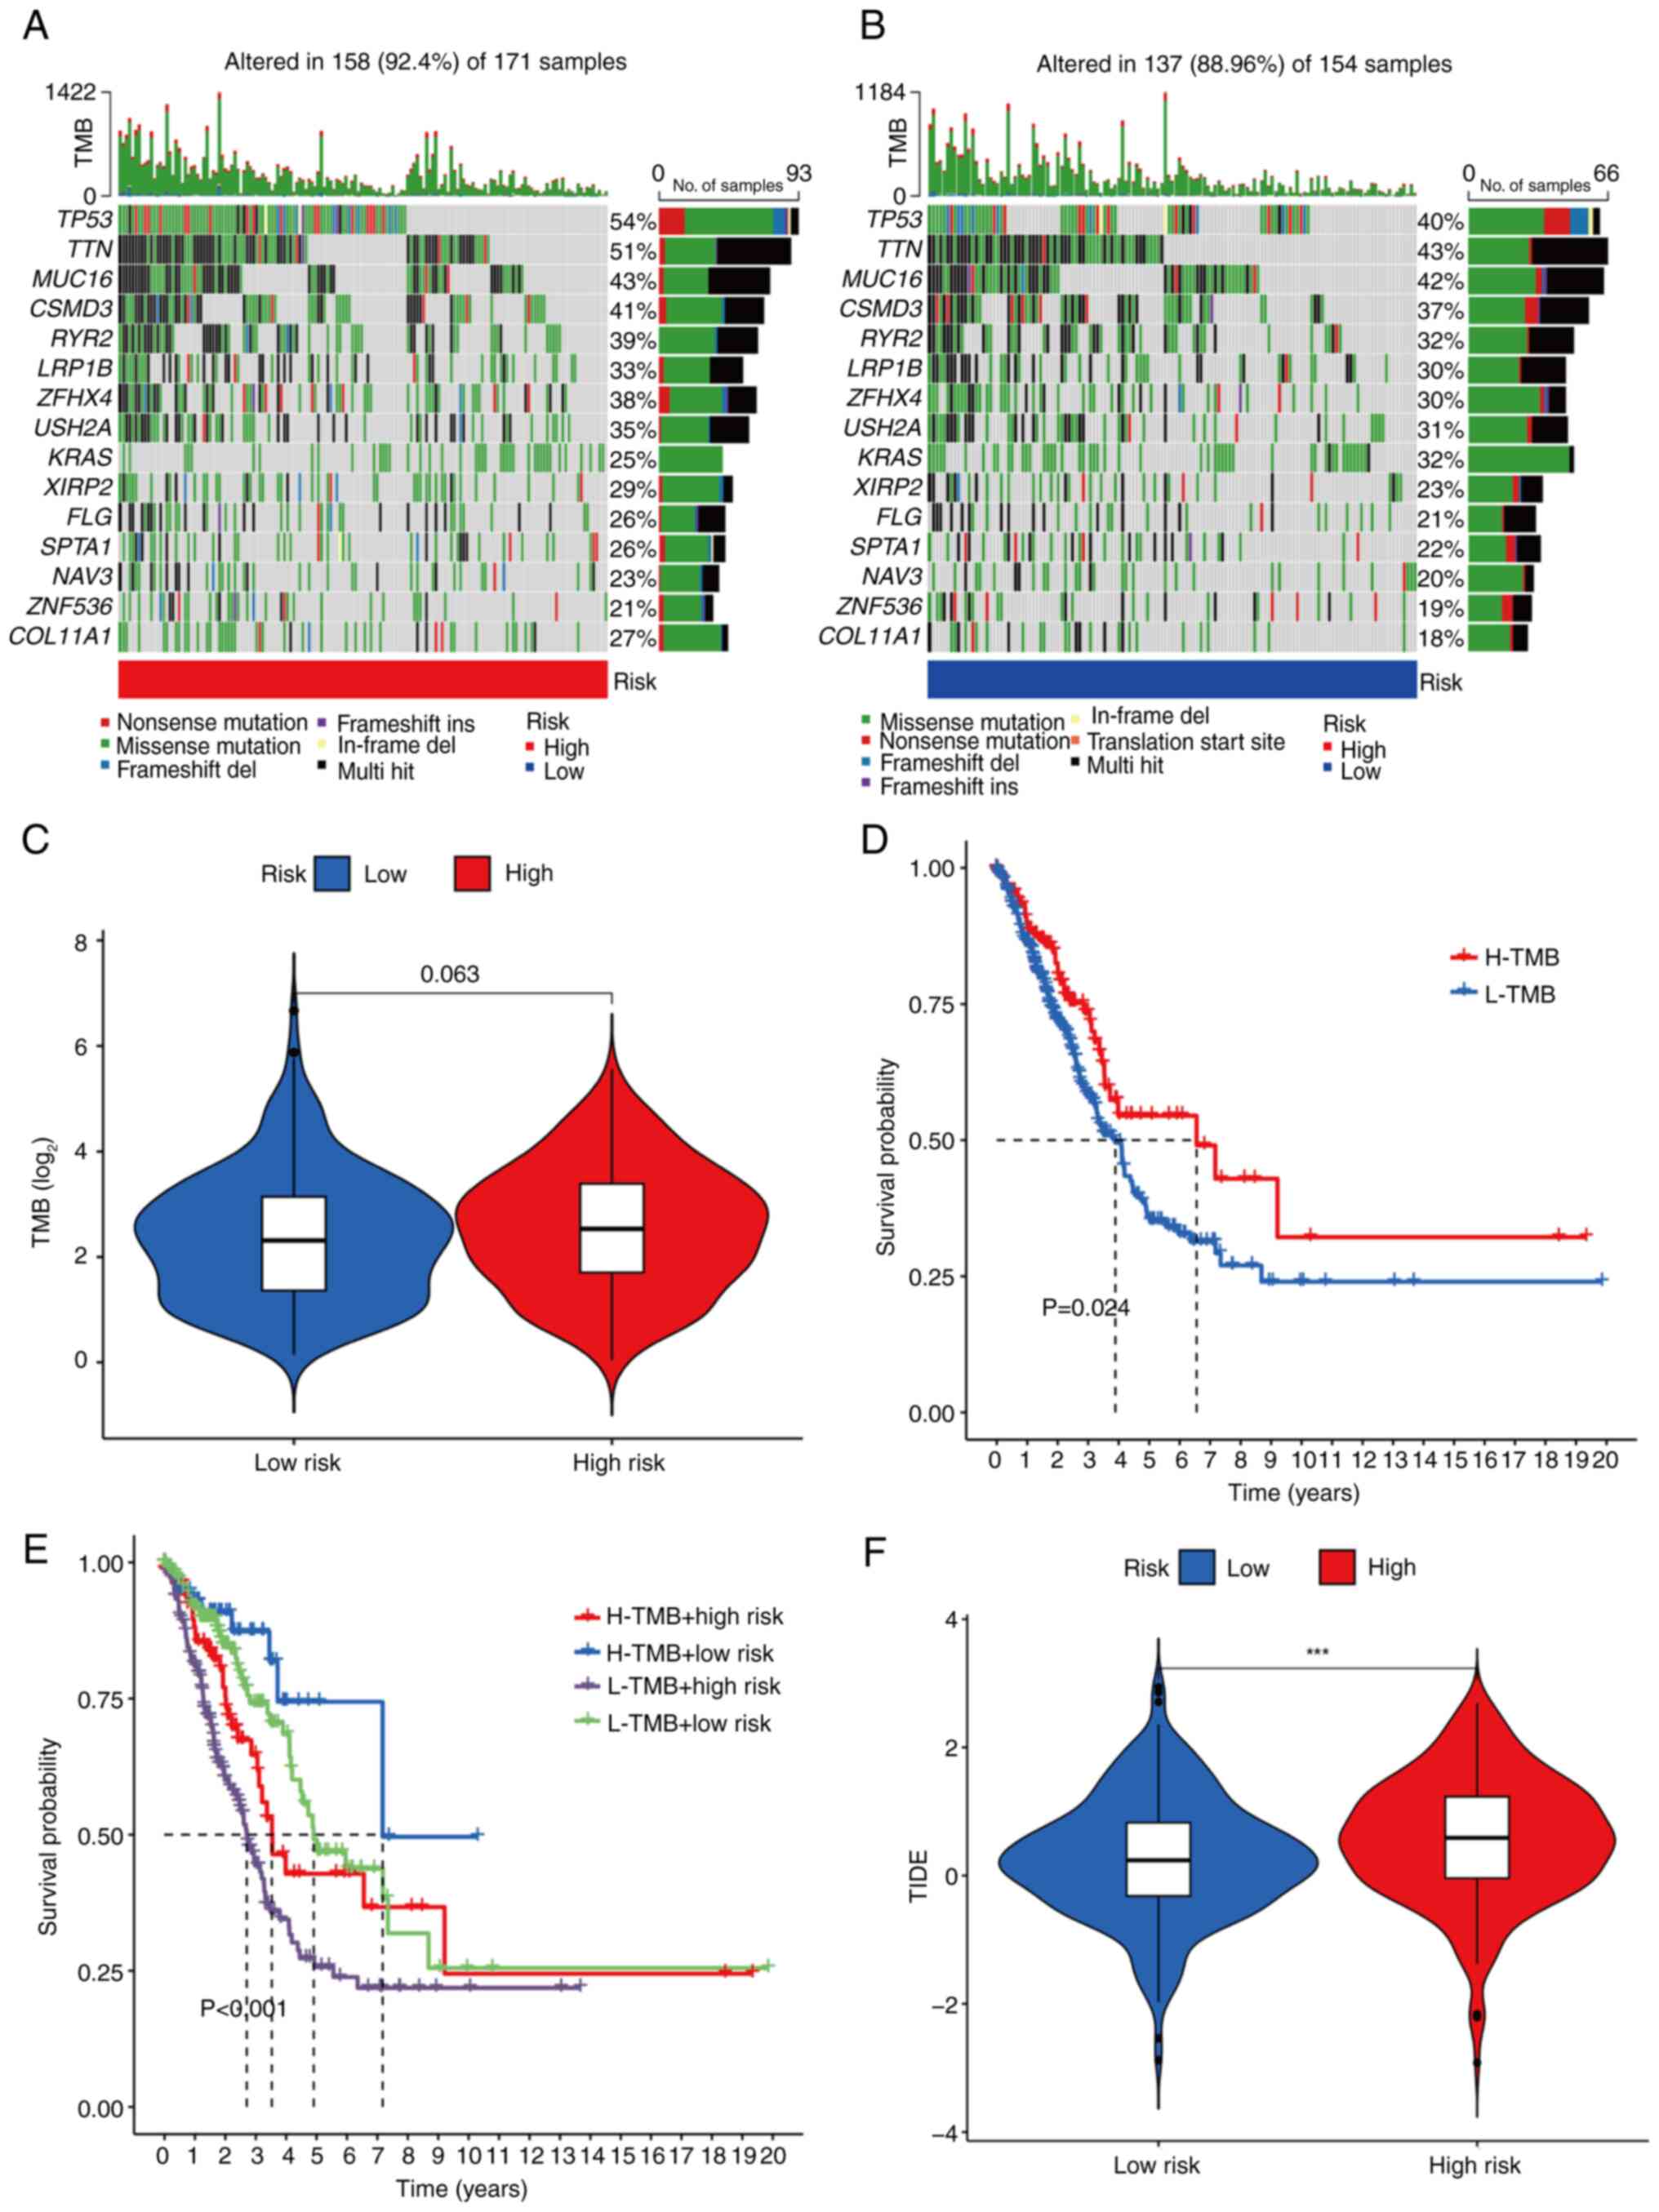
Somatic mutation data were initially collected from
TCGA database for patients with LUAD. Among the 171 samples in the
high-risk group, 158 samples (92.4%) exhibited somatic mutations,
whereas 137 of 154 samples (88.96%) in the low-risk group had
somatic mutations. Further analysis revealed that the incidence of
gene mutations in the high-risk group was higher compared with that
in the low-risk group. The top 15 genes with the highest mutation
rates were tumor protein P53 (TP53), titin (TTN), mucin 16 (MUC16),
CSMD3, RYR2, LRP1B, ZFHX4, USH2A, KRAS, XIRP2, FLG, SPTA1, NAV3,
ZNF536 and COL11A1 (Fig. 10A and
B). TMB analysis further showed that the TMB was higher in the
high-risk group compared with the low-risk group (Fig. 10C). According to the TMB value (cut
off, 7.63), patients were divided into low- and high-TMB groups. KM
survival analysis demonstrated that the OS rate of the high-TMB
group was significantly higher compared with that of the low-TMB
group (Fig. 10D). Comparative
analysis for different combinations of risk and TMB levels revealed
that the high risk + low TMB group had the poorest prognosis,
whereas the low risk + high TMB group had the best prognosis, with
statistically significant differences observed among the groups
(Fig. 10E). To assess immune
escape, TIDE scores were calculated, where a higher TIDE score is
indicative of a greater likelihood of immune escape. The results
obtained showed that the TIDE score of the high-risk group was
significantly higher compared with that of the low-risk group
(Fig. 10F). Further research,
however, is necessary to understand the differences in drug
treatment responses between the high- and low-risk groups.
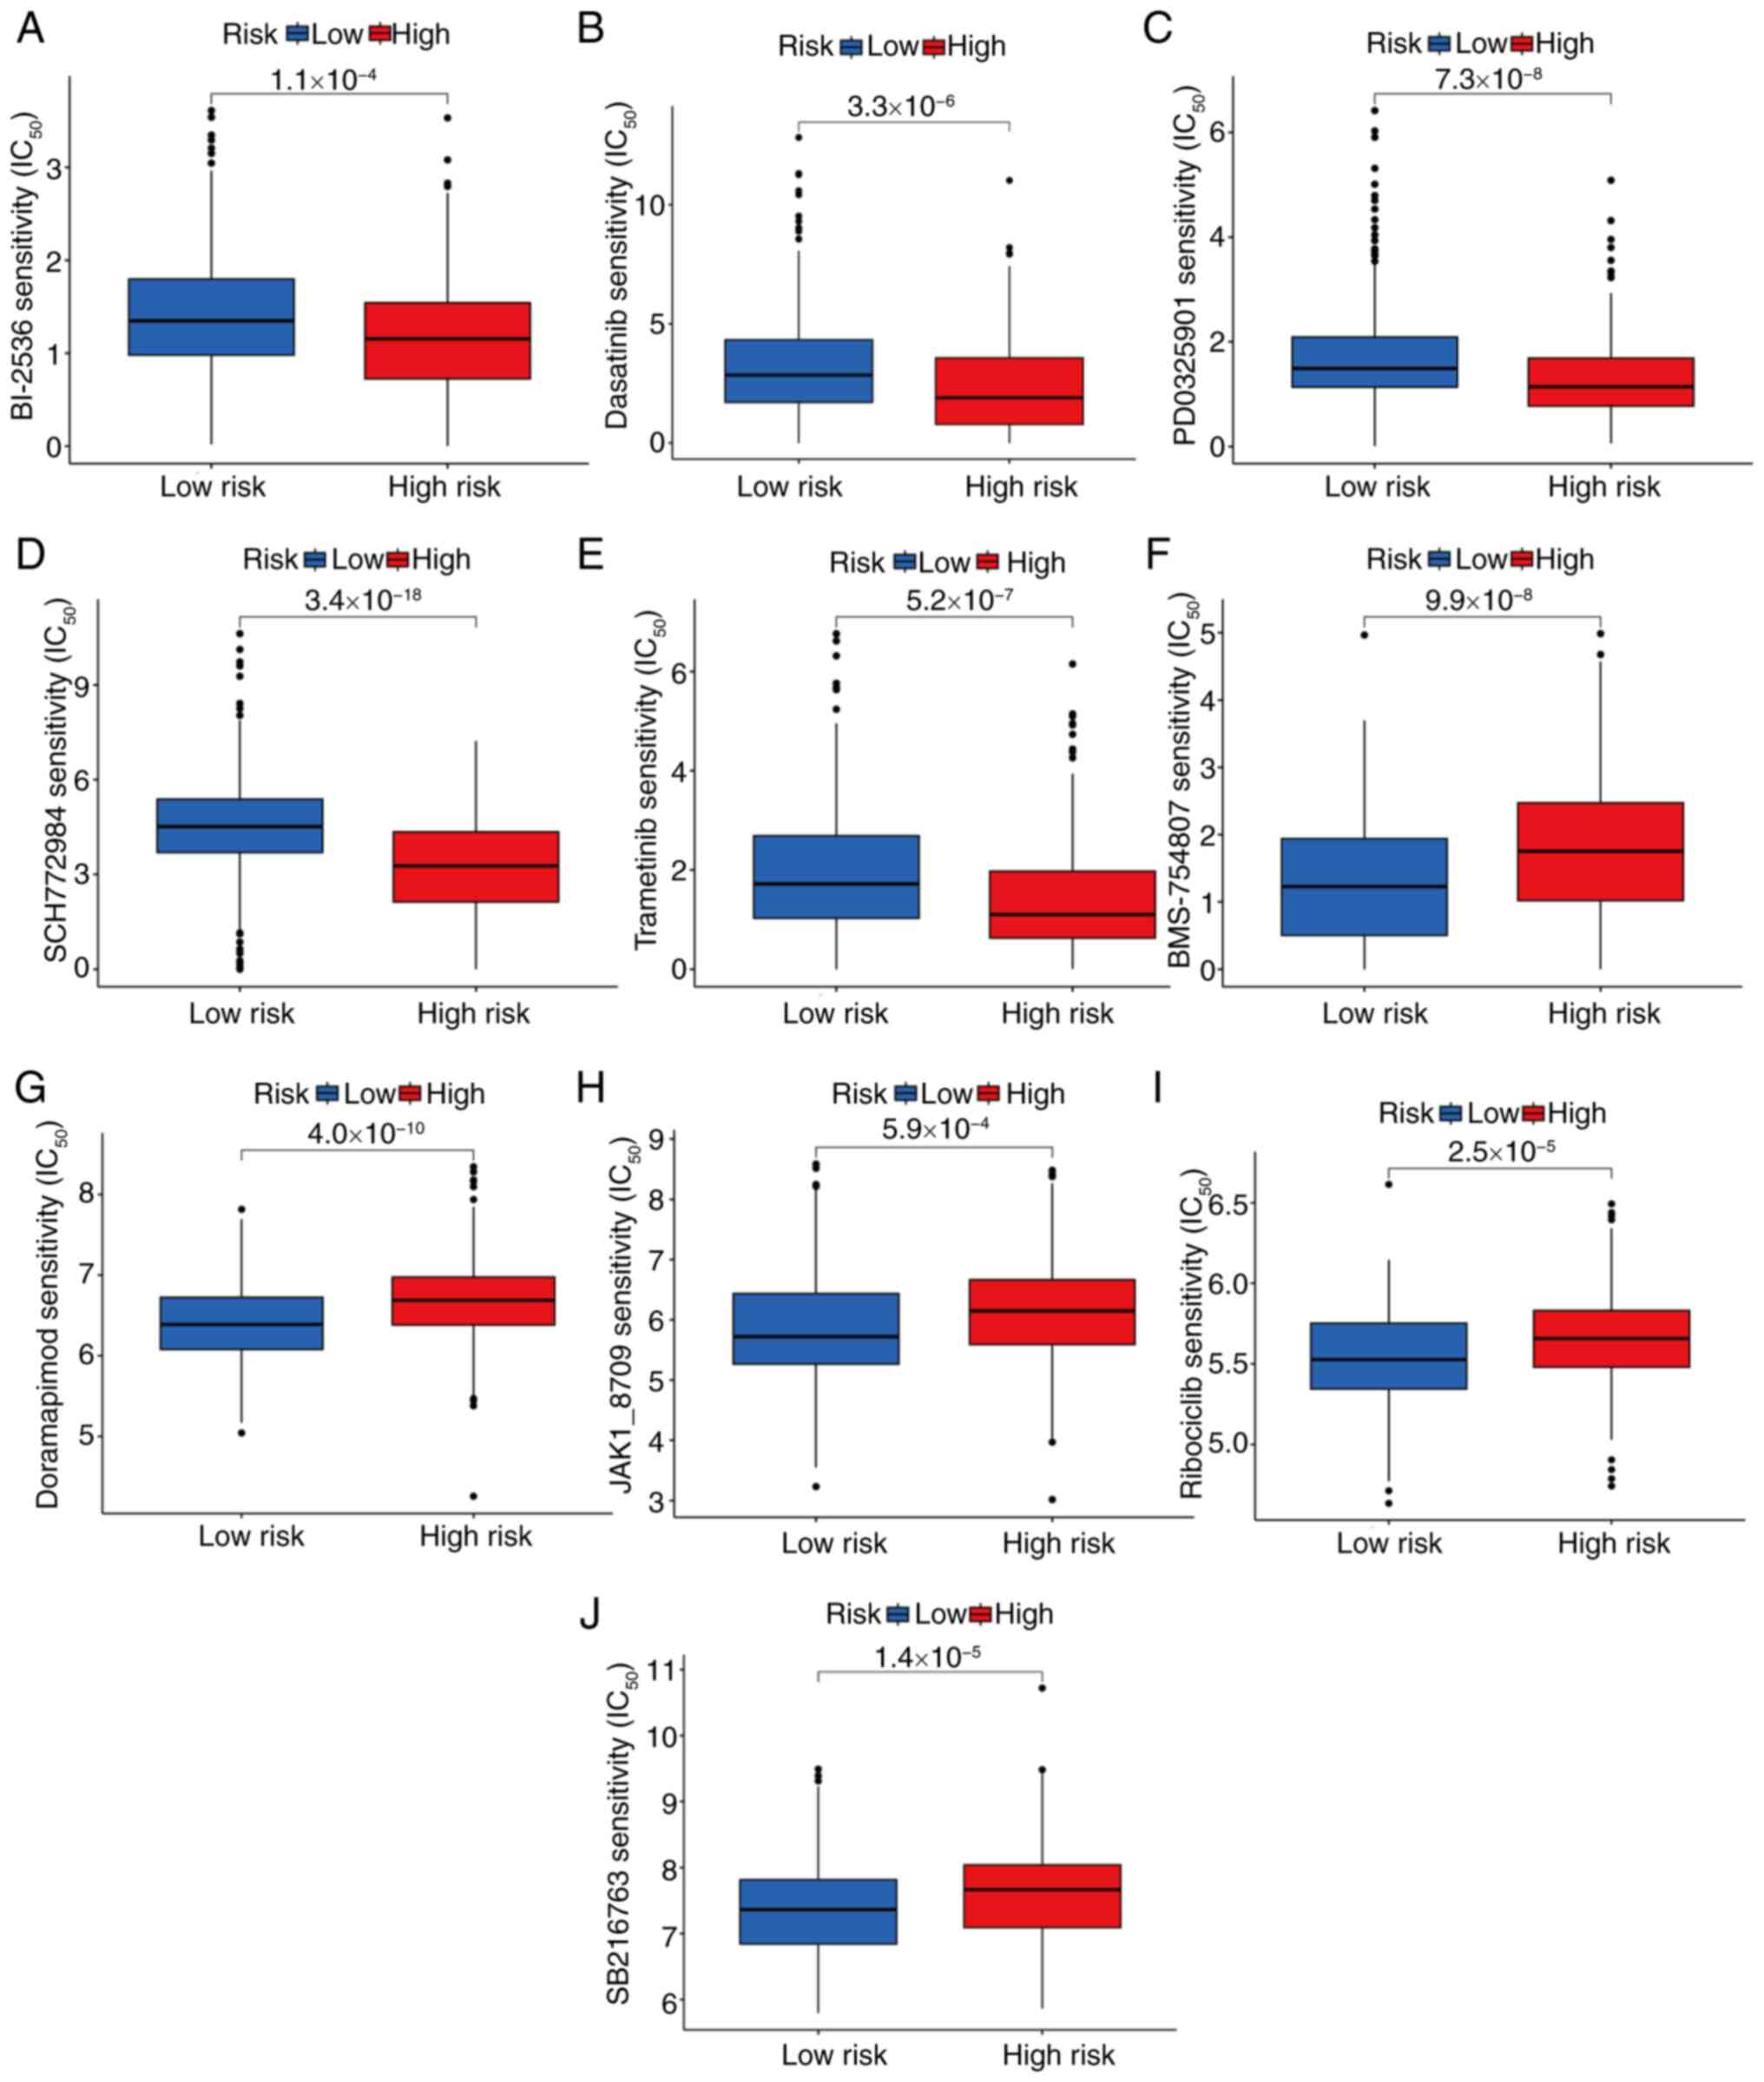
Drug-sensitivity analysis
Differences in drug sensitivity between the high-
and low-risk patient groups were investigated. Analysis of the
drug-sensitivity data revealed significant differences in
IC50 values between the two groups. Specifically, the
high-risk group demonstrated greater sensitivity to the following
drugs: BI-2536 (P=1.1×10⁻⁴; Fig. 11A), dasatinib
(P=3.3×10⁻⁶; Fig. 11B),
PD0325901 (P=7.3×10⁻⁸; Fig.
11C), SCH772984 (P=3.4×10⁻¹⁶; Fig. 11D) and trametinib
(P=5.2×10⁻⁷; Fig. 11E).
By contrast, the low-risk group exhibited higher sensitivity to
BMS-754807 (P=9.99×10⁻⁸; Fig. 11F), doramapimod
(P=4.0×10⁻¹⁰; Fig.
11G), JAK1-8709 (P=5.9×10⁻⁴; Fig. 11H), ribociclib
(P=2.5×10⁻⁵; Fig. 11I)
and SB216763 (P=1.4×10⁻⁵; Fig. 11J).
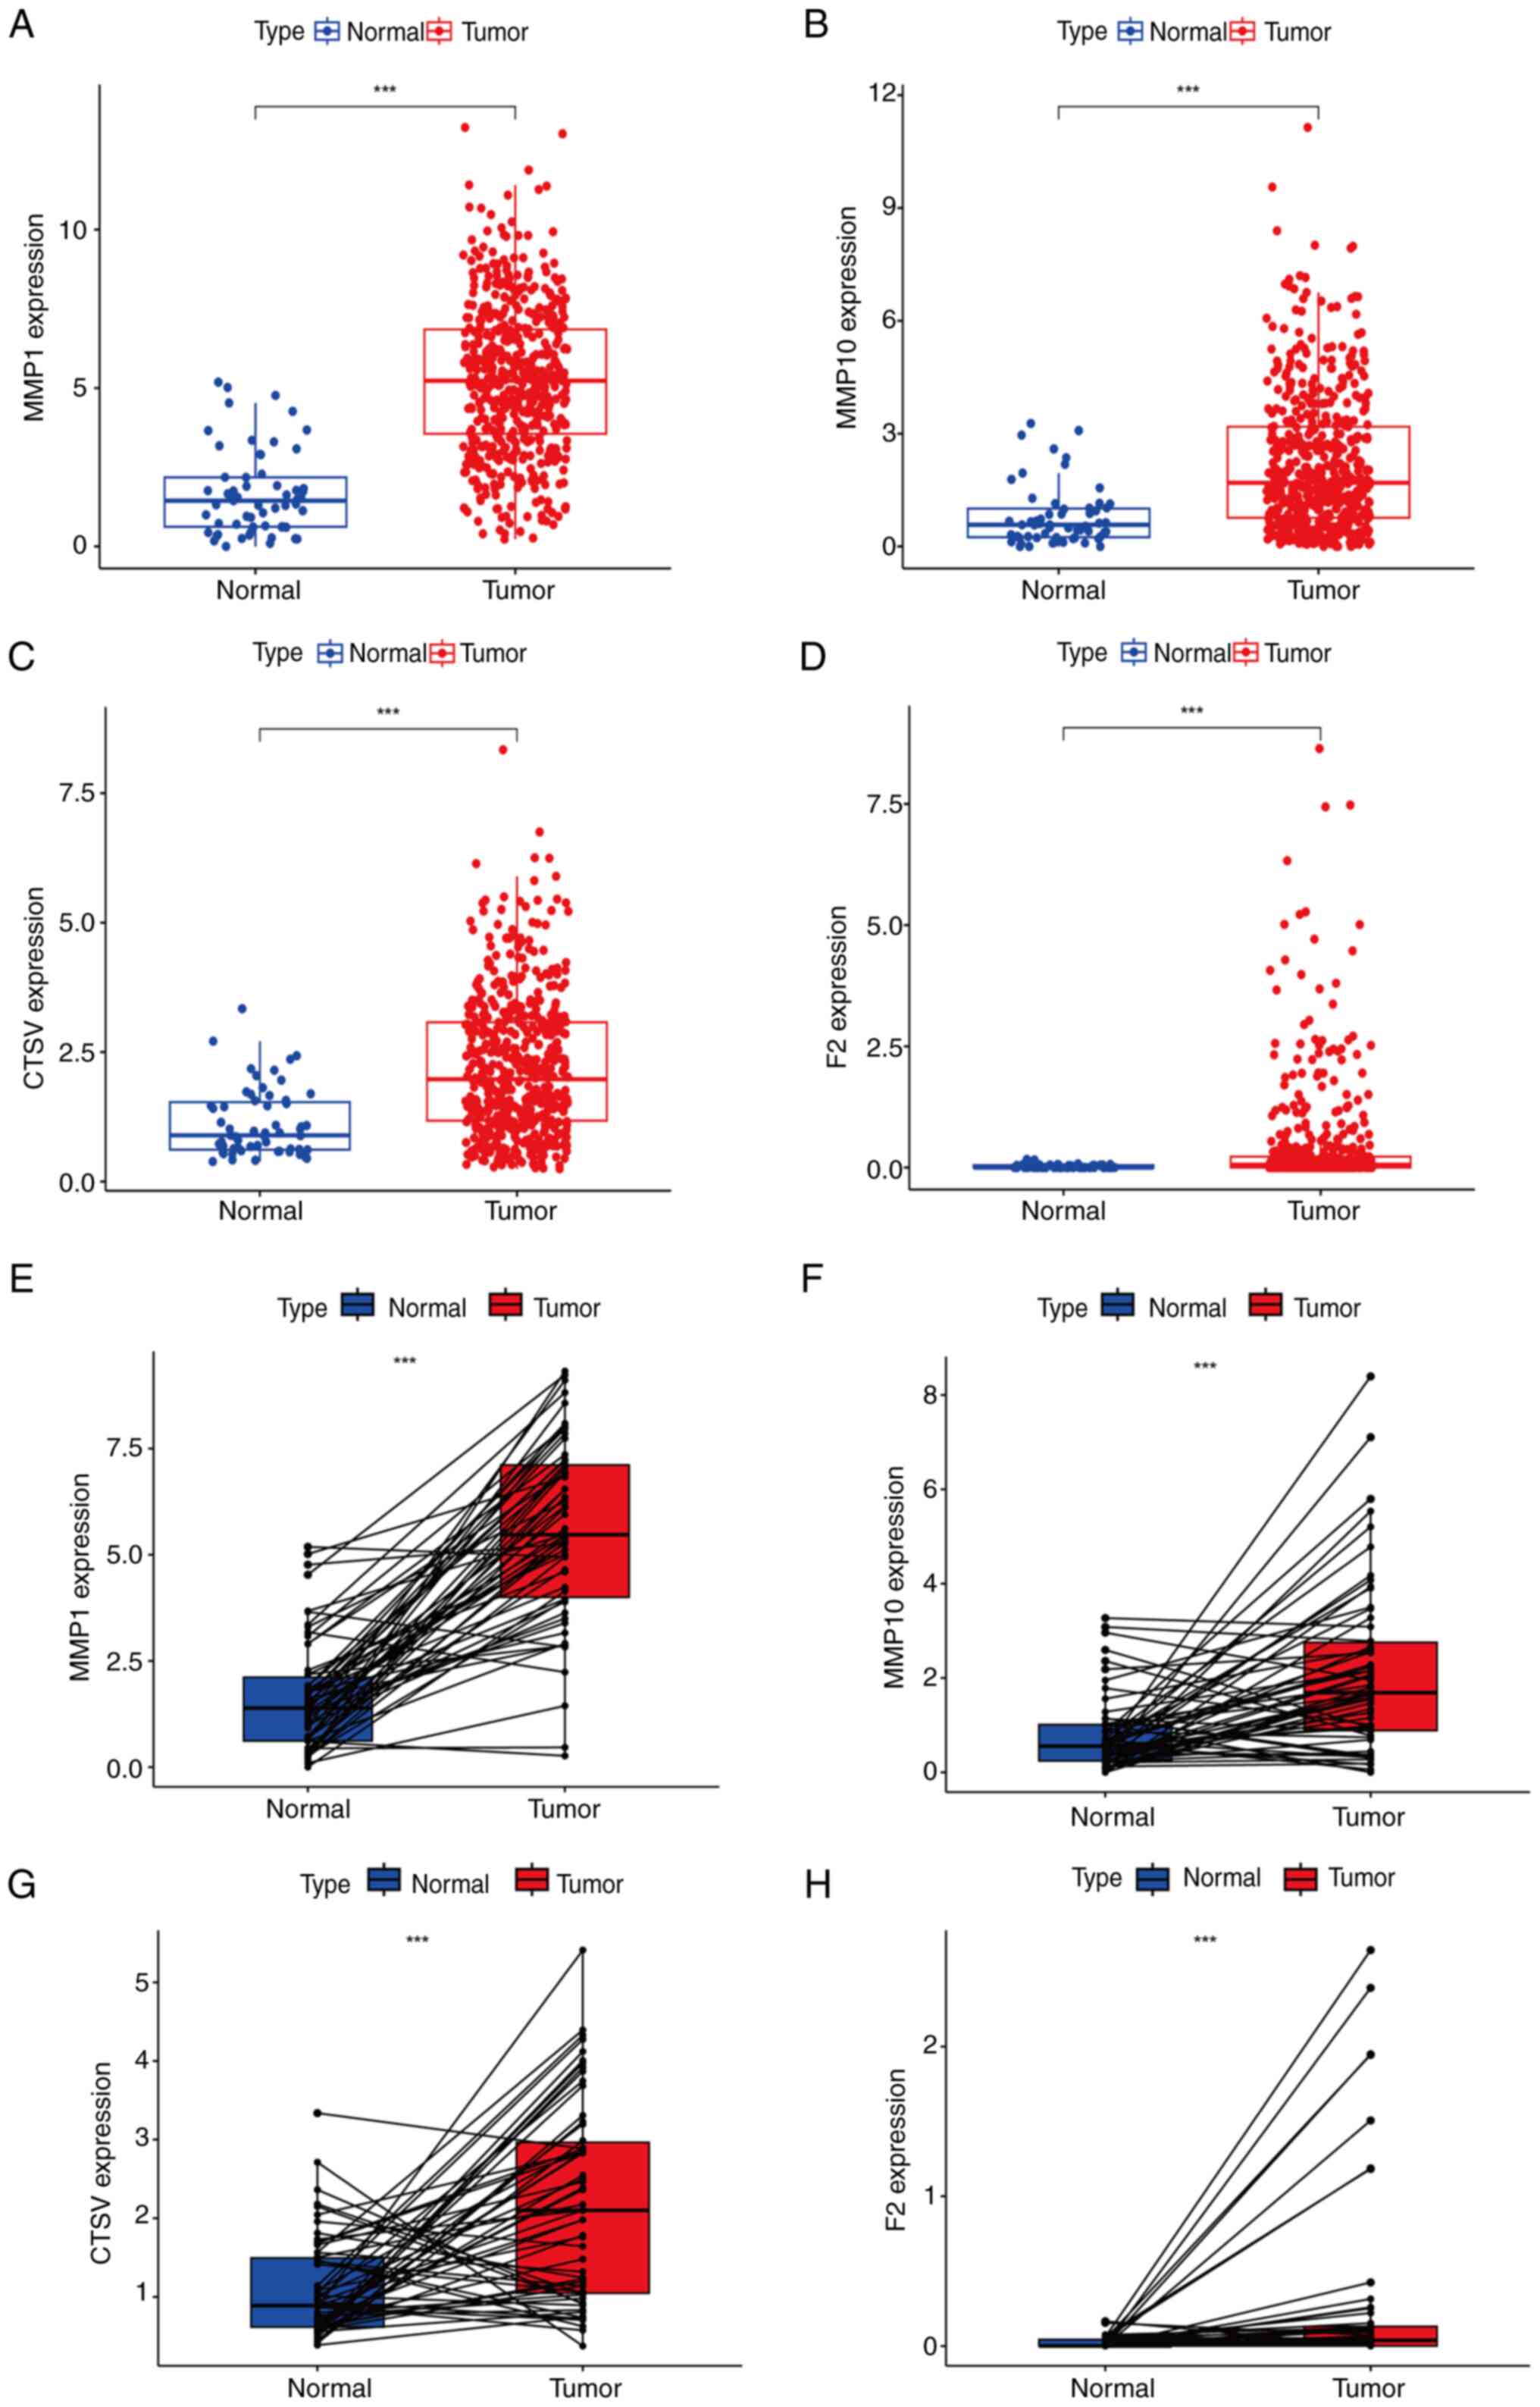
Verification of the CRG expression
levels
Subsequently, samples from TCGA database were
utilized to assess the expression levels of MMP1, MMP10, CTSV and
F2 in normal and LUAD tissues. Analysis using the Mann-Whitney U
test revealed that the expression of these genes in LUAD tissue was
significantly higher compared with that in normal lung tissue
(Fig. 12A-D). Wilcoxon signed-rank
analysis further confirmed significant differences in the
expression of these genes between the two types of tissues
(Fig. 12E-H), supporting the
high-risk status of these genes. To validate these findings, IHC
results from the HPA database were compared between LUAD and normal
lung tissues. The protein expression levels of MMP10, CTSV and F2
were observed to be markedly higher in LUAD tissues compared with
normal tissues (Fig. 13A). The HPA
database did not include IHC data for MMP1, so its protein
expression level could not be assessed. Additionally, RT-qPCR
experiments were performed to further verify the accuracy of the
CRG diagnostic model. The mRNA expression levels of MMP10, CTSV,
MMP1 and F2 were found to be upregulated in primary tumor tissues
compared with normal tissue (Fig.
13B). Furthermore, the mRNA levels of MMP10, CTSV and F2 were
found to be significantly higher in the LUAD cell line A549
compared with the BEAS-2B cell line (Fig. 13C). Taken together, these findings
corroborate the bioinformatics analysis results from TCGA
database.
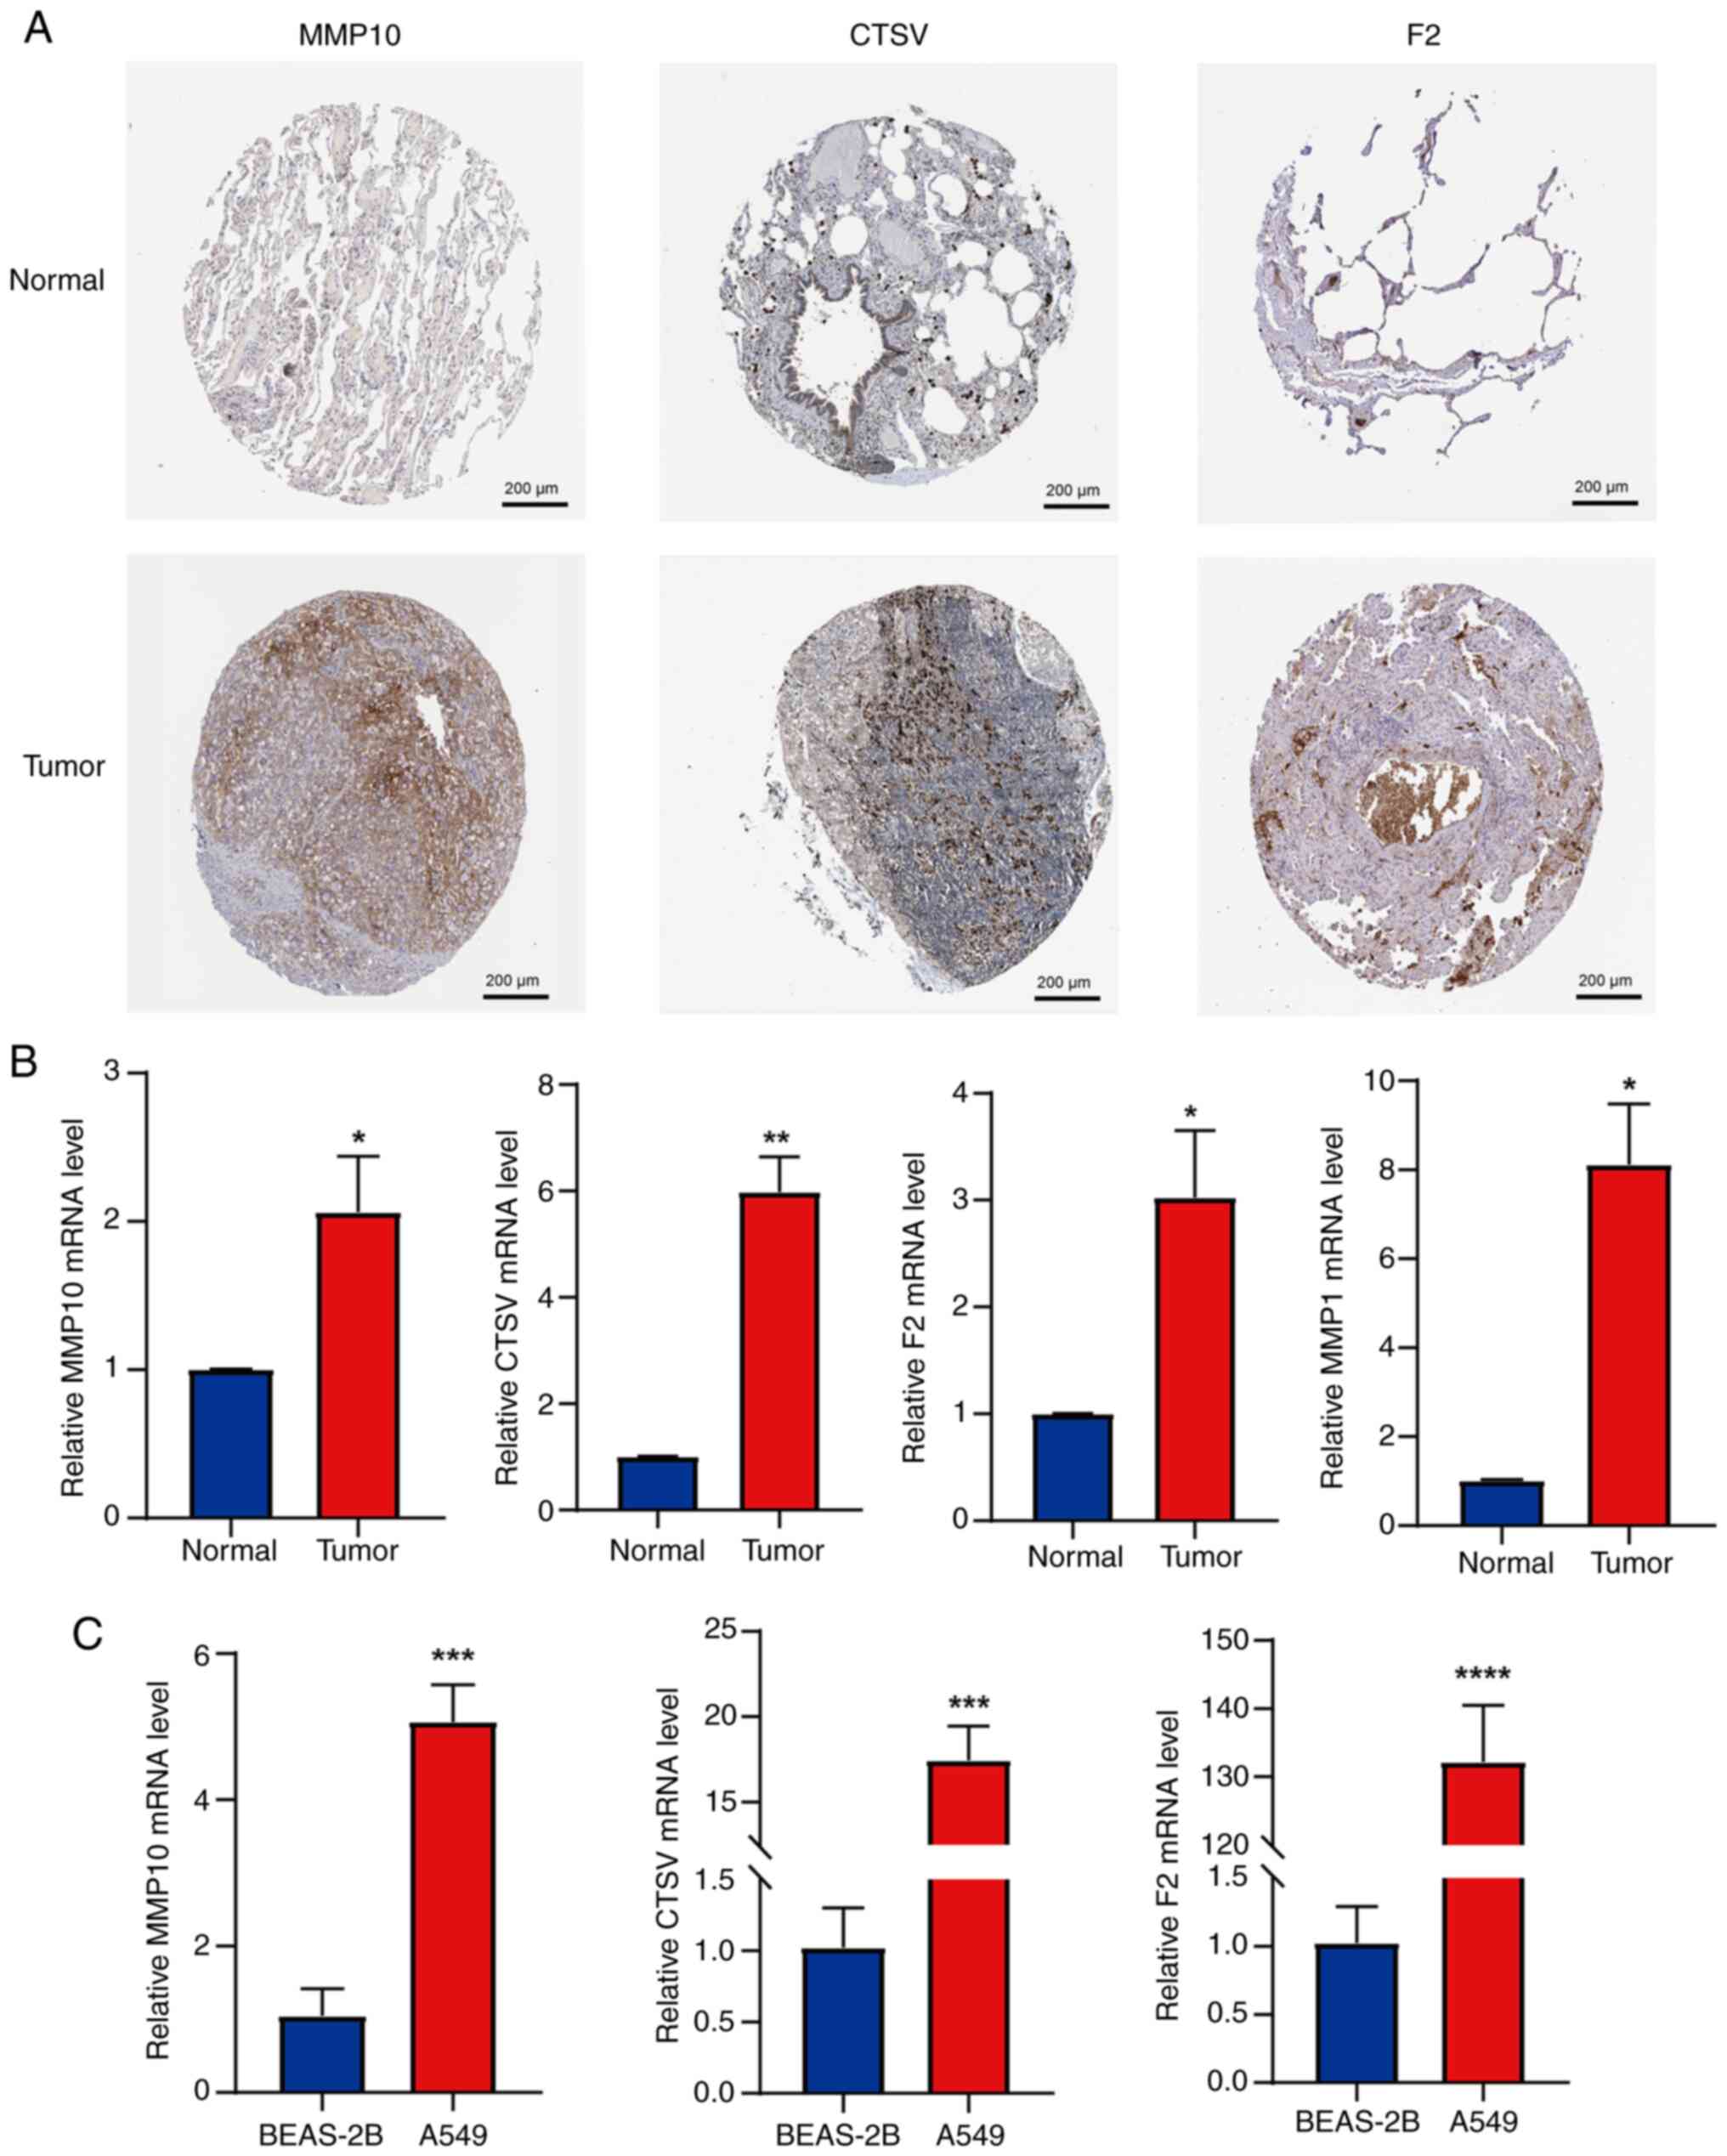 | Figure 13.Validation of the expression levels
of genes in the prognostic model using images from the HPA database
and RT-qPCR analysis. (A) Immunohistochemical staining images of
MMP10, CTSV and F2 in LUAD and normal lung tissue from the HPA
database; magnification, ×100. (B) mRNA expression levels of MMP10,
CTSV, F2 and MMP1 in primary LUAD and peritumoral lung tissues,
measured by RT-qPCR. (C) mRNA expression levels of MMP10, CTSV and
F2 in LUAD and normal bronchial epithelial cell lines, assessed
using RT-qPCR. Results are presented as mean ± standard deviation.
*P<0.05, **P<0.01, ***P<0.001 and ****P<0.0001 vs.
normal or BEAS-2B. HPA, Human Protein Atlas; RT-qPCR, reverse
transcription-quantitative PCR; MMP, matrix metalloproteinase;
CTSV, cathepsin V; F2, thrombin/coagulation factor II. |
Discussion
The coagulation system maintains a delicate balance
between clotting and bleeding under physiological conditions,
although this balance is disrupted in disease states (16). The systemic activation of hemostasis
and thrombosis in patients with malignancies has been shown to be
closely associated with tumor occurrence, progression and
metastasis (17,18). A review of numerous studies revealed
that approximately half of patients with malignancies exhibit
coagulation abnormalities, and this proportion rises to as high as
90% in patients with metastasis (19). There is a close interplay between
tumor activation and the coagulation system, which is crucial for
advancing our understanding of cancer biology and cancer-associated
thrombosis, particularly the role of tissue factor. The coagulation
system plays an important role in tumor formation, cell migration,
vascular invasion, extravasation and distant metastasis in LUAD
(20). Therefore,
coagulation-associated biomarkers hold great potential for
prognostication.
In the present study, four key prognostic CRGs,
namely MMP1, MMP10, CTSV and F2, were identified and used to
construct a prognostic signature for patients with LUAD. This
predictive model may serve as a valuable tool in the differential
diagnosis of lung cancer and its mimickers, such as those reported
by Neacşu et al (21).
However, only a handful of studies have highlighted the roles
played by these four genes during the progression of LUAD. MMP1,
which was recognized as a high-risk gene in the present study, is
mainly located in the mitochondria, where it suppresses
mitochondrial respiration, increases hypoxia-inducible factor-1
expression, and reduces the production of reactive oxygen species
(22). MMP1 has been shown to
promote the progression of several types of tumors, including
cutaneous squamous cell carcinoma, hepatocellular carcinoma and
colorectal cancer (23–25). In addition, Guo et al
(26) found that wogonin inhibits
lung cancer progression by regulating MMP1 and the PI3K/Akt
signaling pathway. MMP10 (27),
another high-risk gene, is involved in various pathological and
physiological processes, including colitis-associated cancer,
hepatocellular carcinoma and breast cancer (28–30).
In addition, previous evidence has shown that MMP10 regulates NSCLC
radiosensitivity via the DNA damage repair pathway (31). Therefore, MMP10 may play an
important role in NSCLC and could help determine indications for
radiotherapy. The third high-risk gene, CTSV, is a cysteine
protease, with an active form present in the cytoplasm, nucleus and
plasma membrane. It contributes to the degradation of specific
components of the extracellular matrix, and has been implicated in
the progression of various types of cancer (32–34).
In addition, Zhu et al (35)
found that CSTV promotes the development of lung cancer by
modulating the immunosuppressive microenvironment and cleaving
adhesion molecules. The fourth high-risk gene, F2, encodes the
serine protease thrombin. Elevated levels of thrombin not only
promote blood coagulation but also facilitate tumor growth and
metastasis. Therefore, thrombin and its precursor factors have
emerged as potential targets for the treatment of malignant tumors
and tumor-associated thrombosis (36). Furthermore, F2 has also been found
to be associated with immune infiltration and poor prognosis in
various types of tumors, including LUAD and breast cancer (37). The present study indicates that the
four genes are all upregulated in LUAD tissues and function as
tumor oncogenes, which is consistent with previous findings.
Furthermore, an innovative predictive model incorporating these
four genes has been developed in the present study to assess the
prognosis of LUAD. This model provides valuable insights for the
prognosis assessment and treatment of LUAD, and potentially other
tumor types.
Alterations in the TME are critical in LUAD
progression (38). The quantity and
characteristics of tumor-infiltrating lymphocytes serve as
important predictors of prognosis and treatment response in cancers
such as oral squamous cell carcinoma and epithelial ovarian cancer
(39–41). In the present study, significant
differences in immune cell composition were observed between the
high- and low-risk groups. Specifically, the low-risk group
exhibited higher proportions of resting CD4+ memory T
cells, monocytes, M2 macrophages, resting dendritic cells and
resting mast cells. By contrast, the high-risk group exhibited
higher proportions of activated CD4+ memory T cells,
resting NK cells, M0 macrophages, M1 macrophages, activated mast
cells and neutrophils. A number of studies have investigated the
antitumor functions of CD4+ T memory cells (42–44),
and their presence has been significantly associated with an
improved prognosis in various types of cancer (45–47).
The role of NK cells in antitumor activity, exerted through their
cytotoxic effects, has been established (48). However, M0 macrophages have been
identified as independent predictive factors of poor outcomes in
patients with pancreatic ductal adenocarcinoma (49). Previous studies have reported
similar findings to those of the present study, supporting the
accuracy of the current model (50,51).
In the present study, the low-risk group exhibited enhanced immune
cell infiltration and immune function activation, indicative of a
more responsive and active antitumor immune system. By contrast,
the high-risk group was indicated to have a more immunosuppressive
TME, leading to a weaker immune response and potential resistance
to immunotherapy. These differences in immune profiles and TME
characteristics highlight the greater potential of the low-risk
group for improved treatment outcomes, particularly with
immunotherapy. These insights into the associations between risk
groups, TME and immune function are valuable for understanding LUAD
immunology and may assist in the development of personalized
treatment strategies.
In the present study, the mutation rate in the
high-risk group was significantly higher compared with that in the
low-risk group. Notably, the mutation frequencies of TP53, TTN and
MUC16 were significantly different between the two groups.
Mutations in the TP53 tumor suppressor gene are the most common in
human malignancies, particularly in NSCLC (52). In the present study, the analysis of
227 patients with LUAD revealed that differences in mutation rates
between the high- and low-risk groups were primarily attributable
to TP53 gene mutations. These mutations are typically associated
with extensive tumor invasion and poor prognosis (53). Notably, several drugs have been
confirmed to treat malignancies by inhibiting the TP53 signaling
pathway (54). Similarly, TTN plays
a crucial role in the development and progression of various
tumors. In LUAD, the long non-coding RNA TTN-AS1 has been shown to
promote cell invasion and migration (55). In the present study, the mutation
rate of MUC16 was significantly higher in the low-risk group than
in the high-risk group, suggesting that MUC16 may serve as a
protective mutation in LUAD, a conclusion supported by findings in
other tumor types. For example, in ovarian cancer, high expression
of MUC16 has been demonstrated to have a significant antitumor
effect (56). In addition, MUC16 is
considered a potential therapeutic target in pancreatic cancer
(57). An observational study of
patients with LUAD revealed that MUC16 is significantly associated
with a higher TMB and improved clinical prognosis (58), findings that are consistent with
those of the present study. However, the specific mechanism of
action of MUC16 requires further investigation. Genetic mutations
serve as critical targets for the treatment of malignancies. In the
present study, mutations in TP53, TTN and MUC16 were particularly
important when comparing the high- and low-risk LUAD groups.
Specifically, TP53 and TTN mutations play important roles in tumor
progression and invasion in LUAD, whereas MUC16 may act as a
protective mutation, although this warrants further investigation.
Collectively, these findings offer novel insights for targeted
therapies in patients with LUAD, and potential strategies for
improving patient prognosis.
Immune checkpoint inhibitors (ICIs) have emerged as
efficacious immunotherapies for different types of cancer. By
targeting molecules such as programmed death 1 (PD-1)/PD-ligand 1
(PD-L1) and cytotoxic T-lymphocyte associated protein 4, they boost
antitumor responses and counteract tumor immune evasion (59,60).
TMB is a key predictive factor of ICI response (61–63),
with higher TMB being associated with improved efficacy of
PD-1/PD-L1 inhibitors (64). An
association between high TMB and improved ICI treatment outcomes
has also been observed (65). In
addition, the TIDE score has been shown to be useful for assessing
the response to immunotherapy and the immune evasion capacity of
tumors (66). In the present study,
the TIDE score in the high-risk group was significantly higher
compared with that in the low-risk group, suggesting a stronger
tendency for immune evasion in high-risk patients, which may affect
treatment outcomes. In addition, the patients with LUAD and high
TMB exhibited longer OS times. However, the cross-validation of TMB
with risk scores revealed that patients in the high-risk group with
low TMB had significantly poorer OS outcomes. These findings
underscore the importance of considering TMB and its interaction
with risk scores when evaluating the immune response and predicting
treatment outcomes in LUAD. This information is vital for guiding
personalized treatment decisions, and for optimizing patient
prognosis in the context of immunotherapy.
In the analysis of drug sensitivity, the response of
patients with LUAD in different risk groups to anticancer agents
was evaluated, which provides insights into personalized treatment
strategies. The results demonstrated that the IC50
values of BI-2536 (67), dasatinib
(68), PD0325901 (69), SCH772984 (70) and trametinib (71) were significantly lower in the
high-risk group than in the low-risk group, suggesting that
patients in the high-risk group may exhibit more favorable
therapeutic responses to these agents. By contrast, BMS-754807
(72), doramapimod (73), JAK1_8709 (74), ribociclib (75) and SB216763 (76) exhibited superior efficacy in the
low-risk group. These findings provide novel insights into the
pharmacotherapy for patients with high- and low-risk LUAD. By
matching the most suitable anticancer drugs with different patient
types, the present study has the potential to facilitate more
precise and effective treatment strategies. Although these drugs
are suggested to have considerable therapeutic potential, the
specific mechanisms underlying their action and actual efficacy in
LUAD require further investigation.
The present study had certain limitations. The data
were mainly derived from TCGA and lacked validation with external
datasets, which may introduce some bias. In addition, the data did
not follow a normal distribution. In subsequent research, a more
detailed analysis of data distribution characteristics will be
conducted, to enhance the scientific rigor of the research methods
and the reliability of the results. Furthermore, although RT-qPCR
analysis confirmed that MMP1, MMP10, F2 and CTSV are highly
expressed in LUAD tissues, the sample size was limited. In future
studies, it is planned to increase the sample size, conduct more
comprehensive clinical validations, and perform in vivo and
in vitro experiments to further evaluate the performance of
the present model as an independent predictor of survival in
real-world clinical settings.
In summary, the present study developed a new
CRG-based model, by integrating bioinformatics analyses of
immune-related indicators and tumor mutations to predict potential
drug sensitivities across different patient subgroups. This model
serves as a novel index for predicting treatment efficacy and
prognosis in patients with LUAD. Future validation of the model
using primary data is essential to confirm its reliability,
accuracy and practicality in a clinical setting. This will involve
conducting large-scale, multi-center clinical trials to test the
performance of the model in diverse patient populations and
real-world scenarios, and indicate its potential to guide
individualized treatment strategies.
Supplementary Material
Supporting Data
Acknowledgements
Not applicable.
Funding
This study was financially supported by the Shandong Province
Medical and Health Development Plan (grant no. 202304020860) and
Jinan Municipal Health Commission Science and Technology
Development Plan Project (grant no. 2024302003).
Availability of data and materials
The data generated in the present study may be
requested from the corresponding author.
Authors' contribution
LZ and XS conceived and designed the research. JL
and XG prepared the manuscript and figures. LL performed the
acquisition and analysis of bioinformatic data. XG, JL, YH and HZ
performed experiments, LZ and XS revised the manuscript. LZ and XS
confirm the authenticity of all the raw data. All authors read and
approved the final version of the manuscript.
Ethics approval and consent to
participate
Human lung cancer tissues and paired adjacent
noncancerous lung tissues were obtained from three patients
undergoing lung resection. The study was approved by the
Institutional Review Board (IRB) of Jinan Central Hospital
(approval no. 20241120026). All subjects signed an IRB-approved
informed consent form prior to enrollment in the study.
Patient consent for publication
Not applicable.
Competing interests
The authors declare that they have no competing
interests.
References
|
1
|
Sung H, Ferlay J, Siegel RL, Laversanne M,
Soerjomataram I, Jemal A and Bray F: Global cancer statistics 2020:
GLOBOCAN estimates of incidence and mortality worldwide for 36
cancers in 185 countries. CA Cancer J Clin. 71:209–249. 2021.
View Article : Google Scholar : PubMed/NCBI
|
|
2
|
Hirsch FR, Scagliotti GV, Mulshine JL,
Kwon R, Curran WJ Jr, Wu YL and Paz-Ares L: Lung cancer: Current
therapies and new targeted treatments. Lancet. 389:299–311. 2017.
View Article : Google Scholar : PubMed/NCBI
|
|
3
|
Zhang M, Yang C, Dong W, Zhao Y, Chen N
and Gao C: Expression patterns and prognostic role of m6A RNA
methylation regulators in Non-small Cell Lung Cancer. Cell Mol Biol
(Noisy-le-grand). 70:67–72. 2024. View Article : Google Scholar : PubMed/NCBI
|
|
4
|
Zheng X, Qiu L, Huang Y, Cheng R, Huang S,
Xu K, Cai W, Deng Y, Wang W, Zhong X, et al: Exploring the
molecular and Immune-landscape of lung cancer associated with
cystic airspaces. Mol Immunol. 168:75–88. 2024. View Article : Google Scholar : PubMed/NCBI
|
|
5
|
Hamza MS and Mousa SA: Cancer-Associated
Thrombosis: Risk factors, molecular mechanisms, future management.
Clin Appl Thromb Hemost. 26:10760296209542822020. View Article : Google Scholar : PubMed/NCBI
|
|
6
|
Korte W: Changes of the coagulation and
fibrinolysis system in malignancy: Their possible impact on future
diagnostic and therapeutic procedures. Clin Chem Lab Med.
38:679–692. 2000. View Article : Google Scholar : PubMed/NCBI
|
|
7
|
Mulder FI, Horváth-Puhó E, van Es N, van
Laarhoven HWM, Pedersen L, Moik F, Ay C, Büller HR and Sørensen HT:
Venous thromboembolism in cancer patients: A Population-based
cohort study. Blood. 137:1959–1969. 2021. View Article : Google Scholar : PubMed/NCBI
|
|
8
|
Tatsumi K: The pathogenesis of
Cancer-associated thrombosis. Int J Hematol. 119:495–504. 2024.
View Article : Google Scholar : PubMed/NCBI
|
|
9
|
Tieken C and Versteeg HH: Anticoagulants
versus cancer. Thromb Res. 140 (Suppl 1):S148–S153. 2016.
View Article : Google Scholar : PubMed/NCBI
|
|
10
|
Kawai K and Watanabe T: Colorectal cancer
and hypercoagulability. Surg Today. 44:797–803. 2014. View Article : Google Scholar : PubMed/NCBI
|
|
11
|
Saidak Z, Soudet S, Lottin M, Salle V,
Sevestre MA, Clatot F and Galmiche A: A pan-cancer analysis of the
human tumor coagulome and its link to the tumor immune
microenvironment. Cancer Immunol Immunother. 70:923–933. 2021.
View Article : Google Scholar : PubMed/NCBI
|
|
12
|
Song B, Chi H, Peng G, Song Y, Cui Z, Zhu
Y, Chen G, Wu J, Liu W, Dong C, et al: Characterization of
coagulation-related gene signature to predict prognosis and tumor
immune microenvironment in skin cutaneous melanoma. Front Oncol.
12:9752552022. View Article : Google Scholar : PubMed/NCBI
|
|
13
|
Wang B, Zou D, Wang N, Wang H, Zhang T,
Gao L, Ma C, Zheng P, Gu B, Li X, et al: Construction and
validation of a novel Coagulation-related 7-gene prognostic
signature for gastric cancer. Front Genet. 13:9576552022.
View Article : Google Scholar : PubMed/NCBI
|
|
14
|
Yang WX, Gao HW, Cui JB, Zhang AA, Wang
FF, Xie JQ, Lu MH and You CG: Development and validation of a
coagulation-related genes prognostic model for hepatocellular
carcinoma. BMC Bioinformatics. 24:892023. View Article : Google Scholar : PubMed/NCBI
|
|
15
|
Livak KJ and Schmittgen TD: Analysis of
relative gene expression data using real-time quantitative PCR and
the 2(−Delta Delta C(T)) method. Methods. 25:402–408. 2001.
View Article : Google Scholar : PubMed/NCBI
|
|
16
|
Palta S, Saroa R and Palta A: Overview of
the coagulation system. Indian J Anaesth. 58:515–523. 2014.
View Article : Google Scholar : PubMed/NCBI
|
|
17
|
Langer F and Bokemeyer C: Crosstalk
between cancer and haemostasis. Implications for cancer biology and
cancer-associated thrombosis with focus on tissue factor.
Hamostaseologie. 32:95–104. 2012. View Article : Google Scholar : PubMed/NCBI
|
|
18
|
Lima LG and Monteiro RQ: Activation of
blood coagulation in cancer: Implications for tumour progression.
Biosci Rep. 33:2013. View Article : Google Scholar : PubMed/NCBI
|
|
19
|
Li Y and Wei S: Advances on mechanisms of
coagulation with non-small cell lung cancer. Zhongguo Fei Ai Za
Zhi. 16:676–680. 2013.(In Chinese). PubMed/NCBI
|
|
20
|
Du H and Chen J: Occurrence of venous
thromboembolism in patients with lung cancer and its anticoagulant
therapy. Zhongguo Fei Ai Za Zhi. 21:784–789. 2018.(In Chinese).
PubMed/NCBI
|
|
21
|
Neacşu F, Vârban A, Simion G, Şurghie R,
Pătraşcu OM, Sajin M, Dumitru M and Vrînceanu D: Lung cancer
mimickers-a case series of seven patients and review of the
literature. Rom J Morphol Embryol. 62:697–704. 2021. View Article : Google Scholar : PubMed/NCBI
|
|
22
|
Herrera I, Cisneros J, Maldonado M,
Ramírez R, Ortiz-Quintero B, Anso E, Chandel NS, Selman M and Pardo
A: Matrix metalloproteinase (MMP)-1 induces lung alveolar
epithelial cell migration and proliferation, protects from
apoptosis, and represses mitochondrial oxygen consumption. J Biol
Chem. 288:25964–25975. 2013. View Article : Google Scholar : PubMed/NCBI
|
|
23
|
Jiang S, Liu H, Zhang J, Zhang F, Fan J
and Liu Y: MMP1 regulated by NEAT1/miR-361-5p axis facilitates the
proliferation and migration of cutaneous squamous cell carcinoma
via the activation of Wnt pathway. Cancer Biol Ther. 22:381–391.
2021. View Article : Google Scholar : PubMed/NCBI
|
|
24
|
Liu H, Lan T, Li H, Xu L, Chen X, Liao H,
Chen X, Du J, Cai Y, Wang J, et al: Circular RNA circDLC1 inhibits
MMP1-mediated liver cancer progression via interaction with HuR.
Theranostics. 11:1396–1411. 2021. View Article : Google Scholar : PubMed/NCBI
|
|
25
|
Wang K, Zheng J, Yu J, Wu Y, Guo J, Xu Z
and Sun X: Knockdown of MMP-1 inhibits the progression of
colorectal cancer by suppressing the PI3K/Akt/c-myc signaling
pathway and EMT. Oncol Rep. 43:1103–1112. 2020.PubMed/NCBI
|
|
26
|
Guo J, Jin G, Hu Y, Zhao Z, Nan F, Hu X,
Hu Y and Han Q: Wogonin restrains the malignant progression of lung
cancer through modulating MMP1 and PI3K/AKT signaling pathway.
Protein Pept Lett. 30:25–34. 2023. View Article : Google Scholar : PubMed/NCBI
|
|
27
|
Rempe RG, Hartz AMS and Bauer B: Matrix
metalloproteinases in the brain and Blood-brain barrier: Versatile
breakers and makers. J Cereb Blood Flow Metab. 36:1481–1507. 2016.
View Article : Google Scholar : PubMed/NCBI
|
|
28
|
Chen Y, Zhou Y, Chen J, Yang J, Yuan Y and
Wu W: Exosomal lncRNA SNHG12 promotes angiogenesis and breast
cancer progression. Breast Cancer. 31:607–620. 2024. View Article : Google Scholar : PubMed/NCBI
|
|
29
|
Faraj Shaglouf LH, Ranjpour M, Wajid S and
Jain SK: Elevated expression of cellular SYNE1, MMP10, and GTPase1
and their regulatory role in hepatocellular carcinoma progression.
Protoplasma. 257:157–167. 2020. View Article : Google Scholar : PubMed/NCBI
|
|
30
|
He L, Kang Q, Chan KI, Zhang Y, Zhong Z
and Tan W: The immunomodulatory role of matrix metalloproteinases
in colitis-associated cancer. Front Immunol. 13:10939902022.
View Article : Google Scholar : PubMed/NCBI
|
|
31
|
Bi Y, Cao K, Wang Y, Yang W, Ma N, Lei X
and Chen Y: Radiosensitivity in non-small-cell lung cancer by MMP10
through the DNA damage repair pathway. J Oncol. 2023:56368522023.
View Article : Google Scholar : PubMed/NCBI
|
|
32
|
Lin CL, Hung TW, Ying TH, Lin CJ, Hsieh YH
and Chen CM: Praeruptorin B mitigates the metastatic ability of
human renal carcinoma cells through targeting CTSC and CTSV
Expression. Int J Mol Sci. 21:29192020. View Article : Google Scholar : PubMed/NCBI
|
|
33
|
Liu J, Zhang W, Wang Z, Wang Y, Li T, Wang
Y, Ding J and Ning B: Cathepsin V is correlated with the prognosis
and tumor microenvironment in liver cancer. Mol Carcinog.
63:400–416. 2024. View Article : Google Scholar : PubMed/NCBI
|
|
34
|
Sereesongsaeng N, Burrows JF, Scott CJ,
Brix K and Burden RE: Cathepsin V regulates cell cycle progression
and histone stability in the nucleus of breast cancer cells. Front
Pharmacol. 14:12714352023. View Article : Google Scholar : PubMed/NCBI
|
|
35
|
Zhu L, Zeng Q, Wang J, Deng F and Jin S:
Cathepsin V drives lung cancer progression by shaping the
immunosuppressive environment and adhesion molecules cleavage.
Aging (Albany NY). 15:13961–13979. 2023. View Article : Google Scholar : PubMed/NCBI
|
|
36
|
Liu L, Li J, Fan C, Wen M, Li C, Sun W and
Wang W: Construction of a new Immune-related competing endogenous
rna network with prognostic value in lung adenocarcinoma. Mol
Biotechnol. 66:300–310. 2024. View Article : Google Scholar : PubMed/NCBI
|
|
37
|
Xu S, Tuo QZ, Meng J, Wu XL, Li CL and Lei
P: Thrombin induces ferroptosis in triple-negative breast cancer
through the cPLA2α/ACSL4 signaling pathway. Transl Oncol.
39:1018172024. View Article : Google Scholar : PubMed/NCBI
|
|
38
|
Wu J, Li L, Zhang H, Zhao Y, Zhang H, Wu S
and Xu B: A risk model developed based on tumor microenvironment
predicts overall survival and associates with tumor immunity of
patients with lung adenocarcinoma. Oncogene. 40:4413–4424. 2021.
View Article : Google Scholar : PubMed/NCBI
|
|
39
|
Hwang C, Lee SJ, Lee JH, Kim KH, Suh DS,
Kwon BS and Choi KU: Stromal tumor-infiltrating lymphocytes
evaluated on H&E-stained slides are an independent prognostic
factor in epithelial ovarian cancer and ovarian serous carcinoma.
Oncol Lett. 17:4557–4565. 2019.PubMed/NCBI
|
|
40
|
Paijens ST, Vledder A, de Bruyn M and
Nijman HW: Tumor-infiltrating lymphocytes in the immunotherapy era.
Cell Mol Immunol. 18:842–859. 2021. View Article : Google Scholar : PubMed/NCBI
|
|
41
|
Shaban M, Khurram SA, Fraz MM, Alsubaie N,
Masood I, Mushtaq S, Hassan M, Loya A and Rajpoot NM: A Novel
digital score for abundance of tumour infiltrating lymphocytes
predicts disease free survival in oral squamous cell carcinoma. Sci
Rep. 9:133412019. View Article : Google Scholar : PubMed/NCBI
|
|
42
|
Choi A, Jung YW and Choi H: The extrinsic
factors important to the homeostasis of Allergen-specific memory
CD4 T cells. Front Immunol. 13:10808552022. View Article : Google Scholar : PubMed/NCBI
|
|
43
|
Kawabe T and Sher A: Memory-phenotype CD4+
T cells: A naturally arising T lymphocyte population possessing
innate immune function. Int Immunol. 34:189–196. 2022. View Article : Google Scholar : PubMed/NCBI
|
|
44
|
Krueger PD, Osum KC and Jenkins MK: CD4+
memory T-cell formation during type 1 immune responses. Cold Spring
Harb Perspect Biol. 13:a0381412021. View Article : Google Scholar : PubMed/NCBI
|
|
45
|
Okła K, Farber DL and Zou W:
Tissue-resident memory T cells in tumor immunity and immunotherapy.
J Exp Med. 218:e202016052021. View Article : Google Scholar : PubMed/NCBI
|
|
46
|
Park SL, Gebhardt T and Mackay LK:
Tissue-resident memory T cells in cancer immunosurveillance. Trends
Immunol. 40:735–747. 2019. View Article : Google Scholar : PubMed/NCBI
|
|
47
|
Zhang H, Zhu Z, Modrak S and Little A:
Tissue-resident memory CD4+ T cells play a dominant role
in the initiation of antitumor immunity. J Immunol. 208:2837–2846.
2022. View Article : Google Scholar : PubMed/NCBI
|
|
48
|
Parrish-Novak J, Dillon SR, Nelson A,
Hammond A, Sprecher C, Gross JA, Johnston J, Madden K, Xu W, West
J, et al: Interleukin 21 and its receptor are involved in NK cell
expansion and regulation of lymphocyte function. Nature. 408:57–63.
2000. View Article : Google Scholar : PubMed/NCBI
|
|
49
|
Xu C, Sui S, Shang Y, Yu Z, Han J, Zhang
G, Ntim M, Hu M, Gong P, Chen H and Zhang X: The landscape of
immune cell infiltration and its clinical implications of
pancreatic ductal adenocarcinoma. J Adv Res. 24:139–148. 2020.
View Article : Google Scholar : PubMed/NCBI
|
|
50
|
Chang J, Wu H, Wu J, Liu M, Zhang W, Hu Y,
Zhang X, Xu J, Li L, Yu P and Zhu J: Constructing a novel
mitochondrial-related gene signature for evaluating the tumor
immune microenvironment and predicting survival in stomach
adenocarcinoma. J Transl Med. 21:1912023. View Article : Google Scholar : PubMed/NCBI
|
|
51
|
Sun X, Li J, Gao X, Huang Y, Pang Z, Lv L,
Li H, Liu H and Zhu L: Disulfidptosis-related lncRNA prognosis
model to predict survival therapeutic response prediction in lung
adenocarcinoma. Oncol Lett. 28:3422024. View Article : Google Scholar : PubMed/NCBI
|
|
52
|
Mogi A and Kuwano H: TP53 mutations in
nonsmall cell lung cancer. J Biomed Biotechnol.
2011:5839292011.PubMed/NCBI
|
|
53
|
Perez-Rivas LG, Simon J, Albani A, Tang S,
Roeber S, Assié G, Deutschbein T, Fassnacht M, Gadelha MR, Hermus
AR, et al: TP53 mutations in functional corticotroph tumors are
linked to invasion and worse clinical outcome. Acta Neuropathol
Commun. 10:1392022. View Article : Google Scholar : PubMed/NCBI
|
|
54
|
Chen H, Deng J, Hou TW and Shan YQ:
Villosol reverses 5-FU resistance in colorectal cancer by
inhibiting the CDKN2A gene regulated TP53-PI3K/Akt signaling axis.
J Ethnopharmacol. 325:1179072024. View Article : Google Scholar : PubMed/NCBI
|
|
55
|
Zhong Y, Wang J, Lv W, Xu J, Mei S and
Shan A: LncRNA TTN-AS1 drives invasion and migration of lung
adenocarcinoma cells via modulation of miR-4677-3p/ZEB1 axis. J
Cell Biochem. 120:17131–17141. 2019. View Article : Google Scholar : PubMed/NCBI
|
|
56
|
Mack KN, Samuels ZV, Carter LM, Viray TD,
Mandleywala K, Brooks CL, Hollingsworth MA, Radhakrishnan P and
Lewis JS: Interrogating the theranostic capacity of a
MUC16-Targeted antibody for ovarian cancer. J Nucl Med. 65:580–585.
2024. View Article : Google Scholar : PubMed/NCBI
|
|
57
|
Aguilar EN, Sagar S, Murray BR, Rajesh C,
Lei EK, Michaud SA, Goodlett DR, Caffrey TC, Grandgenett PM,
Swanson B, et al: Structural basis for multivalent MUC16
recognition and robust Anti-pancreatic cancer activity of humanized
antibody AR9.6. Mol Cancer Ther. 23:836–853. 2024. View Article : Google Scholar : PubMed/NCBI
|
|
58
|
Liu T, Wu L, Liu J, Chen H, Zhu B, Qiao D,
Zhu Y, Liu T, Chen Q and Hu A: Comprehensive characterization of
MUC16 mutations in lung adenocarcinoma for immunotherapies and
prognosis: An observational study. Medicine (Baltimore).
102:e354812023. View Article : Google Scholar : PubMed/NCBI
|
|
59
|
Liu C, Zheng S, Wang Z, Wang S, Wang X,
Yang L, Xu H, Cao Z, Feng X, Xue Q, et al: KRAS-G12D mutation
drives immune suppression and the primary resistance of
anti-PD-1/PD-L1 immunotherapy in non-small cell lung cancer. Cancer
Commun (Lond). 42:828–847. 2022. View Article : Google Scholar : PubMed/NCBI
|
|
60
|
Wen Y, Tang F, Tu C, Hornicek F, Duan Z
and Min L: Immune checkpoints in osteosarcoma: Recent advances and
therapeutic potential. Cancer Lett. 547:2158872022. View Article : Google Scholar : PubMed/NCBI
|
|
61
|
Jardim DL, Goodman A, de Melo Gagliato D
and Kurzrock R: The challenges of tumor mutational burden as an
immunotherapy biomarker. Cancer Cell. 39:154–173. 2021. View Article : Google Scholar : PubMed/NCBI
|
|
62
|
Liu L, Bai X, Wang J, Tang XR, Wu DH, Du
SS, Du XJ, Zhang YW, Zhu HB, Fang Y, et al: Combination of TMB and
CNA stratifies prognostic and predictive responses to immunotherapy
across metastatic cancer. Clin Cancer Res. 25:7413–7423. 2019.
View Article : Google Scholar : PubMed/NCBI
|
|
63
|
Samstein RM, Lee CH, Shoushtari AN,
Hellmann MD, Shen R, Janjigian YY, Barron DA, Zehir A, Jordan EJ,
Omuro A, et al: Tumor mutational load predicts survival after
immunotherapy across multiple cancer types. Nat Genet. 51:202–206.
2019. View Article : Google Scholar : PubMed/NCBI
|
|
64
|
Ricciuti B, Wang X, Alessi JV, Rizvi H,
Mahadevan NR, Li YY, Polio A, Lindsay J, Umeton R, Sinha R, et al:
Association of high tumor mutation burden in Non-small cell lung
cancers with increased immune infiltration and improved clinical
outcomes of PD-L1 blockade across PD-L1 expression levels. JAMA
Oncol. 8:1160–1168. 2022. View Article : Google Scholar : PubMed/NCBI
|
|
65
|
Cao D, Xu H, Xu X, Guo T and Ge W: High
tumor mutation burden predicts better efficacy of immunotherapy: A
pooled analysis of 103078 cancer patients. Oncoimmunology.
8:e16292582019. View Article : Google Scholar : PubMed/NCBI
|
|
66
|
Ding D, Wang L, Zhang Y, Shi K and Shen Y:
Machine learning developed a programmed cell death signature for
predicting prognosis and immunotherapy benefits in lung
adenocarcinoma. Transl Oncol. 38:1017842023. View Article : Google Scholar : PubMed/NCBI
|
|
67
|
Müller-Tidow C, Bug G, Lübbert M, Krämer
A, Krauter J, Valent P, Nachbaur D, Berdel WE, Ottmann OG, Fritsch
H, et al: A randomized, open-label, phase I/II trial to investigate
the maximum tolerated dose of the Polo-like kinase inhibitor BI
2536 in elderly patients with refractory/relapsed acute myeloid
leukaemia. Br J Haematol. 163:214–222. 2013. View Article : Google Scholar : PubMed/NCBI
|
|
68
|
Liu L, Zhang B, Wu X, Cheng G, Han X, Xin
X, Qin C, Yang L, Huo M and Yin L: Bioresponsive nanocomplex
integrating cancer-associated fibroblast deactivation and
immunogenic chemotherapy for rebuilding immune-excluded tumors.
Nanomedicine. 58:1027432024. View Article : Google Scholar : PubMed/NCBI
|
|
69
|
Zhang X, Yu T, Gao G, Xu J, Lin R, Pan Z,
Liu J and Feng W: Cell division cycle 42 effector protein 4
inhibits prostate cancer progression by suppressing ERK signaling
pathway. Biomol Biomed. 24:840–847. 2023. View Article : Google Scholar : PubMed/NCBI
|
|
70
|
Mi K, Zeng L, Chen Y, Ning J, Zhang S,
Zhao P and Yang S: DHX38 enhances proliferation, metastasis, and
EMT progression in NSCLC through the G3BP1-mediated MAPK pathway.
Cell Signal. 113:1109622024. View Article : Google Scholar : PubMed/NCBI
|
|
71
|
Jeon Y, Park S, Lee SH, Kim TH, Kim SW,
Ahn MJ, Jung HA and Chung JH: Combination of dabrafenib and
trametinib in patients with metastatic BRAFV600E-Mutated thyroid
cancer. Cancer Res Treat. 56:1270–1276. 2024. View Article : Google Scholar : PubMed/NCBI
|
|
72
|
Zeng B, Liao X, Liu L, Zhang C, Ruan H and
Yang B: Thyroid hormone mediates cardioprotection against
postinfarction remodeling and dysfunction through the
IGF-1/PI3K/AKT signaling pathway. Life Sci. 267:1189772021.
View Article : Google Scholar : PubMed/NCBI
|
|
73
|
Shi X, Han X and Cao Y, Li C and Cao Y:
ZCCHC14 regulates proliferation and invasion of non-small cell lung
cancer through the MAPK-P38 signalling pathway. J Cell Mol Med.
25:1406–1414. 2021. View Article : Google Scholar : PubMed/NCBI
|
|
74
|
Ling Y, Li J and Zhou L: Smoking-related
epigenetic modifications are associated with the prognosis and
chemotherapeutics of patients with bladder cancer. Int J
Immunopathol Pharmacol. 37:39463202311667742023. View Article : Google Scholar : PubMed/NCBI
|
|
75
|
Prahallad A, Weiss A, Voshol H, Kerr G,
Sprouffske K, Yuan T, Ruddy D, Meistertzheim M, Kazic-Legueux M,
Kottarathil T, et al: CRISPR screening identifies mechanisms of
resistance to KRASG12C and SHP2 inhibitor combinations in Non-Small
cell lung cancer. Cancer Res. 83:4130–4141. 2023. View Article : Google Scholar : PubMed/NCBI
|
|
76
|
Phyu SM, Tseng CC and Smith TAD:
CDP-choline accumulation in breast and colorectal cancer cells
treated with a GSK-3-targeting inhibitor. Magma. 32:227–235. 2019.
View Article : Google Scholar : PubMed/NCBI
|