Introduction
MAGE-A antigens are a subgroup of cancer/testis
antigens. They are exclusively found in malignant tumours except in
rare cases (e.g., testes, placenta) (1). To date, many tumour entities have been
tested for their MAGE-A expression (2). Oral squamous cell carcinomas were
found to express MAGE-A antigens (3). MAGE-A antigens consist of 12 different
antigen subgroups that are expressed in different constellations
and amounts in tumour cells (3).
MAGE-A antigens are able to induce T-cell and humoral immune
response. The functions and role of the MAGE-A antigens (e.g., in
cell differentiation or cell cycle) remain unknown (4,5).
Notably, they are expressed in stem cells but not in differentiated
fetal keratinocytes (6). In adult
keratinocytes they are no longer detected. This supports the
presumption of a function of MAGE-A antigens in cell
differentiation. Recent studies have shown a possible link between
MAGE-A expression in tumour cells (e.g., gastric carcinoma, breast
cancer or ovarian carcinoma) and the response rate to
anti-neoplastic treatments with taxanes (paclitaxel and docetaxel)
(7,8).
Taxanes are chemotherapeutic agents that prevent the
depolymerization of microtubules and subsequently interrupt cell
division. Paclitaxel and docetaxel share the same basic molecular
structure but differ in their side chains. Docetaxel has nearly
twice the affinity to microtubules compared with paclitaxel
(9). This results, in the majority
of cases, in higher cytotoxicity in certain tumours (10).
To investigate the impact of MAGE-A antigen
subgroups on the response to anti-neoplastic treatment with taxanes
in oral squamous cell carcinoma, five tumour cell lines were
analyzed for quantitative MAGE-A expression. These cell lines were
characterized in a previous study regarding their quantitative
expression of MAGE-A2, −A3, −A4, −A6 and −A10 (referenced to an
adult keratinocyte cell line) (11). The cell lines were treated with
different concentrations of docetaxel and paclitaxel, and the
measure of apoptosis in viable tumour cells was determined after 24
h with respect to 48 h. These measurements were compared with the
expression of the MAGE-A subgroups. A significant correlation
between MAGE-A subgroup expression and the apoptosis rate may
indicate a reduced response rate to taxane treatment resulting in
an impact on cancer treatment.
Materials and methods
Tumour cell lines
Measured levels of MAGE-A subgroup expression were
normalized to the adult keratinocyte cell line (NHEK) (11). The values are given in arbitrary
units (a.u.).
PCI 68-1 (root of tongue carcinoma,
pT4N0M0G1)
In this cell line, only MAGE-A3 was significantly
increased. However, the expression level of 2.97 a.u. was not very
high.
PCI 1-1 (larynx carcinoma,
pT2N0M0G2)
This cell line expressed 3 different MAGE-A antigens
(A2, A3 and A6). MAGE-A2 and −A3 were expressed at a moderate level
(A2, 9.21 a.u.; A3, 9.76 a.u.), and MAGE-A6 was expressed at a high
level (64.54 a.u.).
PCI 52 (larynx carcinoma, pT2N0M0G2)
The expression profile of this cell line showed the
most increased expression of MAGE-A antigen subgroups. MAGE-A2,
−A3, −A4 and −A6 were increased. PCI 52 is also the only cell line
examined that showed significant expression of MAGE-A4 (15.96
a.u.). PCI 52 exhibited the highest expression level of MAGE-A2
(15.39 a.u.) among the cell lines examined. The expression of
MAGE-A6 achieved the same level and reached 18.31 a.u. The amount
of MAGE-A3 expression was the lowest (3.49 a.u.).
PCI 9-1 (root of tongue carcinoma,
pT4N3M0G2)
This cell line also expressed a group of MAGE-A
antigens. As with PCI 1-1, this cell line highly expressed MAGE-A2,
−A3 and −A6 antigen subgroups. MAGE-A2 reached an expression level
of 10.67 a.u., MAGE-A3, 8.88 a.u. and MAGE-A6, 85.86 a.u. (the
highest value measured among the cell lines examined).
PCI 13-1 (oral squamous cell carcinoma,
pT4N1M0G3)
Similar to cell line 9-1, MAGE-A antigen subgroups
A2, A3 and A6 were significantly expressed. The expression levels
were also comparable to cell line 9-1. MAGE-A2 showed an expression
of 11.46 a.u.; MAGE-A3, 9.94 a.u. (the highest value measured among
the cell lines) and MAGE-A6, 62.79 a.u.
Cell cultures
The cell lines were grown at 37°C and 5%
CO2 in Dulbecco’s modified Eagle’s medium (DMEM low
glucose; Invitrogen, Karlsruhe, Germany; 100 mg/l D-glucose, 4 mMl
glutamine, 110 mg/l sodium pyruvate) with 10% fetal calf serum, 100
IU/ml penicillin and 100 mg/ml streptomycin (PromoCell, Heidelberg,
Germany).
Cytotoxicity test
The chemosensitivity of the cultured cell lines
after application of docetaxel and paclitaxel was measured with
CellTiter Aqueous One Solution Cell Proliferation Assay (Promega
Corp., Madison, WI, USA) according to the manufacturer’s
instructions. The test measures colorimetrically the count of
viable cells. It uses a tetrazolium compound that is metabolized to
formazan in mitochondria. Formazan is measured by absorption, and
its quantity is proportional to the number of viable cells. For the
cytotoxicity test, 1000 cells of each cell line examined were
seeded in triplicate on 96-well plates (Corning, NY, USA) in 100 μl
phenol-red free DMEM-medium and incubated overnight. The following
day, six different concentrations (0.025, 0.05, 0.1, 0.2, 0.4 and
0.8 μM) of paclitaxel soluted in DMSO and docetaxel soluted in
ethanol (both from Sigma, Germany) were added to the seeded cells.
After 24 and 48 h of incubation in each cell medium, 20 μl MTS
solution
[3-(4,5-dimethylthiazol-2-yl)-5-(3-carboxymethoxyphenyl)-2-(4-sulfophenyl)-2H-tetrazolium]
was added. After an additional 4 h, absorption at 450 nm was
measured with the microplate reader Infinite® F200
(Tecan, Männedorf, Switzerland). This resulted in three
measurements of three different cell cultures (n=9). A
corresponding cell line that was not treated with taxanes was
measured as a control. The values measured were normalized to those
of the untreated cell line.
Statistical analysis
The mean values of the number of viable cells
corresponding to the concentration of taxanes used were calculated
using a two-dimensional fit curve [equation: f = y0 + (a * b)/(b +
x)] using Excel 2007 (Microsoft, USA). To predict the accuracy of
the measured values, the coefficient of determination R2
was calculated. A value ≥0.7 represented a good approximation. The
percentage of decrease in viable cells after application of 0.8 μM
of the chemotherapeutic drug compared with the untreated cells was
named Δ.
To detect statistically significant differences
between the single cell lines, univariate analyses were performed.
These differences were further statistically correlated with the
amounts of viable cells after 24 h with respect to 48 h.
Results
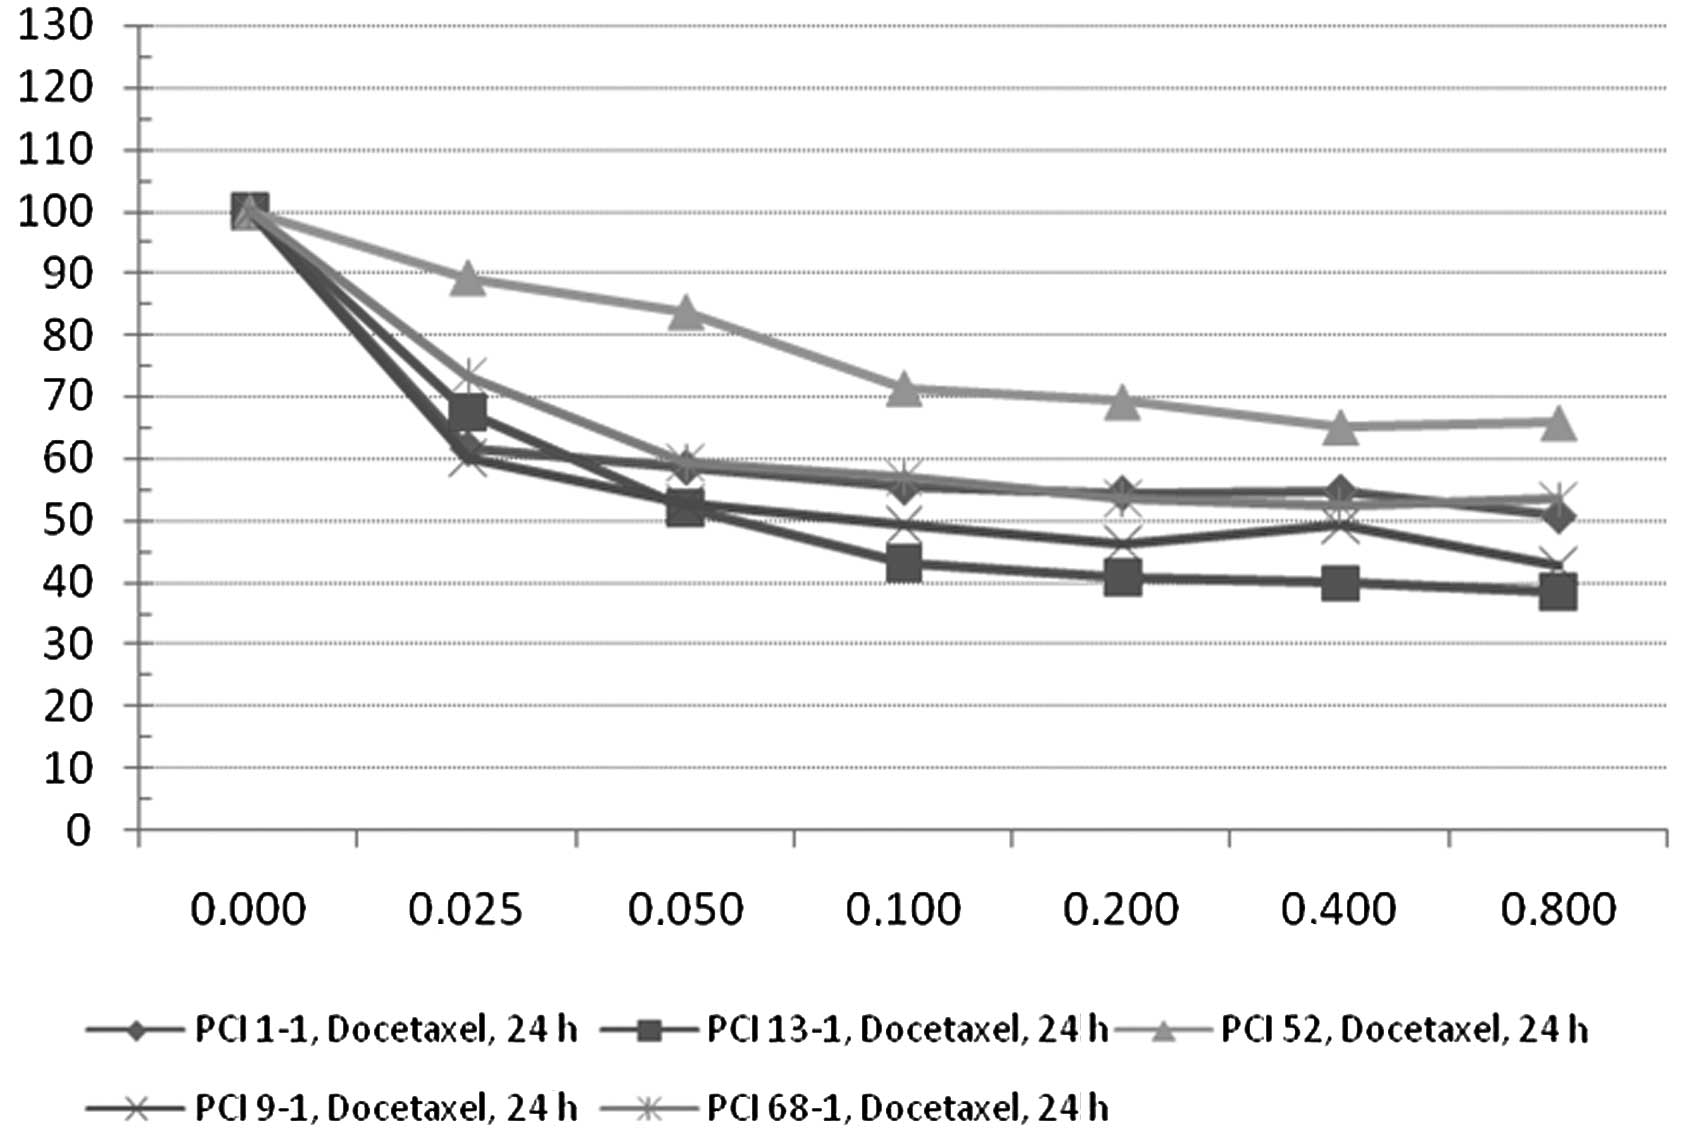
The cell lines showed a favorable response to
docetaxel and placlitaxel. As estimated, the number of viable cells
decreased exponentially with higher concentrations of docetaxel or
paclitaxel and with time elapsed (Tables I and II). No statistical correlation between
tumour size, metastases or grade of the primary tumours of which
the cell lines were established was found.
 | Table IThe decrease in viable cells according
to time elapsed and concentration of docetaxel. |
Table I
The decrease in viable cells according
to time elapsed and concentration of docetaxel.
| Docetaxel | PCI 68-1 | PCI 1-1 | PCI 52 | PCI 9-1 | PCI 13-1 |
|---|
|
|
|
|
|
|
|---|
| μM | 24 h | 48 h | 24 h | 48 h | 24 h | 48 h | 24 h | 48 h | 24 h | 48 h |
|---|
| 0.000 | 100.00 | 100.00 | 100.00 | 100.00 | 100.00 | 100.00 | 100.00 | 100.00 | 100.00 | 100.00 |
| 0.025 | 73.30 | 42.21 | 61.57 | 39.67 | 89.28 | 75.15 | 60.14 | 30.40 | 67.53 | 26.47 |
| 0.050 | 59.36 | 30.59 | 58.47 | 23.11 | 83.76 | 71.81 | 52.73 | 24.65 | 51.91 | 11.30 |
| 0.100 | 56.97 | 22.81 | 55.25 | 17.40 | 71.42 | 65.23 | 49.38 | 19.68 | 43.00 | 7.50 |
| 0.200 | 53.60 | 20.77 | 54.29 | 14.53 | 69.23 | 55.90 | 46.33 | 19.01 | 40.69 | 4.15 |
| 0.400 | 52.40 | 20.81 | 54.52 | 16.86 | 65.12 | 50.84 | 49.13 | 14.88 | 38.01 | 3.94 |
| 0.800 | 53.45 | 18.44 | 50.63 | 14.76 | 65.84 | 47.47 | 42.71 | 13.67 | 38.34 | 3.08 |
| Δa | 46.55 | 81.56 | 49.37 | 85.24 | 34.16 | 52.53 | 57.29 | 86.33 | 61.66 | 96.92 |
| Table IIThe decrease of viable cells according
to time elapsed and concentration of paclitaxel. |
Table II
The decrease of viable cells according
to time elapsed and concentration of paclitaxel.
| Paclitaxel | PCI 68-1 | PCI 1-1 | PCI 52 | PCI 9-1 | PCI 13-1 |
|---|
|
|
|
|
|
|
|---|
| μM | 24 h | 48 h | 24 h | 48 h | 24 h | 48 h | 24 h | 48 h | 24 h | 48 h |
|---|
| 0.000 | 100.00 | 100.00 | 100.00 | 100.00 | 100.00 | 100.00 | 100.00 | 100.00 | 100.00 | 100.00 |
| 0.025 | 103.25 | 87.73 | 92.35 | 90.76 | 112.19 | 95.07 | 110.96 | 91.30 | 95.28 | 95.26 |
| 0.050 | 85.49 | 56.15 | 82.88 | 68.13 | 110.18 | 87.93 | 115.68 | 55.91 | 80.13 | 67.57 |
| 0.100 | 71.18 | 38.79 | 67.57 | 41.05 | 93.72 | 85.37 | 95.41 | 30.00 | 54.19 | 34.11 |
| 0.200 | 72.80 | 29.35 | 51.98 | 18.21 | 93.50 | 71.42 | 75.98 | 20.22 | 41.05 | 11.35 |
| 0.400 | 62.01 | 27.99 | 41.45 | 8.44 | 84.14 | 69.80 | 76.51 | 15.37 | 34.27 | 5.36 |
| 0.800 | 62.44 | 24.23 | 34.71 | 6.52 | 79.41 | 63.23 | 70.59 | 12.72 | 33.08 | 2.20 |
| Δa | 37.56 | 75.77 | 65.29 | 93.48 | 20.59 | 36.77 | 29.41 | 87.28 | 66.92 | 97.80 |
The cell lines showed a similar exponential decrease
in viable cells when plotting the viability to taxane
concentration. In four out of the five cell lines (PCI 68-1, PCI
1-1, PCI 9-1 and PCI 13-1) similar levels of cell loss were
achieved. This cell loss is represented by Delta, as
mentioned above.
The Deltas for 0.8 μM docetaxel and 24 h were: PCI
68-1, 46.55; PCI 1-1, 49.37; PCI 9-1, 57.29 and PCI 13-1, 61.66
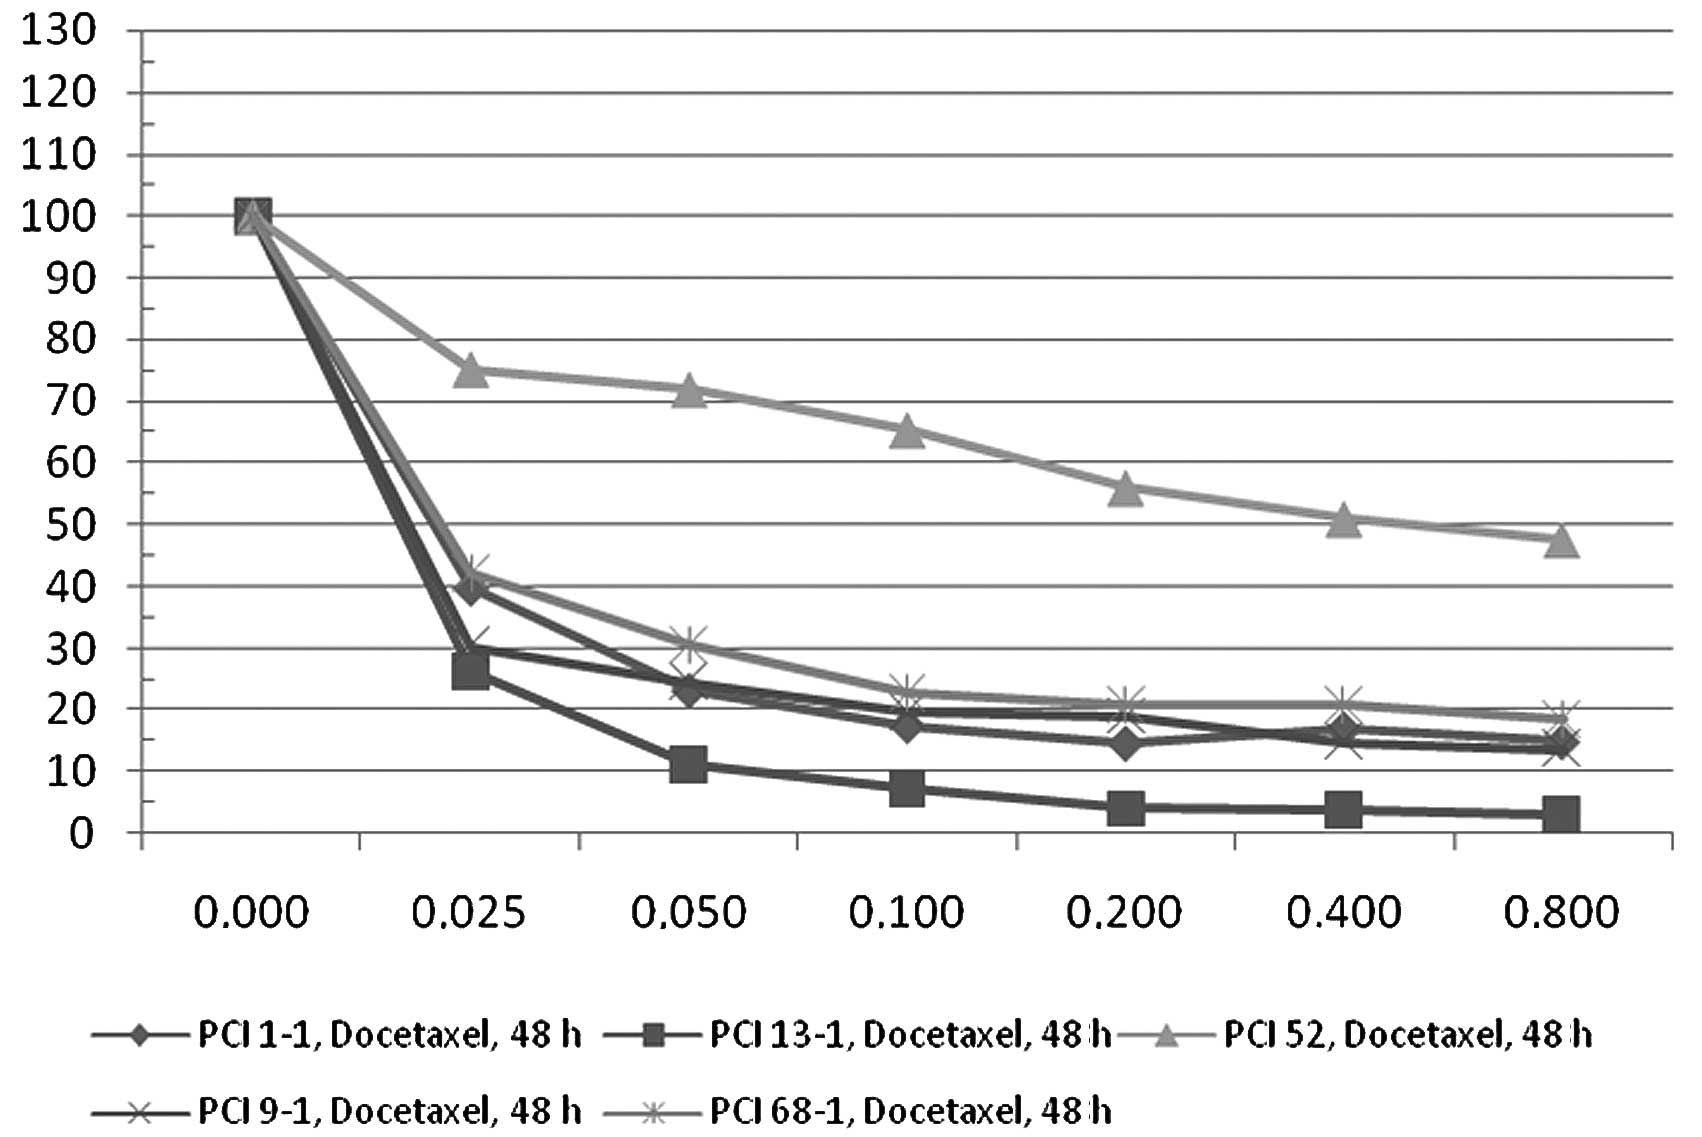
(Fig. 1). After 48 h of docetaxel
incubation, the Deltas were: PCI 68-1, 81.56; PCI 1-1, 85.24; PCI
9-1, 86.33 and PCI 13-1, 96.92 (Fig.
2).
In contrast to the four cell lines, PCI 52 exhibited
different characteristics. After 24 h of docetaxel application, Δ
was 34.16 and after 48 h only 52.53. These results were
statistically significant (p<0.05).
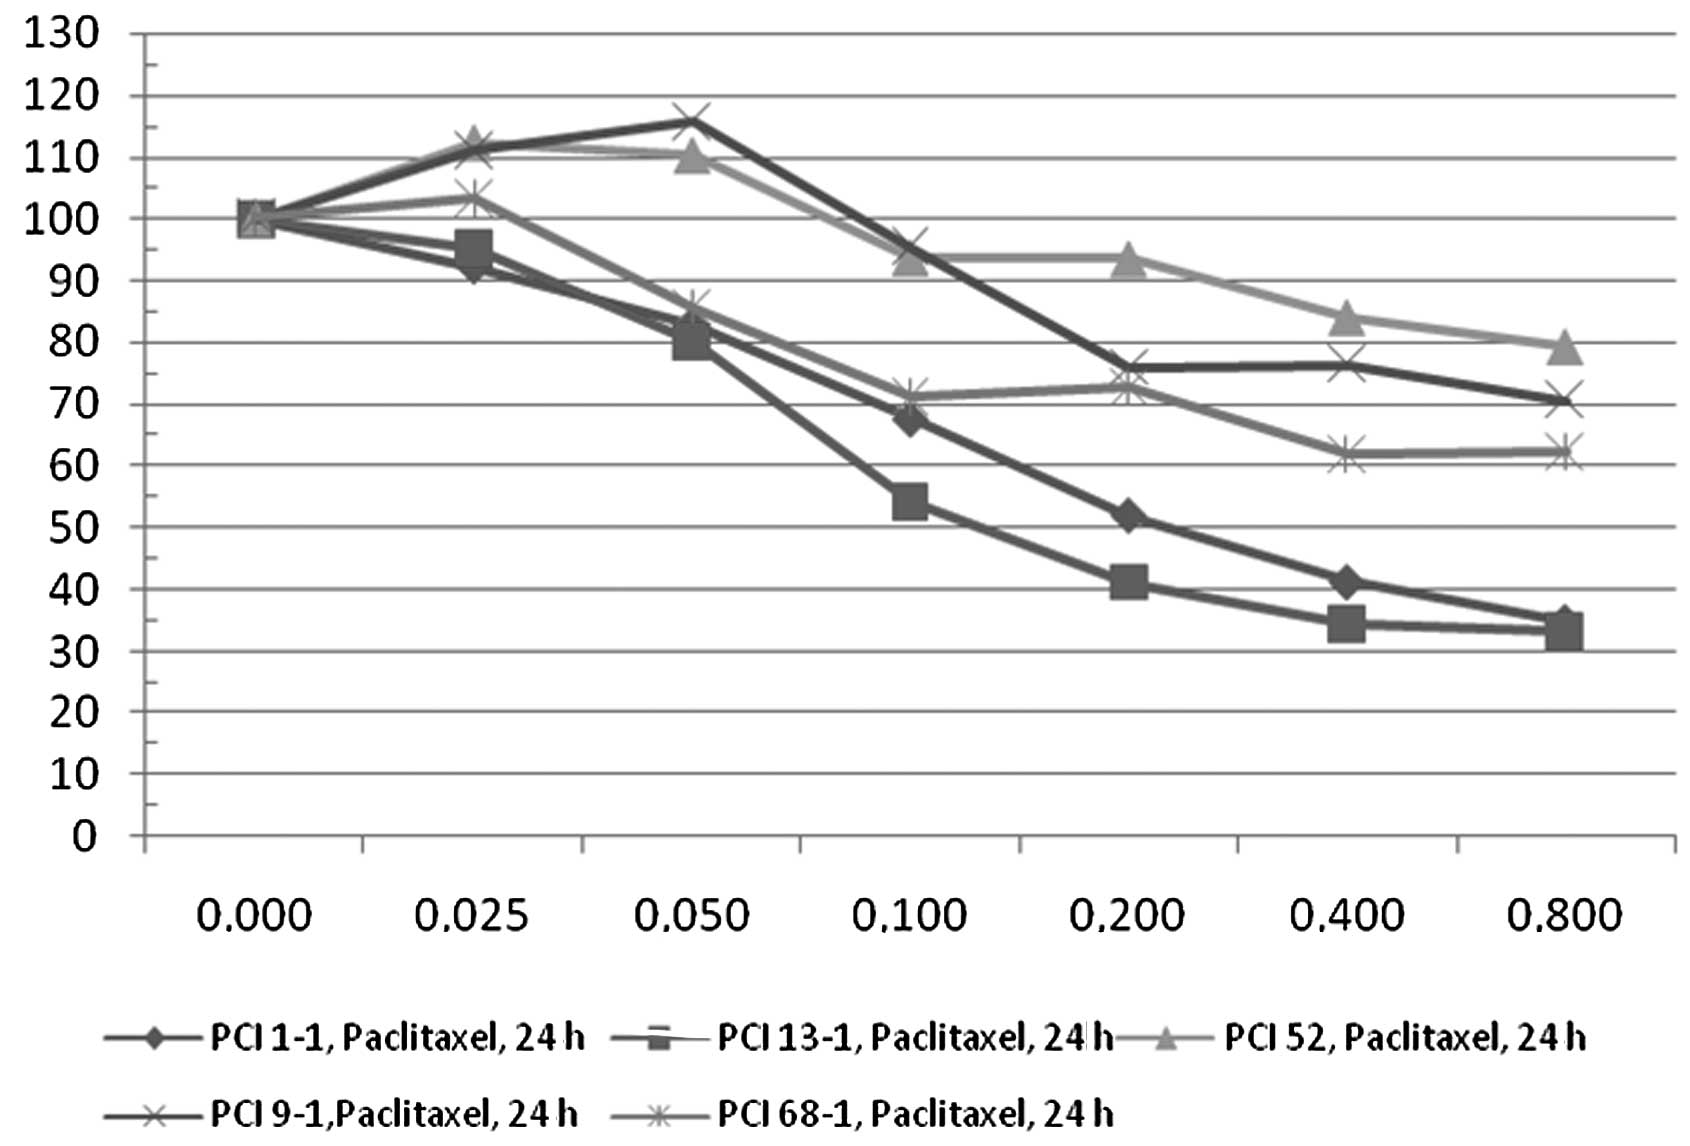
When applying paclitaxel to the cell lines, the
results were similar to docetaxel. Δ for 0.8 μM paclitaxel and 24 h
were: PCI 68-1, 37.56; PCI 1-1, 65.29; PCI 9-1, 29.41 and PCI 13-1,
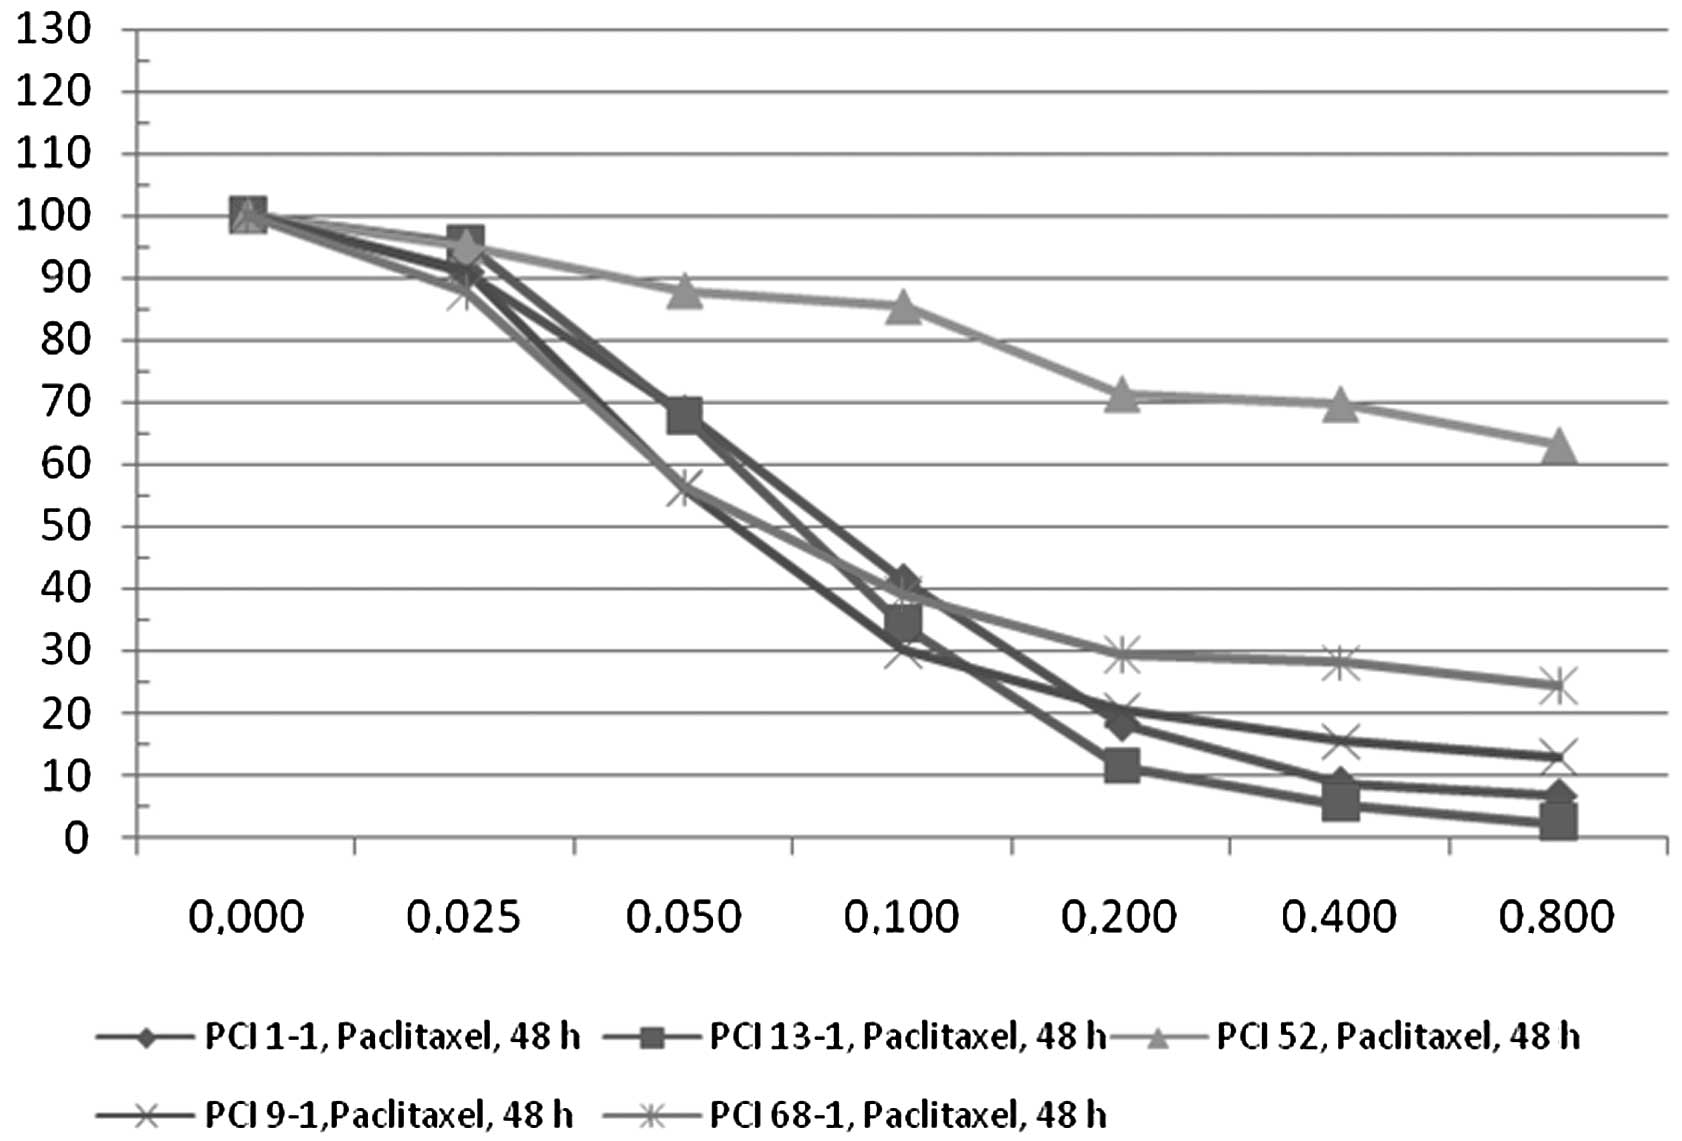
66.92 (Fig. 3). After 48 h of
paclitaxel incubation Δ was: PCI 68-1, 75.77; PCI 1-1, 93.48; PCI
9-1, 87.28 and PCI 13-1, 97.80 (Fig.
4). The fifth cell line PCI 52 again showed a different
response rate. Δ was 20.59 (24 h) and 36.77 (48 h). These results
were also statistically significant (p<0.05).
The cell line PCI 52 exhibited a statistically
significant difference in the expression profile of the MAGE-A
antigens compared to the other cell lines (p<0.05). It is the
only cell line among the five analyzed that expressed the MAGE-A4
antigen. PCI 52 expressed MAGE-A2, −A3 and −A6 which were also
expressed in the other cell lines examined. Therefore, we propose
that its differential behavior is correlated with its MAGE-A4
expression.
Discussion
The function of the MAGE-A antigens remains unknown.
There is scarce information on the impact of the MAGE-A antigen
subgroup expression in tumour cells on treatment with
anti-neoplastic agents and the course of cancer. Additionally,
little is known about the expression of the single antigen
subgroups (MAGE-A1 to −A12) in different tumour entities. Only five
reported studies have investigated at least four subtypes of MAGE-A
antigens in wild-type oral squamous cell carcinoma (3,12–15).
In light of their exclusive appearance in malignant cells and
immunogenicity and their use as possible targets of immunotherapy,
further investigation is warranted.
This is the first report involving the reduced
response rate of oral squamous cell carcinoma to chemotherapeutic
agents (taxanes) correlating with the expression of the MAGE-A4
subgroup. A recent study investigating the influence of
cancer/testis antigens on T-cell-mediated immune response in
patients suffering from medulloblastoma also found an impact of
MAGE-A expression level on the response to chemotherapeutic drugs
cisplatin and etoposide (16).
These findings are relevant to oral squamous cell carcinoma, since
cisplatin is one of the pillars of anti-neoplastic treatment of
this tumour. It is also used in adjuvant radio-chemotherapy as well
as in palliative settings. One study demonstrated a higher response
rate to paclitaxel in gastric cancer patients expressing the
MAGE-A1 antigen subgroup (7). Duan
et al found resistance to paclitaxel and doxorubicin in an
ovarian cancer cell line expressing MAGE and GAGE antigens
(8). However, they did not further
elucidate the roles of the specific MAGE-A antigen subgroups.
Our findings and these studies confirm the impact of
MAGE-A antigen subgroups on response to chemotherapeutic drugs.
Identifying and evaluating this impact is crucial for the prognosis
and survival of patients suffering from oral squamous cell
carcinoma. Considering the impact of tumour resistance to taxanes
compared with their occasional life-threatening side effects such
as neutropenia, fluid retention, neuropathia and toxic effects,
managing this impact is crucial. Further studies that characterize
cell lines in regards to their MAGE-A expression profile and impact
on commonly used chemotherapeutic drugs (e.g., taxanes, platin
drugs, 5-fluorouracil) are necessary. These studies will help to
improve the anti-neoplastic treatment of cancer patients, minimize
unnecessary side effects and improve survival.
References
|
1
|
Serrano A, Lethe B, Delroisse JM, Lurquin
C, de Plaen E, Brasseur F, Rimoldi D and Boon T: Quantitative
evaluation of the expression of MAGE genes in tumors by limiting
dilution of cDNA libraries. Int J Cancer. 83:664–669. 1999.
View Article : Google Scholar : PubMed/NCBI
|
|
2
|
Jungbluth AA, Busam KJ, Kolb D, Iversen K,
Coplan K, Chen YT, Spagnoli GC and Old LJ: Expression of
MAGE-antigens in normal tissues and cancer. Int J Cancer.
85:460–465. 2000. View Article : Google Scholar : PubMed/NCBI
|
|
3
|
Ries J, Schultze-Mosgau S, Neukam F,
Diebel E and Wiltfang J: Investigation of the expression of
melanoma antigen-encoding genes (MAGE-A1 to -A6) in oral squamous
cell carcinomas to determine potential targets for gene-based
cancer immunotherapy. Int J Oncol. 26:817–824. 2005.PubMed/NCBI
|
|
4
|
Ohman Forslund K and Nordqvist K: The
melanoma antigen genes - any clues to their functions in normal
tissues? Exp Cell Res. 265:185–194. 2001.PubMed/NCBI
|
|
5
|
Xiao J and Chen HS: Biological functions
of melanoma-associated antigens. World J Gastroenterol.
10:1849–1853. 2004.PubMed/NCBI
|
|
6
|
Muller-Richter UD, Dowejko A, Zhou W,
Reichert TE and Driemel O: Different expression of MAGE-A-antigens
in foetal and adult keratinocyte cell lines. Oral Oncol.
44:628–633. 2008. View Article : Google Scholar : PubMed/NCBI
|
|
7
|
Suzuki T, Yoshida K, Wada Y, Hamai Y,
Sentani K, Oue N and Yasui W: Melanoma-associated antigen-A1
expression predicts resistance to docetaxel and paclitaxel in
advanced and recurrent gastric cancer. Oncol Rep. 18:329–336.
2007.PubMed/NCBI
|
|
8
|
Duan Z, Duan Y, Lamendola DE, Yusuf RZ,
Naeem R, Penson RT and Seiden MV: Overexpression of MAGE/GAGE genes
in paclitaxel/doxorubicin-resistant human cancer cell lines. Clin
Cancer Res. 9:2778–2785. 2003.PubMed/NCBI
|
|
9
|
Diaz JF and Andreu JM: Assembly of
purified GDP-tubulin into microtubules induced by taxol and
taxotere: reversibility, ligand stoichiometry and competition.
Biochemistry. 32:2747–2755. 1993. View Article : Google Scholar : PubMed/NCBI
|
|
10
|
Hanauske AR, Degen D, Hilsenbeck SG,
Bissery MC and von Hoff DD: Effects of taxotere and taxol on in
vitro colony formation of freshly explanted human tumor cells.
Anticancer Drugs. 3:121–124. 1992. View Article : Google Scholar : PubMed/NCBI
|
|
11
|
Müller-Richter UDA, Dowejko A, Reuther T,
Kleinheinz J, Reichert TE and Driemel O: Analysis of expression
profiles of MAGE-A antigens in oral squamous cell carcinoma cell
lines. Head Face Med. 5:102009.PubMed/NCBI
|
|
12
|
Ries J, Vairaktaris E, Mollaoglu N,
Wiltfang J, Neukam FW and Nkenke E: Expression of
melanoma-associated antigens in oral squamous cell carcinoma. J
Oral Pathol Med. 37:88–93. 2008. View Article : Google Scholar : PubMed/NCBI
|
|
13
|
Figueiredo DL, Mamede RC, Proto-Siqueira
R, Neder L, Silva WA Jr and Zago MA: Expression of cancer testis
antigens in head and neck squamous cell carcinomas. Head Neck.
28:614–619. 2006. View Article : Google Scholar : PubMed/NCBI
|
|
14
|
Lee KD, Lee HH, Joo HB, Lee HS, Yu TH,
Chang HK, Jeon CH and Park JW: Expression of MAGE A 1-6 mRNA in
sputa of head and neck cancer patients - a preliminary report.
Anticancer Res. 26:1513–1518. 2006.PubMed/NCBI
|
|
15
|
Lee KD, Eura M, Ogi K, Nakano K,
Chikamatsu K, Masuyama K and Ishikawa T: Expression of the MAGE-1,
−2, −3, −4 and −6 genes in non-squamous cell carcinoma lesions of
the head and neck. Acta Otolaryngol. 116:633–639. 1996.
|
|
16
|
Kasuga C, Nakahara Y, Ueda S, Hawkins C,
Taylor MD, Smith CA and Rutka JT: Expression of MAGE and GAGE genes
in medulloblastoma and modulation of resistance to chemotherapy.
Laboratory investigation. J Neurosurg Pediatr. 1:305–313. 2008.
View Article : Google Scholar : PubMed/NCBI
|