Introduction
Breast cancer is one of the most common malignancies
affecting women, with a lifetime risk of about 1 in 10. Breast
cancer is considered both genetically and histopathologically
heterogeneous (1). The mechanisms
underlying breast cancer progression remain undetermined and are
under investigation. The major prognostic characteristics for this
disease have been based on conventional prognostic indicators, such
as lymph node status, oestrogen receptor status, c-erb2 gene,
tumour size and histological grade. However, it is still difficult
to determine an accurate patient prognosis. Genetic expression
(gene signatures) provides the basis for improving the molecular
classification of breast cancer (2). Recently, an effort has been made to
correlate the tumour characteristics of the patient with certain
gene signatures. A classification scheme provides a very important
framework for the study of breast cancer. The new form of
classification represents four molecular subtypes with clinically
distinct behaviour, that perhaps arise from different precursor
cells in the breast. The true prognostic value of the various
molecular classes is necessary because there is a strong
correlation between molecular class and conventional
histopathological variables. The subtypes of molecular
classification are 4: Luminal A (positive hormone receptors, low
grade), Luminal B (positive hormone receptors, high grade), HER2
positive subtype and Basal cell type (the latter of which includes
triple negative patients) (3–5).
In order to explore the molecular basis of breast
carcinogenesis aiming towards a more accurate prognosis and more
effective therapeutic intervention, studies tend to focus on the
microarray analysis of the whole transcriptome and proteome of the
tumour, from the patients’ blood (1,6,7).
Profiles of transcription and translation have shown
specific changes among different types of cancer as a result of
sequential mutation and signal amplification, distinguishing
cancers from normal tissues. Moreover, the different gene
expression profiles are likely to reflect distinct tumour subtypes
involving different phenotypes and clinical features (8–11).
Changes in the expression level of cancer-related genes occur much
earlier than morphological changes, and they lead to a different
degree of cellular differentiation (12). A characteristic expression profile
in the blood may contribute to cancer prognosis. New molecular
tumour markers can potentially be used for more accurate
classification and drug targets for effective personalized therapy
(13–19). The predictive power of these
approaches is much greater than that of the currently used
approaches based on the tumour characteristics, but this remains to
be validated in prospective clinical studies.
The objective of the present study was to evaluate
the predictive power of five sets of genes previously found to be
correlated with primary breast cancer and second primary
malignancies in breast cancer patients (17) and to determine whether the
deregulation of these genes is correlated with breast cancer
molecular classification.
Materials and methods
Patients
Blood was collected from 88 breast cancer patients
with a 3–10 year follow-up after primary tumour excision. Blood was
also collected from 50 age-matched healthy volunteers. The protocol
was approved by the Ethics Committee of the Errikos Dynant Hospital
and informed consent was signed by all the patients and healthy
individuals participating in the study.
Eligibility for the study required
histologically-confirmed breast cancer, including patients of all
stages with a World Health Organization (WHO) performance status of
0–2. All patients had been treated with surgery, chemotherapy
and/or endocrine treatment and/or radiotherapy. Before enrollment
in the study the patients were clinically evaluated.
Staging was determined by chest and abdominal CT
scans, bone scans and occasionally, MRIs. All patients had normal
liver and renal function tests. The patients were divided on the
basis of their histopathological characteristics and the molecular
classification subgroups. All of the clinicopathological
characteristics (age, stage, histological grade, tumour size,
metastasis and lymph node involvement) are shown in Table I.
 | Table IClinicopathological data of
patients. |
Table I
Clinicopathological data of
patients.
| Characteristics | Patients (n=88) | Healthy individuals
(n=50) |
|---|
| Age (years), median
(range) | 57.2 | 55.7 |
| 40–74 | 38–65 |
| Tumour size (cm) |
| <2 | 40 | |
| ≥2 – <5 | 40 | |
| ≥5 | 8 | |
| Histological
grade |
| I | 15 | |
| II | 38 | |
| III | 35 | |
| Stage |
| I | 12 | |
| II | 33 | |
| III | 26 | |
| IV | 17 | |
| Metastasis | 17 | |
| ER status
positive | 66 | |
| PR status
positive | 43 | |
| HER2 status
positive | 25 | |
| Lymph node
status | 38 | |
| Molecular
classification |
| Luminal A | 27 | |
| Luminal B | 26 | |
| HER2 subtype | 25 | |
| Basal-like
tumours | 10 | |
| Second primary
development | 14 | |
Gene selection
The 19 genes investigated were selected on the basis
of their association with primary breast cancer and with the
development of second primary tumours in breast cancer patients
(17). These genes were part of 4
classifiers genes: i) FLJ38663, LOC34563, MTRF1L, COMMD 1,
C10ORF22, STARD7, BAG3 and SNX26; ii) RPS7, OSBPL1, ETF1; iii)
FBX033, FLJ339115; and iv) ENY2, USP38) (Table II). In addition, the genes HNRPC,
SET, HSPE1 and HCG2040681 were tested although they were not
categorised as a classifier. The downregulation of these genes was
statistically significantly correlated with single and second
primary cancer development (P<0.00001) (Table II). Two endogenous housekeeping
genes (18S and β-actin) were included and were used to normalize
the expression levels of the other genes.
| Table IIMultiplex qRT-PCR analysis. |
Table II
Multiplex qRT-PCR analysis.
| Multiplex set | Gene | Classifier | PCR conditions (1st
cycle at 95°C for 3 min) |
|---|
| 1 | C10ORF22 | 1 | 95°C for 15 sec |
| COMMD1 | 1 | 58°C for 1 min, ×40
cycles |
| MTRF1L | 1 | |
| STARD7 | 1 | |
| 2 | BAG3 | 1 | 95°C for 15 sec |
| SNX26 | 1 | 56°C for 1 min, ×40
cycles |
| LOC345630 | 1 | |
| 3 | FLJ38663 | 1 | 95°C for 15
sec |
| FBX033 | 2 | 58°C for 1 min, ×40
cycles |
| FLJ33915 | 2 | |
| 4 | HNRPC | | 95°C for 15
sec |
| SET | | 57°C for 1 min, ×40
cycles |
| HSPE1 | | |
| HCG2040681 | | |
| 5 | RPS7 | 3 | 95°C for 15
sec |
| OSBPL1 | 3 | 57°C for 1 min, ×40
cycles |
| ETF1 | 3 | |
| 6 | ENY2 | 4 | 95°C for 5 sec |
| USP38 | 4 | 58°C for 1 min, ×40
cycles |
| ACTB | | |
| 18S | | |
RNA isolation
Total RNA was isolated from freshly collected blood
after discarding the first 3 ml beforehand, in order to avoid
epithelial cell contamination. RNA concentration and quality were
examined spectrophotometrically (BioSpec Nano, Shimantzu, Japan)
and by agarose gel electrophoresis. RNA extraction was obtained
using TRI-Reagent (MRC) according to the manufacturer’s
instructions.
qRT-PCR
The examination of the expression levels of the 19
genes was obtained by multiplex quantitative-real time PCR
(qRT-PCR): primer set, probes and PCR conditions used in each case
were selected using the software Beacon Designer 7.0 (Premier
Biosoft International). The primers were further examined using the
FastPCR software and by carrying out NCBI blast (Table III). Prior to the multiplex qRTPCR
analysis, these 19 genes were separated into 4 sets that were
designed in such a way that led to the compatibility amongst the
primers, probes and fluorophores in each reaction. The primer,
probe and fluorophore compatibility for each multiplex set was
examined and approved by Bio-rad Laboratories (Table III). Each RT reaction was carried
out using 1 μg of RNA with an iScript cDNA synthesis kit
(Bio-Rad Laboratories) according to the manufacturer’s
instructions. The obtained cDNA was amplified by multiplex qRT-PCR.
Prior to the original experiment, each RT-PCR product was examined
by enzyme digest and sequencing. Each reaction was obtained in 25
μl using 12.5 μl IQ Multiplex Powermix (Bio-Rad
Laboratories), 2 μl cDNA, 0.3 μM of each primer and
0.2 μM of each probe. In each case 18S and β-actin were used
as internal controls. Each reaction was performed in duplicate for
each patient. The validation of the product identity and expression
was obtained by the melting curve. We used a two-step amplification
reaction according to the manufacturer’s instructions (Table II) using the IQ5 thermal cycler
(Bio-Rad Laboratories).
| Table IIIPrimers, probes and fluorophores for
each gene, used in multiplex qRT-PCR. |
Table III
Primers, probes and fluorophores for
each gene, used in multiplex qRT-PCR.
| Gene | Primer | Probe | Fluorophore |
|---|
| C10ORF22 | F:
GCCGGGACTGCCACTATTAC |
TCCCTCGCACCAGAAGTCATCGGC | 5′Texas Red |
| R:
AGACCTTGGGACCTGGATAGG | | 3′BHQ2 |
| STARD7 | F:
ATCCAATGTACTCACGGGATTATG |
CACTCGGATGCTCCACAGCACGC | 5′Cy5 |
| R:
ATATGATCTGACCCTGACGAATTC | | 3′BHQ3 |
| MTRF1L | F:
GGCTCATTAAATCAGTTATGGTTCC |
CCCAGCTCCACTGGCTCGCTTAGT | 5′FAM |
| R:
CAGCACTGTCCGTGGTATTTAC | | 3′BHQ1 |
| COMMD1 | F:
ACATCTGACCAAGCTGCTGTC |
ATCAACTCTCCAGCTCAGGCCCCG | 5′HEX |
| R:
GCTGAGTGCCTTGACTGAGAC | | 3′BHQ1 |
| BAG3 | F:
CTCAGAGGTCCCAGTCACC |
CATGCCAGAAACCACTCAGCCAGA | 5′FAM |
| R:
GAGGAGGATGAGGATGAGCAG | | 3′BHQ1 |
| SNX26 | F:
TGGTGGTGGAGTTTCTGCTC |
CCTGTTCAGCGACACCTTCACCTC | 5′HEX |
| R:
CTTCCTCCAGCGTCAGCAG | | 3′BHQ1 |
| FLJ38663 | F:
CATGGGGACTCCGGCTTTG |
AGGGTAGTCCTTCTTGCCTGCCAT | 5′Texas Red |
| R:
CTTCGAGTTCATTCTCATCCAAGG | | 3′BHQ2 |
| LOC345630 | F:
GCCACTTTCTCATCTCCATCAAG |
TCCACCGCATCCGCCGAGG | 5′Cy5 |
| R:
TCATAGGGCTCCAGGGTCAG | | 3′BHQ3 |
| FBX033 | F:
GGGACTGGAGGGGAGGAAG |
ACCAGCACGCAAAGCACCAGC | 5′HEX |
| R:
AACTTCTGAAGGTTCCTGTTGTTC | | 3′BHQ1 |
| FLJ33915 | F:
GCCCAGGCGAGGTGGAAGG |
ACGTCTGCCTCAGCCTGCTCG | 5′FAM |
| R:
GACCAGGGACGCTCGATTTC | | 3′BHQ1 |
| HNRPC | F:
GGCTTCAATTCTAAGAGTGGACAG |
TGGGTCAGCTCCTTCTTAATGGCCT | 5′FAM |
| R:
TCCAGGTTTTCCAGGAGAGAATC | | 3′BHQ1 |
| SET | F:
GAAATATAACAAACTCCGCCAACC |
CAGTGCCTCTTCATCTTCCTCCCCA | 5′HEX |
| R:
AATTCTGTCACTTCAACTCTGGTC | | 3′BHQ1 |
| HSPE1 | F:
TTGAAAGGAGTGCTGCTGAAAC |
AGAACCCGATCCAACAGCGACTACT | 5′Texas Red |
| R:
CACGCTAACTGGTTGAATCTCTC | | 3′BHQ2 |
| HCG2040681 | F:
TGCAGGAGTTTAAAACGAGAGTG |
TCCTTCCCTTTGCCTGTGGTGTCA | 5′Cy5 |
| R:
CCCATCCAGTGACTTTGCTTTAG | | 3′BHQ3 |
| RPS7 | F:
TCTTCTGGAGCTGGAGATGAAC |
AGCTTTCCGACCACCACCAACTTC | 5′FAM |
| R:
TGAGGAACGGGAACAAAGATTATG | | 3′BHQ1 |
| OSBPL1 | F:
GAGTGGGGAGAAGCTGAAGG |
CCACCCTCTTCCGCATCACATCC | 5′HEX |
| R:
CTGCCATTTCCGACTGTGTATC | | 3′BHQ1 |
| ETF1 | F:
AGGAGGAGGCGAGAAGATGG |
ACGACCCCAGTGCTGCCGAC | 5′Texas Red |
| R:
GAAATCTGGTCTTTGGGAGGAATG | | 3′BHQ2 |
| ENY2 | F:
GTAACGGTCCTCAGCGCAAG |
CATCTTGCTAACCACCATCACCGCG | 5′FAM |
| R:
AACTTTTGGTTAATCGCTGCTCTC | | 3′BHQ1 |
| USP38 | F:
CAGCATCTTTTTGCCTTTCTGG |
ACACAGAGGGAAGCATACGCACCT | 5′HEX |
| R:
CTGAGGTATTCAGAACAGTCTTGC | | 3′BHQ1 |
| ACTB | F:
GCACAGAGCCTCGCCTTTG |
CCGCCGCCCGTCCACACC | 5′Texas Red |
| R:
CATGCCGGAGCCGTTGTC | | 3′BHQ2 |
| 18S | F:
GGCTCATTAAATCAGTTATGGTTCC |
TGGTCGCTCGCTCCTCTCCTACT | 5′Cy5 |
| R:
CGGGTTGGTTTTGATCTGATAAATG | | 3′BHQ3 |
We analysed the data with the LightCycler software.
Briefly, three serial 10-fold dilutions of cDNA from 50 normal
individuals were amplified in duplicates to construct standard
curves and to set the baseline. Standard curves generated by the
software were used for extrapolation of the expression level for
the unknown samples based on their threshold cycle (Ct) values. For
each reaction, melting curves and agarose gel electrophoresis of
PCR products, enzyme digests and sequencing, were used to verify
the identity of the amplification products. All experiments were
performed with at least two independent PCR reactions.
Statistical analysis
In our study, the gene expression of the 50 healthy
individuals was set as the normal baseline. A gene was considered
to be significantly differentially expressed (over- or
underexpressed), if the ratio of the expression level in the cancer
sample to the expression level in the blood of healthy individuals
was higher than 4.0, which indicated a 4-fold increase in
expression, or if the ratio was lower than 0.3. The results
obtained by real time RT-PCR for each gene and patients’
clinopathological data, molecular staging and second primary tumour
development were analysed using Multivariate Analysis of Variance
(MANOVA). When significant differences were observed, discriminant
function analysis was used to assess the relative contribution of
each dependent variable. Each group of genes was considered the
independent variable, while the patients’ clinicopathological data,
molecular staging and development of a second primary tumour were
the dependent variables. All statistical analyses were performed
using SPSS software for Windows (SPSS Inc., Chicago, IL) and a
P-value of <0.05 was considered to be statistically
significant.
Results
The molecular classification subgroups of patients
(Luminal A, B, HER2 subtype and Basal) were compared for gene
deregulation levels of the classifiers and of each gene solely.
MANOVA for the five-gene classifier ENY2, USP38, RPS7, OSBPL1 and
ETF1 revealed a statistically significant difference between HER2
subtype patients and the rest of the molecular subgroups (Wilks’
lambda: 0.85, F=2.42, P<0.04). Discriminant analysis indicated
that ETF1 is the most important gene predictor, separating the HER2
subtype from the rest of the subtypes, (Wilks’ lambda: 0.93,
F=5.32, P<0.02). Furthermore, FLJ33915 gene expression was found
to differ significantly in lymph node positive HER2 subtype
patients vs. lymph node negative HER2 subtype patients (0.35±0.08
and 0.63±0.08, respectively, P<0.028) (Table IV). None of the other genes or
classifiers of genes examined in this study were statistically
significantly correlated with any molecular classification
subtype.
| Table IVAssociation of genes and classifiers
with a second primary malignancy and HER2 subgrouping. |
Table IV
Association of genes and classifiers
with a second primary malignancy and HER2 subgrouping.
| Classifier | Genes | Function | Statistical
significance (P-value) |
|---|
| First | FLJ38663, LOC34563,
MTRF1L, COMMD1, C10ORF22, STARD7, BAG3, SNX26 | Second primary
tumour predictor (single tumour vs. second primary) | <0.02 |
| Third | FBX033,
FLJ339115 | Second primary
tumour predictor (single tumour vs. normal) | <0.01 |
| Fifth | ENY2, USP38, RPS7,
OSBPL1, ETF1, FLJ33915 | HER2 subtype
predictor | 0.02 |
| HER2 subtype
subgrouping (with and without lymph node infiltration) | <0.028 |
The two-gene classifiers ENY2 and USP38 were
observed to be differentially expressed in breast cancer patients
when compared to healthy individuals. Using descriptive statistics
we found that 85/88 patients (95.6%) presented ENY2 expression
levels lower than 0.4 of the normal expression levels and 70/88
patients presented USP38 expression at levels lower than 0.4 of the
normal expression. In addition, we also observed that 72/88
patients (81.8%) presented C10ORF >3, 86/88 (97.7%) and RPS7
<0.21 and 62/88 patients (70.5%) presented FBX033 expression
<0.3. In all of the cases, 1 was considered as the normal
expression level.
The 8-gene classifier (genes FLJ38663, LOC34563,
MTRF1L, COMMD 1, C10ORF22, STARD7, BAG3 and SNX26) was indicative
of the development of second primary tumours after comparing
individuals with a second primary malignancy vs. individuals with
one primary malignancy, (Wilks’ lambda: 0.83, F=2.61, p<0.02)
(Table IV; Fig. 1A and B). The case was similar for
the 2-gene classifier (FBX033 and FLJ339115), in the comparison of
individuals with a second primary malignancy vs. healthy
individuals. There was a statistically significant difference in
the degree of deregulation (Wilks’ lambda: 0.89, F=4.92, p<0.01)
(Table IV, Fig. 1C).
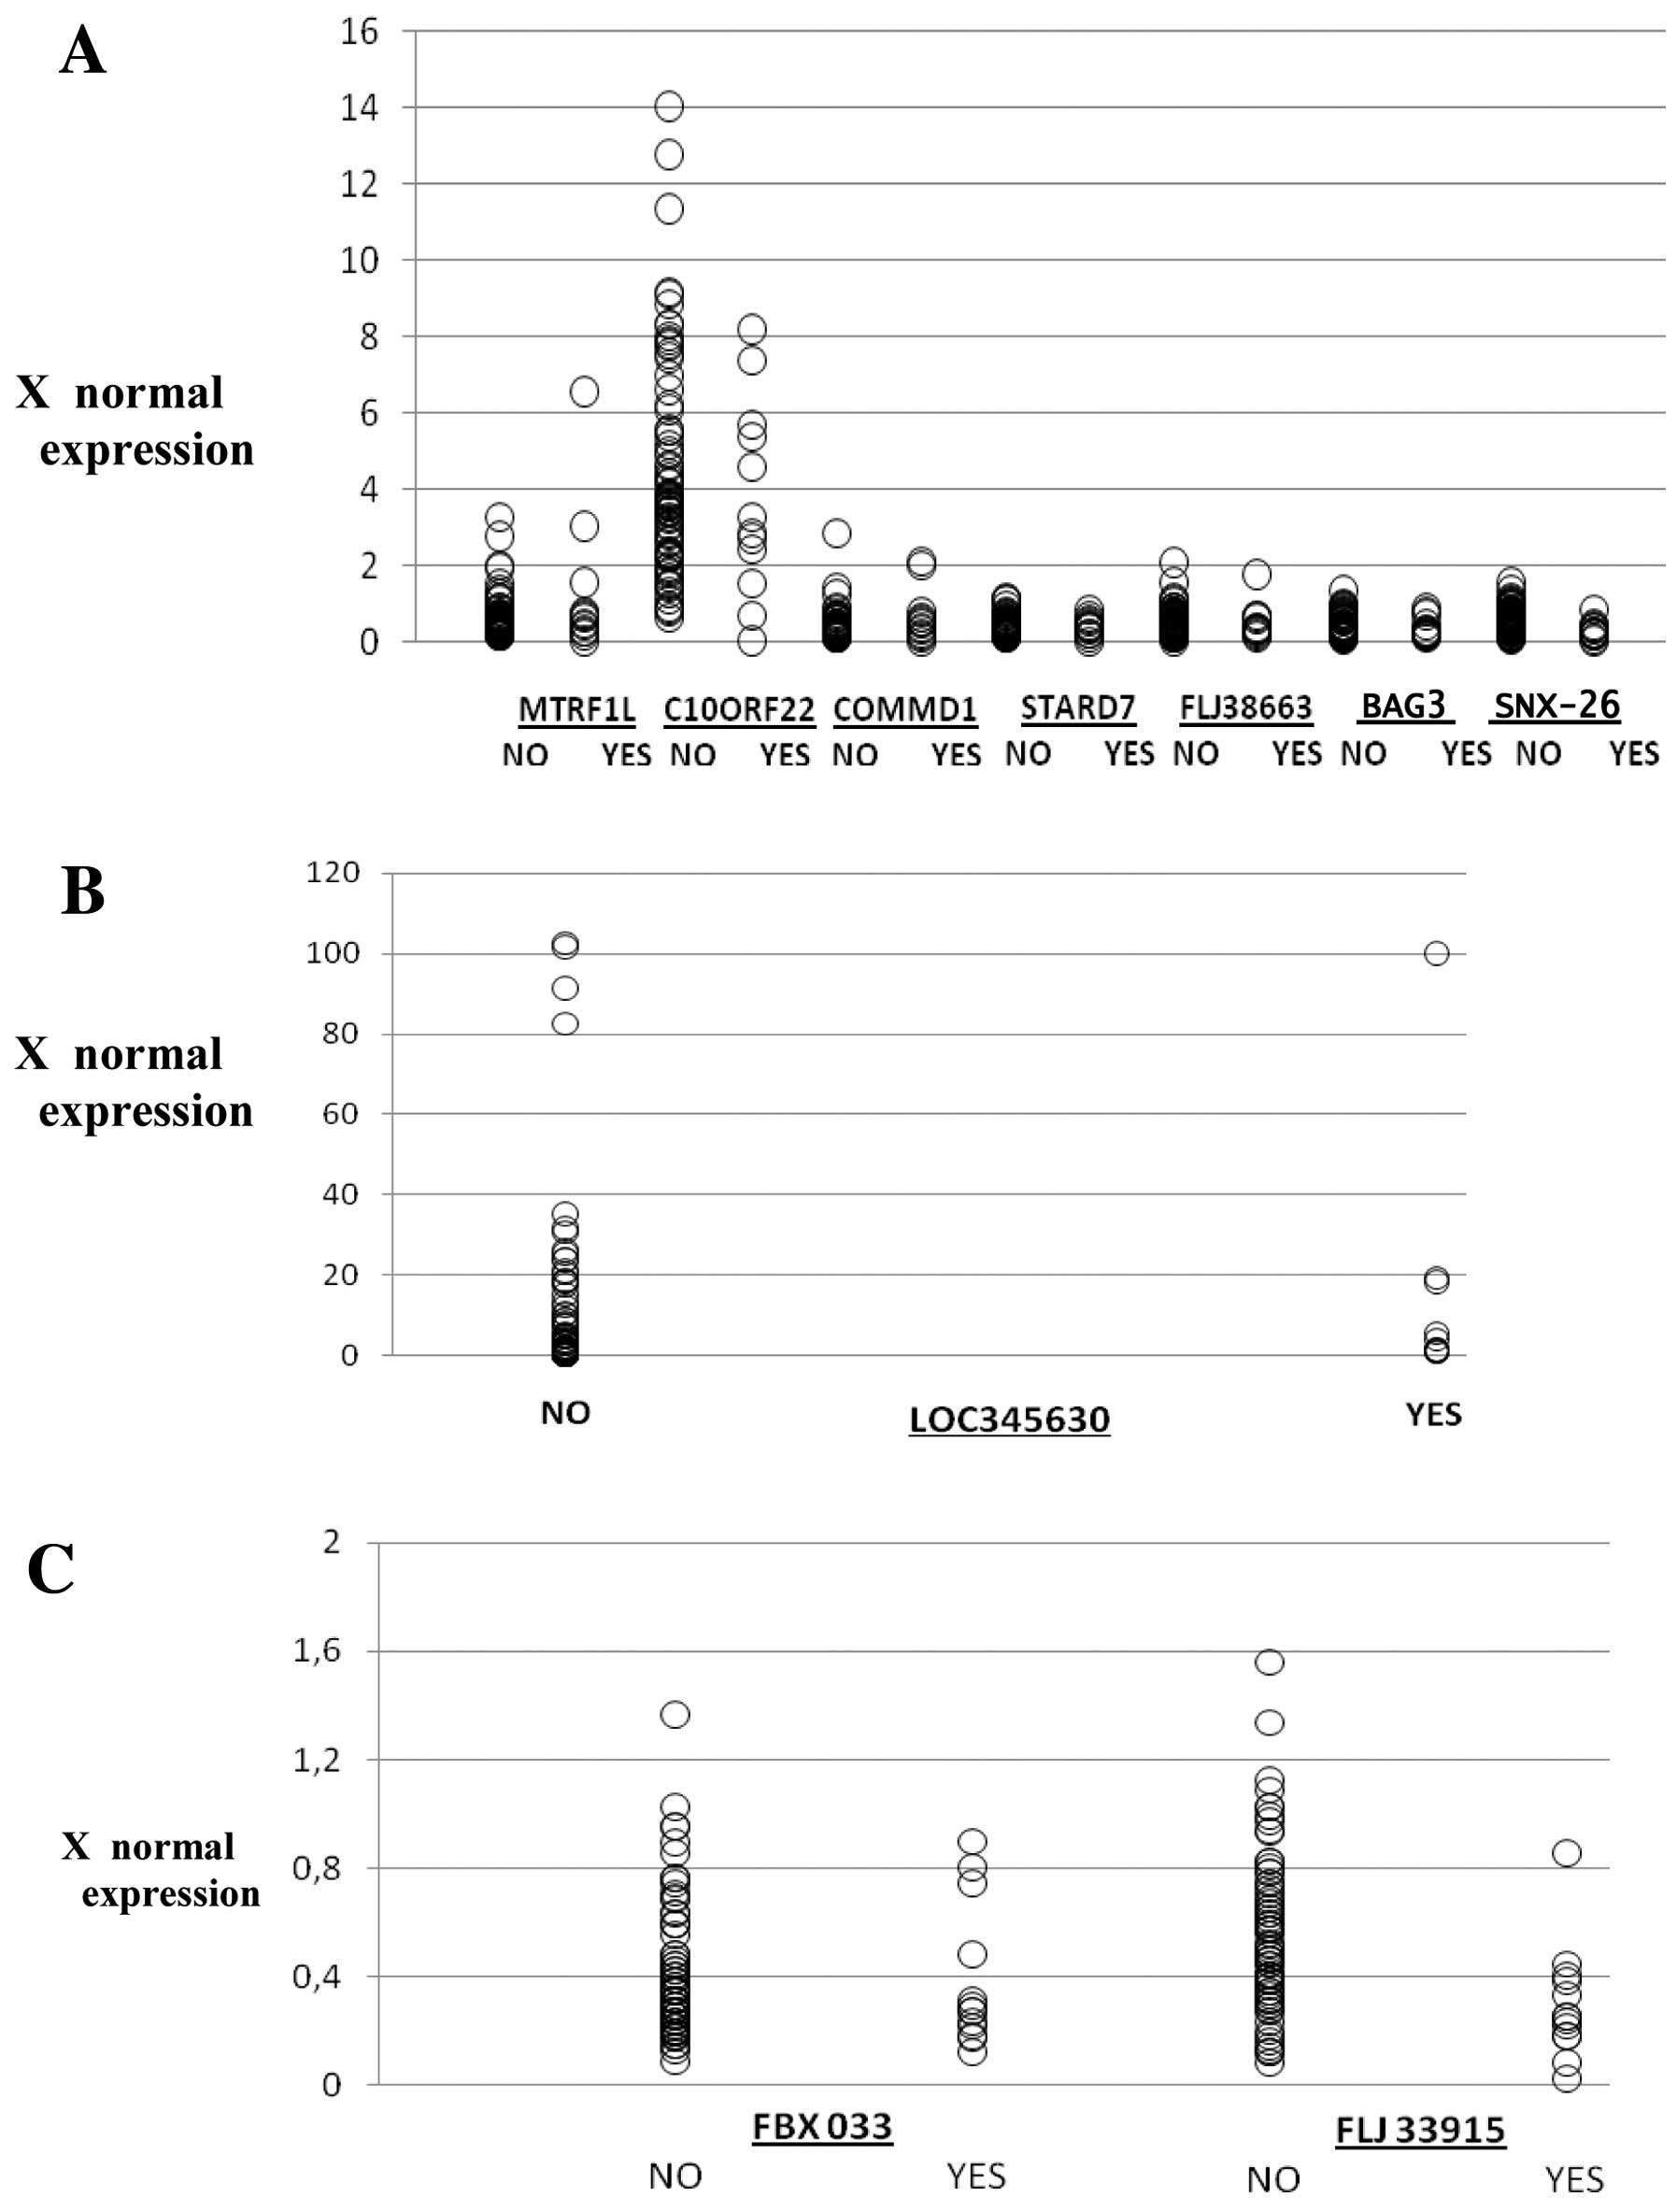 | Figure 1(A) The mRNA levels (times to normal
expression) of MTRF1L, C10ORF22, COMMD1, STARD7, FLJ38663, BAG3,
SNX26 and LOC345630, in patients negative (NO) or positive (YES) to
the development of second primary malignancies using real-time
RT-PCR. Each circle represents a patient. (B) Although we changed
the scale for LOC345630 expression, three patients with very high
values have not been included in this representation. Furthermore,
it should ne noted that although there is little difference in the
expression of each of these genes between individuals with a single
cancer and individuals with a second primary tumour, together as a
classifier, they represent a very useful tool for the determination
of single breast cancer individuals susceptible to developing a
second primary tumour. (C) The mRNA levels (times to normal
expression) of FBX033 and FLJ33915 in patients negative (NO) or
positive (YES) to the development of second primary malignancies
using real-time RT-PCR. |
Discussion
The 19 genes and the gene classifiers were examined
in order to find correlations with the molecular classification
subgroups. These genes and classifiers were also examined to
determine the relationships between primary breast cancer and
second primary cancer in breast cancer patients. The results of
this study concur with those previously published (17), suggesting that the proposed gene
classifiers may be an attractive candidate with prognostic value of
breast cancer heterogeneity.
The three-gene classifier (RPS7, OSBPL1 and ETF1)
that was found to be related to breast cancer development, may be
of value as a prognostic marker. Deregulation in the expression of
each of these three genes was observed only in breast cancer
patients and not in the healthy individuals. The patients with
second primary tumours presented downregulation of FBX033,
FLJ339115 gene expression (2-gene classifier) which was not
observed in healthy individuals.
The 8-gene classifier was useful for the prognosis
of second primary tumours in breast cancer patients. Therefore, the
prognostic value for second primary tumour development is directed
at: i) the 2-gene classifier (FBX033 and FLJ339115) in healthy
individuals and ii) the 8-gene classifier (genes FLJ38663,
LOC34563, MTRF1L, COMMD 1, C10ORF22, STARD7, BAG3 and SNX26) in
breast cancer patients.
Out of the 19 genes examined here, three (HNRPC, SET
and HSPE1), are known to be directly related to carcinogenesis. The
remaining 16 are not directly associated with cancer development
(20–24) (Table
V). These genes are involved in certain pathways, such as p53
protein stabilisation, the ubiquitin proteosome pathway,
angiogenesis, cell survival and proliferation, G2 to M transition
and protein synthesis, where defects in each of these may lead,
indirectly, to cancer development (25–37).
Our data suggests that some of these genes, not solely but as parts
of a classifier can be used for the prognosis of breast cancer.
These results were observed after comparing gene deregulation
between healthy individuals, breast cancer patients and breast
cancer patients with a second primary tumour.
| Table VDescription of the genes included in
our study and their association with cancer. |
Table V
Description of the genes included in
our study and their association with cancer.
| Gene | Function | Cancer
involvement |
|---|
| HCG2040681 | Unclassified
gene | |
| FBXO33 | Protein-ubiquitin
ligase; F-box proteins interact with SKP1 through the F box, and
they interact with ubiquitination targets through other protein
interaction domains and mediate the ubiquitination and subsequent
proteasomal degradation of target proteins (UPP) (20) | |
| FLJ38663 | Nuclear gene
encodes a mitochondrial matrix protein that appears to contribute
to peptide chain termination in the mitochondrial translation
machinery; two different 1-bp deletions (resulting in the same
premature stop codon) result in decreased mitochondrial
translation, decreased levels of oxidative phosphorylation
complexes and encepthalomyopathy; alternative splicing results in
multiple transcript variants (21) | |
| ENY2 | Component of the
transcription regulatory histone acetylation (HAT) complex SAGA, a
multiprotein complex that activates transcription by remodeling
chromatin and mediating histone acetylation and deubiquitination;
it may also participate in mRNA export and accurate chromatin
positioning in the nucleus by tethering genes to the nuclear
periphery; USP 38 ubiquitin specific peptidase which is involved in
ubiquitin catabolism (22) | |
| HNRPC | Essential for
mitochondrial protein biogenesis, together with CPN60; it binds to
CPN60 in the presence of Mg-ATP and suppresses the ATPase activity
of the latter (23) | Breast cancer |
| SET | Highly conserved
nuclear phosphoprotein that is ubiquitously expressed (24,25);
SET has been suggested to regulate G2/M and in transition by
modulating cyclin B-CDK1 activity | Overexpressed in
solid tumours of the breast, stomach, uterus and rectum and in
leukaemia (26) |
| HSPE1 | Proangiogenetic
growth factor functions together with VEGF | Involved in the
metastatic biology of ovarian cancer (27) |
| OSBPL1 | Membrane-bound
protein that binds oxysterols and may inhibit their cytotoxicity
and, there are alternative transcriptional splice variants that
have not have not yet been fully characterised (28) | |
| RPS7 | Ribosomal protein
is a component of the 40S subunit; this protein belongs to the S7E
family of ribosomal proteins; it is located in the cytoplasm; as is
typical for genes encoding ribosomal proteins, there are multiple
processed pseudogenes of this gene dispersed through the genome; in
our case the RPS7 mRNA was induced up to 33 times more than the
normal levels and it is believed to be a p53 MDM2 interaction
modulator (29) | |
| ETF1 | Functions as an
omnipotent translation termination factor, decoding all 3 stop
codons (30) | |
| BAG3 | Promotes substrate
release after binding to the Hsc70/Hsp70 ATPase domain and inhibits
its chaperone activity (31) | |
| C10ORF | Human thiol
dioxygenases include cysteine dioxygenase (CDO; MIM 603943) and
cysteamine (2-aminoethanethiol) dioxygenase (ADO; EC 1.13.11.19);
CDO adds 2 oxygen atoms to free cysteine, whereas ADO adds 2 oxygen
atoms to free cysteamine to form hypotaurine (32) | |
| COMMD1 | Associated with
copper homeostasis, NF-κB signalling, and sodium transport and in
HIF-1 signalling; hypoxia-inducible factors (HIFs) also regulate
oxygen homeostasis, which control angiogenesis, erythropoiesis,
glycolysis and cell survival/proliferation under normal and
pathological conditions (33) | |
| STARD7 | Unknown function;
its existence is supported by mRNA and EST data; the predicted gene
product contains a region similar to the STAR-related lipid
transfer (START) domain, which is often present in proteins
involved in the cell signalling mediated by lipid binding; some
transcripts occur only in cancer cell lines (34) | |
| SNX26 | This gene encodes a
member of the sorting nexin family; members of this family contain
a phox (PX) domain, which is a phosphoinositide-binding domain, and
they are involved in intracellular trafficking; alternative splice
variants encoding different isoforms have been identified in this
gene (35) | |
| USP38 | Ubiquitin specific
peptidase is involved in ubiquitin catabolism (36) | |
| LOC345630 | Unclassified
gene | |
| MTRF1L | Mitochondrial
peptide chain release factor directs the termination of translation
in response to the peptide chain termination codons UAA and UAG
(37) | |
| FLJ33915 | Hypothetical
protein | |
The 5-gene classifier (ENY2, USP38, RPS7, OSBPL1 and
ETF1) deregulation presents a statistically significant difference
between the HER2 subtype versus the rest of the subgroups of
molecular classification. By further analysis, the ETF1 gene was
conceived as the most important factor that is deregulated in the
majority of patients categorised as the HER2 subtype. The fact that
not all the patients with the HER2 subtype presented with
significant deregulation of ETF1 may be an indication of its
usefulness as a marker for the sub-grouping of the HER2 subtype
group. Moreover, FLJ33915 downregulation was associated with lymph
node infiltration in HER2 subtype patients. Prior to the
classification of breast cancer patients into the 4 molecular
classification subtypes (Luminal A, Luminal B, HER2 and Basal),
some of the factors that were traditionally considered for the
prognosis of the disease were not included; lymph node infiltration
is one of them. The fact that FLJ33915 gene deregulation is
statistically significantly associated with lymph node infiltration
in patients with the HER2 subtype, suggests its potential
usefulness in subdividing this subtype. This evidence is also an
indication that perhaps it is wise to reconsider the evaluation of
lymph nodes at least in patients with the HER2 subtype.
In conclusion, the findings summarises above suggest
that the use of the genomic tests mentioned in this study may
improve our ability to identify high-risk breast cancer patients
prone to develop a second primary tumour and healthy individuals
who may develop breast cancer. These patients may benefit from the
prognostic power of the molecular signatures based on gene
expression which is driven by genes that are not directly
associated with cancer development. Instead, these genes are
associated with tumour development and progression. Furthermore, we
present evidence of a possible sub-categorisation of HER2 subtype
patients, based on the expression profile of FLJ33915.
Acknowledgements
We would like to thank the patients that
participated in this study.
References
|
1
|
Sotiriou C and Pusztai L: Gene-expression
signatures in breast cancer. N Engl J Med. 360:790–800. 2009.
View Article : Google Scholar : PubMed/NCBI
|
|
2
|
Oakman C, Santarpia L and Di Leo A: Breast
cancer assessment tools and optimizing adjuvant therapy. Nat Rev
Clin Oncol. 7:723–732. 2010. View Article : Google Scholar : PubMed/NCBI
|
|
3
|
Wirapati P, Sotiriou C, Kunkel S, Farmer
P, Pradervand S, Haibe-Kains B, Desmedt C, Ignatiadis M, Sengstag
T, Schütz F, et al: Meta-analysis of gene expression profiles in
breast cancer: toward a unified understanding of breast cancer
subtyping and prognosis signatures. Breast Cancer Res. 10:R652008.
View Article : Google Scholar : PubMed/NCBI
|
|
4
|
Weigelt B, Hu Z, He X, Livasy C, Carey LA,
Ewend MG, Glas AM, Perou CM and Van’t Veer LJ: Molecular portraits
and 70-gene prognosis signature are preserved throughout the
metastatic process of breast cancer. Cancer Res. 65:9155–9158.
2005. View Article : Google Scholar : PubMed/NCBI
|
|
5
|
Parker JS, Mullins M, Cheang MC, Leung S,
Voduc D, Vickery T, Davies S, Fauron C, He X, Hu Z, et al:
Supervised risk predictor of breast cancer based on intrinsic
subtypes. J Clin Oncol. 27:1160–1167. 2009. View Article : Google Scholar : PubMed/NCBI
|
|
6
|
Correa Geyer F and Reis-Filho JS:
Microarray-based gene expression profiling as a clinical tool for
breast cancer management: are we there yet? Int J Surg Pathol.
17:285–302. 2009.PubMed/NCBI
|
|
7
|
Cosler LE and Lyman GH: Economic analysis
of gene expression profile data to guide adjuvant treatment in
women with early-stage breast cancer. Cancer Invest. 27:953–959.
2009. View Article : Google Scholar : PubMed/NCBI
|
|
8
|
Perou CM, Sorlie T, Eisen MB, van de Rijn
M, Jeffrey SS, Rees CA, Pollack JR, Ross DT, Johnsen H, Akslen LA,
et al: Molecular portraits of human breast tumours. Nature.
406:747–752. 2000. View
Article : Google Scholar : PubMed/NCBI
|
|
9
|
Feng Y, Li X, Sun B, Wang Y, Zhang L, Pan
X, Chen X, Wang X, Wang J and Hao X: Evidence for a transcriptional
signature of breast cancer. Breast Cancer Res Treat. 122:65–75.
2009. View Article : Google Scholar
|
|
10
|
Creighton CJ, Fu X, Hennessy BT, Casa AJ,
Zhang Y, Gonzalez- Angulo AM, Lluch A, Gray JW, Brown PH and
Hilsenbeck S: Proteomic and transcriptomic profiling reveals a link
between the PI3K pathway and lower estrogen-receptor (ER) levels
and activity in ER+ breast cancer. Breast Cancer Res.
12:R402010. View
Article : Google Scholar
|
|
11
|
Chernov AV, Baranovskaya S, Golubkov VS,
Wakeman DR, Snyder EY, Williams R and Strongin AY: Microarray-based
transcriptional and epigenetic profiling of matrix
metalloproteinases, collagens, and related genes in cancer. J Biol
Chem. 285:19647–19659. 2010. View Article : Google Scholar
|
|
12
|
Sorlie T, Tibshirani R, Parker J, Hastie
T, Marron JS, Nobel A, Deng S, Johnsen H, Pesich R, Geisler S, et
al: Repeated observation of breast tumor subtypes in independent
gene expression data sets. Proc Natl Acad Sci USA. 100:8418–8423.
2003. View Article : Google Scholar : PubMed/NCBI
|
|
13
|
Miecznikowski JC, Wang D, Liu S, Sucheston
L and Gold D: Comparative survival analysis of breast cancer
microarray studies identifies important prognostic genetic
pathways. BMC Cancer. 10:5732010. View Article : Google Scholar
|
|
14
|
Chen H, Pimienta G, Gu Y, Sun X, Hu J, Kim
MS, Chaerkady R, Gucek M, Cole RN, Sukumar S and Pandey A:
Proteomic characterization of Her2/neu-overexpressing breast cancer
cells. Proteomics. 16:3600–3610. 2010.
|
|
15
|
Tebbit CL, Zhai J, Untch BR, Ellis MJ,
Dressman HK, Bentley RC, Baker JA, Marcom PK, Nevins JR, Marks JR
and Olson JA Jr: Novel tumor sampling strategies to enable
microarray gene expression signatures in breast cancer: a study to
determine feasibility and reproducibility in the context of
clinical care. Breast Cancer Res Treat. 118:635–643. 2009.
View Article : Google Scholar
|
|
16
|
Centeno BA, Enkemann SA, Coppola D,
Huntsman S, Bloom G and Yeatman TJ: Classification of human tumors
using gene expression profiles obtained after microarray analysis
of fine-needle aspiration biopsy samples. Cancer. 105:101–109.
2005. View Article : Google Scholar
|
|
17
|
Stathopoulos GP and Armakolas A:
Differences in gene expression between individuals with multiple
primary and single primary malignancies. Int J Mol Med. 24:613–622.
2009. View Article : Google Scholar : PubMed/NCBI
|
|
18
|
Sørlie T: Molecular classification of
breast tumors: toward improved diagnostics and treatments. Methods
Mol Biol. 360:91–114. 2007.PubMed/NCBI
|
|
19
|
Sørlie T, Perou CM, Tibshirani R, Aas T,
Geisler S, Johnsen H, Hastie T, Eisen MB, van de Rijn M, Jeffrey
SS, et al: hnRNP C is required for postimplantation mouse
development but Is dispensable for cell viability. Mol Cell Biol.
20:4094–4105. 2000.PubMed/NCBI
|
|
20
|
Adachi Y, Pavlakis GN and Copeland TD:
Identification and characterization of SET, a nuclear
phosphoprotein encoded by the translocation break point in acute
undifferentiated leukemia. J Biol Chem. 269:2258–2262. 1994.
|
|
21
|
Canela N, Rodriguez-Vilarrupla A, Estanyol
JM, Diaz C, Pujol MJ, Agell N and Bachs O: The SET protein
regulates G2/M transition by modulating cyclin B-cyclin-dependent
kinase 1 activity. J Biol Chem. 278:1158–1164. 2003. View Article : Google Scholar : PubMed/NCBI
|
|
22
|
Ozbek U, Kandilci A, van Baal S, et al:
SET-CAN the product of t(9;9) in acute undifferentiated leukaemia,
causes expansion of early haematopoietic progenitors and
hyperproliferation of stomach mucosa in transgenic mice. Am J
Pathol. 171:654–666. 2007. View Article : Google Scholar
|
|
23
|
Ralph S, Brenchley PE, Summers A, Rosa DD,
Swindell R and Jayson GC: Heparanase gene haplotype (CGC) is
associated with stage of disease in patients with ovarian
carcinoma. Cancer Sci. 98:844–849. 2007. View Article : Google Scholar : PubMed/NCBI
|
|
24
|
Sørlie T, Perou CM, Tibshirani R, Aas T,
Geisler S, Johnsen H, Hastie T, Eisen MB, van de Rijn M, Jeffrey
SS, et al: Gene expression patterns of breast carcinomas
distinguish tumor subclasses with clinical implications. Proc Natl
Acad Sci USA. 98:10869–10874. 2001.PubMed/NCBI
|
|
25
|
Lutz M, Wempe F, Bahr I, Zopf D and von
Melchner H: Proteasomal degradation of the multifunctional
regulator YB-1 is mediated by an F-Box protein induced during
programmed cell death. FEBS Lett. 580:3921–3930. 2006. View Article : Google Scholar : PubMed/NCBI
|
|
26
|
Antonicka H, Ostergaard E, Sasarman F,
Weraarpachai W, Wibrand F, Pedersen AM, Rodenburg RJ, van der Knaap
MS, Smeitink JA, Chrzanowska-Lightowlers ZM and Shoubridge EA:
Mutations in C12orf65 in patients with encephalomyopathy and a
mitochondrial translation defect. Am J Hum Genet. 87:115–122. 2010.
View Article : Google Scholar : PubMed/NCBI
|
|
27
|
Sowa ME, Bennett EJ, Gygi SP and Harper
JW: Defining the human deubiquitinating enzyme interaction
landscape. Cell. 138:389–403. 2009. View Article : Google Scholar : PubMed/NCBI
|
|
28
|
Torrini M, Marchese C, Vanzetti M, Marini
V, Origone P, Garré C and Mareni C: Mutation analysis of
oxisterol-binding-protein gene in patients with age-related macular
degeneration. Genet Test. 11:421–426. 2007. View Article : Google Scholar : PubMed/NCBI
|
|
29
|
Chen D, Zhang Z, Li M, Wang W, Li Y,
Rayburn ER, Hill DL, Wang H and Zhang R: Ribosomal protein S7 as a
novel modulator of p53-MDM2 interaction: binding to MDM2,
stabilization of p53 protein, and activation of p53 function.
Oncogene. 26:5029–5037. 2007. View Article : Google Scholar : PubMed/NCBI
|
|
30
|
Costanzo M, Baryshnikova A, Bellay J, Kim
Y, Spear ED, Sevier CS, Ding H, Koh JL, Toufighi K, Mostafavi S, et
al: The genetic landscape of a cell. Science. 22: 327:425–431.
2010.
|
|
31
|
Doong H, Rizzo K, Fang S, Kulpa V,
Weissman AM and Kohn EC: CAIR-1/BAG-3 abrogates heat shock
protein-70 chaperone complex-mediated protein degradation:
accumulation of poly-ubiquitinated Hsp90 client proteins. J Biol
Chem. 278:28490–28500. 2003. View Article : Google Scholar
|
|
32
|
Du X, Nagata S, Ise T, Stetler-Stevenson M
and Pastan I: FCRL1 on chronic lymphocytic leukemia, hairy cell
leukemia, and B-cell non-Hodgkin lymphoma as a target of
immunotoxins. Blood. 111:338–343. 2008. View Article : Google Scholar : PubMed/NCBI
|
|
33
|
Malek SN, Dordai DI, Reim J, et al:
Malignant transformation of early lymphoid progenitors in mice
expressing an activated Blk tyrosine kinase. Proc Natl Acad Sci
USA. 95:7351–7356. 1998. View Article : Google Scholar : PubMed/NCBI
|
|
34
|
Tschumper RC, Geyer SM, Campbell ME, et
al: Immunoglobulin diversity gene usage predicts unfavorable
outcome in a subset of chronic lymphocytic leukemia patients. J
Clinc Invest. 118:306–315. 2008. View
Article : Google Scholar : PubMed/NCBI
|
|
35
|
Vitek L and Schwertner HA: The heme
catabolic pathway and its protective effects on oxidative
stress-mediated diseases. Adv Clin Chem. 43:1–57. 2007. View Article : Google Scholar : PubMed/NCBI
|
|
36
|
Mani A and Gelmann EP: The
ubiquitin-proteasome pathway and its role in cancer. J Clin Oncol.
23:4776–4789. 2005. View Article : Google Scholar : PubMed/NCBI
|
|
37
|
Yanagisawa M, Huveldt D, Kreinest P, et
al: p120 catenin isoform switch affects Rho activity, induces tumor
cell invasion and predicts metastatic disease. J Biol Chem.
283:18344–18354. 2008. View Article : Google Scholar
|


