Introduction
Pancreatic cancer is one of the most lethal cancers,
with an incidence equaling mortality. It is a heterogeneous group
of neoplasmis in which pancreatic ductal adenocarcinoma is the most
common form (1).
Pancreatic cancers cannot be cured even if detected
early. It is one of the most aggressive and lethal cancers
worldwide and is highly resistant to chemotherapy. Over the past
decade, gemcitabine (2′,2′-difluorodeoxycytidine, GEM) has been the
first-line treatment for advanced pancreatic cancer, but it offers
only modest benefit due to pre-existing or acquired chemoresistance
(2). Furthermore, recent clinical
studies indicate that only 20% of patients with advanced pancreatic
cancer responsed to GEM (3).
Combining GEM with other chemotherapeutic agents improves the
therapeutic outcome, but results to date remain meager. Therefore,
novel approaches that significantly enhance the effects of GEM or
overcome chemoresistance to the drug are needed to effectively
combat pancreatic cancers.
Proteins that are released by human tumor cells
in vivo and reach the circulation are strongly outweighed by
all the normal blood constituents. Thus, seeking an alternative
source for the discovery of biomarkers for assessing ‘response to
GEM’, we have developed a protocol that provides direct
experimental access to a promising subproteome of proteins released
by human pancreatic cancer cells in vitro. Release of
proteins from tumor cells in vivo and in vitro is due
to diverse mechanisms and is not confined to classical secretion,
but for the sake of simplicity we follow previous publications and
refer to similar subproteomes subproteomes. Classical secretion is
the most obvious mode of protein release and is expected to be
relevant for proteins such as extracellular matrix molecules.
Exosomes are membrane-coated vesicles derived from multivesicular
bodies in the late endosomal compartment. They were first detected
as products of pancreatic cells and are regarded as important
devices for intercellular communication in the regulation of
responses to GEM. We have therefore established an empirical
approach for the isolation, identification and characterization of
the subset of proteins released by pancreatic carcinoma cells
treated with GEM in vitro. With this aim, we chose the
PNAC-1 pancreas carcinoma cell line as a model. Proteins were
harvested from conditioned media, concentrated and resolved using
two-dimensional difference in-gel electrophoresis (2D-DIGE) and
labeled with cyanine (Cy) dye.
Differential analysis showed that, 53 spots in the
gel revealed marked differences in protein expression. Twenty-two
spots were upregulated >1.2-fold in response to GEM treatment
and 31 spots were downregulated <0.66-fold (P<0.01). These
spots were picked from other gels which could be assigned to
distinct spots in the master gel. Approximately 50 proteins were
identified from these spots by nano-high-performance liquid
chromatography-electrospray ionization time of flight mass
spectrometry/mass spectrometry (HPLC-ESI-MS/MS). Most of them were
nominally cellular proteins. The identified proteins included the
secreted proteins 14-3-3 protein sigma (14-3-3 σ), protein S100-A8,
protein S100-A9, galectin-7, lactotransferrin (lactoferrin, LF)
precursor, serotransferrin (transferrin, TF) precursor, and vitamin
D binding protein precursor. Western blot analysis confirmed the
upregulation of 14-3-3 σ, which is associated with apoptosis, and
the dowregulation of LF was found to suppress tumorigenesis.
Materials and methods
Chemicals and reagents
Cy dye DIGE fluors (Cy2, Cy3 and Cy5 for minimal
labeling), IPG buffer (pH 3.0–10.0), Immobile DryStrip (24 cm, pH
3.0–10.0), sodium dodecyl sulfate (SDS),
N,N,N′,N′-tetramethylethylenediamine, bind-silane, urea and
thiourea were obtained from GE Healthcare (Tokyo, Japan).
N,N-dimethyformamide (DMF) was purchased from Sigma-Aldrich
(Tokyo, Japan). 2-amino-2-hydroxymethyl-1,3-propanediol
(Tris-(hydroxymethyl)-aminomethane), potassium hexacyanoferrate
(III), sodium thiosulfate, acetonitrile, acetone, dithiothreitol,
iodoacetamide and tetrafuloroacetic acid were obtained from Wako
Pure Chemical Industries, Ltd. (Osaka, Japan).
SYPRO Ruby was purchased from Invitrogen (Tokyo,
Japan). GEM chloride was obtained from Eli Lilly Japan K.K. (Kobe,
Japan). The Bradford protein assay kit was purchased from Bio-Rad
Laboratories (Tokyo, Japan). Centriplus YM-3 was obtained from
Millipore (Bedford, MA, USA).
Cell culture
The human pancreatic carcinoma cell line PANC-1 was
obtained from RIKEN BioResource Center Cell Bank (Japan). PANC-1
cells were maintained in Dulbecco’s modified Eagle’s medium (D-MEM)
supplemented with 10% fetal calf serum (FCS), 2 mM glutamine, 100
U/ml penicillin and 100 mg/ml streptomycin. For secretome
preparation, cells were cultured at 1.5×10⁶ cell/ml in
D-MEM until of 70–80% confluence (4).
Treatment with GEM
GEM at 10 μg/ml was added to the cells. The cells
were incubated for 24 h, then washed five times with
phosphate-buffer saline (PBS) and incubated in serum-free medium
(Sigma, St. Louis, MO, USA) for another 48 h. This protocol did not
measurably influence the apoptosis rate compared with standard
culture conditions. GEM exhibits cytotoxicity against cultured
PANC-1 cells with an IC50 value of 16 μg/ml (3).
Secretome purification
Conditioned medium was collected from the culture
dishes and cooled on ice. Floating cells and cellular debris were
removed by centrifugation (2000 × g, 10 min) followed by sterile
filtration (pore size, 0.22 μm) (5).
Proteins were concentrated by ultrafiltration using
Centriplus YM-3 centrifugal filter devices according to the
manufacturer’s instructions. The total protein amount was
determined using a standard Bradford protein assay.
2-DE and protein labeling with Cy
dye
For 2-D gel electrophoresis with Cy dye, to 50 μg
protein in medium acetone (20-fold) was added and incubated at
−20°C for 2 h. Then, acetone was removed by centrifugation (7000 ×
g, 5 min) and the precipitation was collected and dried in a
SpeedVac (VC-15SP, Titec Co., Ltd., Saitama, Japan). The pellet was
resuspended in 40 μl isoelectric focusing (IEF) sample buffer [30
mM Tris-HCl, 8 M urea, 4% (w/v)
3-(3-chloamideopropyl)dimethylammonio)-1-propanesulfonic acid
(CHAPS; pH 8.5)]. Cy dye stock (1 nMl/μl) was diluted in anhydrous
DMF (Sigma) to final concentration of 400 pM/μl and dye was added
per 50 μg protein. Two gels were used, control samples were labeled
with Cy3 and samples from GEM treatment were labeled with Cy5 for 2
gels (6). Cy3 and Cy5 were used for
the replacement samples for one gel. Protein (25 μg) from control
samples and GEM treatment samples were mixed and Cy2 was added to
prepare the internal standard. The samples were vortexed,
centrifuged for 10 sec, and incubated on ice for 30 min in the
dark. The labeling reaction was terminated by adding 1.0 μl
L-lysine stock solution (10 mM). Labeled proteins were mixed. Then,
330 μl inhibition buffer [8 M urea, 2% (w/v) CHAPS, 40 mM
dithiothreitol (DTT), pH 3.0–10.0, pharmalyte, 1% (w/v) bromophenol
blue] was added. We picked up the spot from another 2-D-gel to
analyze nano-HPLC-ESI-MS/MS.
Precipitation was performed using 2-D DIGE
technology (GE Healthcare). DIGE gels were scanned with Typhoon
9400 Variable Mode Imager (GE Healthcare). Excitation and emission
wavelengths were chosen specifically, supernatants was separated by
2-D polyacrylamide gel electrophoresis (PAGE) using immobilized pH
gradient (IPG) strips. IPG gel with a linear gradient of pH
3.0–10.0 (24 cm) was used for IEF. The IPG gel was rehydrated for
10 h at 20°C using an IPGphor (GE Healthcare Bioscience). IEF at
20°C was programmed as follows: 1 h at 500 Vh, 1 h at 800 Vh, 3 h
at 13.5 Vh, 3.75 h at 20–30 Vh (linear increase) (7). After IEF, the strips were incubated at
room temperature for 30 min in a buffer consisting of 1.5 M
Tris-HCl (pH 8.8), 6 M urea, 30% (v/v) glycerol, 2% SDS, 16 mM DTT,
and 0.002% bromophenol blue (BPB) (6). Then, they were incubated in
equilibration buffer containing 2.5 mg/ml iodoacetamide solution
(other components were the same as in the solution containing DTT
for 30 min) (6).
2-D SDS-PAGE on 10% running gel (24×20×0.15 cm) was
performed as described below. The protocol for SDS-PAGE at 20°C was
as follows: 20 min at 2.5 w/w gel, 3 h at 20 w/w gel. For each
preparative gel, a total of 150 μg protein labeled with Cy and 200
μg non-labeled protein was loaded.
2-DE image analysis
DIGE gel image was scanned at 100 μm resolution on
Typhoon 9410 variable mode imager (GE Healthcare) using
excitation/emission wavelengths specific for Cy2 (488/520 nm, blue
laser), Cy3 (532/580 nm, green laser) and Cy5 (633/670 nm, red
laser) (6). Laser power was chosen
so that no saturated signal was obtained from any protein spot.
Resolution was 100 μm. DIGE gels were analyzed using DeCyder 6.5
software (GE Healthcare) in batch processor mode with an estimated
number of spots set to 2200 and the spot exclusion filter set to
exclude any spot with a volume <7500. A batch processor was used
to link the Differential In-gel Analysis (DIA) and Biological
Variation Analysis (BVA) modules together in an automated fashion
(7–11). The gel containing the highest number
of spot features was designated the master gel, and manual spot
matching was then performed to correctly match the remaining three
Cy2 gel images and the Sypro Ruby stain master. In DIA, spot
boundaries and volumes were co-detected for Cy3, Cy5, and Cy2
channels on each gel, and protein spot abundance was expressed as a
standard:sample ratio. In BVA, protein abundance was compared
across multiple samples using the internal standard to normalize
between gels, and statistical analysis was performed to obtain the
average ratio and one-way analysis of variance values between
samples. The DIA module was used for pair wise comparisons of
control and GEM treatment groups with the mixed standard present in
each gel and for the calculation of normalized spot volume/protein
abundance.
Protein staining with SYPRO Ruby and
Silver nitrate
For 2-D-gel electrophoresis and MS analysis, acetone
(20-fold) was added to 200 μg non labeled proteins in medium. After
2 h at −20°C, acetone was removed by centrifugation (7000 × g, 5
min) and the precipitate was collected and dried in the SpeedVac.
Two hundred micrograms of protein was loaded on on the gel. The gel
was stained with SYPRO Ruby and spots of interest (downregulated
spots) were picked with a spot picker (Ettan DIGE Sopt Picker, GE
Healthcare). Another 200 μg non-labelled protein on the gel was
stained with Silver nitrate and spots of interest (upregulated
spots) were picked manually.
In-gel tryptic digestion
To identify proteins, silver-stained and SYPRO
Ruby-stained spots were excised from the gel. They were washed with
a solution of 30 mM potassium hexacyanoferrate (III) and 100 mM
sodium thiosulfate for 15 min, then washed three times with water.
Proteins in the gel were reduced with 10 mM DTT/100 mM
NH4HCO3 (90 min, 56°C) and alkylated with 55
mM iodoacetamide/100 mM NH4HCO3 (45 min, in
the dark at room temperature) (6).
Gel spots were washed with acetonitrile and dried in a SpeedVac.
Dried gel particles were rehydrated with digestion buffer
containing 20 ng/ml sequencing grade trypsin in 100 mM
NH4HCO3 at 0°C for 30 min. Then they were
incubated at 37.7°C overnight (6).
After digestion, peptides were first extracted from gel pieces with
50% ACN/0.1% tetra fluoroacetic acid (TFA) (50:50), followed by
second extracted from gel pieces with 75% ACN/0.1% TFA (75:25).
The two extracts were pooled and concentrated in a
SpeedVac, and 0.5% TFA was added to approximate 20 μl of the
concentrated solution. Desalting was performed using ZipiTip μC18
(Millipore, Bedford, MA) following the manufacturer’s
instructions.
Identification by mass spectrometry
Tryptic peptides were analyzed by
nano-HPLC-ESI-TOF-MS/MS using a nano Frontier LD (Hitachi High
Technologies, Ltd.). Peptide identifications were performed using
the Mascot search engine. Within the ProteinScape database, protein
search was initiated using Mascot search algorithms. Proteins were
identified by searching against a human subset of the Swiss-Prot
protein database using the Mascot 2.1.0 search algorithm. The
following search parameters were selected: up to one missed
cleavage site in case of in complete trypsin hydrolysis was allowed
and data were searched using carbamidation and oxidation as
variable modifications. The peptide mass tolerance was set at 0.5
Da for monoisotopic masses and 0.6 Da for fragment masses. All
searches were run in the mammalian protein subdatabase of
Swiss-Prot database to exclude putative contamination of bovine
serum proteins originating from the culture medium.
Similarly, tryptic peptides were analyzed by another
nano-HPLC-ESI-TOF-MS/MS using Agilent 6500 (Agilent Technologies,
Ltd.). Peptide identifications were performed using the Mascot
search engine (data not shown).
Western blot analysis
Protein concentrations were determined by the
Bradford assay using bovine serum albumin as a standard (Protein
Assay kit, Bio-Rad Laboratories). Total protein extracts (50 μg)
were mixed with SDS sample buffer (6.25 mM Tris-HCl, pH 6.8, 2.3%
SDS, 10% glycerol, 5% β-mercaptoethanol, 0.005% bromophenol blue)
and resolved by SDS-PAGE on 10–20% gradient acrylamide gels
(8). Proteins (50 μg) were detected
immunologically following semidry electrotransfer (Trans-Blot SD
semi-dry electrotransfer system, Bio-Rad Lboratories) onto PVDF
membranes (Millipore). The membranes were blocked with 5% non-fat
dry milk in Tris-buffered saline with Tween-100 for 30 min at room
temperature and incubated for 2 h at room temperature with the
following primary antibodies: anti-14-3-3 σ (1:1000, Abcam, rabbit
monoclonal antibody), and anti-LF (1:5000, Abcam, rabbit monoclonal
antibody). After washing three times in 0.5% non-fat dry milk in
Tris-buffered saline with Tween-100, blots were incubated with
horseradish peroxidase-conjugeated secondary antibody (diluted
1:5000, Abcam) for 2 h at room temperature. Immunoreactive
complexes were visualized using HRP-DAB detection kit (Wako). Bands
were measured and calculated using LAS-4000 (Fujifilm).
SDS-PAGE
Proteins in control and GEM treated smples (50 μg)
were analyzed by SDS-PAGE. We performed SDS-PAGE in the presence of
2-mercaptoethanol using slab gels in a Tris/glycine buffer system
(pH 8.3), as described by Schagger and von Jagow (12). The gel was stained with Coomassie
Brilliant Blue.
Results
Control media and GEM treated media were
filtered and concentrated
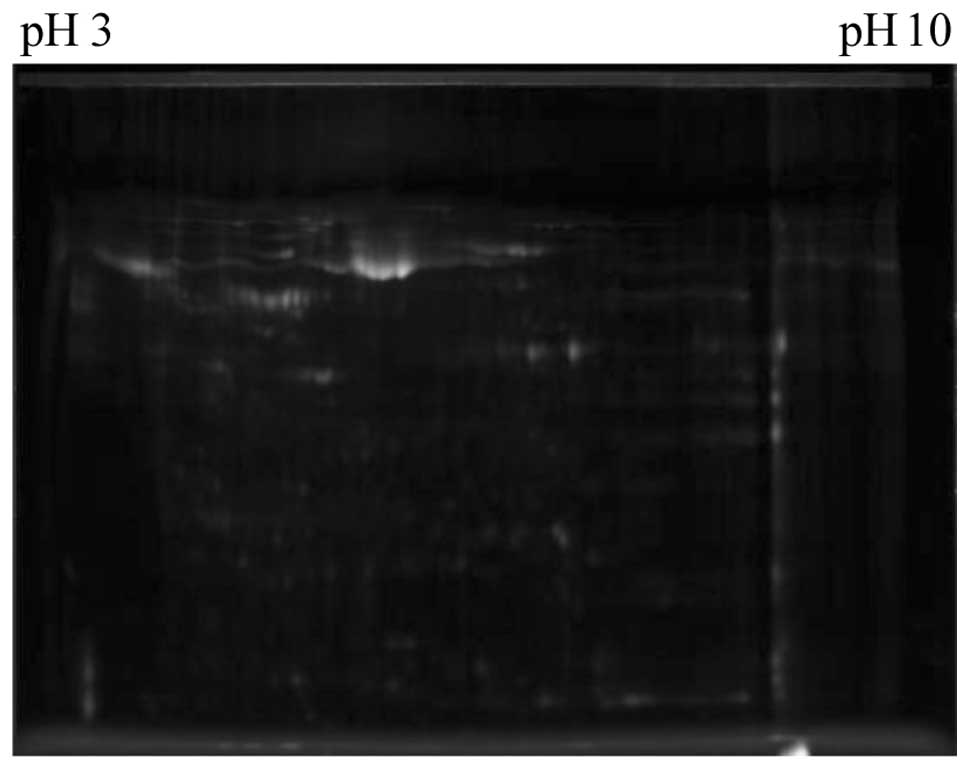
Proteins in control media and GEM treated media were
differentially labeled and analyzed by 2-D DIGE. Three replica gels
were considered for the quantitative and statistical analysis using
the DeCyder™ 6.5 software. This analysis revealed changes in the
abundance of 53 spots. Twenty-two spots were significantly
upregulated (average. GEM treatment/control ratio >1.2, P≤0.01),
whereas 31 were downregulated (average GEM treatment/control ratio
<0.66, P≤0.01). Fig. 1 shows a
representative 2-D gel image. Arrows indicate proteins identified
whose expression was within the 99th confidence level.
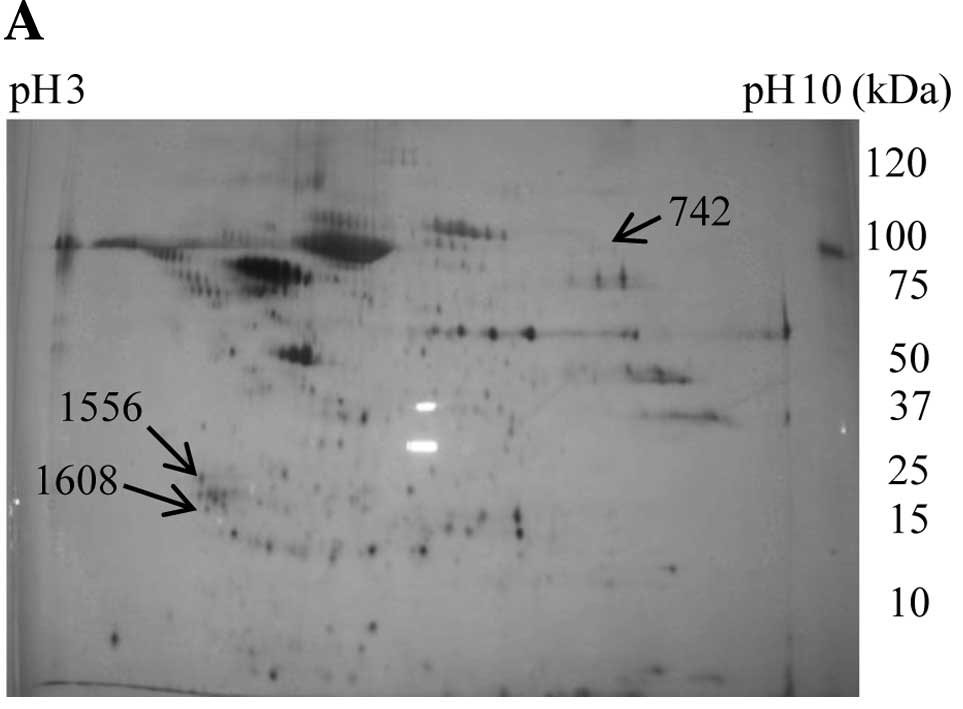
For MS analysis, each 200 μg of non-labeled protein
in the medium was subjected to 2-D gel electrophoresis. One gel was
stained with silver nitrate and another with SYPRO Ruby. Twenty-two
upregulated spots were picked from the gel stained with silver
(Fig. 2A, the data of 22 spots are
not shown), and 31 downregulated spots were picked from the gel
stained with SYPRO Ruby (Fig. 2B,
the data of 31 spots are not shown). After in-gel tryptic
digestion, protein identifications were combined using the Mascot
search engine against the Swiss-Prot database to yield a set of
‘mammalian’ protein identifications with confidence values.
Proteins identified as bovine or from another mammalian were
removed because of the possibility of contamination from bovine
serum albumin. As a result, 37 upregulated and 30 downregulated
‘human proteins’ were identified (data not shown). The subcellular
locations of most identified proteins were the cytoplasm, nucleus
and membrane. Secreted proteins among the upregulated proteins
comprised 14-3-3 σ, protein S100-A8, protein S100-A9 and
galectin-7. Secreted proteins among the downregulated proteins
comprised LF precursor, TF precursor, and vitamin D binding protein
precursor (Table I).
 | Table IIdentification of secreted proteins
picked from spots whose expression was changed by
nano-HPLC-ESI-TOF-MS/MS. |
Table I
Identification of secreted proteins
picked from spots whose expression was changed by
nano-HPLC-ESI-TOF-MS/MS.
| Codea | Protein | Entry nameb | Scorec | M.W.d | pIe | Peptide
sequencef | Amino acid
numberg | Cover (%)h | Ratioi | P-valuej |
|---|
| 532 | Lactotransferrin
precursor | TRFL | 75 | 78132 | 8.50 | LCAGTGENK | 191–199 | 4 | 0.41 | 0.033 |
| | | | | | DLLFK | 316–320 | | | |
| | | | | | DSAIGFSR | 321–328 | | | |
| | | | | | CGLVPVAENYK | 424–435 | | | |
| | | | | | YYGYTGAFR | 544–552 | | | |
| Serotransferrin
precursor | TREF | 45 | 77000 | 6.81 | CLKDGADVAFUK | 213–225 | 4 | 0.44 | 0.005 |
| | | | | | DLLFK | 311–315 | | | |
| | | | | | GDVAVK | 547–553 | | | |
| | | | | | DLLFR | 647–651 | | | |
| 542 | Lactotransferrin
precursor | TRFL | 44 | 78132 | 8.50 | LCAGTGENK | 191–199 | 4 | 0.44 | 0.005 |
| | | | | | DLLFK | 316–320 | | | |
| | | | | | CGLVPVAENYK | 424–435 | | | |
| | | | | | YYGYTGAFR | 544–552 | | | |
| 742 | Protein
S100-A8 | S10A8 | 259 | 10828 | 6.51 | LLETECPOYIR | 37–47 | 11 | 0.45 | 0.033 |
| 820 | Vitamin D binding
protein precursor | VTDB | 46 | 52929 | 5.40 | LCDNLSTK | 285–292 | 1 | 0.45 | 0.028 |
| 1552 | 14-3-3 protein
σ | 1433S | 285 | 27577 | 4.68 | ASLIQK | 4–9 | 31 | 2.87 | 0.005 |
| | | | | | LAEQAER | 12–18 | | | |
| | | | | | YEDMAAFMK | 19–27 | | | |
| | | | | | SNEEGSEEKGPEVR | 69–82 | | | |
| | | | | |
EKVETELQGVCDTVLGLLDSHLIKk | 86–109 | | | |
| | | | | |
EKVETELQGVCDTVLGLLDSHLIKl | 86–109 | | | |
| | | | | |
VETELQGVCDTVLGLLDSHLIK | 88–129 | | | |
| | | | | | MKGDYYR | 123–129 | | | |
| | | | | | DSTLIMQLLR | 215–224 | | | |
| Protein
S100-A9 | S10A9 | 259 | 13234 | 5.71 | MSQLER | 5–10 | 64 | 2.87 | 0.005 |
| | | | | | NIETINTFHQYSVK | 11–25 | | | |
| | | | | | LGHPDTLNQEFK | 26–38 | | | |
| | | | | |
LGHPDTLNQEFKELVR | 26–42 | | | |
| | | | | | DLQNFLK | 44–50 | | | |
| | | | | |
VIEHIMEDLDTNADK | 58–72 | | | |
| | | | | | QLSFEEFIMLMAR | 73–85 | | | |
| Galectin-7 | LEG7 | 41 | 15066 | 7.03 | SSLPEGIRPGTVLR | 8–21 | 29 | 2.87 | 0.005 |
| | | | | | LDTSEVVFNSK | 55–65 | | | |
| | | | | | GPGVPFQR | 76–73 | | | |
| | | | | | HRLPLAR | 112–118 | | | |
| 1608 | Protein
S100-A9 | S10A9 | 45 | 13234 | 5.71 | NIETINTFHQYSVK | 11–25 | 34 | 1.20 | 0.035 |
| | | | | |
LGHPDTLNQEFKELVR | 26–42 | | | |
| | | | | | DLQNFLK | 44–50 | | | |
LF precursor consisted of 710 amino acids and
produced six proteins or peptides by molecular processing
(http://www.uniprot.org/uniprot/P02788) (Table II). The regions of LF precursor
identified by nano-HPLC-ESI-TOF-MS/MS were amino acids 191–199,
316–320, 321–328, 424–435 and 542–552 (Table I). We could not identify the true
protein using MS/MS data alone. However, the spots on 2-DE gel
indicated that the molecular weight was ~60–80 kDa and the pI 8–9
(Fig. 2B).
| Table IIMoleculare processing of
lactotransferrin (LF) precursor. |
Table II
Moleculare processing of
lactotransferrin (LF) precursor.
| Name | Sequence | No. of amino
acid |
|---|
| No name | 1–19 | 19 |
|
Lactotransferrin | 20–710 | 691 |
| Kaliocin-1 | 171–101 | 31 |
| Lactoferroxin | 338–34 | 6 |
| Lactoferroxin | 543–547 | 5 |
| Lactoferroxin | 680–686 | 7 |
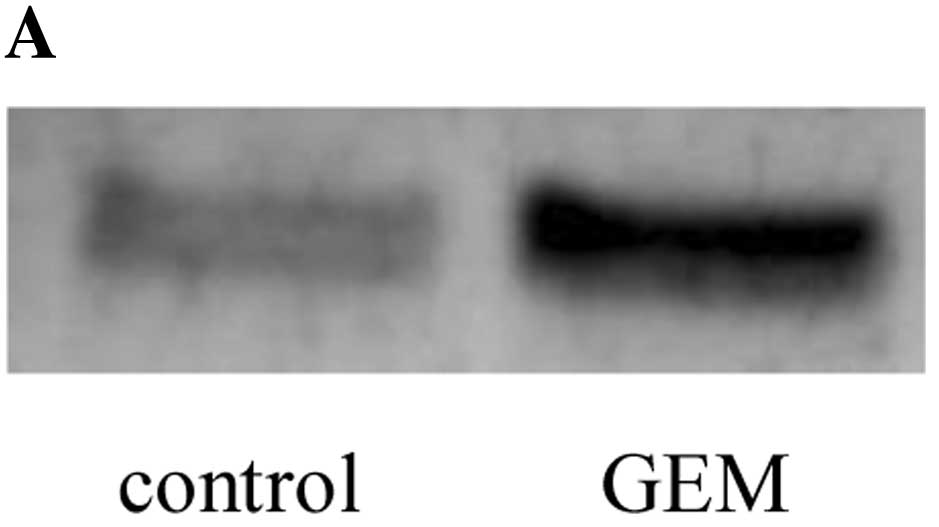
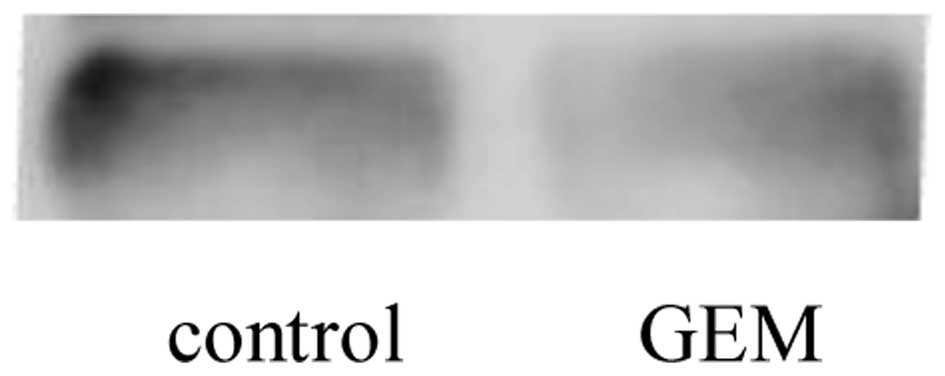
To validate 14-3-3 σ and LF, we performed western
blot analysis to determine the levels of these proteins in control
and GEM treated media. In treated medium 14-3-3 σ was upregulated
(Fig. 3), but LF was downregulated
(Fig. 4). The GEM treatment/control
ratios for 14-3-3 σ and LF precursor were 2.87 and 0.38,
respectively (Table I). These data
were consistent with the data of western blotting.
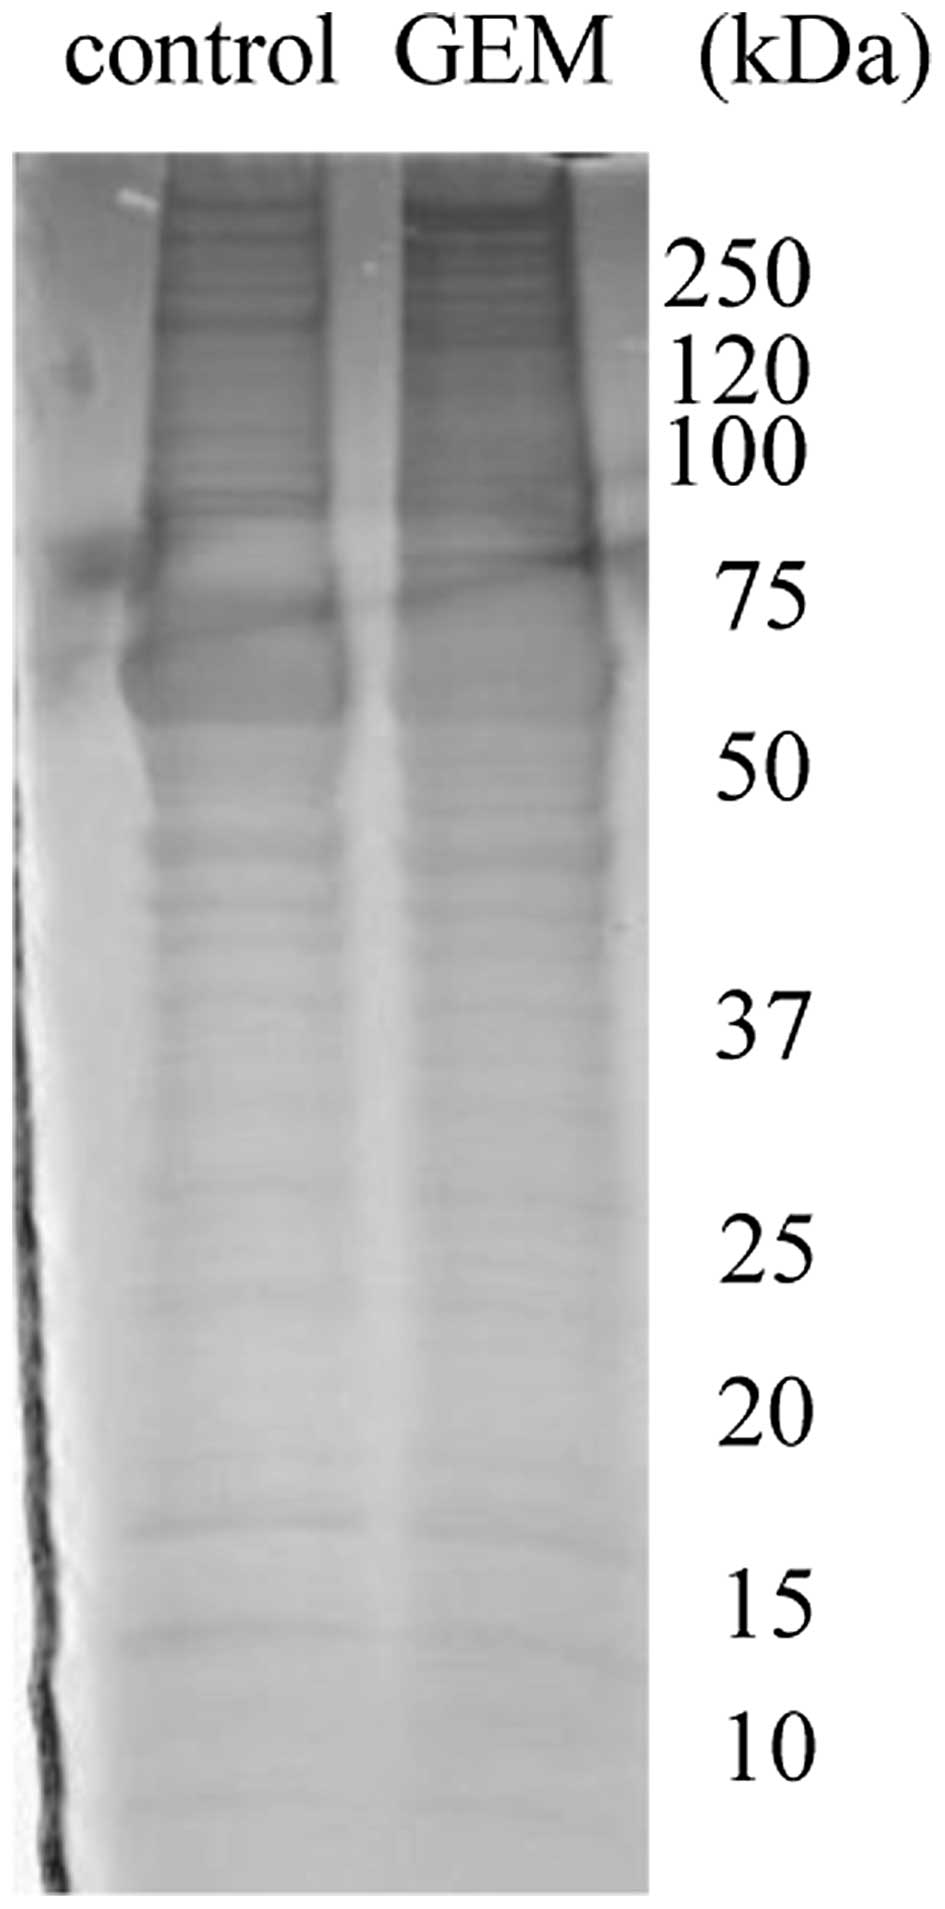
When validation of proteins in lysate was performed,
we used β-actin or G3PDH for the reference. However, in the present
study proteins in the control and treatment samples were analyzed
by SDS-PAGE. The gel was stained with Coomassie Brilliant Blue
(Fig. 5).
Discussion
The mechanism of the anticancer effect of GEM is the
inhibition of DNA synthesis. However, information regarding other
such events is limited. A transcriptome approach revealed
upregulation of 53BP1 mRNA in PANC-1 cells treated with GEM
(3). However, use of proteomics in
pancreatic cell lines treated with GEM has not been reported. We
therefore used secretome analysis to investigate the response of
PANC-1 cells treated with GEM. In recent years, studies on
secretome have seen rapid acceleration as a result of technological
advances, particulary in proteomics.
A method for secretome analysis has been established
(5). Carcinoma cells or primary
cells were maintained in medium with FBS and incubated for growth.
Then, the cells were washed with PBS or serum-free medium (SFM) and
incubated in SFM for an appropriate time to remove FBS. Conditioned
medium was collected, centrifuged, and subjected to sterile
filtration to remove floating cells and cellular debris.
Supernatant was collected and concentrated.
Proteins in conditioned medium were thought to be
secreted proteins or exported proteins from the cell lines.
However, in addition to secreted proteins, the proteins collected
from conditioned medium include, cytoskeletal components, membrane
components, and nucleus proteins (13,14).
This problem cannot be avoided because of cell death. In this
study, we targeted secreted protein in the Swiss-Prot database
(http://expasy.org/sprot/). However, we were
confronted with another difficult problem. In the proteomics
analysis of serum, plasma, urine, and organs obtained from humans,
protein identifications were combined using a software search
engine to yield a set of ‘human’ protein identifications with
confidence values. In proteome analysis of human cell lines in
vitro(15–21), many investigators selected the
taxonomic term ‘human’ when using the software search engine to
yield a set of protein identifications. However, proteins may be
contaminated by bovine proteins originating from FCS (22).
We selected the taxonomic term ‘mammalian’ when
using the Mascot search engine to yield a set of protein
identifications to exclude bovine proteins. Data from 2-DE and MS
screening indicated upregulation of four secreted proteins and
downregulation of three secreted proteins in PANC-1 cells treated
with GEM. Protein S100-A8, identified from spot 742, might be a
pseudo-positive protein because of its high molecular weight and a
pI 9–10 (Fig. 2A, Table I).
We confirmed the existence of 14-3-3 σ and LF and
the upregulation and downregulation of these protein.
14-3-3 σ belongs to the 14-3-3 protein family
(23–25), which is a class of highly conserved
proteins involved in regulating signal transduction pathways,
apoptosis, adhesion, cellular proliferation, differentiation and
survival. Among all 14-3-3 proteins, 14-3-3 σ is the isoform most
directly linked to cancer. There are several lines of evidence
indicating that 14-3-3 σ acts as a tumor suppressor gene and that
its inactivation is crucial in tumorigenesis (26,27).
In primary culture of the conjunctival epithelial cell line Cj-ECs,
nerve growth factor induced 14-3-3 σ mRNA and protein (28).
Protein 14-3-3 σ is known to be locatd in the
cytoplasm and nucleus. Beacuse 14-3-3 σ does not harbor any typical
amino-terminal ER export signal, the route of its externalization
remains to be determined. However, 14-3-3 σ may be secreted by a
non-classial secretory pathway (29). Recombinant 14-3-3 σ was found to
sufficiently induce matrix metallolloproteinase 1 (MMP1) expression
in fibroblasts (30). It seems
possible that GEM induces secretion of 14-3-3 σ. Secreted 14-3-3 σ
may act on the cell surface or stimulate cells to suppress
tumorigenesis. Altenatively, secreted 14-3-3 σ may be associated
with undesirable side effects of GEM.
LF is a member of the transferrin family of
iron-binding proteins. It was originally isolated from human milk
(31). LF has been detected in many
biological fluids as well as in human fetal and adult tissue by
radioimmunologic and immunoenzymatic procedures, LF has been
detected in many biological fluids as well as in human fetal and
adult tissue (32–37). Immunohistochemistry has been used to
study the distribution of LF in normal human tissues, such as
stomach, kidney, lung, pancreas, liver and bone marrow (34). LF immunoreactivity has been
extensively investigated in human neoplastic conditions (38–50).
LF inhibited carcinogenesis and metastasis of malignant tumors in
mice (51) and in the human
pancreatic cell line SPA (52).
If GEM inhibits the secretion or production of LF to
promote metastasis, this would be an undesirable side effect.
References
|
1
|
Haugk B: Pancreatic intraepithelial
neoplasia - can we detect early pancreatic cancer? Histopahology.
57:503–514. 2010. View Article : Google Scholar : PubMed/NCBI
|
|
2
|
Tanaka M, Javel M, Dong X, Eng C,
Abbruzzese JL and Li D: Gemcitabine metabolic and transporter gene
polymorphisms are associated with drug toxicity and efficacy in
patients with locally advanced pancreatic cancer. Cancer.
116:5325–5335. 2010. View Article : Google Scholar : PubMed/NCBI
|
|
3
|
Shimasaki T, Ishigaki Y, Minamoto T and
Motoo R: The influence of expression of Apopthosis related genes in
pancreatic cell lines treated with gemcitabine hydrochrolide.
Suizo. 22:14–20. 2007. View Article : Google Scholar
|
|
4
|
Wallentine JC, Kim KK, Seiler CE III,
Vaughn CP, Crockett DK, Tripp SR, Elenitoba-Johnson KS and Lim MS:
Comprehensive identification of proteins in Hodgkin
lymphoma-derived Reed-Sternberg cells by LC-MS/MS. Lab Invest.
87:1113–1124. 2007. View Article : Google Scholar : PubMed/NCBI
|
|
5
|
Xue H, Lu B and Lai M: The cancer
secretome: a reservoir of biomarkers. J Trans Med. 6:1–12.
2008.PubMed/NCBI
|
|
6
|
Soares JCS, Santos MF, Trrugilho MRO,
Neves-Ferreira AGG, Perales J and Domont GB: Differential
proteomics of the plasma of individuals with sepsis caused by
Acinetobacter bumannii. J Proteomics. 73:267–278. 2009.
View Article : Google Scholar : PubMed/NCBI
|
|
7
|
Mares J, Thongboonkerd V, Tuma Z, Moravec
J, Karvunidis T and Matejovic M: Proteomic analysis of proteins
bound to adsorption units of extracorporeal liver support system
under clinical conditions. J Proteome Res. 8:1756–1764. 2008.
View Article : Google Scholar
|
|
8
|
Sun Q, Sha H, Yang X, Bao G, Lu J and Xie
Y: Comparative proteomic analysis of paclitaxel sensitive A549 lung
adenocarcinoma cell line and its resistant counterpart A549-Taxol.
J Cancer Res Clin Oncol. 137:521–532. 2010. View Article : Google Scholar : PubMed/NCBI
|
|
9
|
Shi J, Zen Y and Zheng R: Proteome
profiling of early seed development in Cunninghamia lanceolata
(Lamb.) Hook. J Exp Bot. 61:2367–2381. 2010. View Article : Google Scholar : PubMed/NCBI
|
|
10
|
Oshita F, Morita A, Ito H, Kameda Y,
Tsuchiya E, Shigeru A and Miyagi Y: Proteomic screening of
completely resected tumors in relation to survival in patients with
stage I non-small cell lung cancer. Oncol Rep. 24:637–645. 2010.
View Article : Google Scholar : PubMed/NCBI
|
|
11
|
Varo I, Rigos G, Navarro JC, del Ramo J,
Giner C, Hernandez A, Pertusa J and Torreblanca A: Effect of
ivermectin on the liver of gilthead sea bream Sparus aurata: a
proteomic approach. Chemosphere. 80:570–577. 2010. View Article : Google Scholar : PubMed/NCBI
|
|
12
|
Schagger H and von Jagow W: Tricine-sodium
dodecyl sulfate-polyacrylamide gel electrophoresis for the
separation of proteins in the range from 1 to 100 kDa. Anal
Biochem. 166:368–379. 1987. View Article : Google Scholar : PubMed/NCBI
|
|
13
|
Chillini C, Cochet O, Negroni L, Samson M,
Poggi M, Ailhaud G, Alessi MC, Dani C and Amri EZ: Characterization
of human mesenchymal stem cell secretome at early steps of
adipocyte and osteoblast differentiation. BMC Mol Biol. 9:1–16.
2008.PubMed/NCBI
|
|
14
|
Hathout Y: Approaches to the study of the
cell secretome. Expert Rev Proteomics. 4:239–248. 2007. View Article : Google Scholar : PubMed/NCBI
|
|
15
|
Gronborg M, Kristiansen TZ, Iwahori A,
Chang R, Reddy R, Sato N, Molina H, Jensen ON, Hruban RH, Goggins
MG, et al: Biomarker discovery from pancreatic cancer secretome
using a differential proteomic approach. Mol Cell Proteomics.
5:157–171. 2006. View Article : Google Scholar : PubMed/NCBI
|
|
16
|
Keshamouni VG, Michailidis G, Grasso CS,
Anthwal S, Strahler JR, Walker A, Arenbrg DA, Reddy RC, Akulapalli
S, Thannickal VJ, et al: Differential protein expression profiling
by iTRAQ-2DLC-MS/MS of lung cancer cells undergoing
epithelial-mesenchymal transition reveals a migratory/invasive
phenotype. J Proteome Res. 5:1143–1154. 2006. View Article : Google Scholar
|
|
17
|
Yamashita R, Fujikawa Y, Ikari K, Hamada
K, Otomo A, Yasuda K, Noda M and kaburagi Y: Extracellular proteome
of human hepatoma cell, HepG2 analyzed using two-dimensional liquid
chromatography coupled with tandem mass spectrometry. Mol Cell
Biochem. 298:83–92. 2007. View Article : Google Scholar : PubMed/NCBI
|
|
18
|
Wu CC, Chen HC, Chen SJ, Liu HP, Hsieh YY,
Yu CJ, Tang R, Hsieh LL, Yu JS and Chang YS: Identification of
collapsin response mediator protein-2 as a potential marker of
colorectal carcinoma by comparative analysis of cancer cell
secretomes. Proteomics. 8:316–332. 2007.PubMed/NCBI
|
|
19
|
Ma Y, Visser L, Roelofsen H, de Vries M,
Diepstra A, van Imhoff G, van der Wal T, Luinge M, Alvarez-Llamas
G, Vos H, et al: Proteomics analysis of Hodgkin lymphoma:
identification of new players involved in the cross-talk between
HRS cells and infiltrating lymphocytes. Blood. 111:2339–2346. 2008.
View Article : Google Scholar : PubMed/NCBI
|
|
20
|
Butler GS, Dean RA, Etam EM and Overall
CM: Pharmacoproteomics of a metalloproteinase hydroxamate inhibitor
in breast cancer cells: dynamics of membrane type 1 matrix
metalloproteinase-mediated membrane protein shedding. Mol Cell
Biol. 28:4896–4914. 2008. View Article : Google Scholar
|
|
21
|
Sarkissian G, Ferglot P, Lamy PJ, Petard
JJ, Culine S, Jouin P, Rioux-Leclercq N and Darbouret B:
Identification of pro-MMP-7 as a serum marker for renal cell
carcinoma by use of proteomic analysis. Clin Chem. 54:574–581.
2008. View Article : Google Scholar : PubMed/NCBI
|
|
22
|
Tunica DG, Yin X, Sidibe A, Stegemann C,
Nissum M, Zeng L, Brunet M and May M: Proteomic analysis of the
secretome of human umbilical vein endothelial cells using a
combination of free-flow electrophoresis and nanoflow LC-MS/MS.
Proteomics. 9:4991–4996. 2009. View Article : Google Scholar : PubMed/NCBI
|
|
23
|
Mohammad DH and Yaffe MB: 14-3-3 proteins,
FHA domains and BRCT domains in the DNA damage response. DNA
Repair. 8:1009–1017. 2009. View Article : Google Scholar : PubMed/NCBI
|
|
24
|
Morrison DK: The 14-3-3 proteins:
integrators of diverse signaling cues that impact cell fate and
cancer development. Trens Cell Biol. 19:16–23. 2009. View Article : Google Scholar : PubMed/NCBI
|
|
25
|
Obsilova V, Sihan J, Boura E, Teisinger J
and Obsil T: 14-3-3 proteins: a family of versatile molecular
regulators. Physiol Res. 57(Suppl 3): S11–S21. 2008.PubMed/NCBI
|
|
26
|
Ferl RJ, Manak MS and Reyes MF: The 14-3-3
σ reviews. Genome Biol. 3:30101–30107. 2002.
|
|
27
|
Yang H, Wen Y, Chen C, Loxano G and Lee M:
14-3-3 sigma positively regulates p53 and suppresses tumor growth.
Mol Cell Biol. 23:7096–7107. 2003. View Article : Google Scholar : PubMed/NCBI
|
|
28
|
Lambiase A, Micera A, Pellegrini G, Merlo
D, Rama P, Luca MD and Bonini S: In vitro evidence of nerve growth
factor effects on human conjunctival epithelial cell
differentiation and mucin gene expression. Invest Ophthalmol Vis
Sci. 50:4622–4630. 2009. View Article : Google Scholar : PubMed/NCBI
|
|
29
|
Hermerking H: Extracellular 14-3-3 sigma
protein: a potential mediator of epithelial-mesenchymal
interactions. J Invest Dermatol. 124:9–10. 2005.PubMed/NCBI
|
|
30
|
Ghahary A, Marcoux Y, Karimi-Busheri F, Li
Y, Tredget EE, Kilani RT, Lam E and Weinfeld M: Differentiated
keratinocyte-releasable stratifin (14-3-3 sigma) stimulates MMP-1
expression in dermal fibroblasts. J Invest Derrmatol.
122:1188–1197. 2004.PubMed/NCBI
|
|
31
|
Steijns JM and van Hooijdonk AC:
Occurrence, structure, biochemical properties and technological
characteristics of lactoferrin. Br J Nutr. 84:11–17. 2000.
View Article : Google Scholar : PubMed/NCBI
|
|
32
|
Masson PL, Heremans JF and Dire CH:
Lactoferrin, an iron-binding protein in neutrophilic leukocytes.
Clin Chim Acta. 14:735–739. 1996.
|
|
33
|
De Vet BJCM and van Gool J: Lactoferrin
and iron absorption in the small intestine. Acta Med Scand.
196:393–402. 1974.PubMed/NCBI
|
|
34
|
Mason DY and Taylor CR: Distribution of
transferrin, ferritin and lactotranseferrin human tissues. J Clin
Pathol. 31:316–327. 1978. View Article : Google Scholar : PubMed/NCBI
|
|
35
|
Brock J: Lactoferrin in human milk: its
role in iron absorption and protection against enteric infection in
the newborn infant. Arch Dis Child. 55:417–421. 1980. View Article : Google Scholar : PubMed/NCBI
|
|
36
|
Reitamo S, Konttinen YT and
Segerberg-Konttinen M: Distribution of lactoferrin in human
salivary glands. Histochemistry. 66:285–291. 1980. View Article : Google Scholar : PubMed/NCBI
|
|
37
|
Korsud FR and Brandtzaeg P:
Characterization of epithelial elements in human major salivary
gland by functional markers: localization of amylase, lactoferrin,
lysozyme, secretory component, and secretory immunoglobulins by
paired immunofluorescence staining. J Histochem Cytochem.
30:657–666. 1982. View Article : Google Scholar
|
|
38
|
Caselitz J, Jaup T and Seifert G:
Lactoferrin and lysozyme in carcinomas of the parotid gland. A
comparative immunocytochemical study with the occurrence in normal
and inflamed tissue. Virchows Arch A Pathol Anat Histol. 394:61–73.
1981. View Article : Google Scholar : PubMed/NCBI
|
|
39
|
Barresi G and Tuccari G: Lactoferrin in
benign hypertrophy and carcinomas of the prostatic gland. Virchows
Arch A Pathol Anat Histopathol. 403:59–66. 1984. View Article : Google Scholar : PubMed/NCBI
|
|
40
|
Rossiello R, Carriero MV and Giordano GG:
Distribution of ferritin, transferrin and lactoferrin in breast
carcinoma tissue. J Clin Pathol. 37:51–55. 1984. View Article : Google Scholar : PubMed/NCBI
|
|
41
|
Charpin C, Lachard A, Pourreau SN,
Jacquemier J, Lvaut MN, Andonian C, Martin PM and Toga M:
Localization of lactoferrin and nonspecific cross-reacting antigen
in human breast carcinomas. An immunohistochemical study using the
avidin-biotin-peroxidase complex method. Cancer. 55:2612–2617.
1984. View Article : Google Scholar
|
|
42
|
Tuccari G and Barresi G:
Immunohistochemical demonstration of lactoferrin in follicular
adenomas and thyroid carcinomas. Virchows Arch A Pathol Anat
Histopathol. 406:67–74. 1985. View Article : Google Scholar : PubMed/NCBI
|
|
43
|
Baressi G and Tuccari G: Iron-binding
proteins in thyroid tumours. An immunocytochemical study. Pathol
Res Pract. 182:344–351. 1987. View Article : Google Scholar : PubMed/NCBI
|
|
44
|
Louglin KR, Gittes RF and Patridge D: The
relationship of lactoferrin to the anemia of renal carcinoma.
Cancer. 59:566–571. 1987. View Article : Google Scholar : PubMed/NCBI
|
|
45
|
Tuccari G, Barresi G, Arena F and
Inferrera C: Immunocytochemical detection of lactoferrin in human
gastric carcinomas and adenomas. Arch Pathol Lab Med. 113:912–916.
1989.PubMed/NCBI
|
|
46
|
Carbaret V, Vilain MO, Delobelle-Deroide A
and Vanseymortier L: Immunohistochemical demonstration of
ceruloplasmin and lactoferrin in a series of 59 thyroid tumors. Ann
Pathol. 12:347–352. 1992.(In French).
|
|
47
|
Tuccari G, Rizzo A, Crisafulli C and
Barresi G: Iron-binding proteins in human colorectal adenomas and
carcinomas: an immunocytochemical investigation. Histol
Histopathol. 7:543–547. 1992.PubMed/NCBI
|
|
48
|
Yossie Asato de Camargo R, Longatto Filho
A, Alves VA, Bisi H, Kanamura CT and Alves Abelin NM: Lactoferrin
in thyroid lesions: immunoreactivity in fine needle aspiration
biopsy samples. Acta Cytol. 40:408–413. 1996.PubMed/NCBI
|
|
49
|
Tuccari G, Rossiello R and Barresi G: Iron
binding proteins in gallbladder carcinomas. An immunocytochemical
investigation. Histol Histopathol. 12:671–676. 1997.PubMed/NCBI
|
|
50
|
Tucarri G, Giffre G, Crisafulli C and
Barresi G: Immnohistochemical detection of lactoferrin in human
astrocytomas and multiforme glioblastomas. Eur J Histochem.
43:317–322. 1999.PubMed/NCBI
|
|
51
|
Bezault J, Bhimani R, Wiprovnick J and
Fumanski P: Human lactoferrin inhibits growth of solid tumors and
development of experimental metastases in mice. Cancer Res.
54:2310–2312. 1994.PubMed/NCBI
|
|
52
|
Sakamoto N: Antitumor effect of human
lactoferrin against newly established human pancreatic cancer cell
line SPA. Gan To Kagaku Ryoho. 25:1557–1563. 1998.(In
Japanese).
|