Introduction
Chronic myeloid leukemia (CML) is a
myeloproliferative disease characterized by the malignant expansion
of stem cells of myeloid origin in the bone marrow. It is
associated with a characteristic chromosomal translocation,
t(9;22)(q34;q11), which results in an abnormal chromosome 22 called
Philadelphia chromosome (Ph) resulting in a fusion gene, BCR-ABL1
that codes for a protein with constitutive tyrosine kinase activity
(reviewed in ref. 1).
Imatinib mesylate (IM) is the current standard
treatment for Ph+ CML (2). IM competitively binds to the ATP
binding site in BCR-ABL1, maintaining the protein in its inactive
form which leads to apoptosis of Ph+ cells. In a 6-year
follow-up study, 82% of CML patients obtained a complete
cytogenetic response (CCyR) and 93% did not exhibit progression
while being treated with IM (3).
However, recent evaluations with non-selected patients demonstrated
that approximately 30% of patients exhibit suboptimal response or
treatment failure (3–5), i.e. do not have an optimal response to
IM therapy, defined as CCyR at 12 months (no Ph+ cells)
and major molecular response (MMR; BCR-ABL1:ABL1 ≤0.1%) at 18
months (6). The second-line options
for patients that require alternative therapies to standard-dose IM
(400 mg daily) are: IM dose escalation (600–800 mg daily) or the
second generation tyrosine kinase inhibitors (TKIs), dasatinib and
nilotinib (2). However, resistance
to these TKIs also occurs, and patients proceed to advanced disease
or blast crisis, for which existing therapies are limited. Thus,
resistance to TKIs is an increasingly important clinical
problem.
Mutations in the kinase domain of BCR-ABL1
are responsible for approximately 40% of all cases of resistance,
but in a number of patients the causes of resistance remain unclear
(7). Adequate IM plasma level is an
important feature for a satisfactory clinical response (8,9) and
factors that may affect IM intracellular action, such as drug
absorption and extrusion, may impact the ability to achieve a
maximal therapeutic benefit. Influx of IM is mediated by the human
organic cation transporter 1 transporter (hOCT1, SLC22A1)
which is likely to play an important role in IM resistance
(10–12) since CML patients with a higher
SLC22A1 expression before treatment had better results in
terms of CCyR rates when treated with IM (13).
Furthermore, resistance may also be associated with
the altered expression of ATP-binding cassette (ABC) family of
transporters on cell membrane, the most common cause of multidrug
resistance (MDR) (14). Among them,
ABCB1 (MDR1, P-gp), ABCC1 (MRP1) and ABCG2 (BCRP) have been
extensively related to MDR in leukemia (15,16).
Additionally, other proteins have also been associated with the MDR
phenotype, such as the major vault protein (MVP) or the lung
resistance protein (LRP) (17).
Few studies have been conducted in samples from CML
patients focusing on MDR proteins and their implications in
treatment response (13,18,19).
Recent results from our group demonstrated that during the
development of resistance to increasing doses of IM, K562 CML cells
overexpress several transporters (ABCB1, ABCC1, ABCG2,
SLC22A1 and MVP), but we also observed that the
expression pattern of the transporters was dynamic, varying with
drug exposure (20). These results
raised the hypothesis that patients treated with IM may also
present variations in the expression of transporters during
therapy, which may impact their response. To our knowledge, studies
assessing consecutive samples from CML patients in order to
evaluate the variation in expression levels of transporter genes do
not exist. Thus, we quantified the gene expression levels of
SLC22A1, ABCB1, ABCC1, ABCG2 and MVP at several time
points during treatment in 28 CML patients who were either
responsive or resistant to IM.
Materials and methods
Patients
Thirty-three adult patients, 17 male and 16 female
with a median age of 57 years (range 20–77) diagnosed between 1984
and 2008 with CML Ph+ were enrolled in this study, which
was performed in accordance with the Declaration of Helsinki. The
samples were collected and sent to Clinical Genetics Center (CGC),
Porto, Portugal, for diagnostic purposes. The genetic testing
requisition for the molecular diagnostic tests included an informed
consent as well as an authorization for the biological samples to
be used for scientific research purposes. These documents were
signed by the requesting physician and the patients. All samples
included in this study were anonymized in order to protect patient
confidentiality and to avoid traceability to other medical
records.
The diagnosis of CML was based on standard clinical
data and confirmed by cytogenetic and molecular analysis and
response criteria were the same as the criteria defined by the
European LeukemiaNet (6). Distinct
groups were categorized according to their response to IM
treatment: 15 were susceptible patients (S, n=15), 8 were resistant
without identified mutations in the kinase domain of BCR-ABL1 (R,
n=8) and 10 were resistant with mutations in the kinase domain of
BCR-ABL1 (RM, n=10). Most patients began IM therapy shortly after
diagnosis. However, 5 patients (S-2, R-4, RM-1, RM-2 and RM-4)
received prior therapy with hydroxyurea and/or interferon-α.
For the 28 patients studied, the follow-up time
ranged from 2 to 73 months, with a median observation of 46 months,
and peripheral blood (n=60) or bone marrow samples (n=22) were
collected with a median periodicity of six months. The cut-off
period was March 2010. The date of diagnosis was considered time
zero (t=0), and the follow-up samples were identified according to
the months after diagnosis (t) in which the sample was collected
(example, t=12, sample collected twelve months after diagnosis).
The mononuclear cells were separated by gradient centrifugation,
and guanidinium thiocyanate cell lysates were maintained at −20°C
until further use.
RNA isolation and cDNA synthesis
RNA was extracted using an RNeasy kit (Qiagen,
Hilden, Germany) and stored at −80°C until use. The concentration
and purity of resulting RNA were estimated at 260 and 280 nm using
the NanoDrop spectrophotometer ND-1000 (Thermo Scientific, Waltham,
MA, USA), and only those samples with A260 to A280 ratios between
1.9 and 2.1 were further considered. Total RNA (0.5 μg) was reverse
transcribed with the High Capacity RNA-to-cDNA kit (Applied
Biosystems, Foster City, CA, USA) in a final volume of 20 μl
according to the manufacturer’s instructions.
BCR-ABL1 fusion transcript analysis and
quantification
Fusion gene transcript analysis was performed as
previously described (21–23). BCR-ABL1 transcripts were
quantified using the BCR-ABL1 Mbcr FusionQuant kit for the
real-time quantitative PCR analysis of BCR-ABL Mbcr p210
transcripts (ref. no. FQPP-10-CE, Ipsogen, Marseille, France)
according to the manufacturer’s instructions and standardized
protocol (23).
Mutation analysis
A fragment corresponding to amino acids 225 to 498
of the BCR-ABL1 kinase domain was amplified from cDNA in a
nested PCR. After purification of PCR products through QIAquick
columns (Qiagen), standard dideoxy chain-termination DNA sequencing
was performed in the forward and reverse directions using an ABI
PRISM BigDye Terminator on an automated ABI PRISM 3100 Avant
Genetic Analyzer (Applied Biosystems). The direct sequences were
analyzed using sequence analysis software V3.3 and the SeqScape
software V2 (Applied Biosystems) and compared with the GeneBank
NM_007313.2. ABL1 sequence.
Real-time quantitative PCR (qRT-PCR)
The measurement of mRNA levels of the ABCB1,
ABCC1, ABCG2, SLC22A1 and MVP genes was based on SYBR1
Green PCR master mix (Applied Biosystems) and melting curve
analysis using the 7300 Real-Time PCR system (Applied Biosystems).
The following Assay-on-Demand products from Applied Biosystems used
were: ABCB1, Hs00184491_m1; ABCC1, Hs00219905_m1;
ABCG2, Hs00184979_m1; LRP/MVP, Hs00245438_m1;
SLC22A1, Hs00427550_m1 and GAPDH, 4352934E was used
as the control gene.
Template controls and reverse transcriptase controls
(RT negative) for each cDNA synthesis were included. Only those
that did not amplify, showing that primer-dimer formation and
genomic DNA contamination were negligible, were further
considered.
The mean values of the triplicate qRT-PCR reactions
for each assay were normalized with the expression values for each
gene obtained for the calibrator sample, the K562 cell line. Then,
the relative gene expression levels were calculated using the
equation
[(1+Etarget)−ΔCt(target)]/[(1+Ereference)−ΔCt(reference)]
where E is the value of efficiency of the qRT-PCR reaction for each
assay, target refers to the values obtained for the analyzed gene
and reference relates to the values obtained for the gene used to
normalize the relative expression values (24). Values were reported as an average of
triplicate/duplicate analysis.
K562 cell line
The human CML cell line, K562, expressing
BCR-ABL1 was used as a calibrator for the quantitative
analysis of gene expression. The K562 cell line was maintained in
RPMI-1640 medium (Sigma-Aldrich, St. Louis, MO, USA) with 10% fetal
bovine serum (Sigma-Aldrich) and 1% penicillin-streptomycin
(Sigma-Aldrich) at 37°C under a 5% CO2 atmosphere.
Statistical/data analysis
The non-parametric Mann-Whitney test was applied to
analyze differences in the levels of expression of each gene
between the group of patients susceptible to IM and the group of
patients resistant to the therapy. The correlation between the
expression values of the genes studied was determined by the
Spearman’s correlation coefficient. The level of significance was
set at p<0.05 in all analyses. All statistical tests were
performed using SPSS software, version 19.0.
Results
Patient samples
We analyzed the expression levels of the genes
ABCB1, ABCC1, ABCG2, SLC22A1 and MVP over a period of
time in 82 samples corresponding to a total of 28 patients, 14
sensitive and 14 resistant to IM (7 with and 7 without mutations in
BCR-ABL1) in order to elucidate the role of the genes in the
response to treatment. Both transcript variant analysis and
polymorphism analysis were performed for 33 patients.
In both groups of non-responder patients (R and RM)
comprising those that did not achieve an optimal cytogenetic or
molecular response following treatment under 400 mg/day of IM,
according to European LeukemiaNet recommendations, a number of
patients received higher doses of IM (R5) and/or changed to
dasatinib (R-7, RM-1, RM-2, RM-3, RM-4, RM-7). Several of these
patients subsequently achieved CCyR and/or MMR (RM-1, RM-2, RM-4)
whereas the others maintained a suboptimal response or failure even
after therapy change.
Transcript variants
Sixteen patients carried the e14a2 BCR-ABL1
rearrangement (48.5%); eleven, the e13a2-BCR-ABL1 (33.3%); one
patient, both e14a2 and e13a2 (3.0%); three patients, the e13a2 and
e1a2 (9.1%); and two patients, e14a2 and e1a2 (6.1%) (data not
shown). No relationship between the type of BCR-ABL1 transcript and
response to treatment was detected (Fisher’s test, p>0.05).
Transcript expression of BCR-ABL1 over
time
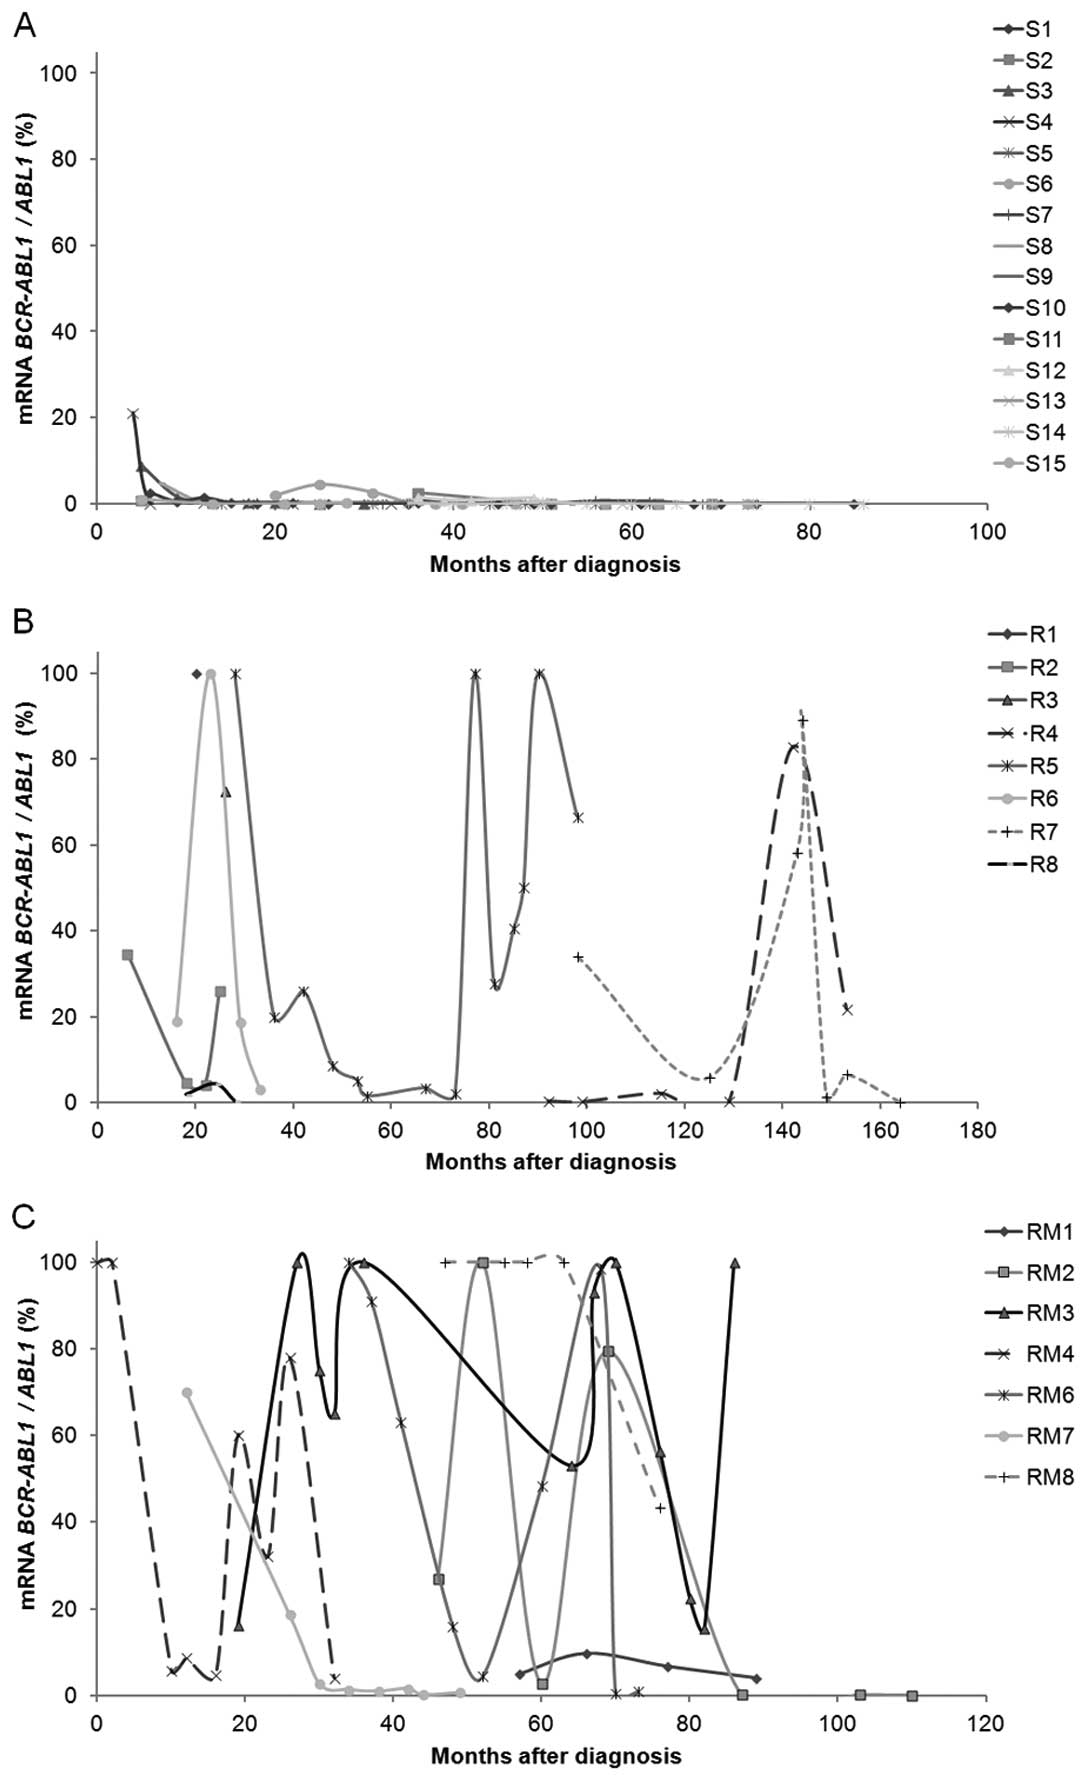
At the time of diagnosis both patients susceptible
and resistant to IM presented high values of BCR-ABL1
expression. Over time that expression changed to null or very low
values in patients responding to IM (MMR, BCR-ABL1:ABL1
≤0.1% at 18 months), as expected. However, for patients resistant
to therapy, the expression of BCR-ABL1 varied greatly over
time; even when the values were reduced to undetectable levels, the
expression increased again over time translating into acquired
resistance (Fig. 1). As expected,
in follow-up samples, patients susceptible to therapy presented
significantly lower values of BCR-ABL1 expression (S vs. R,
p<0.001; S vs. RM, p<0.001).
Transcript expression of ABCB1, ABCC1,
ABCG2, SLC22A1 and MVP in diagnostic and follow-up samples
The expression levels of ABCB1, ABCC1,
ABCG2, SLC22A1 and MVP were higher in follow-up samples
compared to the diagnostic samples (Table I). The increases in the expression
level from the diagnostic to the follow-up sample were significant
in samples from sensitive patients for ABCB1 (p=0.001),
ABCC1 (p=0.002), ABCG2 (p=0.001), MVP
(p=0.006) and SLC22A1 (p=0.005); in samples from resistant
patients for the ABCB1 gene (p=0.031) and in samples from
patients with mutations for the MVP gene (p=0.03). For the
majority of patients, the gene with the highest expression level
was MVP followed by ABCB1 and SLC22A1. In
contrast, ABCC1 and ABCG2 genes presented with the
lowest expression values with low variations throughout the time
period (Table I). Concerning only
diagnostic samples, we did not observe any significant difference
in the expression values of the studied genes between the
susceptible and resistant patients.
 | Table IRelative expression values of the
studied genes. |
Table I
Relative expression values of the
studied genes.
| Gene |
|---|
|
|
|---|
| Samplea | ABCB1 | ABCC1 | ABCG2 | MVP | SLC22A1 |
|---|
| Sensitive (S) |
| 1 | A (PB) | 0.70 | 0.27 | 0.21 | 15.05 | 2.82 |
| C (PB) | 7.37 | 0.64 | 0.33 | 64.16 | 18.69 |
| F (PB) | 6.23 | 0.89 | 0.21 | 60.45 | 21.00 |
| I (PB) | 4.56 | 0.72 | 0.14 | 37.45 | 6.39 |
| K (PB) | 4.77 | 0.93 | 0.43 | 42.40 | 11.76 |
| 2 | Dx (BM) | 0.00 | 0.08 | 0.00 | 6.77 | 0.00 |
| A (BM) | 0.70 | 0.17 | 0.20 | 13.61 | 0.51 |
| 3 | A (PB) | 13.18 | 1.08 | 0.17 | 59.52 | 10.67 |
| B (PB) | 9.56 | 0.92 | 0.25 | 40.03 | 8.89 |
| D (BM) | 14.19 | 0.77 | 0.19 | 52.37 | 12.82 |
| G (BM) | 13.24 | 0.87 | 0.17 | 66.65 | 20.46 |
| 4 | A (BM) | 0.63 | 0.12 | 0.04 | 8.30 | 0.14 |
| F (PB) | 11.69 | 1.74 | 0.62 | 46.56 | 5.26 |
| 5 | B (PB) | 7.38 | 0.65 | 0.24 | 84.02 | 9.28 |
| F (PB) | 27.93 | 1.22 | 0.61 | 49.96 | 19.40 |
| H (PB) | 6.20 | 0.84 | 0.28 | 97.01 | 13.28 |
| J (PB) | 12.38 | 1.11 | 0.48 | 107.98 | 13.66 |
| 6 | I (PB) | 13.48 | 0.82 | 0.53 | 97.58 | 15.05 |
| 7 | D (PB) | 6.44 | 1.34 | 0.00 | 218.54 | 51.07 |
| I (PB) | 0.00 | 0.17 | 0.28 | 61.73 | 10.96 |
| 8 | Dx (PB) | 0.00 | 0.33 | 0.00 | 51.36 | 8.30 |
| B (PB) | 11.88 | 0.81 | 0.56 | 102.26 | 15.71 |
| E (PB) | 9.78 | 0.74 | 0.78 | 73.38 | 9.72 |
| G (BM) | 7.49 | 0.62 | 1.46 | 47.16 | 7.52 |
| I (PB) | 5.92 | 1.08 | 0.82 | 51.89 | 14.70 |
| M (PB) | 5.28 | 0.73 | 3.24 | 41.29 | 8.94 |
| 9 | Dx (BM) | 0.00 | 0.17 | 0.00 | 9.24 | 1.10 |
| 10 | B (PB) | 16.16 | 0.74 | 0.38 | 131.76 | 10.50 |
| D (PB) | 10.86 | 0.65 | 0.27 | 121.92 | 10.10 |
| G (PB) | 6.28 | 0.45 | 0.00 | 86.73 | 10.31 |
| I (PB) | 9.62 | 0.88 | 0.36 | 44.36 | 8.17 |
| 11 | A (PB) | 3.91 | 0.63 | 0.12 | 54.54 | 6.36 |
| 12 | Dx (BM) | 0.00 | 0.21 | 0.00 | 15.65 | 2.56 |
| B (PB) | 2.68 | 0.56 | 0.06 | 59.99 | 11.98 |
| 13 | G (PB) | 9.06 | 0.70 | 0.39 | 37.19 | 0.82 |
| K (PB) | 5.82 | 1.01 | 0.56 | 35.44 | 11.25 |
| 14 | Dx (BM) | 0.21 | 0.37 | 0.04 | 11.09 | 1.52 |
| C (PB) | 9.65 | 1.11 | 0.41 | 41.99 | 9.76 |
| E (PB) | 9.26 | 0.94 | 0.26 | 65.22 | 9.82 |
| Resistant (R) |
| 1 | A (PB) | 10.44 | 0.89 | 1.82 | 62.74 | 4.81 |
| 2 | Dx (BM) | 0.27 | 0.20 | 0.00 | 9.93 | 0.46 |
| A (PB) | 18.95 | 1.02 | 0.00 | 142.96 | 13.37 |
| C (BM) | 1.18 | 0.18 | 0.00 | 14.14 | 0.00 |
| F (PB) | 5.23 | 0.40 | 0.00 | 77.62 | 7.25 |
| H (BM) | 0.19 | 0.25 | 0.04 | 17.02 | 0.58 |
| 3 | Dx (BM) | 0.00 | 0.39 | 0.15 | 28.20 | 0.00 |
| A (BM) | 1.13 | 0.51 | 0.11 | 20.87 | 1.59 |
| 4 | C (PB) | 3.16 | 0.46 | 0.15 | 67.02 | 5.18 |
| G (PB) | 2.50 | 0.79 | 0.51 | 79.61 | 4.59 |
| 5 | D (PB) | 6.24 | 0.54 | 0.00 | 55.18 | 3.28 |
| F (PB) | 27.58 | 0.77 | 1.63 | 123.06 | 0.00 |
| H (PB) | 10.54 | 0.44 | 0.00 | 79.79 | 0.00 |
| K (PB) | 3.62 | 0.52 | 0.42 | 28.62 | 3.11 |
| N (PB) | 4.51 | 0.70 | 0.19 | 113.20 | 18.98 |
| 6 | A (BM) | 1.93 | 0.29 | 0.38 | 14.53 | 1.22 |
| C (BM) | 0.33 | 0.27 | 0.07 | 22.23 | 1.38 |
| F (BM) | 0.66 | 0.14 | 0.06 | 6.08 | 1.03 |
| 7 | A (PB) | 50.15 | 1.36 | 4.60 | 200.41 | 0.00 |
| D (PB) | 8.42 | 0.70 | 0.27 | 96.24 | 8.89 |
| G (PB) | 15.66 | 1.59 | 0.17 | 61.55 | 6.95 |
| Resistant with
BCR-ABL mutations (RM) |
| 1 | C (PB) | 1.09 | 0.33 | 1.13 | 25.62 | 1.36 |
| D (PB) | 7.28 | 0.59 | 0.49 | 60.13 | 20.92 |
| E (BM) | 0.00 | 0.12 | 0.00 | 18.01 | 0.00 |
| G (PB) | 0.00 | 0.44 | 0.00 | 183.88 | 74.56 |
| I (BM) | 1.22 | 0.56 | 0.17 | 41.44 | 2.15 |
| 2 | A (PB) | 125.69 | 9.79 | 0.00 | 978.12 | 0.00 |
| C (PB) | 59.26 | 1.56 | 1.39 | 77.57 | 6.74 |
| F (PB) | 1.60 | 0.16 | 0.09 | 33.47 | 1.90 |
| H (PB) | 30.26 | 0.93 | 0.22 | 51.44 | 2.26 |
| 3 | H (PB) | 2.20 | 0.36 | 0.30 | 17.69 | 1.12 |
| L (PB) | 14.54 | 0.90 | 0.61 | 87.48 | 9.42 |
| 4 | Dx (PB) | 0.46 | 0.12 | 0.00 | 7.34 | 0.00 |
| C (BM) | 4.70 | 0.14 | 0.00 | 24.74 | 0.00 |
| J (BM) | 0.82 | 0.25 | 0.14 | 15.76 | 0.75 |
| 5 | Dx (BM) | 0.00 | 0.18 | 0.06 | 9.34 | 1.41 |
| A (BM) | 0.86 | 0.68 | 0.25 | 7.79 | 0.16 |
| 7 | A (PB) | 4.88 | 0.45 | 0.20 | 49.00 | 8.48 |
| F (PB) | 10.58 | 0.81 | 0.48 | 37.15 | 9.80 |
| H (PB) | 15.82 | 1.27 | 0.28 | 30.51 | 7.05 |
| 8 | B (PB) | 13.83 | 1.35 | 0.00 | 154.97 | 13.10 |
| D (PB) | 13.89 | 0.52 | 0.00 | 24.21 | 2.68 |
| G (PB) | 15.66 | 1.04 | 0.15 | 33.17 | 4.65 |
Transcript expression of ABCB1, ABCC1,
ABCG2, SLC22A1 and MVP and response to treatment
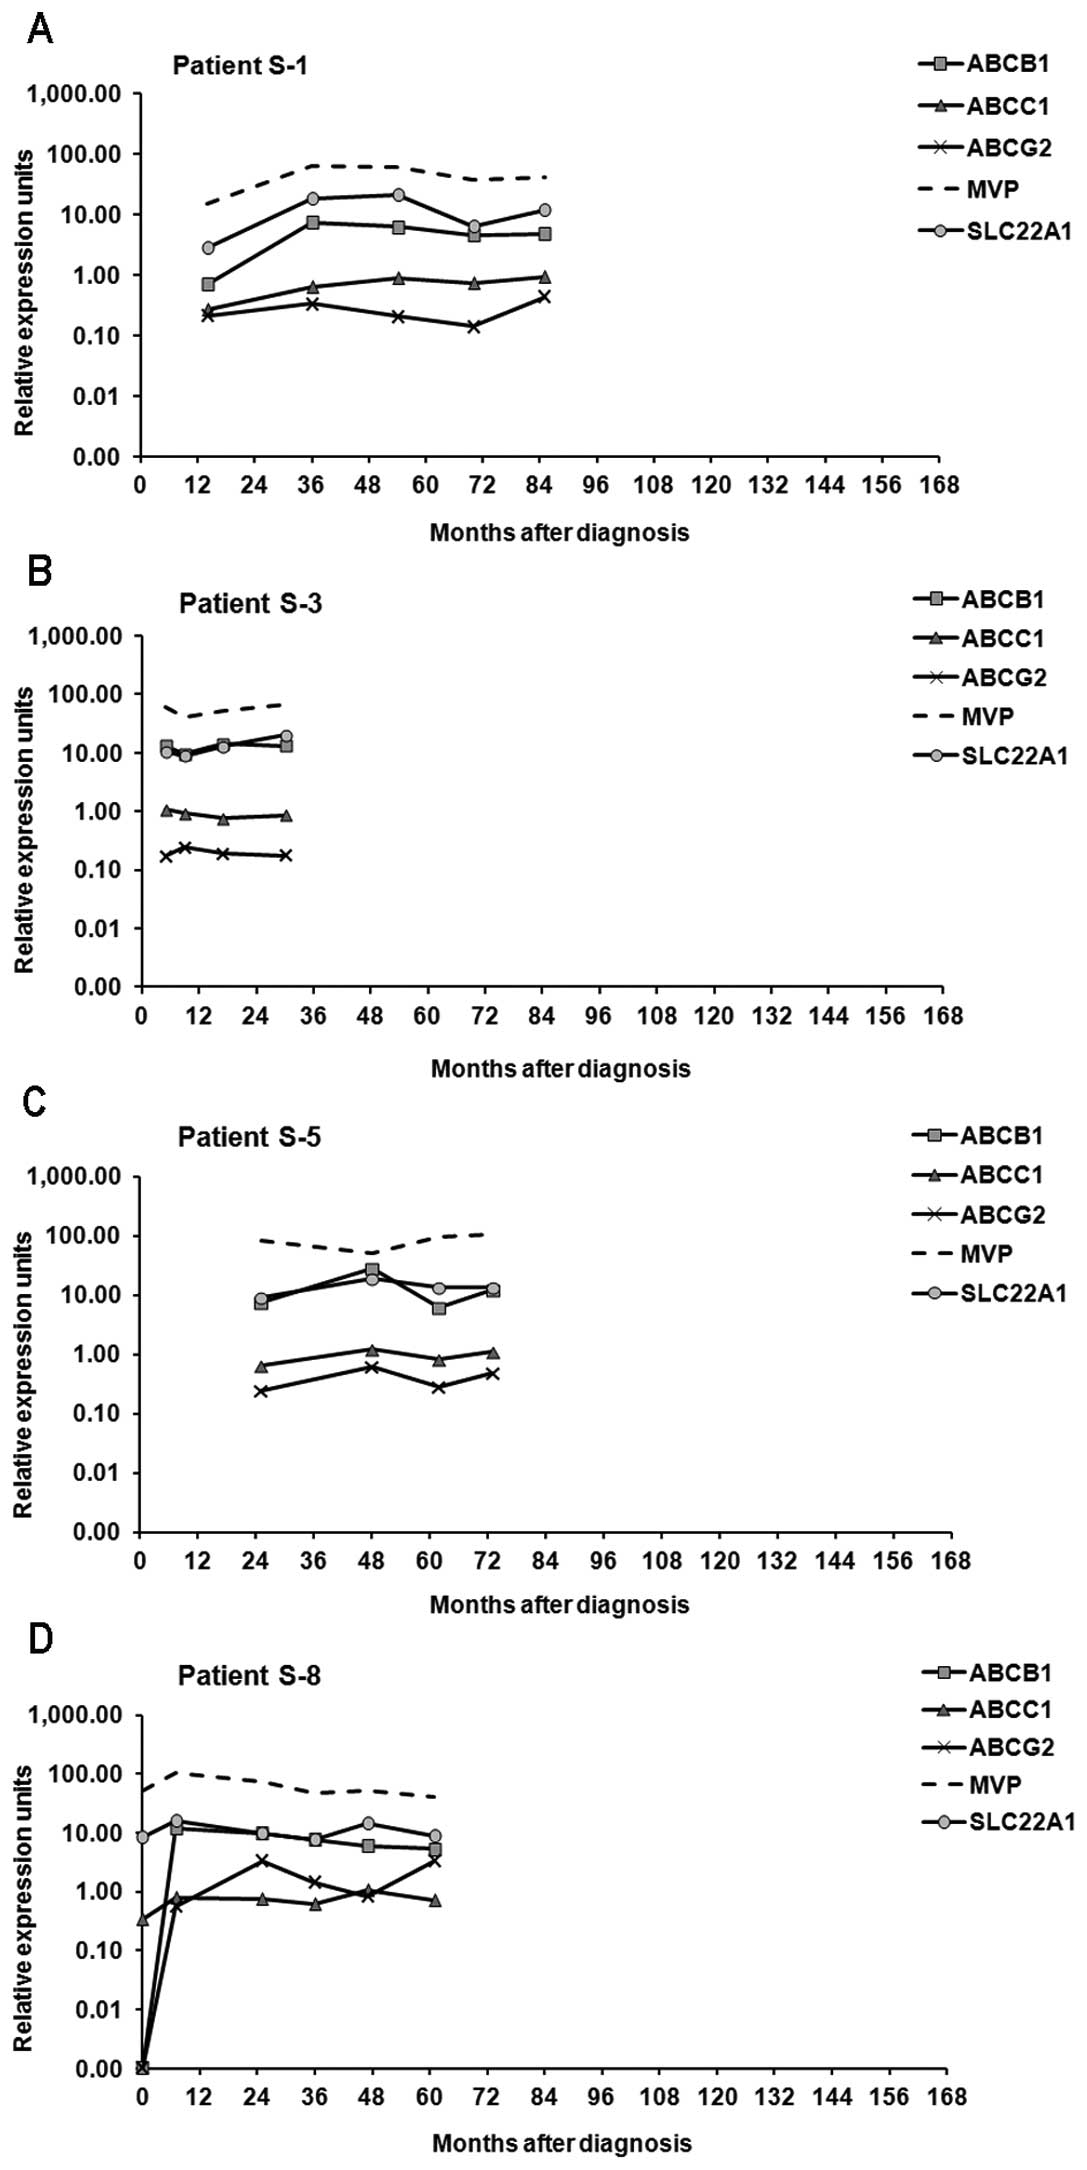
In the IM-sensitive patient group, the expression
levels of the studied genes were more stable compared to both
groups of IM-resistant patients whose samples revealed high
variations in the levels of expression. Moreover, while in
sensitive patients the expression level of SLC22A1 was
mostly higher compared to ABCB1; in both groups of resistant
patients that relationship was reversed (Figs. 2–4).
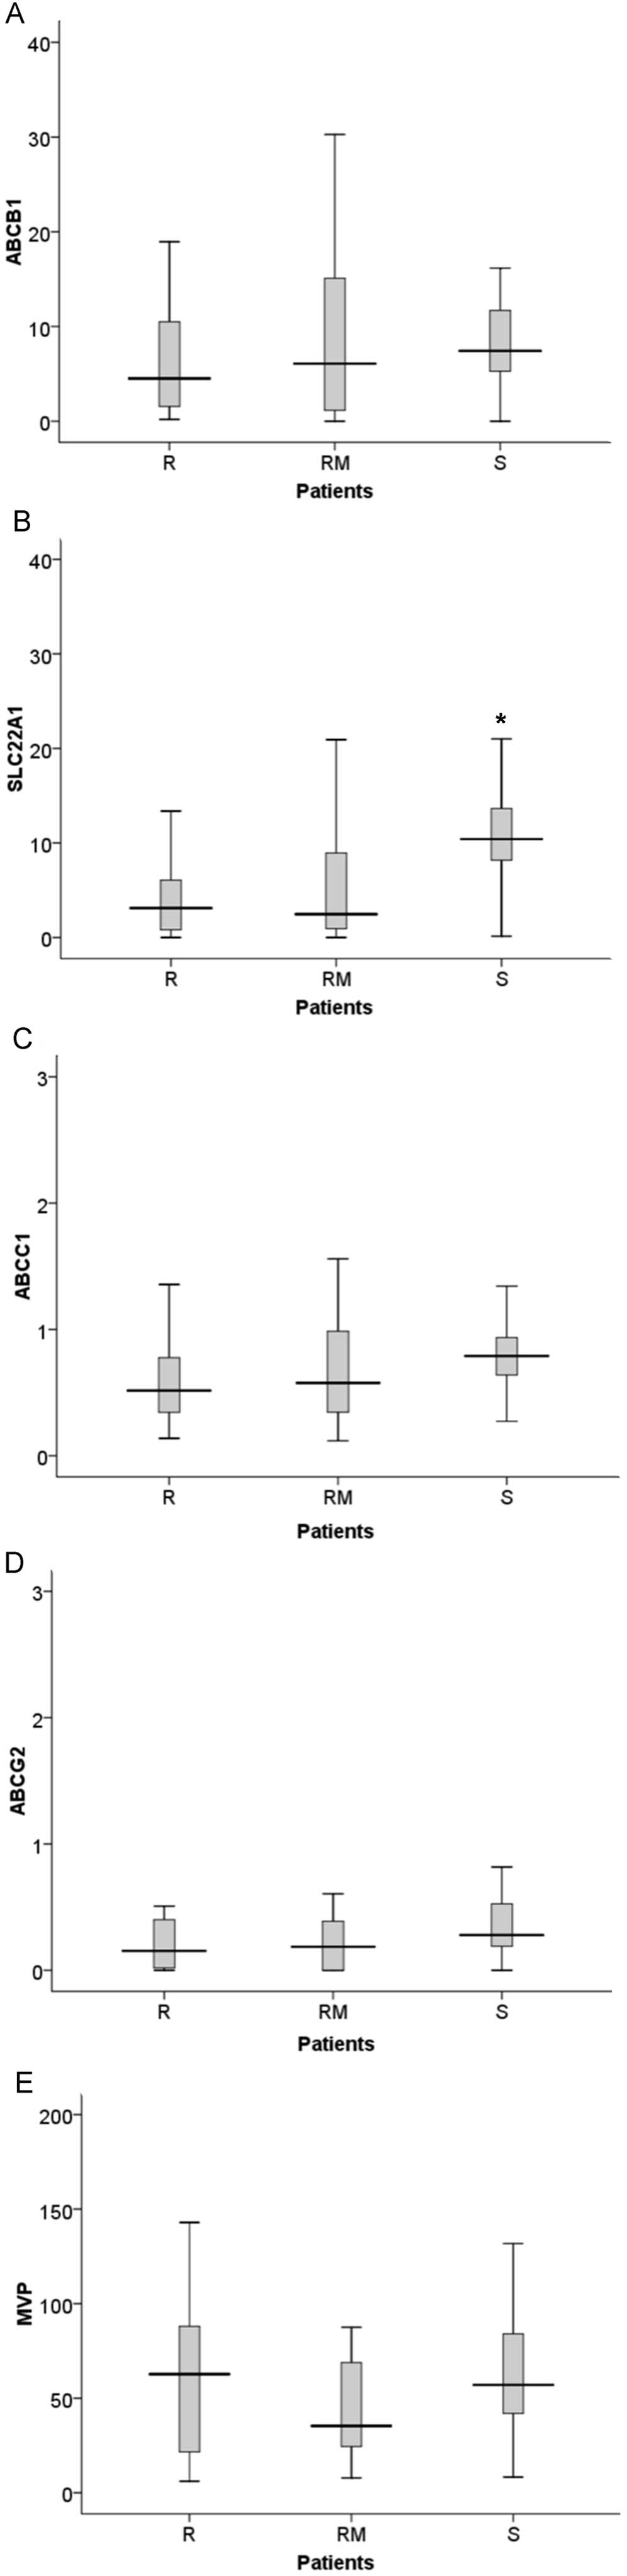
Considering only the follow-up samples, we
discovered that patients susceptible to therapy presented
significantly higher values of SLC22A1 expression (S vs. R,
p<0.001; S vs. RM, p<0.005), compared to both groups of
patients resistant to IM (Fig. 5).
However, for the ABCB1, ABCG2 and MVP genes there
were no significant differences in expression levels between the
groups of patients. The ABCC1 gene also presented
differences in expression, with higher expression in sensitive
patients than in resistant patients (p=0.045) (Fig. 5).
Correlation of gene expression
patterns
Irrespectively of the response to treatment, we
observed that a correlation exists between the patterns of gene
expression over a period of time for the genes included in this
study. When the expression of one gene increased, the expression of
the other increased concurrently and vice versa (Figs. 2–4).
This observation was confirmed using the Spearman’s rank
correlation coefficient that revealed a significant correlation
between the expression of all of the genes, apart from ABCG2
with the genes MVP and SLC22A1. Most correlations
were moderate (0.245–0.520) while the correlation between
ABCB1 and ABCC1 was strong (0.771).
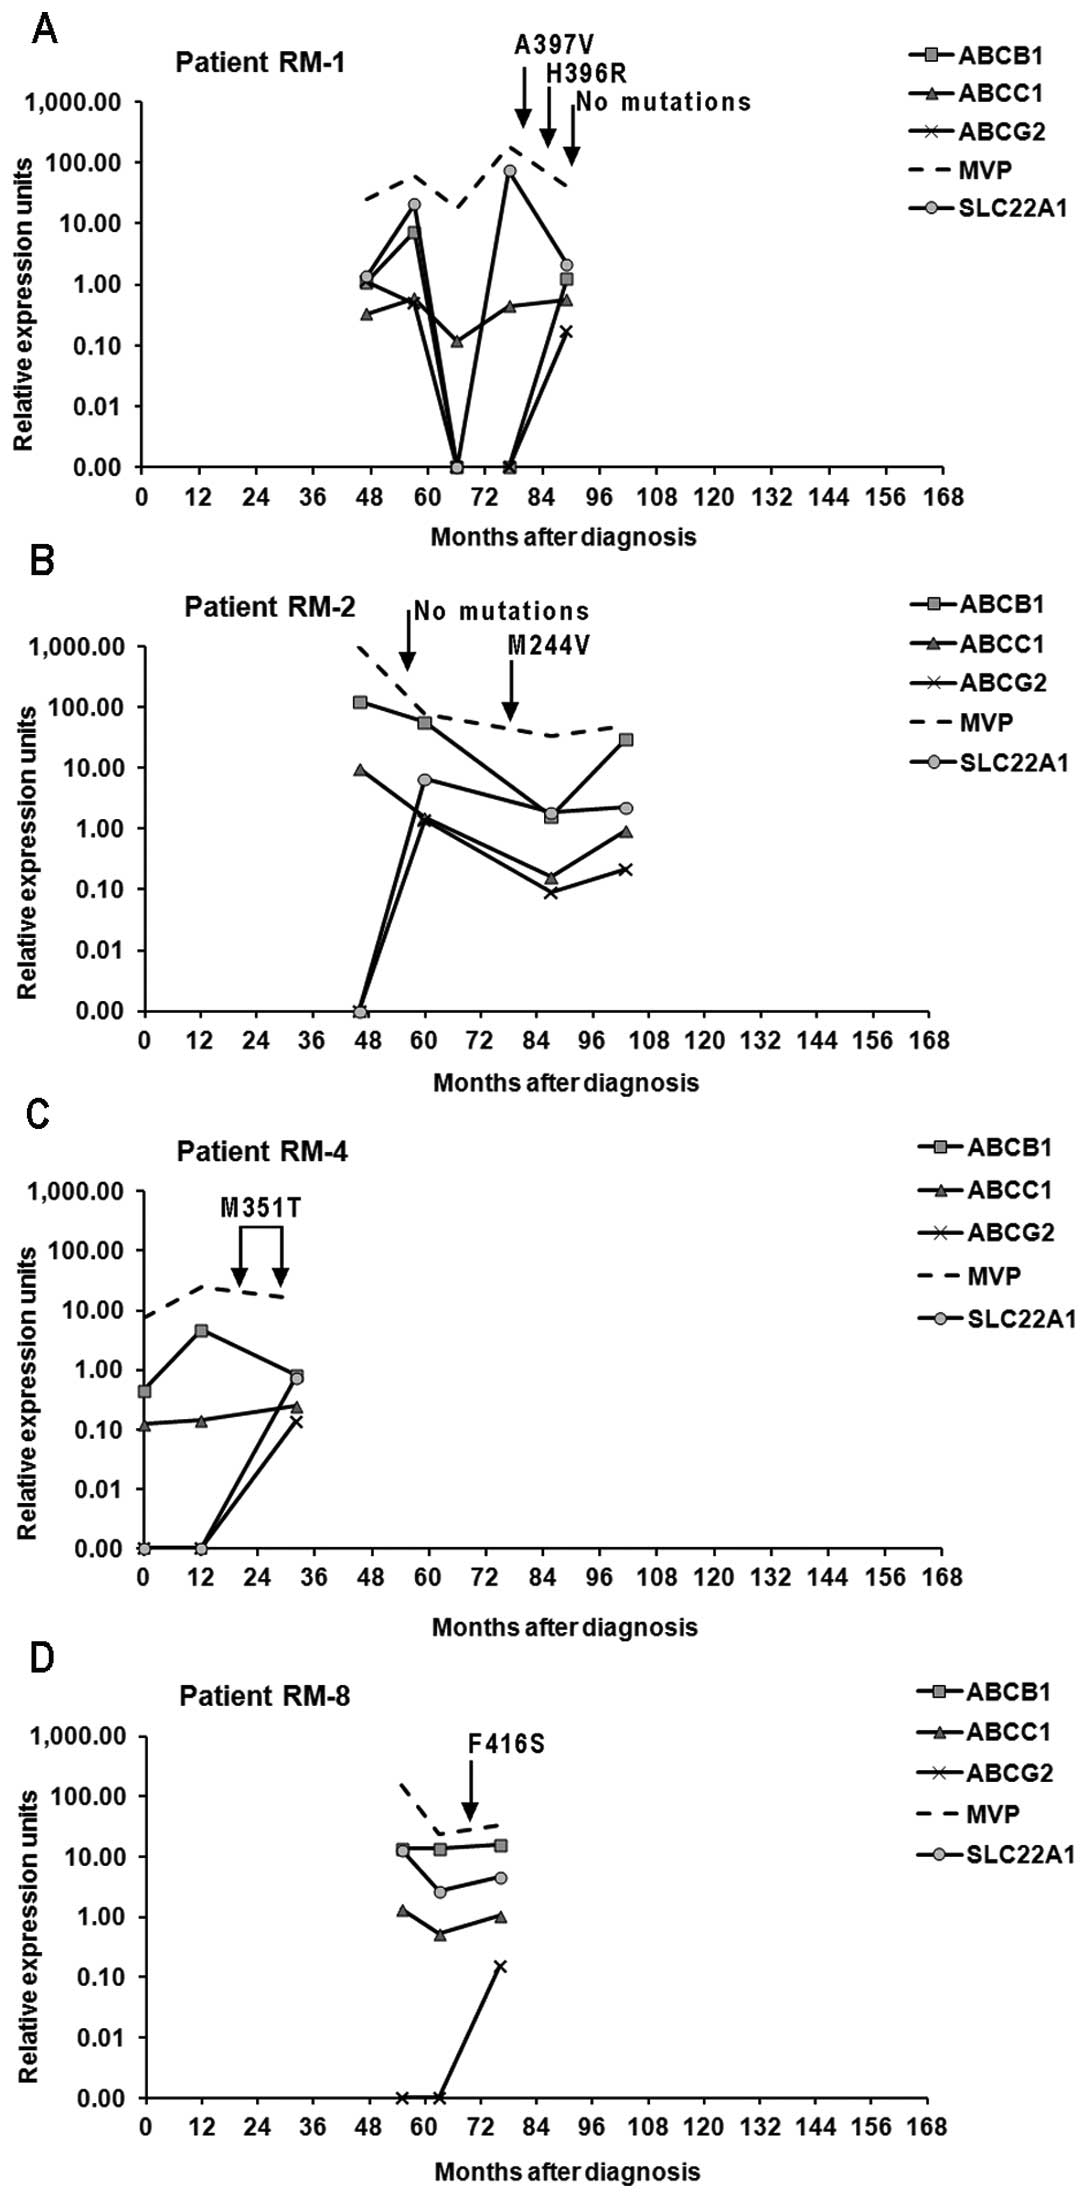
Mutations
Seven different BCR-ABL1 kinase domain point
mutations were identified in the samples from seven resistant
patients: A397V (RM-1), H396R (RM-1), M244V (RM-2), F317L (RM-3),
M351T (RM-4, RM-7), D276G (RM-5) and F416S (RM-8) (data not shown).
The mutation M351T was the most frequent; found in two patients. In
patient RM-1, two different point mutations were found at different
times during disease evolution (Fig.
4A).
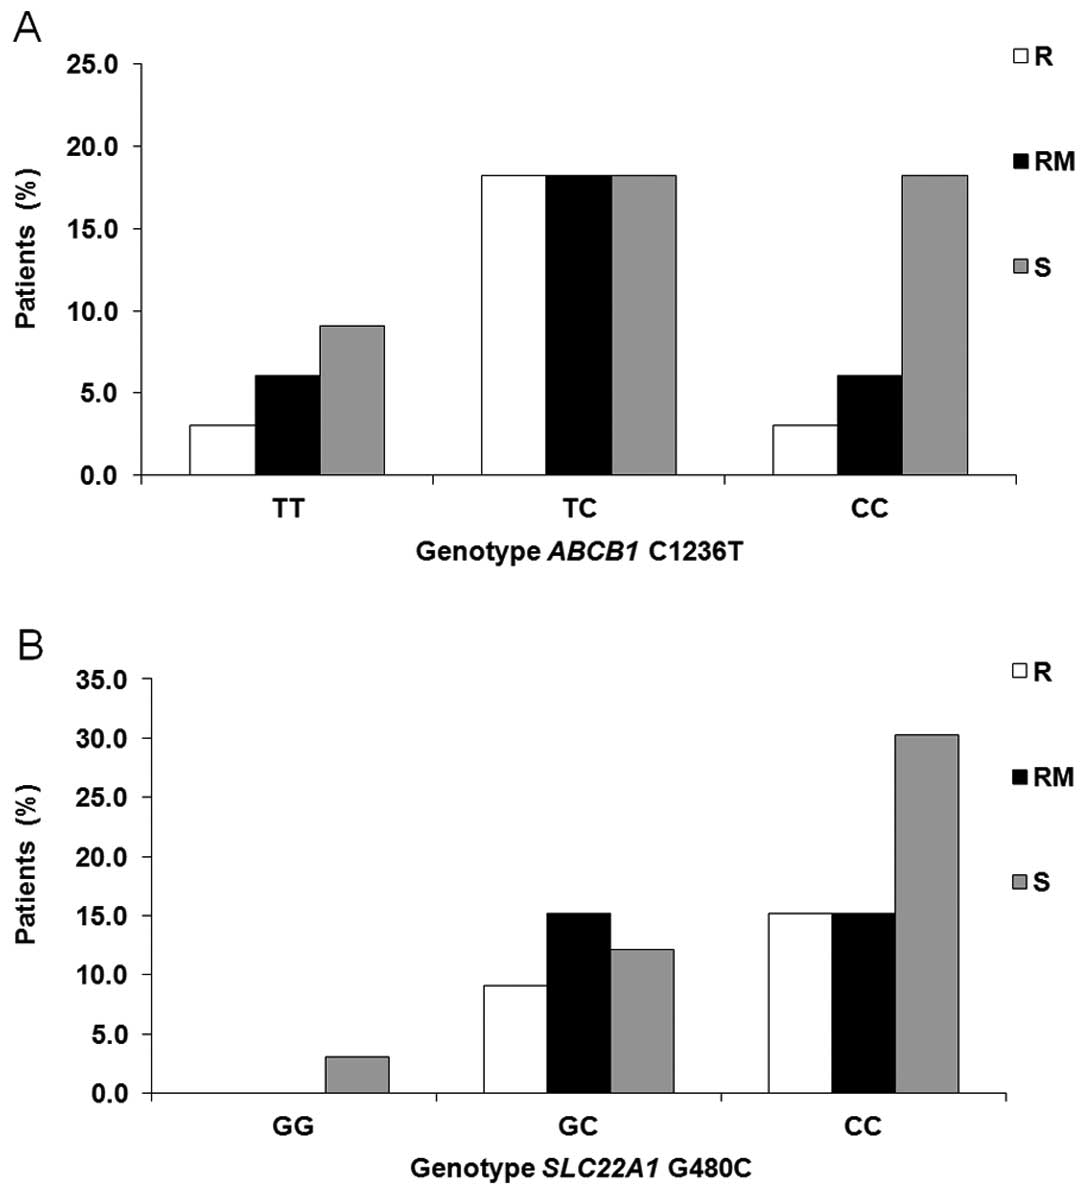
Polymorphisms
We also investigated the role of c.1236T>C ABCB1
and c.480G>C SLC22A1 polymorphisms, both previously described as
influencing the treatment outcome and displaying high frequency in
the population. However, no relationship between the genotype and
response to treatment was detected (Fisher’s test, p>0.05)
(Fig. 6).
Discussion
The determinants that affect response to imatinib
mesylate (IM) remain unknown. However, chronic administration of IM
to patients may alter the expression of drug transporters, thus
affecting therapeutic success, since IM plasma levels are a
critical factor in treatment outcome (9).
During the development of resistance in K562 CML
cells, we found that the expression pattern of transporters varied
during chronic drug exposure (20).
To evaluate whether similar variations occur in vivo in
patients treated with IM, we assessed the expression levels of
SLC22A1, ABCB1, ABCC1, ABCG2 and MVP at different
time points during treatment in CML patients, who were either
responsive or resistant to IM therapy. We observed a significant
increase in drug transporters in follow-up samples compared to
diagnostic samples, particularly in IM-responsive patients, which
is in agreement with the hypothesis that chronic use of IM may
induce their expression. In CML patients resistant to IM, bone
marrow mononuclear cells demonstrated at least a doubling of
ABCG2 and ABCB1 expression after IM exposure
(25). In another study, peripheral
blood cells from all patients undergoing IM therapy for more than
six months expressed several transporters of the ABC family
(ABCB1, ABCC1, ABCG2) and LRP protein (19). Prolonged in vitro treatment
of intestinal epithelial Caco2 cells with IM specifically
upregulated the expression of ABCG2 and ABCB1 and
this drug-induced overexpression was a steady phenomenon and stable
over time (26). Furthermore, some
data do not support the possibility that the upregulation of ABC
transporters contributes to the development of resistance to IM
(27) and even demonstrate that IM
acts as an environmental factor reducing activity of mechanisms
involved in its own clearance (28). Notwithstanding, some observations
suggest that several drug transporters may cooperate in the
extrusion of IM and may be coordinately regulated (26), providing an important means to
protect the body from xenobiotic insults (29).
Analysis of the correlation of expression levels
among the genes under study by the Spearman’s correlation
coefficient demonstrated a significant positive correlation among
ABCB1, ABCC1, MVP and SLC22A1. ABCG2 gene expression
levels also correlated with ABCB1 and ABCC1, but not
with MVP or SLC22A1. The observations that these
genes are co-expressed may suggest their joint activation as
already reported for childhood acute lymphoid leukemia (15). In addition, the co-expression of
P-gp and MRP1 was documented in CML patients (18). Our results also revealed a
correlation between efflux genes and the influx SLC22A1
which supports the hypothesis that absolute bioavailability may
also be influenced by the balance between efflux and influx
transport (30) and that
inter-patient variation in sensitivity is mainly mediated by the
balance between the uptake and retention of IM (31).
While responding patients revealed a stable
expression in consecutive samples, there was considerable variation
in gene expression in resistant patients (Figs. 2–4).
The cyclic nature of the variations we observed may reflect the
heterogeneity of differentiation in the population of leukemic
cells throughout the disease, and the repopulating effect of stem
cell division. Division of leukemic stem cells or early precursors
is critical for CML progression and such cells are known to express
several transporters belonging to the ABC family (32). In a study with acute lymphoid
leukemia patients (15) the
expression of the MDR genes investigated was also found to be
highly variable. Those variations may be due to specific factors
and conditions that stimulate their expression, such as cytotoxic
agents, thermal shock, genotoxic stress, inflammatory mediators,
cytokines and growth factors.
The significant variation we observed in
IM-resistant patients requires caution in attempting to associate
expression signatures with clinical outcomes or prognostic
features. Various studies have been performed to evaluate gene
expression signatures with resistance (33,34),
but most studies have compared IM responsive cohorts with
non-responsive cohorts using single point samples, and there is
considerable heterogeneity in the different studies. As our results
indicate, expression signatures of IM-resistant patients were not
stable and may induce error.
In the current study, ABCC1 expression was
low in the patient samples. A low value of ABCC1 expression in K562
CML cells was also observed (20).
ABCC1/MRP1 levels did not correlate with treatment outcome
in patients with CML (13).
However, high levels of ABCC1 mRNA were deemed to predict
resistance to IM in myeloid blast crisis (35). Although it was shown in vitro
that IM is a substrate for MRP1 (36), the clinical role of ABCC1
overexpression in CML cells remains to be elucidated. Similarly,
the relative mRNA expression of ABCG2 was maintained low
through time. There has been significant controversy regarding the
potential of ABCG2 transporter to confer resistance to IM since it
may be either its substrate or inhibitor (37). Our results indicate that
ABCG2 may indeed have a limited role in IM resistance in
clinical samples.
In the studied patient samples, MVP was the
gene that attained the highest expression values. This protein was
first associated to MDR by Scheffer et al(38) who detected its overexpression in a
multidrug-resistant but P-gp-negative lung cancer cell line.
Afterwards, MVP overexpression was found in several human
cancer cell lines (17). Despite
its high expression levels, we did not note any differences between
IM-sensitive and IM-resistant patients, making the role of
MVP overexpression in drug resistance unclear.
The ABCB1 and SLC22A1 genes also
demonstrated high relative expression values, particularly after
treatment and the greatest variations throughout time in
IM-resistant patients, and the mRNA expression of the
SLC22A1 gene was significantly higher in sensitive than in
resistant patients. Moreover, while in sensitive patients the
expression level of SLC22A1 was generally higher than
ABCB1, in both groups of IM-resistant patients that relation
was reversed. The expression values of SLC22A1 in diagnostic
samples from patients susceptible to therapy tended to be higher
than in samples from IM-resistant patients (data not shown).
Collectively, these data suggest an important role for
SLC22A1 expression values in response to treatment. Several
studies have suggested that early achievement of high IM
intracellular concentrations may be a crucial determinant of
cytogenetic response. A significant difference was observed between
pre-treatment SLC22A1 mRNA levels in cytogenetic responders
(CyR) and non-responders (CyNR) (25). Another study also confirmed that the
expression of SLC22A1 is important in determining the
clinical response to IM since patients with high pre-treatment
expression had superior CCyR rates, progression-free and overall
survival (13). A correlation
between the level of SLC22A1 mRNA and hOCT-1 activity was
previously demonstrated (11,39)
and it was also shown that only the activity of hOCT1 in mature CML
blasts is associated with a therapeutic outcome and not the hOCT1
activity in immature CD34+ cells (40). Hu et al(41) showed that SLC22A1 is
significantly interrelated with ABCB1, ABCG2 and
SLCO1A2 and suggested that SLC22A1 gene expression
may alternatively be a composite surrogate for the expression of
various transporters relevant to the intracellular uptake and
retention of IM rather than be the determinant factor.
Several BCR-ABL1 gene mutations detected in
our patient samples were already described as conferring partial
resistance to IM (42,43) such as H396R located in the
activation (A) loop of the protein, M244V in the ATP binding site,
F317L in the IM binding site and D276G in the C-helix domain. The
M351T mutation located in the catalytic domain presented in patient
DRM-4 was previously described as not conferring resistance to IM
(43). The mutation F416S, to the
best of our knowledge, has not been previously reported and
therefore its influence in treatment outcome remains unknown.
Although the A-loop mutation A397V has also not been previously
reported, the substitution of alanine by proline (A397P) in the
same codon has been noted several times (44–47).
Nevertheless, the insensitivity to IM for both mutations, in the
absence of further data, is at present rather a conjecture. None of
the mutations found appeared to affect the expression of the genes
under study (Fig. 4). Sporadic
clones bearing kinase domain mutations do not invariably lead to
relapse, and additional factors are required to induce a fully
drug-resistant phenotype (48)
since they demonstrate high rates of regression, suggesting weak
selective effects (49). Other
mechanisms must be responsible for resistance and are not
necessarily mutually exclusive with mutations. Notwithstanding, in
a number of patients, mutations may be simple ‘bystanders’.
Exceptions are those mutations highly insensitive to IM and those
which a molecular mechanism of resistance has been posited e.g.,
T315I, P-loop mutations and F359V (50), neither of which were found in the
patients under study.
The frequency of BCR-ABL1 transcripts (33.3%
e13a2 and 48.5% e14a2) found in the present study is similar to
earlier observations (51,52). Although several authors revealed a
relation between type of transcript and response to treatment, the
results are contradictory (51,53)
and others did not note any relation (52). Therefore, it remains controversial,
and the clinical significance of the specific BCR-ABL1
transcript among CML patients has not been clearly established. In
five of our patients we found the e1a2 transcript, which encodes a
190-kDa protein, in coexistence with e13a2/e14a2. Its expression as
the only transcript is rare in CML and is associated with an
inferior outcome to therapy with TKIs (54). We were able to reveal it in
association with the most prevalent transcripts and in this regard,
response to therapy was not worse.
We did not note any significant differences between
the three groups of patients, in the frequencies of the analyzed
SNPs. Nevertheless, for ABCB1, we found a tendency for a
higher incidence of the 1236CC genotype in patients sensitive to IM
therapy (Fig. 6A). Some
pharmacogenetic association studies assessing clinical efficacy
were performed in CML patients receiving IM therapy. However, data
involving the role of pharmacogenetics in response and survival in
CML patients are scarce and scantily reproduced. In a previous
study, patients with a 1236TT genotype had higher IM concentrations
and a better response (55) and
another group observed more resistance in CML patients homozygous
for the 1236T allele (56). Also
steady-state IM clearance was associated with genotype, being
higher in 1236TT individuals (28).
Regarding the gene SLC22A1, we were not able to confirm or
reject that CML patients carrying a homozygous GG genotype for the
480C>G polymorphism demonstrated a high rate of loss of response
or treatment failure to IM therapy (57) (Fig.
6B).
In conclusion, our data indicate that the
expression signatures in IM-resistant patients are not stable, but
vary significantly over time, advising caution when comparing
single point samples from responsive and resistant patients. The
data also suggest that the equilibrium between influx and efflux of
the cell is important to determine drug response and highlights the
possible role of the influx transporter SLC22A1 in treatment
response, since not only the patients with higher SLC22A1
expression attain better treatment outcome but those with lower
expression are more likely to develop resistance.
Acknowledgements
Financial support from Fundação para a Ciência e a
Tecnologia (FCT) through the project PTDC/SAU-GMG/71720/2006 and
PEst-OE/SAU/UI0009/2011-2012, the grant SFRH/BPD/39046/2007 and the
Programa Ciência 2008 was provided to M.G.
Abbreviations:
|
CML
|
chronic myeloid leukemia
|
|
IM
|
imatinib mesylate
|
|
MDR
|
multidrug resistance
|
|
MRPs
|
multidrug resistance-associated
proteins
|
|
qRT-PCR
|
quantitative real-time polymerase
chain reaction
|
|
Ct
|
threshold cycle
|
|
TKIs
|
tyrosine kinase inhibitors
|
|
CCyR
|
complete cytogenetic response
|
|
MMR
|
major molecular response
|
References
|
1
|
Druker BJ: Translation of the Philadelphia
chromosome into therapy for CML. Blood. 112:4808–4817. 2008.
View Article : Google Scholar : PubMed/NCBI
|
|
2
|
Jabbour E, Cortes J and Kantarjian H:
Long-term outcomes in the second-line treatment of chronic myeloid
leukemia: a review of tyrosine kinase inhibitors. Cancer.
117:897–906. 2011. View Article : Google Scholar : PubMed/NCBI
|
|
3
|
Hochhaus A, O’Brien SG, Guilhot F, et al:
Six-year follow-up of patients receiving imatinib for the
first-line treatment of chronic myeloid leukemia. Leukemia.
23:1054–1061. 2009.PubMed/NCBI
|
|
4
|
de Lavallade H, Apperley JF, Khorashad JS,
et al: Imatinib for newly diagnosed patients with chronic myeloid
leukemia: incidence of sustained responses in an intention-to-treat
analysis. J Clin Oncol. 26:3358–3363. 2008.PubMed/NCBI
|
|
5
|
Marin D, Milojkovic D, Olavarria E, et al:
European LeukemiaNet criteria for failure or suboptimal response
reliably identify patients with CML in early chronic phase treated
with imatinib whose eventual outcome is poor. Blood. 112:4437–4444.
2008. View Article : Google Scholar
|
|
6
|
Baccarani M, Castagnetti F, Gugliotta G,
Palandri F and Soverini S: Response definitions and European
Leukemianet Management recommendations. Best Pract Res Clin
Haematol. 22:331–341. 2009. View Article : Google Scholar : PubMed/NCBI
|
|
7
|
Soverini S, Colarossi S, Gnani A, et al:
Contribution of ABL kinase domain mutations to imatinib resistance
in different subsets of Philadelphia-positive patients: by the
GIMEMA Working Party on Chronic Myeloid Leukemia. Clin Cancer Res.
12:7374–7379. 2006. View Article : Google Scholar
|
|
8
|
Larson RA, Druker BJ, Guilhot F, et al:
Imatinib pharmacokinetics and its correlation with response and
safety in chronic-phase chronic myeloid leukemia: a subanalysis of
the IRIS study. Blood. 111:4022–4028. 2008. View Article : Google Scholar : PubMed/NCBI
|
|
9
|
Picard S, Titier K, Etienne G, et al:
Trough imatinib plasma levels are associated with both cytogenetic
and molecular responses to standard-dose imatinib in chronic
myeloid leukemia. Blood. 109:3496–3499. 2007. View Article : Google Scholar : PubMed/NCBI
|
|
10
|
Thomas J, Wang L, Clark RE and Pirmohamed
M: Active transport of imatinib into and out of cells: implications
for drug resistance. Blood. 104:3739–3745. 2004. View Article : Google Scholar : PubMed/NCBI
|
|
11
|
White DL, Saunders VA, Dang P, et al: Most
CML patients who have a suboptimal response to imatinib have low
OCT-1 activity: higher doses of imatinib may overcome the negative
impact of low OCT-1 activity. Blood. 110:4064–4072. 2007.
View Article : Google Scholar : PubMed/NCBI
|
|
12
|
Clark RE, Davies A, Pirmohamed M and
Giannoudis A: Pharmacologic markers and predictors of responses to
imatinib therapy in patients with chronic myeloid leukemia. Leuk
Lymphoma. 49:639–642. 2008. View Article : Google Scholar : PubMed/NCBI
|
|
13
|
Wang L, Giannoudis A, Lane S, Williamson
P, Pirmohamed M and Clark R: Expression of the uptake drug
transporter hOCT1 is an important clinical determinant of the
response to imatinib in chronic myeloid leukemia. Clin Pharmacol
Ther. 83:258–264. 2008. View Article : Google Scholar : PubMed/NCBI
|
|
14
|
Rodrigues AS, Dinis J, Gromicho M, Martins
C, Laires A and Rueff J: Genomics and cancer drug resistance. Curr
Pharm Biotechnol. 13:651–673. 2012. View Article : Google Scholar : PubMed/NCBI
|
|
15
|
Cortez MAA, Scrideli CA, Yunes JA, et al:
mRNA expression profile of multidrug resistance genes in childhood
acute lymphoblastic leukemia. Low expression levels associated with
a higher risk of toxic death. Pediatr Blood Cancer. 53:996–1004.
2009. View Article : Google Scholar
|
|
16
|
Raaijmakers MHGP: ATP-binding-cassette
transporters in hematopoietic stem cells and their utility as
therapeutical targets in acute and chronic myeloid leukemia.
Leukemia. 21:2094–2102. 2007. View Article : Google Scholar
|
|
17
|
Steiner E, Holzmann K, Elbling L, Micksche
M and Berger W: Cellular functions of vaults and their involvement
in multidrug resistance. Curr Drug Targets. 7:923–934. 2006.
View Article : Google Scholar : PubMed/NCBI
|
|
18
|
Vasconcelos FC, Silva KL, Souza PSD, et
al: Variation of MDR protein expression and activity levels
according to clinical status and evolution of CML patients.
Cytometry B Clin Cytom. 80:158–166. 2010.PubMed/NCBI
|
|
19
|
Stromskaya T, Rybalkina EY, Kruglov S, et
al: Role of p-glycoprotein in evolution of populations of chronic
myeloid leukemia cells treated with imatinib. Biochemistry (Mosc).
73:29–37. 2008. View Article : Google Scholar : PubMed/NCBI
|
|
20
|
Gromicho M, Dinis J, Magalhães M, et al:
Development of imatinib and dasatinib resistance: dynamics of
expression of drug transporters ABCB1, ABCC1, ABCG2, MVP, and
SLC22A1. Leuk Lymphoma. 52:1980–1990. 2011. View Article : Google Scholar : PubMed/NCBI
|
|
21
|
Nijmeijer BA, Szuhai K, Goselink HM, et
al: Long-term culture of primary human lymphoblastic leukemia cells
in the absence of serum or hematopoietic growth factors. Exp
Hematol. 37:376–385. 2009. View Article : Google Scholar : PubMed/NCBI
|
|
22
|
van Dongen JJ, Macintyre EA, Gabert JA, et
al: Standardized RT-PCR analysis of fusion gene transcripts from
chromosome aberrations in acute leukemia for detection of minimal
residual disease. Report of the BIOMED-1 Concerted Action:
investigation of minimal residual disease in acute leukemia.
Leukemia. 13:1901–1928. 1999.PubMed/NCBI
|
|
23
|
Gabert J, Beillard E, van der Velden VHJ,
et al: Standardization and quality control studies of ‘real-time’
quantitative reverse transcriptase polymerase chain reaction of
fusion gene transcripts for residual disease detection in leukemia
- a Europe Against Cancer program. Leukemia. 17:2318–2357.
2003.
|
|
24
|
Schefe JH, Lehmann KE, Buschmann IR, Unger
T and Funke-Kaiser H: Quantitative real-time RT-PCR data analysis:
current concepts and the novel ‘gene expression’s CT difference’
formula. J Mol Med. 84:901–910. 2006.PubMed/NCBI
|
|
25
|
Crossman LC, Druker BJ, Deininger MWN,
Pirmohamed M, Wang L and Clark RE: hOCT 1 and resistance to
imatinib. Blood. 106:1133–1134. 2005. View Article : Google Scholar : PubMed/NCBI
|
|
26
|
Burger H, van Tol H, Brok M, et al:
Chronic imatinib mesylate exposure leads to reduced intracellular
drug accumulation by induction of the ABCG2 (BCRP) and ABCB1 (MDR1)
drug transport pumps. Cancer Biol Therapy. 4:747–752. 2005.
View Article : Google Scholar : PubMed/NCBI
|
|
27
|
Gardner ER, Sparreboom A, Verweij J and
Figg WD: Lack of ABC transporter autoinduction in mice following
long-term exposure to imatinib. Cancer Biol Therapy. 7:412–415.
2008. View Article : Google Scholar : PubMed/NCBI
|
|
28
|
Gurney H, Wong M, Balleine RL, et al:
Imatinib disposition and ABCB1 (MDR1, P-glycoprotein) genotype.
Clin Pharm Ther. 82:33–40. 2007. View Article : Google Scholar : PubMed/NCBI
|
|
29
|
Xu C, Li CY-T and Kong A-NT: Induction of
phase I, II and III drug metabolism/transport by xenobiotics. Arch
Pharm Res. 28:249–268. 2005. View Article : Google Scholar : PubMed/NCBI
|
|
30
|
Eechoute K, Sparreboom A, Burger H, et al:
Drug transporters and imatinib treatment: implications for clinical
practice. Clin Cancer Res. 17:406–415. 2011. View Article : Google Scholar : PubMed/NCBI
|
|
31
|
White DL, Saunders VA, Dang P, et al:
OCT-1-mediated influx is a key determinant of the intracellular
uptake of imatinib but not nilotinib (AMN107): reduced OCT-1
activity is the cause of low in vitro sensitivity to imatinib.
Blood. 108:697–704. 2006. View Article : Google Scholar
|
|
32
|
de Grouw EPLM, Raaijmakers MHGP, Boezeman
JB, et al: Preferential expression of a high number of ATP binding
cassette transporters in both normal and leukemic
CD34+CD38- cells. Leukemia. 20:750–754.
2006.PubMed/NCBI
|
|
33
|
de Lavallade H, Finetti P, Carbuccia N, et
al: A gene expression signature of primary resistance to imatinib
in chronic myeloid leukemia. Leukemia Res. 34:254–257.
2010.PubMed/NCBI
|
|
34
|
Villuendas R, Steegmann JL, Pollán M, et
al: Identification of genes involved in imatinib resistance in CML:
a gene-expression profiling approach. Leukemia. 20:1047–1054. 2006.
View Article : Google Scholar : PubMed/NCBI
|
|
35
|
Lange T, Günther C, Köhler T, et al: High
levels of BAX, low levels of MRP-1, and high platelets are
independent predictors of response to imatinib in myeloid blast
crisis of CML. Blood. 101:2152–2155. 2003. View Article : Google Scholar : PubMed/NCBI
|
|
36
|
Czyzewski K and Styczynski J: Imatinib is
a substrate for various multidrug resistance proteins. Neoplasma.
56:202–207. 2009. View Article : Google Scholar : PubMed/NCBI
|
|
37
|
Shukla S, Sauna ZE and Ambudkar SV:
Evidence for the interaction of imatinib at the transport-substrate
site(s) of the multidrug-resistance-linked ABC drug transporters
ABCB1 (P-glycoprotein) and ABCG2. Leukemia. 22:445–447. 2008.
View Article : Google Scholar : PubMed/NCBI
|
|
38
|
Scheffer GL, Schroeijers AB, Izquierdo MA,
Wiemer EA and Scheper RJ: Lung resistance-related protein/major
vault protein and vaults in multidrug-resistant cancer. Curr Opin
Oncol. 12:550–556. 2000. View Article : Google Scholar : PubMed/NCBI
|
|
39
|
White DL, Dang P, Engler J, et al:
Functional activity of the OCT-1 protein is predictive of long-term
outcome in patients with chronic-phase chronic myeloid leukemia
treated with imatinib. J Clin Oncol. 28:2761–2767. 2010. View Article : Google Scholar : PubMed/NCBI
|
|
40
|
Engler JR, Frede A, Saunders VA,
Zannettino ACW, Hughes TP and White DL: Chronic myeloid leukemia
CD34+ cells have reduced uptake of imatinib due to low
OCT-1 activity. Leukemia. 24:765–770. 2010.PubMed/NCBI
|
|
41
|
Hu S, Franke RM, Filipski KK, et al:
Interaction of imatinib with human organic ion carriers. Clin
Cancer Res. 14:3141–3148. 2008. View Article : Google Scholar : PubMed/NCBI
|
|
42
|
O’Hare T, Eide CA and Deininger MWN:
Bcr-Abl kinase domain mutations, drug resistance, and the road to a
cure for chronic myeloid leukemia. Blood. 110:2242–2249.
2007.PubMed/NCBI
|
|
43
|
Redaelli S, Piazza R, Rostagno R, et al:
Activity of bosutinib, dasatinib, and nilotinib against 18
imatinib-resistant BCR/ABL mutants. J Clin Oncol. 27:469–471. 2008.
View Article : Google Scholar : PubMed/NCBI
|
|
44
|
Wang L, Knight K, Lucas C and Clark RE:
The role of serial BCR-ABL transcript monitoring in predicting the
emergence of BCR-ABL kinase mutations in imatinib-treated patients
with chronic myeloid leukemia. Haematologica. 91:235–239.
2006.PubMed/NCBI
|
|
45
|
Gruber FX, Lundán T, Goll R, et al:
BCR-ABL isoforms associated with intrinsic or acquired resistance
to imatinib: more heterogeneous than just ABL kinase domain point
mutations? Med Oncol. 29:219–226. 2012. View Article : Google Scholar : PubMed/NCBI
|
|
46
|
Guilhot F, Apperley J, Kim D-W, et al:
Dasatinib induces significant hematologic and cytogenetic responses
in patients with imatinib-resistant or -intolerant chronic myeloid
leukemia in accelerated phase. Blood. 109:4143–4150. 2007.
View Article : Google Scholar
|
|
47
|
Ernst T, Hoffmann J, Erben P, et al: ABL
single nucleotide polymorphisms may masquerade as BCR-ABL mutations
associated with resistance to tyrosine kinase inhibitors in
patients with chronic myeloid leukemia. Haematologica.
93:1389–1393. 2008. View Article : Google Scholar
|
|
48
|
Willis SG, Lange T, Demehri S, et al:
High-sensitivity detection of BCR-ABL kinase domain mutations in
imatinib-naive patients: correlation with clonal cytogenetic
evolution but not response to therapy. Blood. 106:2128–2137. 2005.
View Article : Google Scholar
|
|
49
|
Jones D, Chen SS, Jabbour E, Rios MB,
Kantarjian H and Cortes J: Uncommon BCR-ABL kinase domain mutations
in kinase inhibitor-resistant chronic myelogenous leukemia and
Ph+ acute lymphoblastic leukemia show high rates of
regression, suggesting weak selective effects. Blood.
115:5428–5429. 2010. View Article : Google Scholar : PubMed/NCBI
|
|
50
|
Soverini S, Hochhaus A, Nicolini FE, et
al: Bcr-Abl kinase domain mutation analysis in chronic myeloid
leukemia patients treated with tyrosine kinase inhibitors:
recommendations from an expert panel on behalf of European
LeukemiaNet. Blood. 118:1208–1215. 2011. View Article : Google Scholar
|
|
51
|
Sharma P, Kumar L, Mohanty S and
Kochupillai V: Response to imatinib mesylate in chronic myeloid
leukemia patients with variant BCR-ABL fusion transcripts. Ann
Hematol. 89:241–247. 2010. View Article : Google Scholar : PubMed/NCBI
|
|
52
|
Polampalli S, Choughule A, Negi N, et al:
Analysis and comparison of clinicohematological parameters and
molecular and cytogenetic response of two Bcr/Abl fusion
transcripts. Genetics Mol Res. 7:1138–1149. 2008. View Article : Google Scholar : PubMed/NCBI
|
|
53
|
Lucas CM, Harris RJ, Giannoudis A, et al:
Chronic myeloid leukemia patients with the e13a2 BCR-ABL fusion
transcript have inferior responses to imatinib compared to patients
with the e14a2 transcript. Haematologica. 94:1362–1367. 2009.
View Article : Google Scholar : PubMed/NCBI
|
|
54
|
Verma D, Kantarjian HM, Jones D, et al:
Chronic myeloid leukemia (CML) with P190 BCR-ABL: analysis of
characteristics, outcomes, and prognostic significance. Blood.
114:2232–2235. 2009. View Article : Google Scholar : PubMed/NCBI
|
|
55
|
Dulucq S, Bouchet S, Turcq B, et al:
Multidrug resistance gene (MDR1) polymorphisms are associated with
major molecular responses to standard-dose imatinib in chronic
myeloid leukemia. Blood. 112:2024–2027. 2008. View Article : Google Scholar : PubMed/NCBI
|
|
56
|
Ni L-N, Li J-Y, Miao K-R, et al: Multidrug
resistance gene (MDR1) polymorphisms correlate with imatinib
response in chronic myeloid leukemia. Med Oncol. 28:265–269. 2011.
View Article : Google Scholar : PubMed/NCBI
|
|
57
|
Kim DHD, Sriharsha L, Xu W, et al:
Clinical relevance of a pharmacogenetic approach using multiple
candidate genes to predict response and resistance to imatinib
therapy in chronic myeloid leukemia. Clin Cancer Res. 15:4750–4758.
2009. View Article : Google Scholar : PubMed/NCBI
|