Introduction
Breast cancer is the most common cancer and the
leading cause of mortality in women worldwide, accounting for 23%
(1.38 million cases) of the total new cancer cases and 14% (458,400
cases) of all cancer deaths in 2008 (1). The development of breast cancer may
result from interaction between the change in genetic elements,
environmental factors and also the difference in ethnicity
(2). There are several genes
reported to be associated with breast cancer, such as ERBB2,
c-Myc, CCND1, TP53, PTEN and Wilms’
tumor 1 (WT1) (3).
The human WT1 gene is located at chromosome
locus 11p13 comprising 10 exons. Alternative splicing occurs at
exon 5 (plus or minus 17AA) and exon 9 (plus or minus KTS) in mRNA
of WT1. These two alternative splicing sites yield four different
isoforms: WT1+/+, WT1+/−, WT1−/+ and WT1−/− (4,5). Loeb
et al demonstrated that WT1 mRNA and protein was detected in
nearly 90% of breast cancers but not in most normal breast samples
(6). Moreover, Navakanit et
al reported that the siRNA against WT1 inhibited both WT1
protein expression level and growth of breast cancer cell line
MCF-7, in a dose- and time-dependent manner. These results
suggested that WT1 may act as an oncogene in the breast cancer cell
line MCF-7. Furthermore, WT1 may play a role in the pathogenesis of
breast cancer as an oncogene rather than a tumor suppressor gene as
in leukemia (7). Additionally, the
high level expression of WT1 mRNA detected by real-time RT-PCR can
predict a poor prognosis in breast cancer patients (8) and the absence of mutations through the
whole 10 exons of the WT1 gene in the 36 cases of primary
breast cancer (9). WT1
encodes a zinc finger acting as a transcriptional activator or
repressor for many genes involved in cell differentiation, growth
and apoptosis. These functions depend on the type of cells, WT1
isoforms and the status of targeted molecules. There are several
targeted molecules for WT1 including growth factor genes: IGF-II,
PDGF-A, CSF-1 and TGF-β1, growth factor receptor genes: insulin
receptor, IGF-1R and EGFR, and transcription factor and other
genes, including: Egr1, PAX4, p53, c-myc, Bcl-2, cyclin E, Bak, Bax
(10,11). However, the relationship between WT1
and the targeted molecules involved in breast cancer remains
unclear and the overview study of the relationship between WT1 and
the related molecules has not been reported.
MDA-MB-468 breast cancer cells are estrogen receptor
(ER), progesterone receptor (PR) and HER2-negative (12). The cells have a very high number of
the epidermal growth factor receptors (EGFRs) which is growth
inhibited by EGF and mediated apoptosis (13,14).
Moreover, the cells have a p53 mutation, G -> A mutation in
codon 273 of the p53 gene resulting in an Arg -> His
substitution (15).
In the present study, we used siRNA against WT1 mRNA
to silence WT1 expression and the relationship between WT1 and
related proteins in the breast cancer cell line MDA-MB-468 was
investigated by proteomics analysis. The proteins were further
identified by LC-MS/MS and database searching. These studies may
provide further evidence to understand the relationship between WT1
and the related molecules in breast cancer.
Materials and methods
Cell culture
The human breast cancer cell line MDA-MB-468 was
purchased from American Type Culture Collection. MDA-MB-468 was
cultured in DMEM (Gibco-BRL) supplemented with 10% fetal bovine
serum, 100 U/ml of penicillin, and 100 μg/ml of streptomycin and
10% glutamine. Then, the cells were incubated in a 37°C incubator
with 5% CO2 (7).
Small interfering RNA (siRNA)
transfection
MDA-MB-468 at 1×10⁵ cells were seeded in
each well of 24-well culture plates and incubated in a
CO2 incubator at 37°C for 24 h. The cells were
transfected using Lipofectamine® 2000 reagent
(Invitrogen) in 24-well plates with 200 nM siRNA duplexes (optimal
siRNA conditions performed in preliminary study and data not
shown). The siRNA against WT1 (siRNAWT1) (Invitrogen)
consisted of a mixture of two 25-nt duplexes, i.e.,
siRNAWT1R88 (5′-AAATATCTCTTATTGCAGCCT GGGT-3′) and
siRNAWT1R90 (5′-TTTCACACCTGTATGTCT CCTTTGG-3′). To
minimize the cytotoxicity of the reagent itself, the cells were
washed once with PBS and the media was changed 6 h after
transfection (7). After 72 h, the
cells were harvested and the protein level was investigated by
western blot analysis.
Western blot analysis
Cell pellets were harvested by trypsinization and
extracted with radioimmunoprecipitation assay (RIPA) buffer
(Pierce, USA). Then, the concentration of protein was determined by
the Bradford assay (Bio-Rad, Hercules, CA, USA). The 50 μg of
protein samples were loaded to 12% SDS-polyacrylamide gel
electrophoresis and transferred to a nitrocellulose membrane
(Bio-Rad). The membrane was blocked by blocking solution [5% low
fat dry milk in 1X TTBS (0.1% Tween-20, 154 mM NaCl, 48 mM
Tris-base)] for 1 h and washed 5 min for three times with washing
solution (1% low fat dry milk in 1X TTBS buffer). After blocking,
the blot was incubated with primary antibody anti-WT1 (1:200),
anti-rho-GEF (1:1,000) and anti-actin (1:1,000) antibodies (diluted
with 1% low fat dry milk in 1X TTBS) for 2 h and washed 5 min for
three times with washing solution. The membrane was then incubated
with secondary antibody polyclonal anti-IgG rabbit (1:10,000)
antibody in 1% low fat dry milk in 1X TTBS for 1 h and washed three
times (10 min/wash). The proteins were visualized using a
chemiluminescent detection kit (Pierce) and exposed to X-ray film
(7).
Proteomics analysis
One-dimensional electrophoresis
(1-DE)
After transfection, siRNAneg- and
siRNAWT1-transfected cell pellets from MDA-MB-468 were
extracted with 0.5% SDS. Protein quantification was calculated
using the Lowry method. Total protein samples of 50 μg were loaded
onto 12.5% SDS-polyacrylamide gel and a marker lane (low range
marker; GE Healthcare) was added for calculation of the molecular
weight of the protein bands. The gel was run at 20 mA/gel for 1.45
h. After electrophoresis, the gel was fixed in fixing solution (40%
ethanol, 10% acetic acid) and stained with Colloidal Coomassie Blue
G-250 (8% ammonium sulfate, 0.8% phosphoric acid, 0.08% Coomassie
Brilliant Blue G-250 and 20% methanol). Then, the gel was scanned
with EPS 601 scanner (Bio-Rad) and the gel bands were fractionated
to 15 slices and excised from the bottom to the top of the gel lane
and each slice was cut into 1 mm cubes. The gel pieces were
transferred into a well of low binding 96-well plates.
In-gel digestion
The gel pieces were destained by washing twice with
25 mM ammonium bicarbonate in 50% methanol and further washed with
100% acetonitrile. Dried gel pieces were added with 20 μl of 10 mM
DTT in 10 mM ammonium bicarbonate and incubated at 56°C for 1 h,
followed by the addition of 100 mM iodoacetamide in 10 mM ammonium
bicarbonate. The gel pieces were then digested with 10 μl of 10
ng/μl sequencing grade modified porcine trypsin (Promega, USA) in
10 mM ammonium bicarbonate solution and incubated at 37°C
overnight. The peptides were extracted by addition of 30 μl of 50%
acetonitrile in 0.1% formic acid and dried at 40°C overnight.
LC-MS/MS and protein
identification
The dried extracted peptides were resuspended with
12 μl of 0.1% formic acid and transferred to low binding
microcentrifuge tube. Solution was centrifuged at 10,000 rpm for 10
min and transferred to vial tube. The resuspended peptide was
injected to LC-MS/MS (ESI-QUAD-TOF mass spectrometry). The peptide
sequences from LC-MS/MS were analyzed by Mascot Search and
identified by NCBInr database.
Results and Discussion
siRNA against WT1 transfection in
MDA-MB-468 cell line
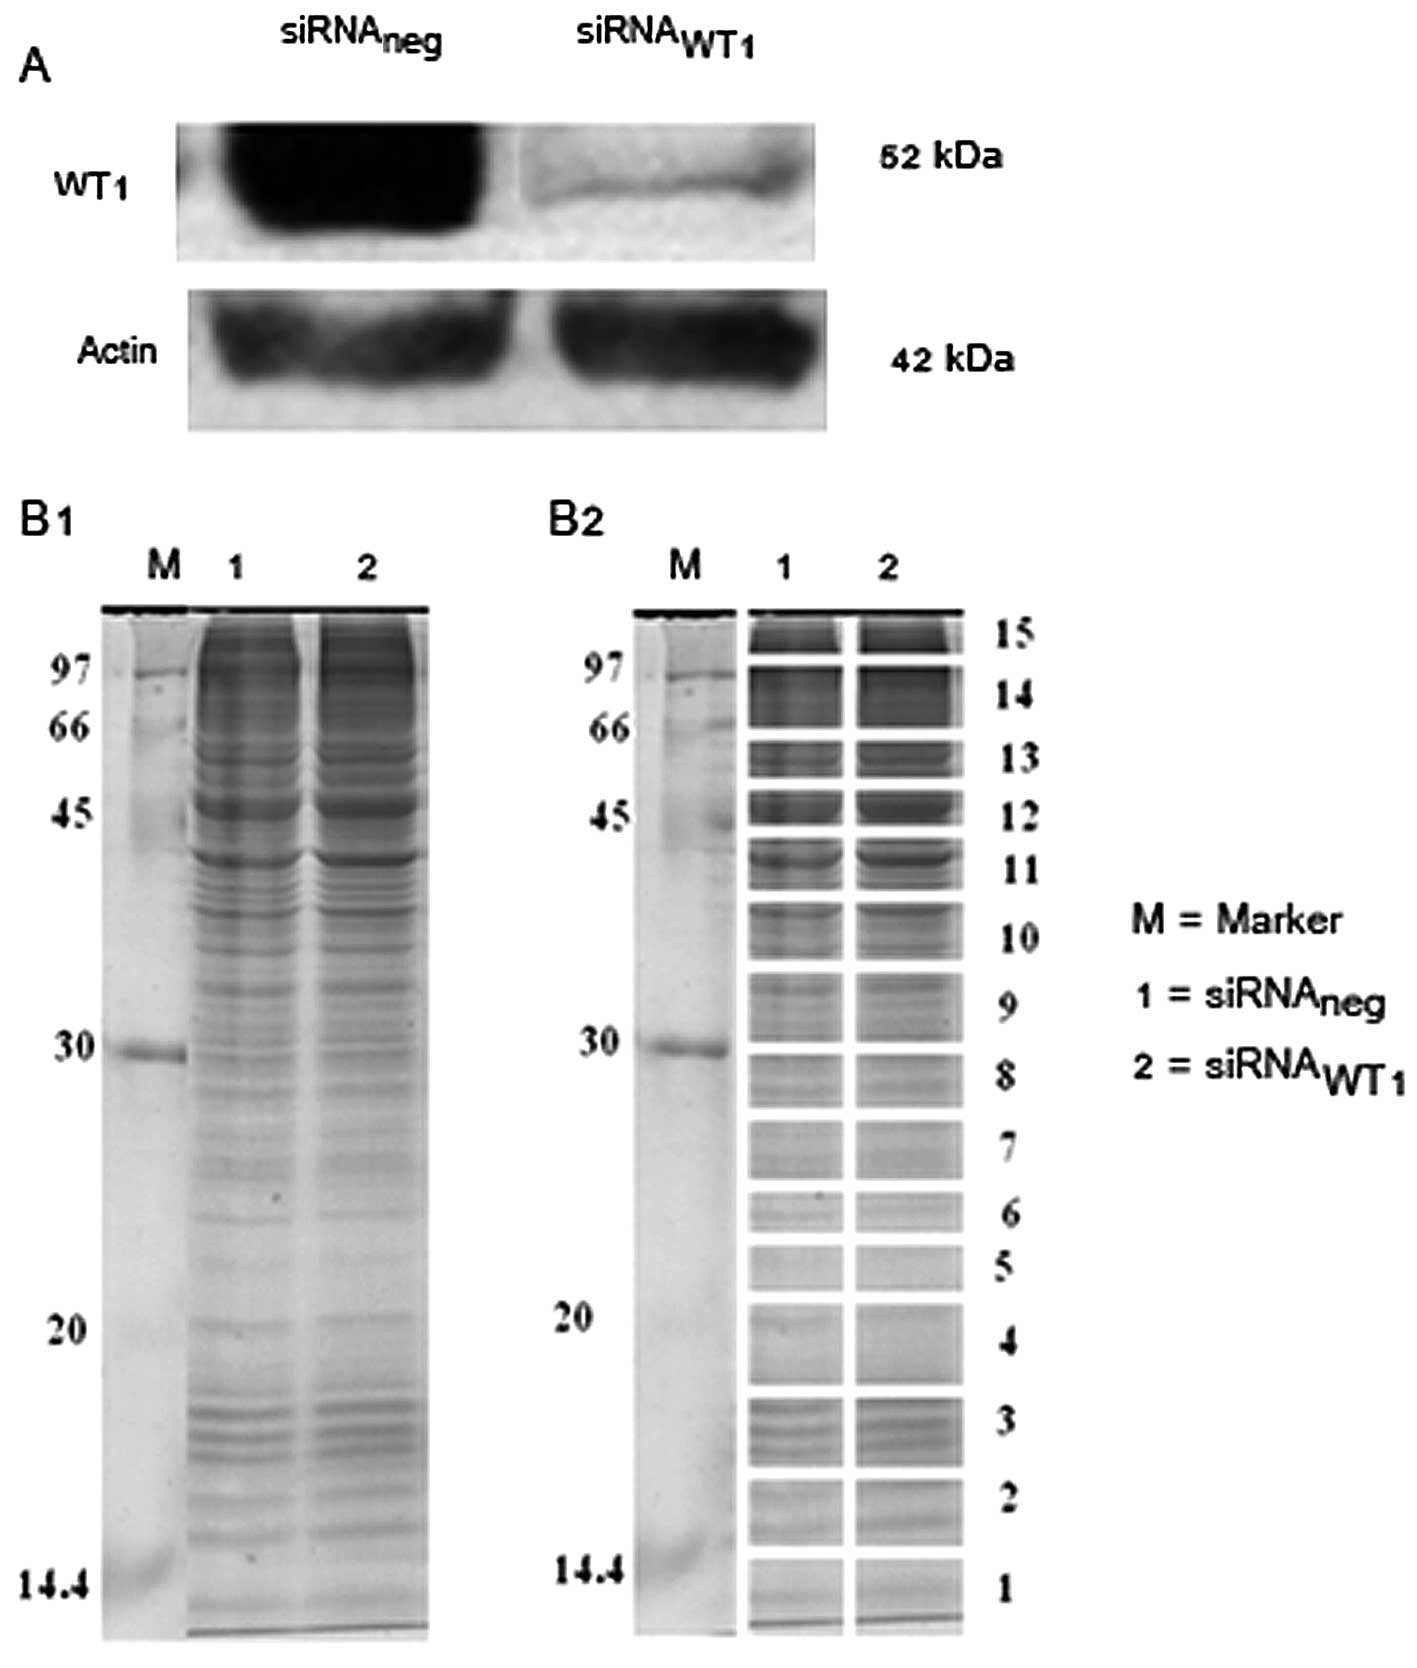
The MDA-MB-468 breast cancer cell line was
transfected with 200 nM of siRNA against WT1 (siRNAWT1)
compared to control (siRNAneg) for 72 h. After
transfection of the cells we detected WT1 level by western blot
analysis. The results showed that knockdown of WT1 led to decrease
in WT1 protein expression in MDA-MB-468 (Fig. 1A).
1-DE
The quantitative proteomic, one-dimensional gel
electrophoresis (1D-PAGE) was carried out to determine the protein
expression patterns between siRNAneg compared to
siRNAWT1 in MDA-MB-468. Fig.
1B1 represents the protein patterns obtained from 1D-PAGE. Lane
1 and 2 show the protein bands of siRNAneg and
siRNAWT1, respectively. After 1D-PAGE, the gels were cut
into 15 slices as shown in Fig.
1B2.
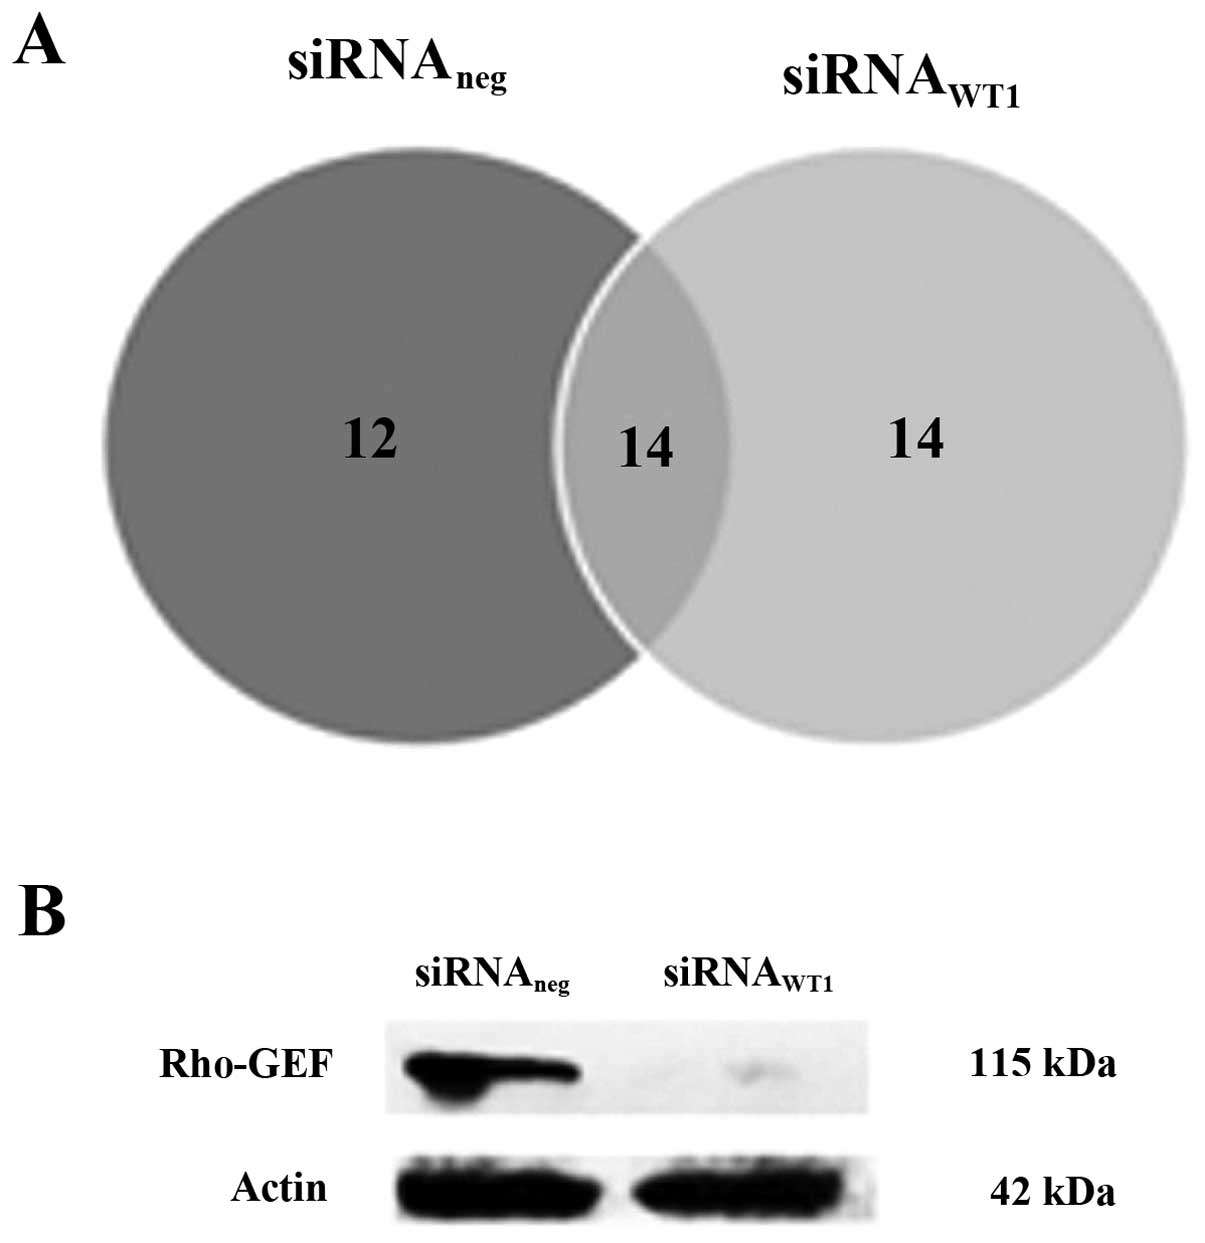
The quantification of protein from 1D-PAGE was
analyzed by the DeCyder™ MS 2.0 Differential Analysis Software (GE
Healthcare). The protein expressions of siRNAWT1 and
siRNAneg were compared. The different intensity of
protein expression in both conditions is shown in Venn’s diagram
(Fig. 2A). These demonstrated all
possible relations of protein expressions in two conditions. The
protein names and their biological functions of expressed proteins
found only in siRNAWT1 are listed in Table I and the expressed proteins found
only in siRNAneg are listed in Table II. Table III shows the protein names and the
biological functions of expressed proteins found in
siRNAWT1 and siRNAneg. Rho guanine nucleotide
exchange factor 1 (Rho-GEF) was selected to validate by western
blot analysis. The result showed the presence of Rho-GEF only in
WT1 presence in the cell (Fig.
2B).
 | Table IIdentification of expressed proteins
found only in MDA-MB-468 siRNAWT1 using DeCyder™ MS 2.0
Differential Analysis Software. |
Table I
Identification of expressed proteins
found only in MDA-MB-468 siRNAWT1 using DeCyder™ MS 2.0
Differential Analysis Software.
| Protein name | Accession no. | Peptide | Mowse score |
|---|
| Apoptosis |
| Mitogaligin | gi|12005991 | AWRMGEPACWGR | 9.50 |
| Cell signaling |
| IBTK protein,
partial | gi|34192875 | SLDVLSDGVLK | 27.56 |
| SH2
domain-containing protein 3C isoform a | gi|41281821 | RSSASISR | 11.47 |
| Structural
protein |
| Cytokeratin 9 | gi|435476 |
GGSGGSYGGGGSGGGYGGGSGSR | 91.06 |
| Keratin 10 | gi|21961605 | SQYEQLAEQNRK | 50.17 |
| Keratin, type II
cytoskeletal 1 | gi|119395750 | SLNNQFASFIDK | 98.71 |
| Type I keratin
16 | gi|1195531 | APSTYGGGLSVSSR | 30.64 |
| Protein folding |
| Ankyrin repeat
domain-containing protein 62 | gi|302393830 | LNDLNDRDK | 13.03 |
| Gene regulation |
| SON DNA binding
protein isoform E | gi|17046381 | NRDKGEKEK | 10.73 |
| Redox-regulation |
| Selenoprotein I | gi|119621096 | KMAASTRVEASR | 5.30 |
| Transport |
|
Synaptosomal-associated protein 23
isoform SNAP23A | gi|18765729 | KLIDS | 4.17 |
| Unknown |
| hCG2042301 | gi|119611404 |
TGGDRTKAQRHEIISLS | 11.14 |
| Unknown protein
IT12 | gi|2792366 | SGARAMAKAKK | 7.15 |
| Unnamed protein
product | gi|21757251 | LINDSTNK | 19.40 |
| Table IIIdentification of expressed proteins
found only in MDA-MB-468 siRNAneg using DeCyder™ MS 2.0
Differential Analysis Software. |
Table II
Identification of expressed proteins
found only in MDA-MB-468 siRNAneg using DeCyder™ MS 2.0
Differential Analysis Software.
| Protein name | Accession no. | Peptide | Mowse score |
|---|
| Cell adhesion |
| Vang-like protein
1 isoform 1 | gi|20373171 | HMAGLK | 12.95 |
| Cell
differentiation |
| METRNL protein,
partial | gi|30047763 |
VFEPVPEGDGHWQGR | 10.04 |
| Cell signaling |
| PDGFRA
protein | gi|39645305 |
VPSIKLVYTLTVPEATVK | 11.73 |
| Rho guanine
nucleotide exchange factor 11 isoform 1 | gi|7662086 | SSNSK | 6.04 |
| Structural |
| Keratin 5 | gi|18999435 | LAELEEALQK | 23.61 |
| Peroxisome
assembly protein 26 isoform a | gi|8923625 | KSDSSTSAAPLR | 6.59 |
| hHa7 protein | gi|50949256 | NTLNGHEK | 12.35 |
| Transport |
| Na+/K+-ATPase α 3
subunit variant | gi|62898870 | LNIPVSQVNPR | 14.46 |
| Unknown
function |
| Unnamed protein
product | gi|194390014 | MFHLAAFKLK | 22.44 |
| hCG2042050 | gi|119579649 | ASTVPDLK | 7.42 |
| Chromosome 9 open
reading frame 39 | gi|119579068 | LLEGQSLALSPR | 11.96 |
| Hypothetical
protein LOC286076 | gi|119602615 | DVGDALPR | 29.47 |
| Table IIIIdentification of expressed proteins
found in MDA-MB-468 siRNAWT1 and MDA-MB-468
siRNAneg using DeCyder™ MS 2.0 Differential Analysis
Software. |
Table III
Identification of expressed proteins
found in MDA-MB-468 siRNAWT1 and MDA-MB-468
siRNAneg using DeCyder™ MS 2.0 Differential Analysis
Software.
| Protein name | Accession no. | Peptide | Mowse score |
|---|
| Structural
protein |
| LMNA protein | gi|21619981 | SGAQASSTPLSPTR | 44.82 |
| Cell
differentiation and survival |
| Nance-Horan
syndrome protein isoform 2 | gi|42384238 | KTISGIPR | 26.98 |
| Sestrin-2 | gi|13899299 | KLSEINK | 21.68 |
| Cell signaling |
| S100 calcium
binding protein A10 [Annexin II ligand, calpactin I, light
polypeptide (p11)], isoform CRA_b | gi|119573783 | NALSGAGEASAR | 11.49 |
| Chain A, catalytic
domain of human phosphodiesterase 4b in complex with
piclamilast | gi|58177395 | GMEISPMXDK | 8.66 |
| Protein
S100-A6 | gi|7657532 | LQDAEIAR | 43.91 |
| Hormone |
| C-type natriuretic
peptide precursor | gi|13249346 | YKGANKKGLSK | 10.08 |
| Protein
folding |
| Heat shock
protein | gi|4204880 |
IINEPTAAAIAYGLDKK | 27.1 |
| Transport |
| Ras association
domain-containing protein 9 | gi|114155158 | ADAFLPVPLWR | 6.35 |
| Gene
regulation |
| TTLL5 protein | gi|33877151 | MGNTMDKR | 10.31 |
| 39S ribosomal
protein L15, mitochondrial | gi|7661806 | CGRGHK | 16.37 |
| Unknown
function |
| hCG16415, isoform
CRA_f | gi|119611935 | GAECCPGGPVK | 10.83 |
| FLJ00258
protein | gi|18676718 | GSMSR | 8.83 |
| Pyruvate
dehydrogenase E1 α subunit | gi|861534 | EEIPPHSYR | 6.28 |
Due to p53 mutation in MDA-MB-468 (15), the apoptosis pathway may occur via
p53 independently. Notably, a novel target protein of WT1,
mitogaligin, was found when WT1 was silenced. Mitogaligin is a 96
amino acid protein highly cationic and rich in tryptophan (16). This protein contains two
localization signals, mitochondria and nucleus. Mitogaligin is
mainly localized in mitochondria and promotes the release of
cytochrome c resulting in the induction of cell death
(17). Moreover, it can also be
directed to the nucleus and can play a role in apoptotic properties
leading to cell death (18). The
STRING shows the correlation between WT1 and mitogaligin via EGFR
(Fig. 3A). WT1 may act as negative
regulator of mitogaligin through the EGFR leading cell death.
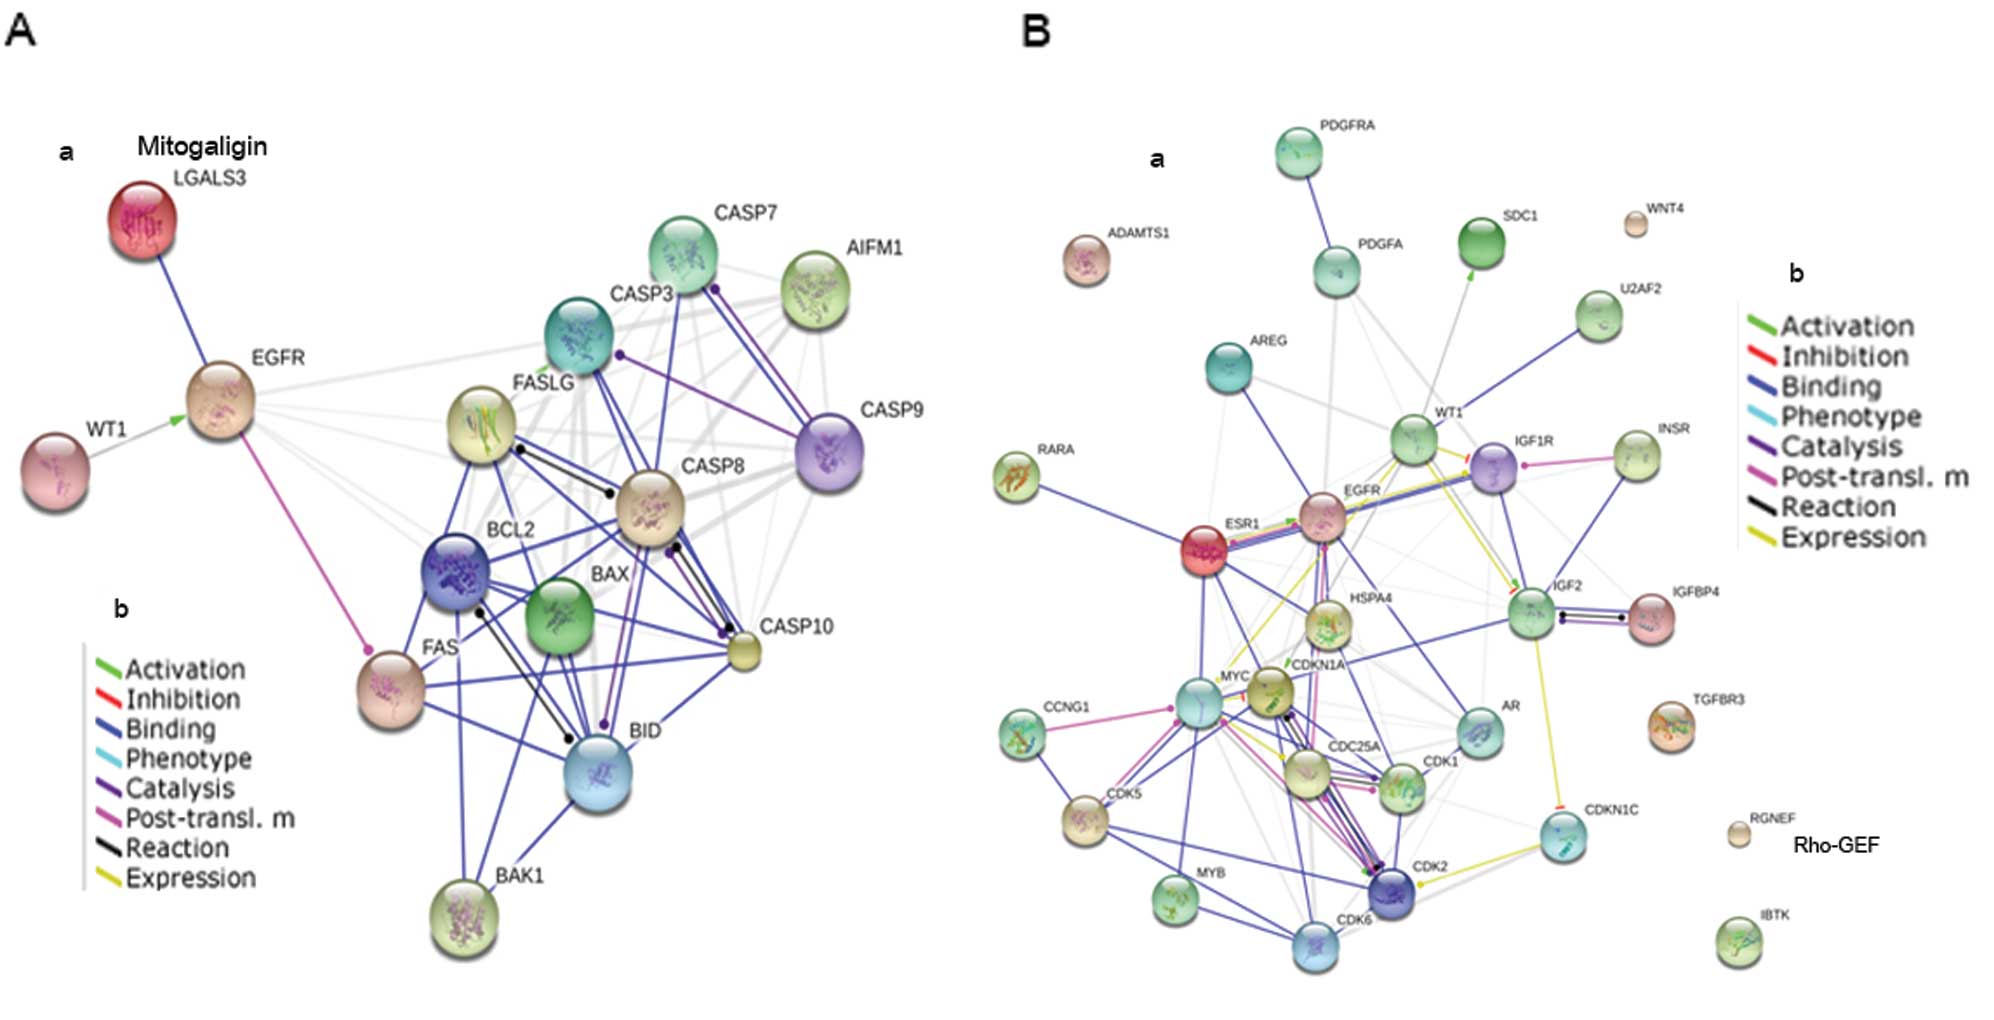 | Figure 3(A-a) The involvement of WT1 and
p53-independent apoptosis pathway in MDA-MB-468 (STRING 9.05). (b)
Modes of action are shown in different colors. The red circle shows
the proteins found in this study. (B-a) The involvement of WT1 and
proteins in signal transduction pathway in MDA-MB-468 (STRING
9.05). (b) Modes of action are shown in different colors. The red
circle shows the proteins found in this study. WT1, Wilms’ tumor 1;
BAK1, Bcl-2 homologous antagonist killer; BID, BH3 interacting
domain death agonist; FASLG, Fas ligand; BCL-2, B-cell lymphoma-2;
BAX, Bcl-2-associated X protein; LGALS3, mitogaligin; EGFR,
epidermal growth factor receptor; PDGFRA, platelet-derived growth
factor receptor α; RARA, retinoic acid receptor α; IBtK, inhibitor
of Bruton’s tyrosine kinase. |
WT1 interacts with many genes involved in the cell
signaling pathway. In the present study, the proteins involved in
the cell signaling pathway, platelet-derived growth factor receptor
α (PDGFRA) and Rho-GEF were found when WT1 was present in
MDA-MB-468, while SH2 domain-containing protein and IBtK were found
when the cell was without WT1. However, the STRING 9.05 showed that
these molecules were not associated with WT1 (Fig. 3B).
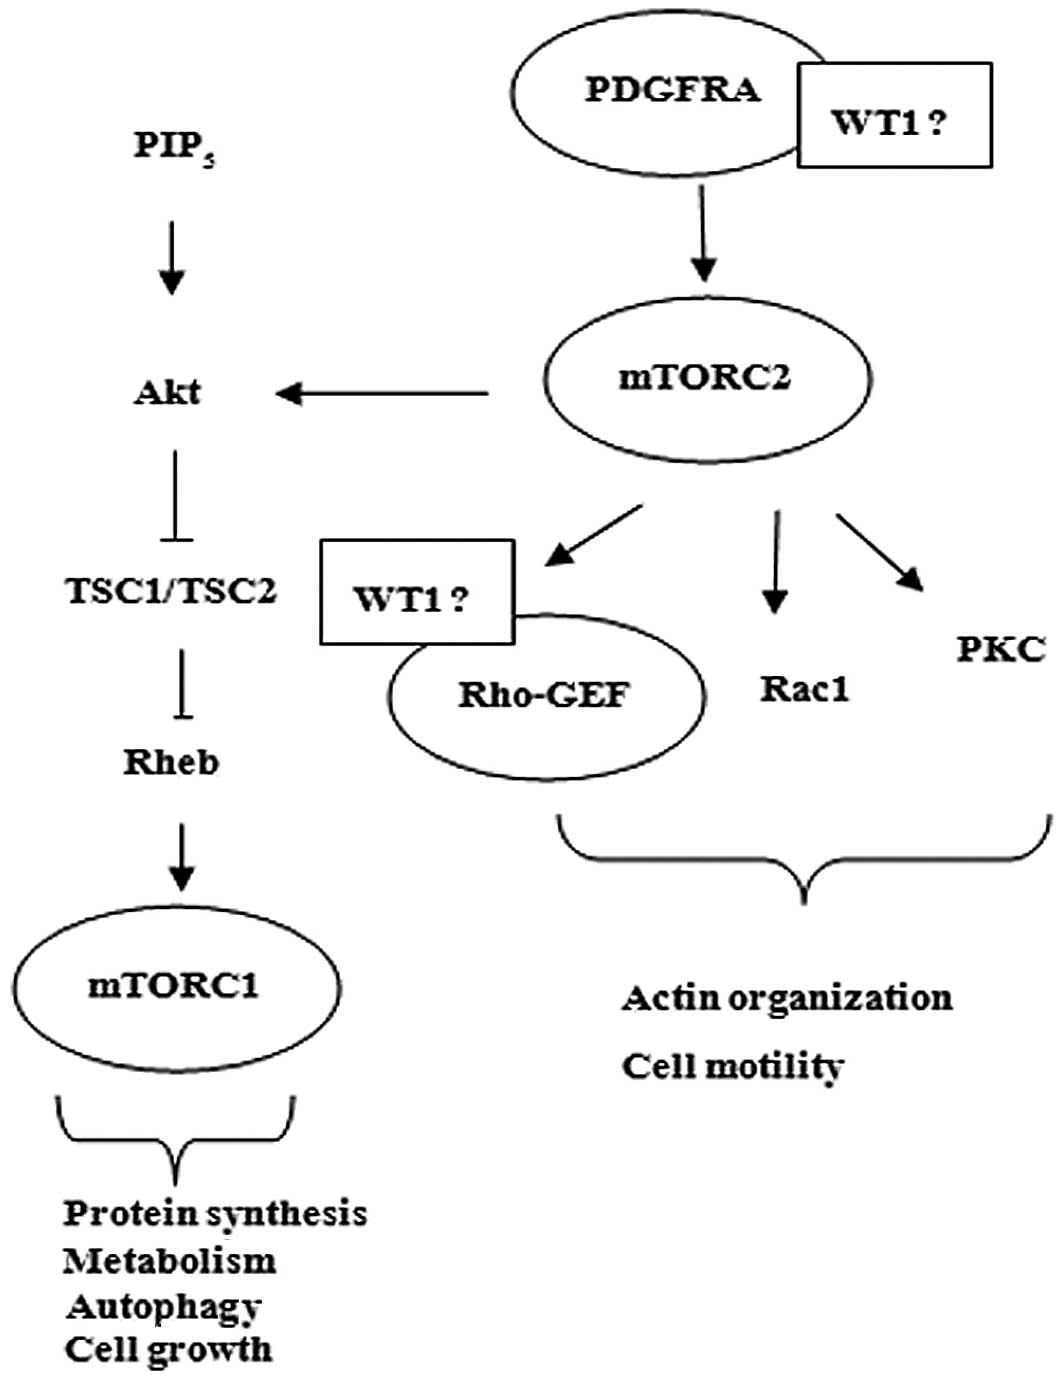
The signal transduction pathway in the MDA-MB-468
breast cancer cell line was related to the mTOR signaling pathway
that regulates cell growth, proliferation, differentiation and
survival (19). The mTOR protein
exists in two distinct complexes, mTOR complex 1 (mTORC1) and mTOR
complex 2 (mTORC2). mTORC1 contains the protein raptor while
mTORC2 contains the protein rictor. In the presence of
growth factors, activated Akt phosphorylates and inhibits tuberous
sclerosis protein 2 (Tsc2), thereby promoting the activation of
Rheb. Activated Rheb (Rheb-GTP) helps activate mTORC1, which in
turn stimulates cell growth. Furthermore, mTORC2 phosphorylates Akt
at Ser473 and regulates the actin cytoskeleton and cell motility
(20). Recently, Razmara et
al demonstrated that PDGFRs are essential for multiple growth
factor signaling pathways that lead to PI3K/Akt activation. The
pathway from PDGFR leads to phosphorylation of Akt which is
involved in both the mTORC2 and PLCγ/PKC pathways (21).
The WT1 protein has two nuclear localization
domains: within zinc fingers I and within zinc fingers II and III.
It is responsible for transcription and RNA processing (22). However, WT1 can be detected in the
cytoplasm of various cell lines including breast cancer and
shuttles the nucleus and the cytoplasm (23,24).
PDGFRA is a tyrosine-protein kinase that acts as a cell surface
receptor for PDGFA and plays a role in the regulation of cell
proliferation and survival (25).
Rho-GEF is an intracellular signaling molecule that regulates
cytoskeleton organization, gene expression, cell cycle progression,
cell motility and other cellular processes. It represents the
activating enzymes of Rho GTPases by serving to relay a variety of
signals to catalyze GDP/GTP exchange of specific Rho GTPases
(26).
WT1 may be related to PDGFRA leading to activation
of Akt/TSC1, TSC2/mTOR2 pathway resulting in cell growth. Moreover,
WT1 may also be associated with mTOR2/Rho-GEF resulting in cell
motility (Fig. 4).
Thus, WT1 plays an oncogenic role in MDA-MB-468.
Moreover, when WT1 was silenced with siRNAWT1, IBtK, SH2
domain-containing protein were upregulated. The relationship
between WT1 and these proteins in the signaling pathway in
MDA-MB-468 has not previously been elucidated. WT1 may behave as a
negative-regulator of IBtK that binds to SH2 domain of BtK tyrosine
kinase receptor resulting in IBtK inactivate leading to B-cell
differentiation (27).
References
|
1
|
Jemal A, Bray F, Center MM, Ferlay J, Ward
E and Forman D: Global cancer statistics. CA Cancer J Clin.
61:69–90. 2011. View Article : Google Scholar
|
|
2
|
Adami HO, Signorello LB and Trichopoulos
D: Towards an understanding of breast cancer etiology. Semin Cancer
Biol. 8:255–262. 1998. View Article : Google Scholar : PubMed/NCBI
|
|
3
|
Dumitrescu R and Cotarla I: Understanding
breast cancer risk - where do we stand in 2005? J Cell Mol Med.
9:208–221. 2005. View Article : Google Scholar : PubMed/NCBI
|
|
4
|
Gessler M, Poustka A, Cavenee W, Neve RL,
Orkin SH and Bruns GA: Homozygous deletion in Wilms tumours of a
zinc-finger gene identified by chromosome jumping. Nature.
343:774–778. 1990. View
Article : Google Scholar : PubMed/NCBI
|
|
5
|
Haber DA, Park S, Maheswaran S, et al:
WT1-mediated growth suppression of Wilms tumor cells expressing a
WT1 splicing variant. Science. 262:2057–2059. 1993. View Article : Google Scholar : PubMed/NCBI
|
|
6
|
Loeb DM, Evron E, Patel CB, et al: Wilms’
tumor suppressor gene (WT1) is expressed in primary breast
tumor despite tumor-specific promoter methylation. Cancer Res.
61:921–925. 2001.
|
|
7
|
Navakanit R, Graidist P, Leeanansaksiri W
and Dechsukum C: Growth inhibition of breast cancer cell line MCF-7
by siRNA silencing of Wilm tumor 1 gene. J Med Assoc Thai.
90:2416–2421. 2007.PubMed/NCBI
|
|
8
|
Miyoshi Y, Ando A, Egawa C, et al: High
expression of Wilms’ tumor suppressor gene predicts poor prognosis
in breast cancer patients. Clin Cancer Res. 8:1167–1171. 2002.
|
|
9
|
Oji Y, Miyoshi Y, Kiyotoh E, et al:
Absence of mutations in the Wilms’ tumor gene WT1 in primary
breast cancer. Jpn J Clin Oncol. 34:74–77. 2004.
|
|
10
|
Yang L, Han Y, Saurez Saiz F and Minden M:
A tumor suppressor and oncogene: the WT1 story. Leukemia.
21:868–876. 2007.PubMed/NCBI
|
|
11
|
Graidist P: The role of WT1 in breast and
other cancers: oncogene or tumor suppressor gene? Songkla Med J.
27:435–449. 2009.
|
|
12
|
Subik K, Lee JF, Baxter L, et al: The
expression patterns of ER, PR, HER2, CK5/6, EGFR, Ki-67 and AR by
immunohistochemical analysis in breast cancer cell lines. Breast
Cancer. 4:35–41. 2010.PubMed/NCBI
|
|
13
|
Filmus J, Pollak MN, Cailleau R and Buick
RN: MDA-468, a human breast cancer cell line with a high number of
epidermal growth factor (EGF) receptors, has an amplified EGF
receptor gene and is growth inhibited by EGF. Biochem Biophys Res
Commun. 128:898–905. 1985. View Article : Google Scholar
|
|
14
|
Armstrong DK, Kaufmann SH, Ottaviano YL,
Furuya Y, Buckley JA, Isaacs JT and Davidson NE: Epidermal growth
factor-mediated apoptosis of MDA-MB-468 human breast cancer cells.
Cancer Res. 54:5280–5283. 1994.PubMed/NCBI
|
|
15
|
Holiday LD and Speirs V: Choosing the
right cell line for breast cancer research. Breast Cancer Res.
13:2152011. View
Article : Google Scholar : PubMed/NCBI
|
|
16
|
Guittaut M, Charpentier S, Normand M,
Dubois J, Raimond J and Legrand A: Identification of an internal
gene to the human Galectin-3 gene with two different overlapping
reading frames that do not encode Galectin-3. J Biol Chem.
276:2652–2657. 2001. View Article : Google Scholar : PubMed/NCBI
|
|
17
|
Duneau M, Boyer-Guittaut P, Gonzalez P, et
al: Galig, a novel cell death gene that encodes a
mitochondrial protein promoting cytochrome c release. Exp
Cell Res. 302:194–205. 2005. View Article : Google Scholar
|
|
18
|
Robinet O, Mollet L, Gonzalez P, Normand
T, Charpentier S, Brulé F, et al: The mitogaligin protein is
addressed to the nucleus via a non-classical localization signal.
Biochem Biophys Res Commun. 392:53–57. 2010. View Article : Google Scholar : PubMed/NCBI
|
|
19
|
Yu K, Toral-Barza L, Discafani C, Zhang
WG, Skotnicki J, Frost P and Gibbons JJ: mTOR, a novel target in
breast cancer: the effect of CCI-779, an mTOR inhibitor, in
preclinical models of breast cancer. Endocr Relat Cancer.
8:249–258. 2001. View Article : Google Scholar : PubMed/NCBI
|
|
20
|
Zhou H and Huang S: mTOR signaling in
cancer cell motility and tumor metastasis. Crit Rev Eukaryot Gene
Expr. 20:1–16. 2010. View Article : Google Scholar : PubMed/NCBI
|
|
21
|
Razmara M, Heldin CH and Lennartsson J:
Platelet-derived growth factor-induced Akt phosphorylation requires
mTOR/Rictor and phospholipase C-γ1, whereas S6 phosphorylation
depends on mTOR/Raptor and phospholipase D. Cell Commun Signal.
11:32013.PubMed/NCBI
|
|
22
|
Bruening W, Moffett P, Chia S, Heinrich G
and Pelletier J: Identification of nuclear localization signals
within the zinc fingers of the WT1 tumor suppressor gene product.
FEBS Lett. 393:41–47. 1996. View Article : Google Scholar : PubMed/NCBI
|
|
23
|
Silberstein GB, Van Horn K, Strickland P,
Roberts CT Jr and Daniel CW: Altered expression of WT1 Wilms tumor
suppressor gene in human breast cancer. Proc Natl Acad Sci USA.
94:8132–8137. 1997. View Article : Google Scholar : PubMed/NCBI
|
|
24
|
Niksic M, Slight J, Sanford JR, Caceres FJ
and Hastie ND: The Wilms’ tumor protein (WT1) shuttles between
nucleus and cytoplasm and is present in functional polysomes. Hum
Mol Genet. 13:464–471. 2004.
|
|
25
|
Alberts B, Johnson A, Lewis J, Raff M,
Roberts K and Walter P: Molecular Biology of the Cell. 5th edition.
Garland Science; New York: 2008
|
|
26
|
Shang X, Marchioni F, Evelyn CR, et al:
Small-molecule inhibitors targeting G-protein-coupled Rho guanine
nucleotide exchange factors. Proc Natl Acad Sci USA. 110:3155–3160.
2013. View Article : Google Scholar : PubMed/NCBI
|
|
27
|
Janda E, Palmieri C, Pisano A, Pontoriero
M, Laccino E, Falcone C, et al: Btk regulation in human and mouse B
cells via protein kinase C phosphorylation of IBtkγ. Blood.
117:6520–6531. 2011.PubMed/NCBI
|