Introduction
An oral squamous cell carcinoma (OSCC) is a tumor
characterized by multiple multistep genetic alterations, that lead
to genomic instability and disordered cell growth due to oncogene
overexpression, subexpression of tumor-suppressor genes and other
genetic, epigenetic and microRNA alterations (1–5). The
two most studied oncogenes (dominant) in human solid tumors are
HER-2/neu and c-myc; while p53 is a tumor-suppressor gene involved
in almost all human malignancies (6).
Myc genes are a family of proto-oncogenes comprised
of several members (L-myc, N-myc and c-myc). Myc proteins are
involved in the regulation of cell proliferation, differentiation
and apoptosis, and in regulating the activity of genes involved in
cell division (7). Contrary to
classical theory, c-myc is also implicated in the control of
apoptotic phenomena, possibly leading to tumor regression depending
on cell type, cell interactions, extracellular matrix and
neighboring cells (3,8,9). The
c-myc protein acts as a transcription factor (10), and ectopic expression of this
protein is sufficient to induce the progression of the cell cycle.
c-myc is also related to a poor tumor prognosis (11–14) as
well as the self-renewal of tumor stem cells (15–18).
The aim of the present study was to establish a
quantitative description of the expression of c-myc and to evaluate
its relationship with clinical and prognostic factors of OSCC, as
well as to establish a multivariate survival prediction model.
Materials and methods
Patients
We performed an observational study on a cohort of
68 patients diagnosed with OSCC who were surgically treated at the
Maxillofacial Surgical Unit of the Santiago Teaching Hospital
(Hospital Clinico Universitario de Santiago), Galicia, Spain,
between January 2001 and March 2010. The inclusion criteria was
established according to the surgical treatment in compliance with
standard procedures, including resection of the primary tumor;
radical, selective ipsilateral or bilateral removal of the regional
lymph glands; clinical and pathological data and the availability
of sufficient paraffin-embedded material to construct matrices. The
clinical and pathological variables of each case included age,
gender, tumor location, tumor stage, smoking habits, drinking
habits, recurrence, dysplasia in the adjacent margin and vital
status (death, by any cause) until February 2011.
The sample consisted of 35 men (51.5%) and 33 women
(48.5%), with an age range from 41 to 96 years (average age,
67±13.08 years). Tumors were classified according to tumor stage at
the time of diagnosis in accordance with the 7th Edition of the
AJCC Cancer Staging Manual by the American Joint Committee on
Cancer (19). Informed consent for
use of the samples and data analysis were obtained from each
patient or caretaker.
Tissue microarray generation
Hematoxylin and eosin-stained (H&E) slides were
available for review in all cases. Paraffin blocks were selected on
the basis of the availability of suitable formalin-fixed,
paraffin-embedded tissue (at least 1-mm thick). For
characterization of immunohistochemical protein expression, we
constructed five different tissue arrays containing representative
areas of every tumor. After microscopic evaluation, two areas of
each tumor were selected, avoiding necrosis and keratin pools. Each
tissue array was assembled as previously described (20). Briefly, two 1.5-mm-diameter
cylinders of tissue were obtained from representative areas of each
archival paraffin block and arrayed into a new recipient paraffin
block with a custom-built precision instrument (Beecher
Instruments, Silver Spring, MD, USA). These tissues were fixed in
4% buffered formalin and were paraffin-embedded according to
routine procedures. Areas chosen for the cylinder core were
representative of the tumors. In addition, normal tonsil samples
were placed adjacent to the tumoral tissues to serve as internal
controls and to ensure the quality of staining in the slides.
Initial sections were stained with hematoxylin and eosin to verify
histopathologic findings.
Immunohistochemistry
Tissue sections (3-μm) from the TMA blocks were
sectioned and applied to special immunohistochemistry coated slides
(Dako, Glostrup, Denmark). Immunohistochemical analysis for c-myc
was performed using a monoclonal antibody (clone 9E11; Novocastra,
Newcastle, UK) with a concentration 1:100, according to the
manufacturer’s instructions. In brief, antigen retrieval was
performed for 10 min at 95–99°C in a water bath, with a citrate
buffer, pH 9.0. After blocking endogenous peroxidase activity, the
slides were incubated for 30 min with the c-myc antibody. A
secondary antibody reagent (polymer-based goat anti-mouse antibody
fragment conjugated to horseradish peroxidase) was applied for 30
min. After applying the chromogenic visualization step using the
3,3′-diaminobenzidine chromogen, slides were counterstained with
hematoxylin. Negative controls were performed using the negative
reagent control (isotype control antibody). Dysplasia was graded as
mild, moderate, severe and carcinoma ‘in situ’, according to
the criteria of the WHO (21).
Evaluation of immunohistochemical
results, image digitizing and semiquantitative analysis
Cases showing cytoplasmic or nuclear positivity for
c-myc were considered as positive. Slides were digitized using an
automated slide scanner to produce high-resolution images for
visual quantitative analysis using an ACIS® III
automatic image analysis system (Dako). The digital images of the
slides were captured by the ACIS scanner at low power
magnification, and the entire slide images were viewed on a
monitor. The regions with the highest immune percentage of positive
cells were selected for further automatic scoring. A minimum of
three of these areas containing only tumor cells was selected
manually for quantitative evaluation. The final score was the
average result of the different areas measured. To confirm the
accuracy of the measurements, selected areas from 10 of the
specimens were measured three times.
Statistical analysis
Qualitative variables are expressed as frequencies
and percentages; quantitative variables are expressed as means
(standard deviation) and ranges. The χ2 test or Fisher’s
exact test was used as required to compare the qualitative
variables. ANOVA or the Kruskal-Wallis test was used to contrast
quantitative and qualitative variables. An association was
considered statistically significant when the P-value was ≤0.05.
The Kaplan-Meier method/estimator and the Cox regression model were
used for evaluating survival in the study sample.
Initially, we carried out a univariate analysis in
which we studied the Kaplan-Meier curves of each of the
categorical/qualitative variables to assess if we detected
differences in the survival between the different groups or levels
of these variables. Subsequently, we adjusted the Cox regression
univariate models to assess the influence of each of the analyzed
variables on the survival prognosis.
A time-dependent multivariate Cox regression mode
was fitted to jointly evaluate the possible risk factors in terms
of survival. The recurrence of the patients was considered as the
time-dependent covariate. The predictive multivariate
analysis/model was performed using a stepwise procedure in terms of
the best (the lowest) Akaike Information Criterion (AIC) value. The
magnitude of the association between covariates and survival was
evaluated through hazard ratios (HR), together with their
corresponding 95% confidence intervals (CI). Taking censored
survival times into account, the log hazard ratios of the Cox model
were used as criterion variables Y, to construct time-dependent ROC
curves (22).
All statistical analyses were conducted using SPSS
Statistics 17.0 and R 2.15.0 (R Development Core Team, 2012), using
the survival package (for fitting parametric Cox regression
models), the survivalROC package (for computing time-dependent ROC
curves) and the censboot function (from the bootstrap package) for
bootstrapping survival models with censored observations. The
function stepAIC (from the MASS package) was also used for
obtaining the multivariate model with the best AIC. All these
packages are freely available at http://www.R-project.org.
Results
Clinical, anatomical and pathological
characteristics of the sample
The main clinical characteristics of the 68 patients
selected for the present study are documented in Table I. Tumors were classified into
initial stage (stages I and II), which accounted for 32 cases
(47.8%), and advanced stage (stages III and IV), which amounted to
36 cases (52.9%). More men were diagnosed in early tumor stages [21
(65.6%)], whereas women were found more frequently in advanced
stages at the time of initial diagnosis [22 (61.1%)]
(χ2=4.848, P<0.05).
 | Table IClinical characteristics of the OSCC
patients, c-myc expression and association of variables. |
Table I
Clinical characteristics of the OSCC
patients, c-myc expression and association of variables.
| Characteristics | Patients n (%) | N=53 c-myc mean
(SD) | P-value |
|---|
| Gender |
| Male | 35 (51.5) | 44.40 (25.56) | 0.092 |
| Female | 33 (48.5) | 56.47 (25.58) | |
| Exposure to
tobacco |
| Non-smoker
(never) | 32 (47.1) | 56.15 (5.00) | 0.05a |
| Former smoker
(>10 years) | 24 (35.3) | 52.43 (5.98) | |
| Current smoker (≥5
years) | 12 (17.6) | 32.69 (7.47) | |
| Exposure to
alcohol |
| Non-drinker | 33 (48.5) | 56.28 (25.32) | 0.206 |
| Not current
drinker | 13 (19.1) | 52.18 (26.06) | |
| Current drinker | 22 (32.4) | 42.03 (26.05) | |
| Primary location |
| Buccal mucosa | 6 (9) | 40.05 (11.45) | 0.208 |
| Gums | 17 (25.4) | 40.99 (26.53) | |
| Retromolar
trigone | 6 (9) | 57.80 (32.77) | |
| Tongue | 22 (32.8) | 57.13 (24.58) | |
| Floor of
mouth | 8 (11.9) | 39.77 (24.46) | |
| Soft palate | 8 (11.9) | 65.53 (25.38) | |
| T |
| T1 | 21 (30.9) | 56.00 (24.26) | 0.286 |
| T2 | 21 (30.9) | 41.87 (25.06) | |
| T3 | 4 (5.9) | 68.27 (11.00) | |
| T4 | 22 (32.4) | 50.11 (28.66) | |
| N |
| N0 | 55 (80.9) | 49.22 (27.21) | 0.462 |
| N1 | 7 (10.3) | 65.98 (12.44) | |
| N2 | 6 (8.8) | 47.52 (21.80) | |
| Clinical stage |
| I | 20 (29.4) | 56.01 (24.26) | 0.450 |
| II | 12 (17.6) | 42.06 (27.70) | |
| III | 9 (13.2) | 60.94 (20.13) | |
| IV | 27 (39.7) | 47.65 (27.54) | |
|
Differentiation |
| Good | 30 (44.1) | 51.06 (5.49) | 0.970 |
| Moderate | 30 (44.1) | 49.55 (5.24) | |
| Poor | 8 (11.8) | 50.45 (13.09) | |
| Recurrence |
| Yes | 29 (42.6) | 50.39 (25.87) | 0.979 |
| No | 39 (57.4) | 50.19 (1.56) | |
| Dysplasia in
margin |
| No | 38 (55.9) | 51.46 (1.29) | 0.822 |
| Low | 8 (11.8) | 40.55 (2.94) | |
| Moderate | 4 (5.9) | 49.35 (20.29) | |
| Severe | 1 (1.5) | 68.64 | |
| Carcinoma in
situ (CIS) | 17 (25) | 51.91 (27.91) | |
In terms of the relationship with exposure to
tobacco, no statistically significant differences in terms of
staging at the time of diagnosis (χ2=1.227, P=0.541)
were noted. In regards to alcohol, of the 22 cases exposed to the
carcinogen, 16 (72.7%) were diagnosed in early stages
(χ2=11.338, P<0.01).
The existence of dysplasia in the adjacent margin
was positive in 42.6% of cases; 34.4% of the tumors in initial
stages and 50% of the tumors in advanced stages
(χ2=2.176, P=0.337). The existence of CIS was slightly
higher in advanced stage tumors [9 (25%)] in contrast to 21.9%
found in initial cases, although the differences were not
statistically significant.
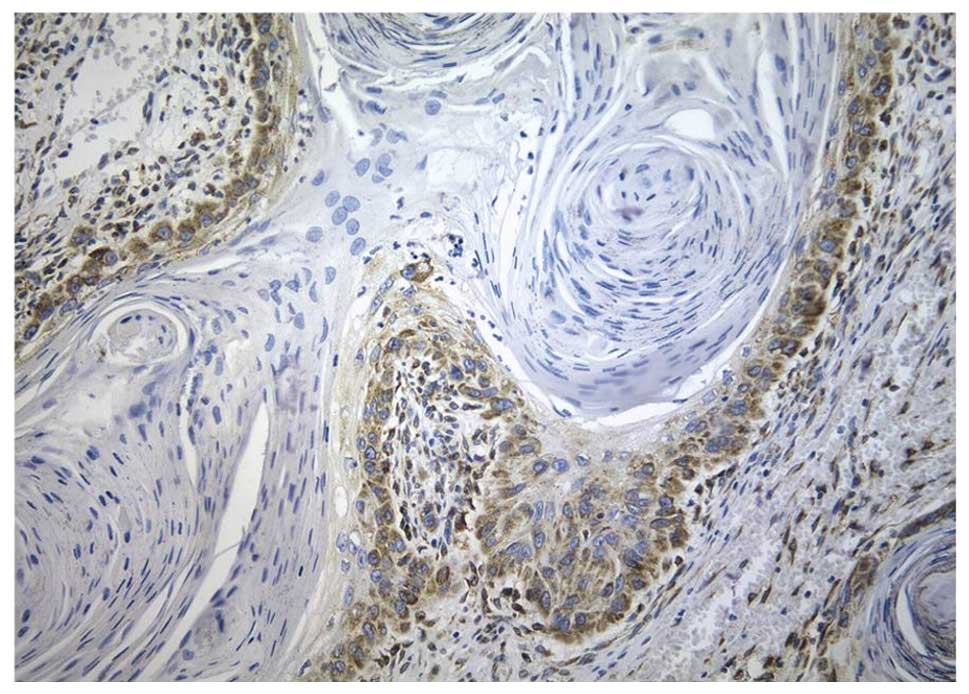
c-myc expression in OSCC
Immunohistochemistry showed both nuclear and
cytoplasmic staining in neoplastic cells, while in many cases, the
intensity was higher in the cytoplasm than that in the nuclei
(Fig. 1).
The average expression of c-myc (N=53) was 50.32
(SD, 26.05) with a range from 6.60 to 99.48; similar for the
initial stages [mean 50.77 (25.94)] and advanced stages [49.94
(26.59)] (F=0.013; P=0.909). Women showed higher levels [56.47
(25.58)] than men [44.40 (25.56)] although there were no
statistically significant differences (F=2.951; P=0.877). The
patients showed virtually similar values of c-myc in terms of the
degree of tumor differentiation (Kruskal-Wallis
χ2=0.062; P=0.970). Non-smoking patients had higher
levels of c-myc [56.15 (5.00)], showing statistically significant
differences (Kruskal-Wallis χ2=5.975; P=0.05). We found
no statistically significant relationship between the quantitative
expression of c-myc and any other clinical or pathological
parameters (Table I).
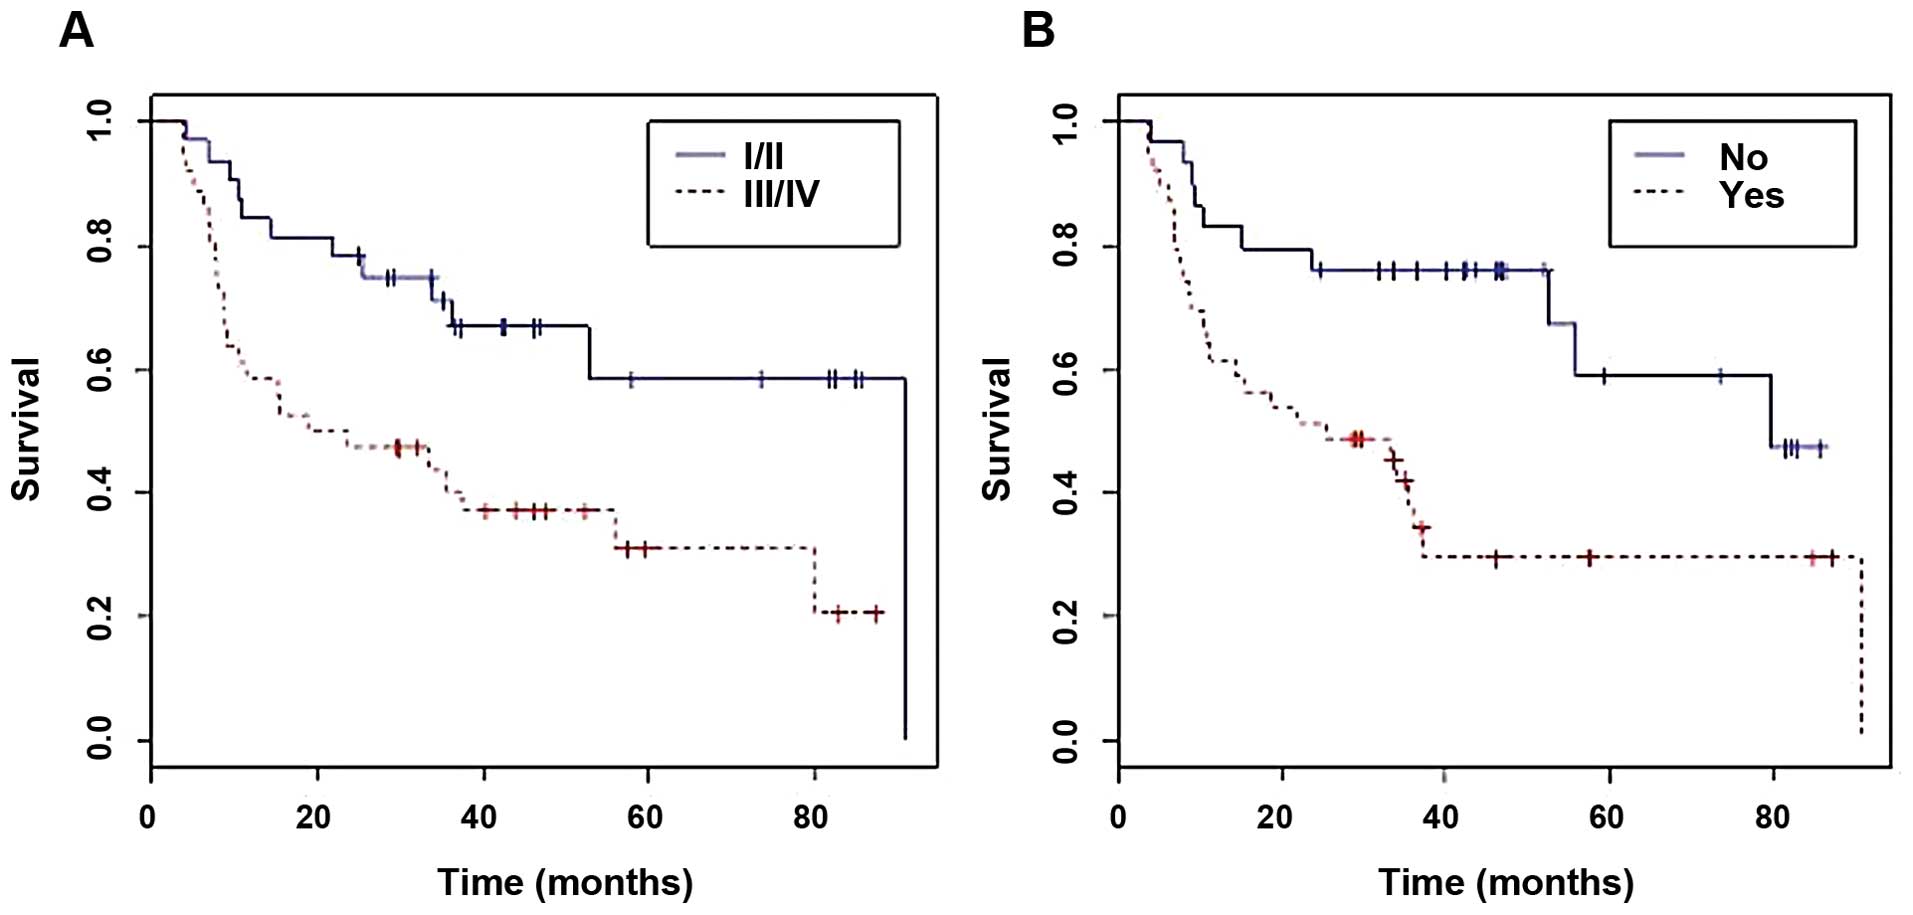
Survival and follow-up analysis
The average follow-up was 33.5 months (CI,
28.23–40.38). Of the 36 (52.9%) patients who died, 24 (66.7%) were
in the advanced stage group at the time of diagnosis
(χ2=5.785, P<0.05). The average survival of the
sample was 50.52 months (95% CI, 41.07–59.96); according to the
Kaplan-Meier curve, the cases at the initial stages had a higher
survival rate (40.72 months) than those in advanced stages (28.6
months) and the differences were statistically significant
(P<0.01) (Fig. 2A). Recurrence
occurred in 39 cases (57.4%) during the follow-up period,
regardless of the tumor stage at the time of diagnosis
(χ2=0.30, P=1.000). We detected statistically
significant differences in the survival of patients with recurrence
in contrast with those who did not relapse, showing a lower overall
survival rate in the recurrence group (P<0.01) (Fig. 2B). Survival was also statistically
significantly reduced in patients with any degree of dysplasia in
the adjacent margin, in contrast with those who did not have
dysplasia (P<0.05).
The Cox univariate regression analysis verified that
the effect of the value of c-myc alone was not statistically
significant (P=0.735). In a multivariate Cox analysis, however, the
multivariate with the lower ACI obtained included the covariates:
recurrence, c-myc, gender, location, differentiation, stage, size,
alcohol consumption, dysplasia in the adjacent margin, interaction
between c-myc and recurrence, and the interaction between gender
and stage (ACI=155.0655). All of the variables were statistically
significant, except for gender, stage and dysplasia in the adjacent
margin. Gender and stage were not significant, but their relevant
interactions were (Table II).
Using this model, we observed that patients with recurrence had a
8303.37-fold higher risk than those without recurrence (P<0.01;
HR, 8303.37; 95% CI, 34.30–2010000). For each unit of increase of
c-myc, the risk increased by 1.15 (P<0.001; HR, 1.150; 95% CI,
1062–1245). Patients with tumors located in the gum presented a
278.86-fold higher risk (P<0.001; HR, 278.86; 95% CI,
13.76–5653), followed by tumors in the tongue, with a risk of 16.24
(P<0.05; HR, 16.24; 95% CI, 1.37–193) when compared to tumors
located in the buccal mucosa. Patients with moderate
differentiation presented a risk 8.87-fold higher (P<0.01; HR,
8.87; 95% CI, 2.01–39.13) than those with well-differentiated
tumors. We found the same results for poorly differentiated tumors,
which showed a risk 7.48-fold higher (P<0.05; HR, 7.48; 95% CI,
1.06–52.73). In patients who were former drinkers, the risk
decreased by 0.02 (P<0.001; HR, 0.02; 95% CI, 0.02–0.19).
| Table IIFinal multivariate time-dependent Cox
model including the studied variables. |
Table II
Final multivariate time-dependent Cox
model including the studied variables.
| Variables | HR | 95% CI | P-value |
|---|
| Recurrence |
| No | 1 | | |
| Yes | 8303.372 | 34.30–2010000 | <0.01b |
| c-myc | 1.150 | 1.062–1.245 | <0.001c |
| Gender |
| Male | 1 | | |
| Female | 0.4011 | 0.4416–3.643 | <0.01b |
| Alcohol |
| No | 1 | | |
| Currently | 1.90617 | 0.3871–9.386 | 0.428 |
| Not currently | 0.02146 | 0.024–0.1927 | <0.001c |
| Tumor location |
| Buccal mucosa | 1 | | |
| Gums | 278.8612 | 13.76–5653 | <0.001c |
| Trigone | 1.3314 | 0.0581–30.51 | 0.858 |
| Tongue | 16.2401 | 1.367–193.0 | <0.05a |
| Floor of
mouth | 21.1731 | 0.5043–14.62 | 0.103 |
| Soft palate | 2.7970 | 0.1563–50.04 | 0.485 |
| Tumor size |
| T1 | 1 | | |
| T2 | 27.517 | 1.865–406.1 | <0.05a |
| T3 | 0.013 | 0.0002–0.6301 | <0.05a |
| T4 | 0.027 | 0.0121–0.6142 | <0.05a |
|
Differentiation |
| Good | 1 | | |
| Moderate | 8.8741 | 0.1563–50.04 | <0.01b |
| Poor | 7.4756 | 1.060–52.73 | <0.05a |
| Tumor stage |
| I/II | 1 | | |
| III/IV | 0.8587 | 0.5043–14.62 | 0.916 |
| Dysplasia in
adjacent margin |
| Without
dysplasia | 1 | | |
| Dysplasia | 2.6953 | 0.6047–12.01 | 0.194 |
| CIS | 0.3277 | 0.0542–1.981 | 0.224 |
| c-myc and
recurrence |
| No | 1 | | |
| Yes | 0.89792 | 0.8377–2221 | <0.01b |
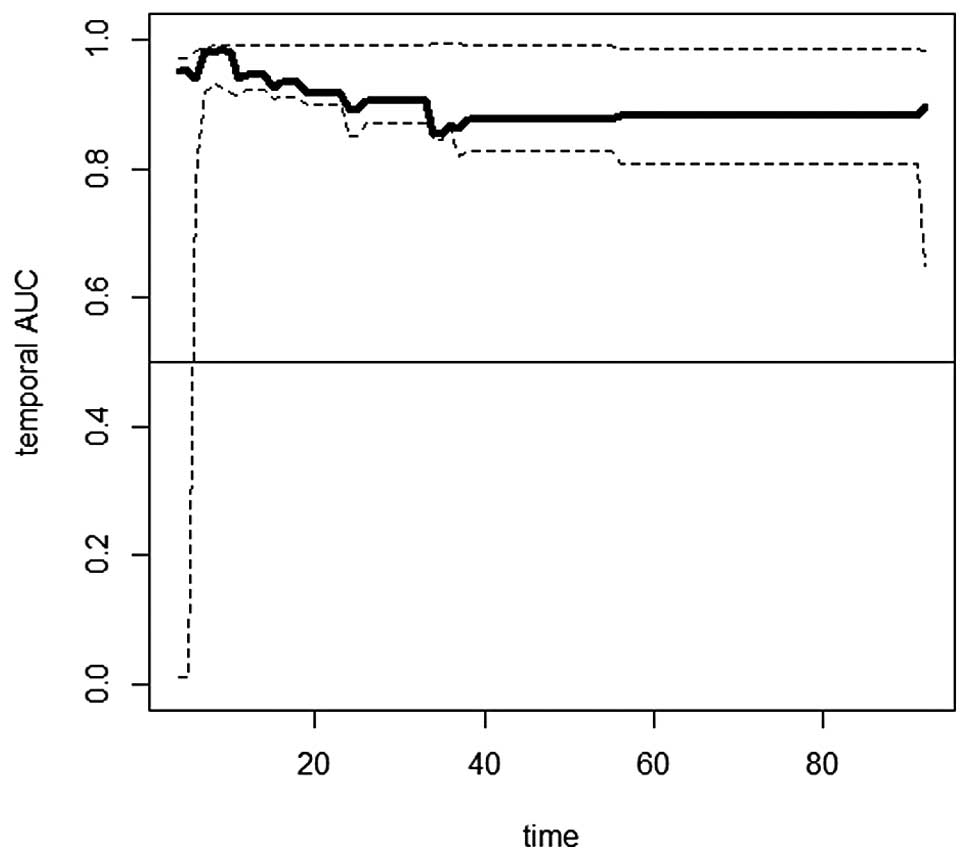
Temporary AUC showed an approximate mean value of
0.9 for the follow-up between 35 months and the end of the
follow-up period, which indicates a good discrimination capacity of
the Cox model (Fig. 3).
Discussion
The influence of c-myc in the carcinogenic process,
in general, has been previously described in many tumors. In the
specific case of oral tumors, Goessel et al (23) developed a cellular model of
oral-esophageal carginogenesis, in which cyclin D1 overexpression
and inactivation of p53 lead to the immortalization of
keratinocytes. Additionally, overexpression of ectopic epidermal
growth factor receptor (EGFR) and c-myc, and the resulting
malignant reactivation of telomerase induced by EGFR, are
sufficient for the malignant transformation of oral epithelial
cells. Thus, this demonstrated the importance of the overexpression
of this gene in OSCC (24,25).
Several studies have analyzed c-myc expression in
this type of tumor showing different results, with an average
positivity of 41.28% (2.4–75%) between the different studies
(6,26–34).
The results are extremely contradictory, as well as the variation
in the quantification methods. In the present study we effectively
developed a quantitative evaluation.
Shah et al (6) found a significantly higher expression
in T3/T4 tumors in comparison with T1/T2 tumors, although we were
unable to verify this fact in our research. On the other hand,
c-myc was correlated with tumor stage and lymphatic permeation,
while in our study the expression was practically the same. Rodrigo
et al (35) found no
relationship between c-myc overexpression and tumor prognosis,
similar to Hayry et al (33). Baral et al (27) found that tumors with positive p53
and c-myc were in the advanced stages of the disease (poorly
differentiated, stage III), while OSCCs in early stages did not
show positive immonoreactivity for p53 and c-myc.
Eversole and Sapp (36) studied c-myc levels in precancerous
lesions and early cancerous lesions, and found that, in cases of
dysplasia, in situ carcinoma and carcinoma, c-myc nuclear
tinting was dominant in all the strata harboring atypical cells and
the degree of tinting increased as the levels of atypia were
higher. Shah et al (30)
described an odds ratio (OR) of 6 in the transformation from
hyperplasia to dysplasia, for c-myc (+) lesions and an OR of 3 for
progressions beyond early stage carcinoma.
Vora et al (28), in a multivariate analysis, found
that c-myc multiexpression is a clear indicator of poor prognosis,
which can be used to evaluate specimens, paired with clinical
staging, to determine locally advanced tumors. However, Tsuzuki
et al (37), found no
correlation between c-myc and 5-year survival of patients with oral
and oropharangeal carcinomas. In our multivariate model, the
increase in c-myc levels was positively statistically correlated
with the risk of death.
The role of c-myc in carcinogenesis has been well
described; however, its relationship with OSCC and clinical and
pathological variables of tumors is not entirely clear. Thus,
further study of this protein, which may have significant
diagnostic, prognostic and therapeutic value is warranted. The
determination of c-myc can be valuable when used together with
other markers to assess the prognosis of OSCC patients.
References
|
1
|
Perez-Sayans M, Somoza-Martin JM,
Barros-Angueira F, Reboiras-Lopez MD, Gandara Rey JM and
Garcia-Garcia A: Genetic and molecular alterations associated with
oral squamous cell cancer (Review). Oncol Rep. 22:1277–1282. 2009.
View Article : Google Scholar : PubMed/NCBI
|
|
2
|
Choi S and Myers JN: Molecular
pathogenesis of oral squamous cell carcinoma: implications for
therapy. J Dent Res. 87:14–32. 2008. View Article : Google Scholar : PubMed/NCBI
|
|
3
|
Vairaktaris E, Spyridonidou S, Papakosta
V, et al: The hamster model of sequential oral oncogenesis. Oral
Oncol. 44:315–324. 2008. View Article : Google Scholar : PubMed/NCBI
|
|
4
|
Ginos MA, Page GP, Michalowicz BS, et al:
Identification of a gene expression signature associated with
recurrent disease in squamous cell carcinoma of the head and neck.
Cancer Res. 64:55–63. 2004. View Article : Google Scholar : PubMed/NCBI
|
|
5
|
Perez-Sayans M, Pilar GD, Barros-Angueira
F, Suarez-Penaranda JM, et al: Current trends in miRNAs and their
relationship with oral squamous cell carcinoma. J Oral Pathol Med.
41:433–443. 2012. View Article : Google Scholar : PubMed/NCBI
|
|
6
|
Shah NG, Trivedi TI, Tankshali RA, et al:
Prognostic significance of molecular markers in oral squamous cell
carcinoma: a multivariate analysis. Head Neck. 31:1544–1556. 2009.
View Article : Google Scholar : PubMed/NCBI
|
|
7
|
Gallant P and Steiger D: Myc’s secret life
without Max. Cell Cycle. 8:3848–3853. 2009.
|
|
8
|
Pelengaris S, Khan M and Evan G: c-MYC:
more than just a matter of life and death. Nat Rev Cancer.
2:764–776. 2002. View
Article : Google Scholar : PubMed/NCBI
|
|
9
|
Whyte DA, Broton CE and Shillitoe EJ: The
unexplained survival of cells in oral cancer: what is the role of
p53? J Oral Pathol Med. 31:125–133. 2002. View Article : Google Scholar : PubMed/NCBI
|
|
10
|
Lebofsky R and Walter JC: New
Myc-anisms for DNA replication and tumorigenesis? Cancer
Cell. 12:102–103. 2007.
|
|
11
|
Spandidos DA, Yiagnisis M, Papadimitriou K
and Field JK: ras, c-myc and c-erbB-2 oncoproteins in human breast
cancer. Anticancer Res. 9:1385–1393. 1989.PubMed/NCBI
|
|
12
|
Varley JM, Swallow JE, Brammar WJ,
Whittaker JL and Walker RA: Alterations to either c-erbB-2(neu) or
c-myc proto-oncogenes in breast carcinomas correlate with poor
short-term prognosis. Oncogene. 1:423–430. 1987.PubMed/NCBI
|
|
13
|
Riou GF: Proto-oncogenes and prognosis in
early carcinoma of the uterine cervix. Cancer Surv. 7:441–456.
1988.PubMed/NCBI
|
|
14
|
Field JK, Spandidos DA, Stell PM, Vaughan
ED, Evan GI and Moore JP: Elevated expression of the c-myc
oncoprotein correlates with poor prognosis in head and neck
squamous cell carcinoma. Oncogene. 4:1463–1468. 1989.PubMed/NCBI
|
|
15
|
Nakagawa M, Takizawa N, Narita M, Ichisaka
T and Yamanaka S: Promotion of direct reprogramming by
transformation-deficient Myc. Proc Natl Acad Sci USA.
107:14152–14157. 2010. View Article : Google Scholar : PubMed/NCBI
|
|
16
|
Adams JM, Kelly PN, Dakic A, Carotta S,
Nutt SL and Strasser A: Role of ‘cancer stem cells’ and cell
survival in tumor development and maintenance. Cold Spring Harb
Symp Quant Biol. 73:451–459. 2008.
|
|
17
|
Eilers M and Eisenman RN: Myc’s broad
reach. Genes Dev. 22:2755–2766. 2008.
|
|
18
|
Nair SK and Burley SK: Structural aspects
of interactions within the Myc/Max/Mad network. Curr Top Microbiol
Immunol. 302:123–143. 2006.PubMed/NCBI
|
|
19
|
American Joint Committee on Cancer. Lip
and oral cavity. Cancer Staging Manual. Edge SB, Fritz AG, Byrd DR,
Greene FL, Trotti A III and Compton CC: 7th edition. Springer; New
York: pp. 1–4. 2010
|
|
20
|
Kononen J, Bubendorf L, Kallioniemi A, et
al: Tissue microarrays for high-throughput molecular profiling of
tumor specimens. Nat Med. 4:844–847. 1998. View Article : Google Scholar : PubMed/NCBI
|
|
21
|
World Health Organization Classification
of Tumours. Head and Neck Tumors. Pathology and Genetics. Barnes L,
Eveson JW, Reichart P and Sidransky D: 9 edition. IARC Press; Lyon:
pp. 177–180. 2005
|
|
22
|
Heagerty PJ, Lumley T and Pepe MS:
Time-dependent ROC curves for censored survival data and a
diagnostic marker. Biometrics. 56:337–344. 2000. View Article : Google Scholar : PubMed/NCBI
|
|
23
|
Goessel G, Quante M, Hahn WC, et al:
Creating oral squamous cancer cells: a cellular model of
oral-esophageal carcinogenesis. Proc Natl Acad Sci USA.
102:15599–15604. 2005. View Article : Google Scholar : PubMed/NCBI
|
|
24
|
Foster KW, Ren S, Louro ID, et al:
Oncogene expression cloning by retroviral transduction of
adenovirus E1A-immortalized rat kidney RK3E cells: transformation
of a host with epithelial features by c-MYC and the zinc finger
protein GKLF. Cell Growth Differ. 10:423–434. 1999.
|
|
25
|
Perez-Sayans M, Suarez-Penaranda JM, Pilar
GD, Barros-Angueira F, Gandara-Rey JM and Garcia-Garcia A: What
real influence does the proto-oncogene c-myc have in OSCC behavior?
Oral Oncol. 47:688–692. 2011. View Article : Google Scholar : PubMed/NCBI
|
|
26
|
Freier K, Bosch FX, Flechtenmacher C, et
al: Distinct site-specific oncoprotein overexpression in head and
neck squamous cell carcinoma: a tissue microarray analysis.
Anticancer Res. 23:3971–3977. 2003.PubMed/NCBI
|
|
27
|
Baral R, Patnaik S and Das BR:
Co-overexpression of p53 and c-myc proteins linked with advanced
stages of betel- and tobacco-related oral squamous cell carcinomas
from eastern India. Eur J Oral Sci. 106:907–913. 1998. View Article : Google Scholar : PubMed/NCBI
|
|
28
|
Vora HH, Shah NG, Patel DD, Trivedi TI and
Chikhlikar PR: Prognostic significance of biomarkers in squamous
cell carcinoma of the tongue: multivariate analysis. J Surg Oncol.
82:34–50. 2003. View Article : Google Scholar : PubMed/NCBI
|
|
29
|
Takes RP, Baatenburg de Jong RJ, Schuuring
E, Litvinov SV, Hermans J and Van Krieken JH: Differences in
expression of oncogenes and tumor suppressor genes in different
sites of head and neck squamous cell. Anticancer Res. 18:4793–4800.
1998.PubMed/NCBI
|
|
30
|
Shah NG, Trivedi TI, Tankshali RA, et al:
Molecular alterations in oral carcinogenesis: significant risk
predictors in malignant transformation and tumor progression. Int J
Biol Markers. 22:132–143. 2007.PubMed/NCBI
|
|
31
|
Martin-Ezquerra G, Salgado R, Toll A, et
al: Multiple genetic copy number alterations in oral squamous cell
carcinoma: study of MYC, TP53, CCDN1,
EGFR and ERBB2 status in primary and metastatic
tumours. Br J Dermatol. 163:1028–1035. 2010. View Article : Google Scholar : PubMed/NCBI
|
|
32
|
Fujieda S, Inuzuka M, Tanaka N, et al:
Expression of p27 is associated with Bax expression and spontaneous
apoptosis in oral and oropharyngeal carcinoma. Int J Cancer.
84:315–320. 1999. View Article : Google Scholar : PubMed/NCBI
|
|
33
|
Hayry V, Makinen LK, Atula T, et al: Bmi-1
expression predicts prognosis in squamous cell carcinoma of the
tongue. Br J Cancer. 102:892–897. 2010. View Article : Google Scholar : PubMed/NCBI
|
|
34
|
Takes RP, Baatenburg de Jong RJ, Wijffels
K, et al: Expression of genetic markers in lymph node metastases
compared with their primary tumours in head and neck cancer. J
Pathol. 194:298–302. 2001. View Article : Google Scholar : PubMed/NCBI
|
|
35
|
Rodrigo JP, Lazo PS, Ramos S, Alvarez I
and Suarez C: MYC amplification in squamous cell carcinomas of the
head and neck. Arch Otolaryngol Head Neck Surg. 122:504–507. 1996.
View Article : Google Scholar : PubMed/NCBI
|
|
36
|
Eversole LR and Sapp JP: c-myc oncoprotein
expression in oral precancerous and early cancerous lesions. Eur J
Cancer B Oral Oncol. 29B:131–135. 1993. View Article : Google Scholar : PubMed/NCBI
|
|
37
|
Tsuzuki H, Sunaga H, Ito T, Narita N,
Sugimoto C and Fujieda S: Reliability of platelet-derived
endothelial cell growth factor as a prognostic factor for oral and
oropharyngeal carcinomas. Arch Otolaryngol Head Neck Surg.
131:1071–1078. 2005. View Article : Google Scholar : PubMed/NCBI
|