Introduction
Breast cancer is a common cancer in women. It has a
significant impact on the mental and physical health of females and
it is also life-threatening. Due to the rapid societal and
environment changes in China (i.e., increase in life expectancy and
dietary structure or habit), the incidence of breast cancer in
China has exhibited a yearly upward trend. The occurrence of breast
cancer is the result of numerous factors, such as the activation of
oncogenes and inactivation or reduced activity of tumor-suppressor
genes, which trigger signal transduction pathway activation,
leading to abnormal cell proliferation, abnormal apoptosis and
abnormal structure, as well as expression of cell adhesion
molecules. As a result, these factors promote tumor occurrence and
development.
To date, many genes have been found to be associated
with tumor carcinogenesis, such as ras, myc,
sis, p53 and Rb. Ras is a small GTPase, that
plays an important role in diverse cellular reactions, particularly
in the process of tumor genesis (1). The human R-Ras gene is isolated
by low-stringency hybridization with a v-H-ras probe, and it
is located on chromosome 19q13.3 (2). As a member of the Ras superfamily of
small GTPases, R-Ras plays a molecular switching role in cell
signaling. The two interconvertible forms, GDP-bound inactive and
GTP-bound active forms, transduce upstream signals to downstream
effectors (3–5).
As it was originally cloned through its homologous
H-Ras, the R-Ras protein has 55% similarity to H-Ras
(2). R-Ras has close sequence
similarities, and an almost identical effector-binding region to
H-, N- and K-Ras (6), and has
common Ras effectors, including RalGDS and PI3-kinase (7). The R-Ras protein has 26 amino acids in
its N- terminal, thus R-Ras has distinct cellular functions from
other analogous Ras members.
R-Ras is an important molecule. R-Ras was found to
regulate the apoptotic response in hematopoietic 32D.3 cells. R-Ras
(38V) inhibits BCL-2-mediated apoptotic cell death (8,9). In
addition to its distinct functions, R-Ras affects integrin
activation by controlling the ligand-binding activity of integrins.
R-Ras activates integrins, resulting in increased cell adhesion and
matrix assembly (10,11). For example, active R-Ras (38V)
promotes the formation of focal adhesion and a spread cell shape
(12). A proline rich site is
required for controlling cell adhesion (13,14).
Dominant active R-Ras promotes neurite outgrowth of late embryonic
retinal neurons; R-Ras inactivation is required to induce growth
cone collapse (15). It was shown
that R-Ras is essential for axon specification and neuronal
polarization in hippocampal neurons, thus it is also implicated in
the promotion of neurite outgrowth. The role of R-Ras has also been
identified as an important regulator of vascular regeneration in
vivo (16). In a study by
Komatsu et al, R-ras gene disruption in mice rendered
these animals susceptible to the excessive proliferative response
of neointimal smooth muscle cells to acute arterial injury
(16). Although R-Ras promotes
normalization of tumor vasculature (17–19),
it is a small GTPase of the Ras family that can perform multiple
functions including the regulation of cell apoptotic and integrin
activity, cell motility, neural synaptic plasticity and vascular
regeneration.
Transforming growth factor-β (TGF-β) was found to
cooperate with R-Ras to promote murine EpH4 cell transformation and
tumor progression (21), and R-Ras
also reportedly induced a more invasive phenotype in breast
epithelial cells through integrin. In addition, R-Ras activation
was found to disrupt the polarized differentiation of breast
epithelial cells through collagen (22). R-Ras promotes estrogen-independent
growth when EGF receptor family members are not involved in breast
cancer cells. Research has found that p130 (Cas) regulates the
activity of AND-34 to control R-Ras-GTPases that may participate in
the progression of breast cancer cells to tamoxifen resistance
(23). R-Ras and BCAR3 regulate the
level of IRS-1 protein in estrogen-dependent MCF-7 and ZR75 breast
cancer cells. The expression of a constitutively activated R-Ras
mutant, R-Ras38V or of BCAR3 accelerates the degradation of IRS-1
leading to the impairment of signaling. Both R-Ras38V expression
and estrogen signaling blockade lead to the degradation of IRS-1
(24); however, the transforming
properties of R-Ras remain under investigation, and are partially
dependent on the specific cell in question.
Although R-Ras has been suggested to function in
breast cancer cell lines, its main mechanisms remain unclear. The
level of R-Ras expression and its activity level in breast cancer
in particular have not yet been reported. Thus, the present study
was designed to explore the role of R-Ras in breast cancer. The
overall objective of the present study was to investigate and
better understand the association between R-Ras activity and breast
cancer development. The detailed description of our experimental
procedures and results are reported in the following sections of
the present study.
Materials and methods
Testing materials
In this in vitro study, our testing materials
were selected from two sources. The first included available
cancer-related cell lines. A total of 12 different types of cell
lines were selected. Among them, MCF-10A is a normal breast cell
line, while MCF-7, T47D, MDA-MB-453, MDA-MB-435S, BT474, ZR-75-30,
SK-BR-3, Hs578T, MDA-MB-231, Bcap37 and BT549 are mammary carcinoma
cells. These cells were a gift from the Laboratory of Tumor
Molecular Cell Biology, Harbin Institute of Technology University.
MCF 10A (ATCC CRL no. 10317), MCF-7 (ATCC HTB no. 22), MDA-MB-231
(ATCC HTB no. 26), MDA-MB-453 (ATCC HTB no. 131), MDA-MB-453S (ATCC
HTB no. 129), BT-474 (ATCC HTB no. 20), ZR-75-30 (ATCC CRL no.
1504), SK-BR-3 (ATCC HTB no. 30), Hs578T (ATCC HTB no. 126), BT-549
(ATCC HTB no. 122) were purchased from the American Type Culture
Collection. BCap37 was purchased from the Cell Bank of the Chinese
Academy of Science (32). The cells
were grown in Dulbecco’s modified Eagle’s medium (DMEM; Gibco-BRL,
Grand Island, NY, USA) supplemented with 10% heat-inactivated fetal
bovine serum (FBS; Gibco-BRL) and 20 μM glutamine.
The second source consisted of tissue samples
selected from resected breast tumors. The tissue samples were
acquired from 69 breast cancer patients who underwent breast
surgery at Mudanjiang Cancer Hospital, China. From each resected
breast region of one patient, one pair of tissues was acquired.
This included one malignant tissue sample acquired inside the
confirmed cancer tumor and one negative (normal) breast tissue
sample located outside the tumor region. All of the tumor tissues
were obtained at primary resection, and the adjacent non-tumor
tissue was removed at least 5 cm from the tumor border. These
samples were immediately transferred to liquid nitrogen. Histologic
diagnosis was carried out by standard evaluation. The
classification of the human breast tumors used in the present study
was based on the revised World Health Organization criteria for
tumors. As a result, our breast tissue testing dataset included 69
pairs of malignant and normal breast tissue samples acquired from
69 cancer patients.
In this testing dataset, the patient ages ranged
from 29 to 74 years with an average age of 45.38 years. The
clinicopathological data indicated that the majority of the 64
patients presented with infiltrative ductal carcinoma, while the
remaining 5 women had other types of cancers including infiltrative
lobular carcinoma (1 case), mucinous carcinoma (1 case), medullary
carcinoma (2 cases) and intraductal carcinoma (1 case). Among the
patients, 42 did not have lymph node metastasis, while 27 had lymph
node metastasis. The measured resected tumor sizes varied in these
patients. Among them, 21 tumors had a measured diameter <2 cm
and 48 tumors had a diameter >2 cm. The histologic tests showed
that 53 tumors had histologic grades 1–2 and 16 had histologic
grades 2–3. None of the patients had been subjected to chemotherapy
or radiation therapy prior to tumor resection. There were no
pre-selection requirements except that the tumor diameter exceeded
1 cm in size, as this was more likely to provide sufficient study
material. The same tissue was divided into three parts for use in
the western immunoblot analysis, qPT-PCR and GST pull down assay.
We then selected a set of antibodies and reagents for this study.
These included: i) rabbit anti-R-Ras antibodies produced by Santa
Cruz Biotechnology (Santa Cruz, CA, USA); ii) monoclonal mouse
monoclonal anti-GAPDH antibody from the Protein Tech Group; and
iii) the Glutathione Sepharose™4B (Amersham Biosciences) RNA
extraction kits and reverse transcription kits from Tiangen Biotech
Co., Ltd. (Beijing, China). The PCR primers were designed using
Beacon Designer and synthesized by Beijing SBS Genetech Co., Ltd.
(Beijing, China). Custom-made Hot-Start Master mixture for
quantitative PCR was also obtained from Abgene (Takara-Applied
Biosystems, Shiga, Japan).
Ethics statement
All of the cell line studies and the tissue
collection protocol were carried out in strict accordance with the
Helsinki Declaration and the International Ethical Guidelines for
Biomedical Research involving Human Subjects. All patients signed
an informed consent in regards to surgical removal, tumor therapy
and the use of the residual material. Concerning the present study,
the Mudanjiang Medical University Ethics Committee reviewed and
approved conduction of this research.
Methods
Cell transfection
The cells were first transfected using the cationic
liposome method with 4 μg of plasmid for each culture dish. After
transfection, the cells were cultured in OPTI-MEM for 48 h. The
medium was then replaced with fresh medium containing 0.6 mg/ml
geneticin (G418; Gibco-BRL), and the cultured cells were
continually selected for stable transfectants. Up to resistance
clone formation, the cells were subcultured until enough cells were
obtained for subsequent experiments. The cells were always
maintained in medium with G418 substance. The R-Ras-GTP protein and
R-Ras protein were constantly expressed. All clones expressed the
R-Ras mutant protein at similar levels, as indicated by western
blot analysis.
Testing and data analysis methods
In order to avoid or minimize the potential bias of
the experimental results, we applied six testing methods in the
present study to cross-validate the experimental results and
increase data analysis power. Five were used in cell line tests and
three were applied in tumor sample tests. Following are the brief
description of each testing method.
Cell proliferation ability
After transfection, the first testing method was
assessment of cell proliferation ability. MCF-7 cells in a
logarithmic growth phase were suspended in RPMI-1640 containing 10%
fetal bovine serum (FBS). The cells were inoculated in 24-well
plates, with ~1×10⁴ cells in each plate. After the cells
had grown for 24 h, and had adhered to the plate, the cells were
treated with replaced serum-free medium. After cultural
synchronization for 24 h, the cells were treated with 1% FBS
medium. The medium was replaced every two days.
Cell counts were then performed from two replicate
wells on day 1, 4, 7 and 10, respectively; at the same time the
living cells were confirmed by trypan blue staining. The repeated
test mean data was input into GraphPad Prism.5.0, and a chart for
the growth curve was plotted.
Cell cycle analysis
After the MCF-7 cells stably expressed pcDNA3.1,
pcDNA-R-Ras or pcDNA-R-Ras38V, the cell cycle stages were
determined by the second testing method using flow cytometric
analysis. The cells were cultured at 37°C with 5% CO2 in
DMEM containing 10% FCS. For convergence at a rate of ~80%, the
cells were digested by trypsin, and made into a suspension. Then,
the cells were centrifuged at 1,500 rpm for 5 min at 4°C. The
supernatant was discarded, and the cells were resuspended in PBS
buffer. After the mixture was repeatedly centrifuged, we discarded
the supernatant. The cells were resuspended in 70% ethanol (−20°C)
and stored at −20°C for at least 12 h. Once the above processes
were completed, we repeated centrifugation of the cells and washed
them twice with cold PBS. Cells were then stained with propidium
iodide (PI) staining solution, which was constructed by adding
three chemical components [10 ml of 0.1% NP-40, 1 mg DNase-free
RNase (Sigma) and 500 μg/ml PI] into 0.1% PBS. After the stained
cells were store at −20°C away from light for ~15 min, the cells
were centrifuged at 1,500 rpm for 5 min at 4°C, for removal of PI.
The processed cells were then resuspended in 500 μl PBS buffer and
were ready for flow cytometry. After this cell preparation process,
we used a flow cytometry device to acquire and record the cell
signal spectrum data.
Cell migration assay
The preprocessed and cultured cells were also
transfected and plated on dishes. We then conducted the third test
based on a cell migration assay. After convergence at a rate of
~80%, the cells were treated only with serum for 16 h. The cells
were trypsinized, followed by termination digestion using serum
containing DMEM. The cells were completely formed into a
single-cell suspension at a concentration at 5×10⁵/ml.
After the cells were spread on the bottom of Transwells coated with
collagen I at 37°C in 5% CO2 and stored for 20 h, we
scratched the cell monolayers with a pipette tip. The Transwells
were then placed in methanol for 5 min and finally stained using 1%
crystal violet for 2 min. The cells that had migrated to the lower
side of the Transwells were visually counted with a microscope
using an objective lens at ×20 magnification.
The above three testing methods were applied only to
the cell lines. The following two methods were applied to both cell
lines and tumor specimens.
Western immunoblot analysis
The fourth testing method was western immunoblot
analysis. For tumor specimen processing, we extracted a 150 mg
specimen from each case. It was crushed in liquid nitrogen and
lysed on ice for 10 min in lysis buffer containing 50 mM Tris pH
7.6, 2.5 mM MgCl2, 10 mM NaF, 1% Triton X-100 and 10%
glycerol by adding 1 mM PMSF, 1 μM pepstatin, 0.2 μM aprotinin and
4 μM leupeptin (Sigma). The cell lines were lysed using the same
buffer. Protein concentrations inside the lysis buffer were
initially measured by NanoDrop 2000. Then, by adaptively adjusting
the lysis buffer concentration level, we obtained the equivalent
amounts of protein for all testing samples. Finally, we extracted a
100 μg sample from the lysates of each case prepared for western
blot analysis, while the rest were used for the fifth testing
method, the GST-pull down assay (as discussed in the next
paragraph). In the western blot analysis, the samples were
resuspended in 2X loading buffer (mixed with 50 mmol/l Tris-HCl, pH
6.8, 10% sodium dodecyl sulfate, 10% glycerol, 0.001% bromophenol
blue), and then denatured with 2-mercaptoethanol (Sigma). In order
to perform western blot analysis for R-Ras from the available
samples, 15 μg of protein was separated by 12% sodium dodecyl
sulfate (SDS)-polyacrylamide gel electrophoresis. The bands were
then electrically transferred onto PVDF membranes (Millipore) using
Semi-Dry Trans-Blot Cell (Bio-Rad Laboratories, Hercules, CA, USA).
Finally, protein loading was controlled by blotting the same
membrane with an anti-GAPDH antibody.
GST-pull down assay
The fifth testing method, a GST-pull down assay, was
also applied to the cell lines and the tumor specimens. This
technique requires multiple steps for preprocessing the testing
materials. The first step is to produce the induced protein using
the following processes. i) GST-RaLGDS-RBD vectors were transformed
into BL21 bacteria. ii) BL21 (DE3) E. coli were individually
transformed with the expression vectors and grown overnight at 37°C
on Luria-Bertani broth (LB)-agar plates with 100 μg/ml ampicillin.
iii) Approximately 1 colony was transferred into 5 ml LB broth with
100 μg/ml ampicillin and grown at 37°C overnight. iv) Bacterial LB
broth (1 ml) was transferred into 100 ml LB broth with 100 μg/ml
ampicillin and grown at 37°C for 3–4 h to a bacterial density of
0.5–0.6 absorbance units at 600 nm. v) The transformed bacteria
were cultured in LB broth with the addition of 0.5 mM of IPTG to
induce GST-fusion protein expression at 30°C for 3 h. vi) The
bacterial cells expressing the fusion proteins were finally
collected by centrifugation and placed into tubes that were quickly
frozen at −20°C.
The second step was to bind the induced protein and
beads using the following processes. i) The beads were resuspended
in buffer mixed with (pH 7.6): 50 mM Tris, 2.5 mM MgCl2,
10 mM NaF, 1% Triton X-100, 10% glycerol, 1 mM of
phenylmethylsulfonyl fluoride (PMSF) (Sigma) at 4°C. ii) The
bacterial mixture was then lysed using a sonicator at a 100 W
setting ‘4’ with 12 bursts of 3 sec at 4°C. The lysates were
cleared by centrifugation at 8,000 × g for 20 min. iii) The
GST-fusion proteins were purified by 0.2 ml columns of Glutathione
Sepharose 4B beads (Amersham Biosciences). The beads were then
suspended by rotating at 4°C for 3 h. The affinity columns were
rinsed 5 times with 0.75 ml of washing buffer (consisting of pH
7.6; 50 mM Tris, 2.5 mM MgCl2, 10 mM NaF, 1% Triton
X-100 and 10% glycerol). The third step was to bind the tissue
sample and the beads processed in the second step. Specifically,
every 0.4 ml of tissue extracts from the samples that were
described in the western blot analysis were mixed with 50 μl of the
beads. We also performed suspension by rotating the final mixture
at 4°C for 1 h. After the beads were washed for three times in the
same washing buffer and boiled in 1X SDS loading buffer, the
GST-proteins were collected by centrifugation. The pull-down
samples were also tested using western blot analysis for
R-RasGTPase.
Quantitative RT-PCR
Our final (sixth) testing method was only applied to
the tumor tissue samples. The sixth testing method used a
quantitative RT-PCR method in which total RNA extraction from the
tissue specimens was performed according to the instruction manual
by Tiangen Biochemical Technology. The RNA quality was evaluated by
electrophoresis on 1.2% agarose gel. The RNA samples were
quantified, and similar quantities were used for cDNA synthesis.
For the cDNA synthesis, 1 μg of total RNA was reverse-transcribed
using oligo-dT and the Superscript amplification system.
Quantitative RT-PCR was carried out using SYBR-Green PCR Master
Mix. R-Ras (NM 006270) had the sense primer,
5′-CCTGCTGGTGTTCGCCATTA-3′ and the antisense primer,
5′-GGTCCTTGACCCGCAGAATC-3′; while GAPDH (NM_002046) had the sense
primer, 5′-GCACCGTCAAG GCTGAGAAC-3′ and antisense primer,
5′-TGGTGAAGA CGCCAGTGGA-3′. The cycling conditions were set at 95°C
for 10 sec, followed by 95°C for 5 sec, 60°C for 31 sec for 40
cycles. For quantification, the target genes were normalized to the
internal standard GAPDH gene. The amplification efficiency was
calculated for each gene from the slope of the linear regression
curve of Ct values vs. logarithm (log) of the cDNA concentration.
The PCR efficiency in the exponential phase was calculated.
Relative expression levels were also calculated.
After acquiring all testing data from the cell lines
and the paired breast tissue specimens using all six testing
methods, we conducted statistical data analysis using the Student’s
t-test and one-way ANOVA. In the data analysis, P<0.05 was used
as an index to determine statistical significance. All computations
were carried out using the SPSS 13.0 statistical program.
Results
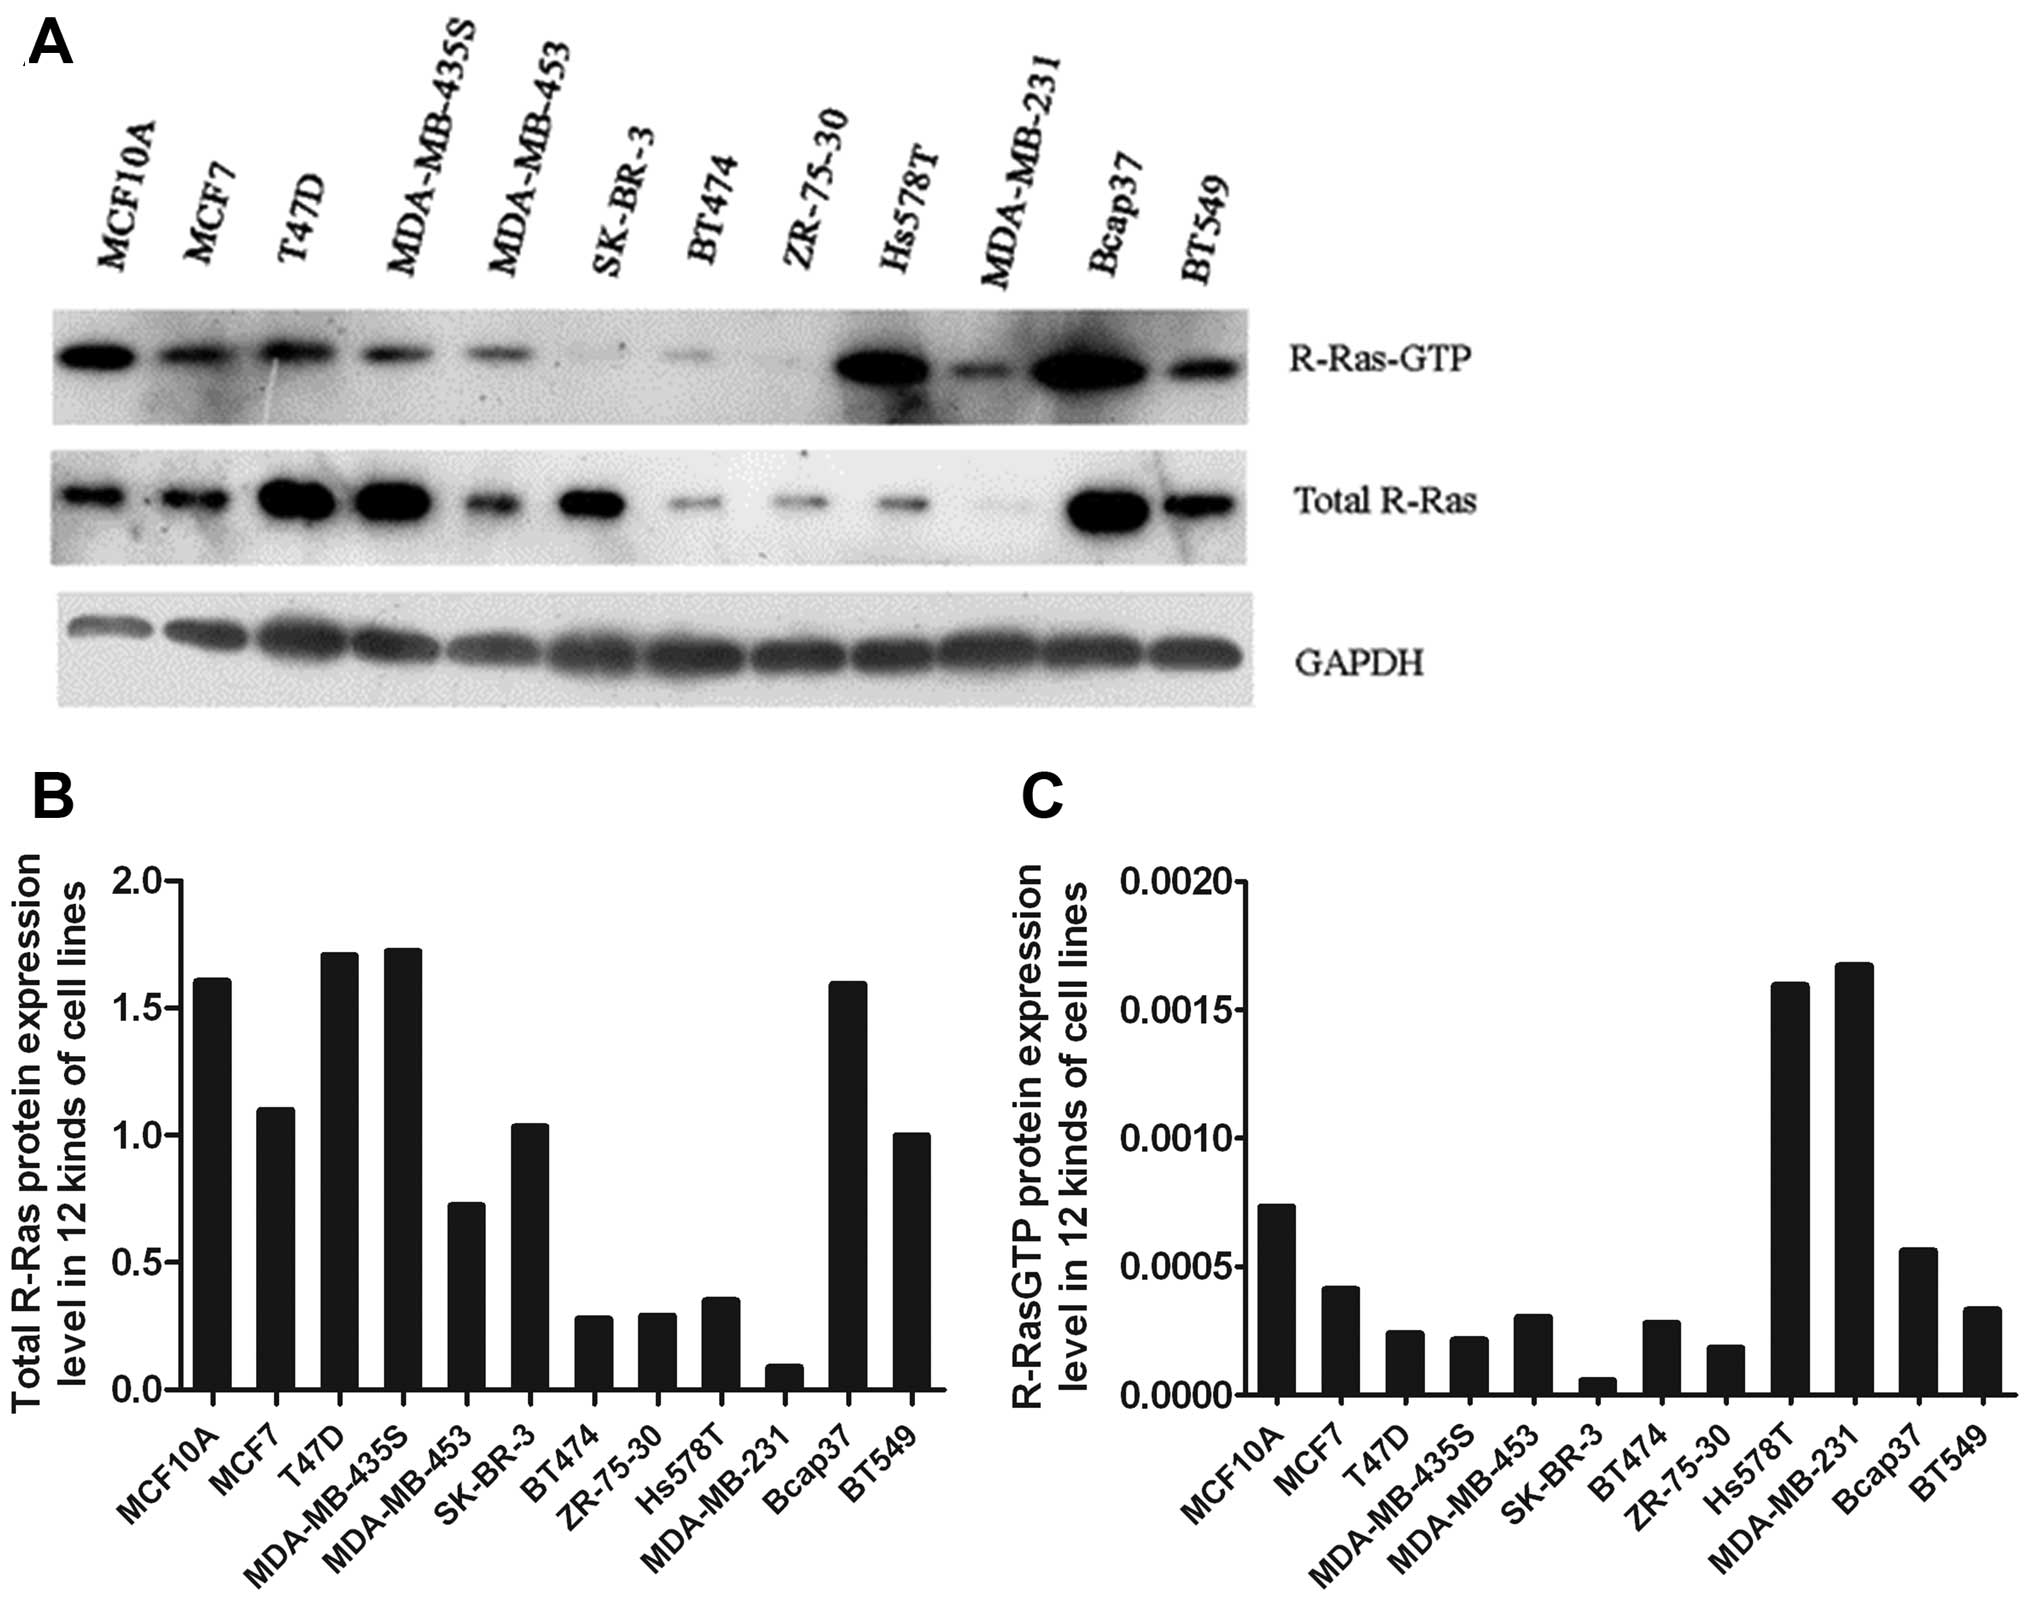
Western blot analysis of total R-Ras and
R-Ras-GTP expression in the 12 cell lines
We measured R-Ras protein levels and compared the
R-Ras expression levels between the normal breast MCF-10 cell line
and 11 mammary carcinoma cell lines using western blot analysis. We
found that the R-Ras protein expression levels were lower in 8
mammary carcinoma cell lines (MCF-7, MDA-MB-435S, BT474, ZR-75-30,
Hs578T, SK-BR-3, BT549 and MDA-MB-231) than the level in the MCF-10
cell line (Fig. 1A and B). The
R-Ras protein expression level was decreased in 72.7% of the 11
mammary carcinoma cell lines. The results also showed that by
comparing the expression level of R-Ras active protein in MCF-10
cells with the other 11 mammary carcinoma cell lines using both
western blot analysis and GST-pull down assay, R-Ras active protein
was expressed in 9 of the 11 breast carcinoma cell lines (MCF-7,
MDA-MB-453, T47D, MDA-MB-435S, BT474, ZR-75-30, SK-BR-3, BT549 and
MDA-MB-231) and was lower than that in the MCF-10 cells (Fig. 1A and C). The level of R-Ras active
protein decreased in 81.8% of mammary carcinoma cell lines.
qRT-PCR and western immunoblot analysis
of R-Ras expression in the breast cancer and paired normal
tumor-adjacent tissues
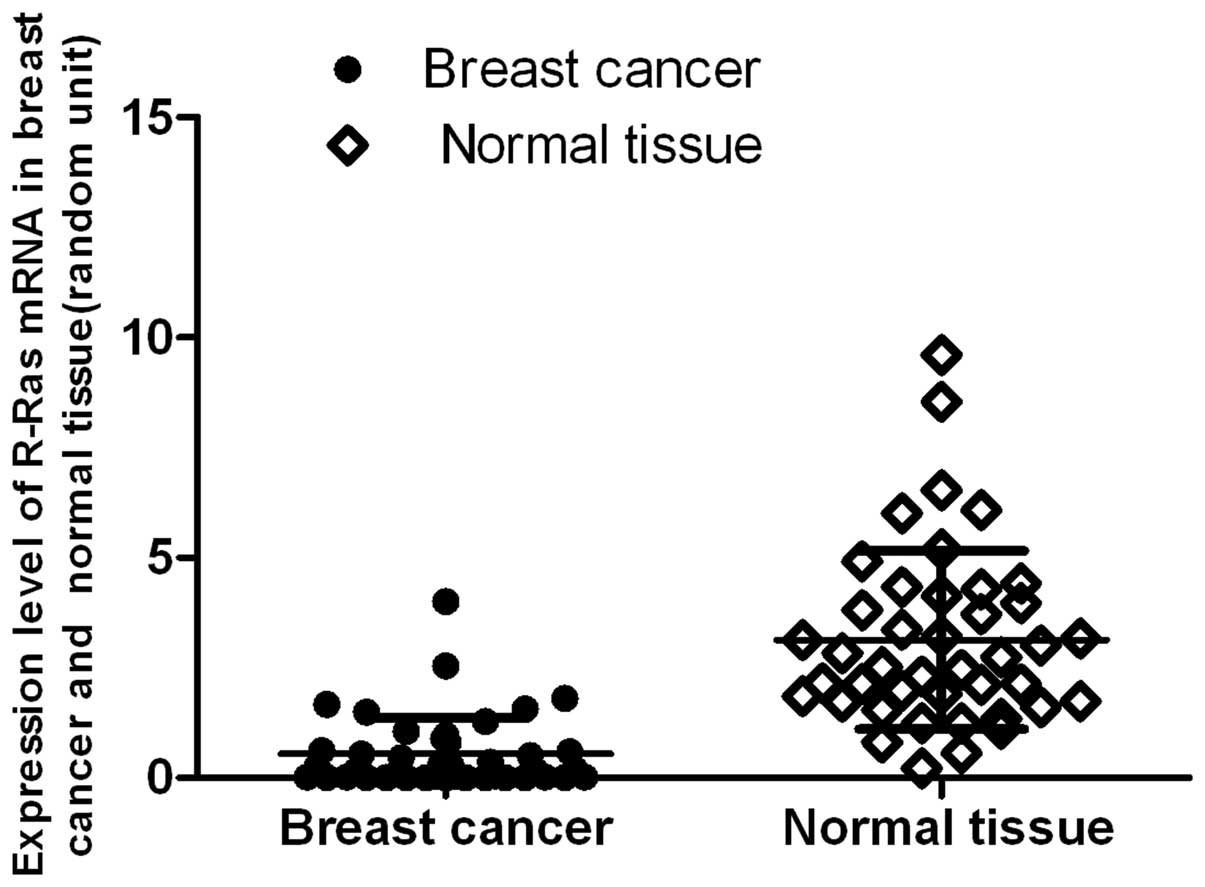
To confirm the results of R-Ras expression in the
breast cell lines, 42 samples of breast cancer and paired normal
tumor-adjacent tissues were selected and analyzed by quantitative
real-time RT-PCR. The R-Ras expression profiles were determined and
normalized against GAPDH in order to correct for varying tissues
between samples. R-Ras was found to be expressed in both normal
tissues and breast cancer specimens. The median relative R-Ras mRNA
ratio was 3.1365 (range, 0.2207–9.6078) for normal tumor-adjacent
tissues, and 0.5454 (range, 0.0038–4.0000) for cancer tissues. The
data demonstrated that the expression level of R-Ras mRNA in the
breast cancer tissues was significantly lower than that in the
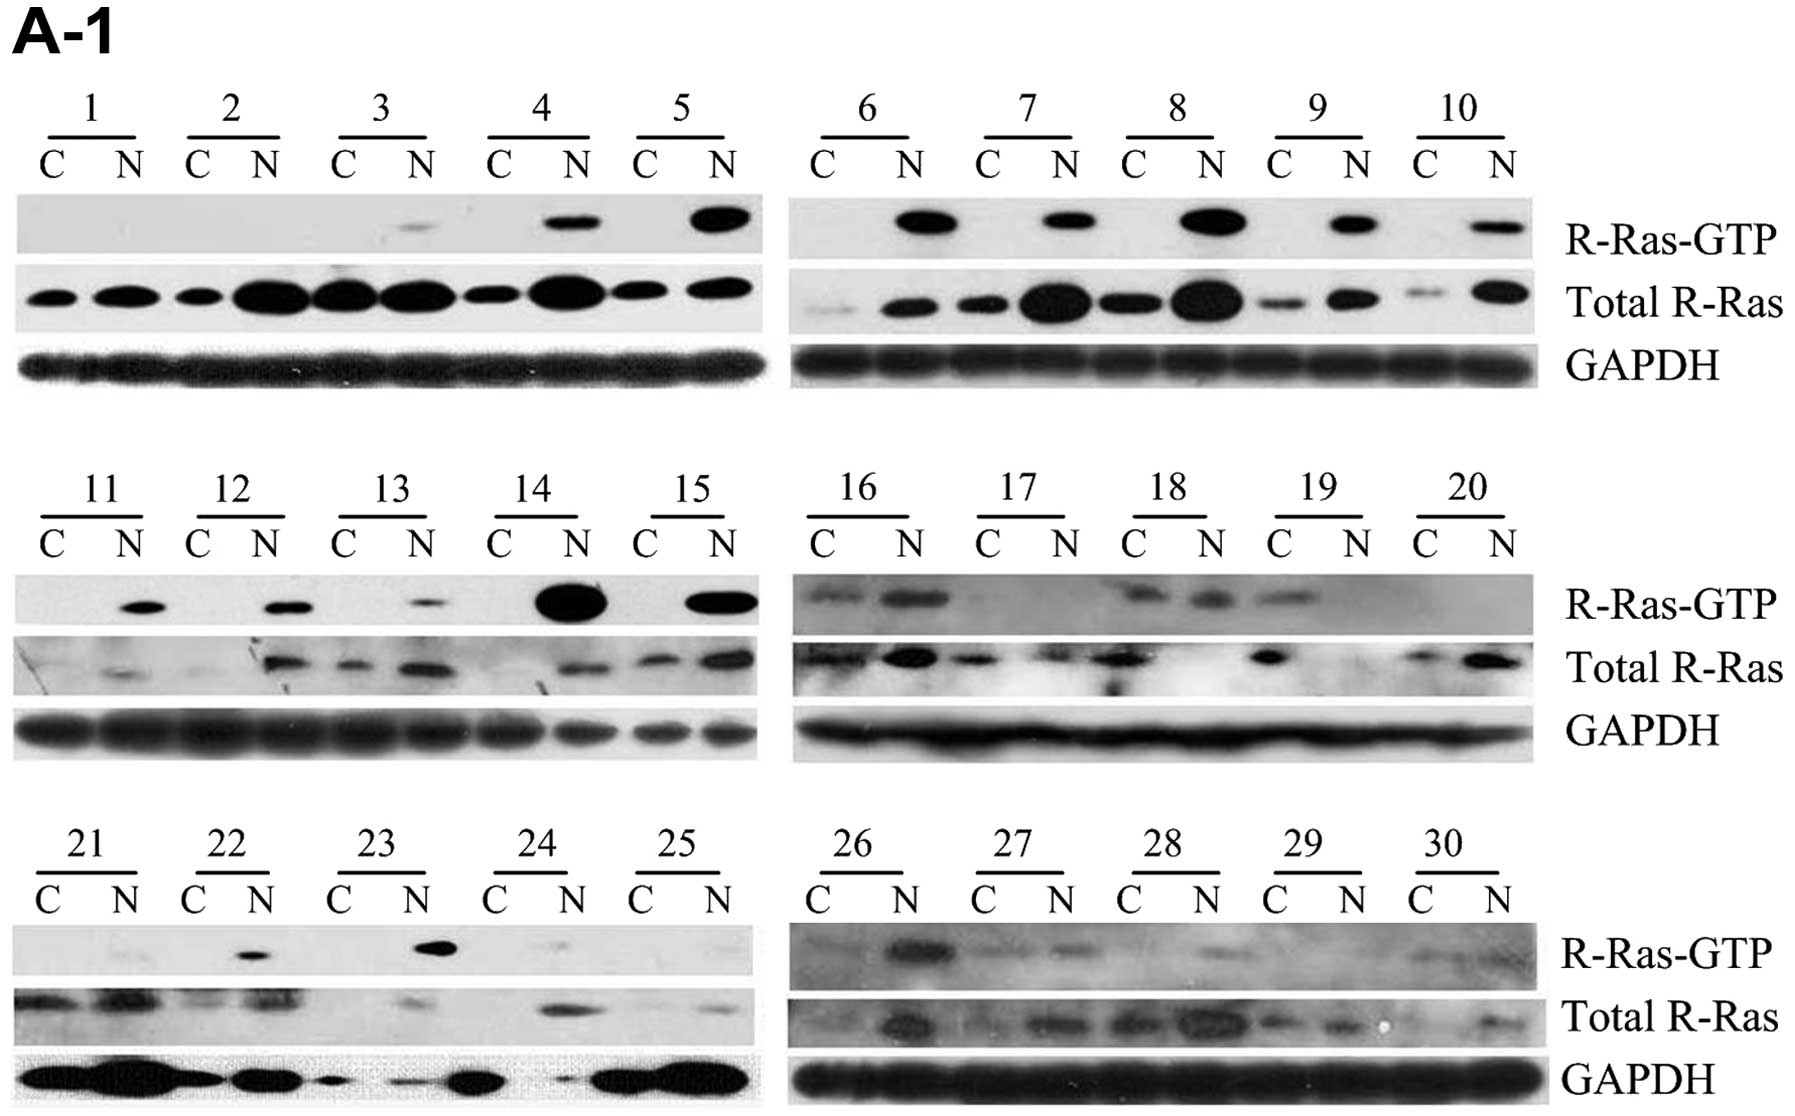
normal breast tissues (P=0.00000, P<0.01) (Fig. 2). When using western immunoblot
method to detect and analyze 69 samples of breast cancer and paired
normal tumor-adjacent tissues, the R-Ras expression profiles were
determined and normalized against GAPDH (Fig. 3A). Although the results showed that
R-Ras was positively expressed in all normal tissues and 67 breast
cancer specimens, on the whole, the level of R-Ras protein in 57
cases of cancer tissues was significantly lower than that in the
normal tissues (P=0.00000, P<0.0001) (Fig. 3B). The R-Ras protein levels in the
samples demonstrated a similar expression pattern as compared to
those of the R-Ras mRNA. The method proved that the expression
level of total R-Ras protein was decreased in the breast cancer
specimens, with a rate of decrease of 82.6%. Collectively, the
three testing methods and results proved that the expression level
of total R-Ras protein was in general lower in the breast
cancer-related cell lines and the actual tissue specimens.
Analysis of the activation of R-Ras in
the tissues
R-Ras molecules cycle between the active GTP-bound
form and the inactive GDP-bound form; the amount of active GTP-Ras
was separated from these samples, and was measured as previously
described using western immunoblot analysis. The activation of
R-Ras-GTP expression levels was determined and normalized against
R-Ras-total/GAPDH. In the 69 breast cancer tissue samples and
paired normal tumor-adjacent tissues, 54 of 69 (78.3%) normal
tumor-adjacent tissue samples displayed R-Ras-GTP expression
(Fig. 3A). There were 14 paired
cases of breast cancer and normal tissues without expression of
R-Ras; 10 of 69 (14.5%) breast cancer tissue samples displayed
R-Ras-GTP expression. The activity in the normal tumor-adjacent
tissues was ~6-fold that in the breast cancer tissue samples. The
activity of R-Ras in the breast cancer tissue samples was lower
than that in the normal tissues; the degree of R-Ras activation was
significantly lower than that in the the normal tissues (P=0.011;
P<0.05) (Fig. 3C). Although
R-Ras activation was positively expressed in 10 breast cancer
samples, there were only 4 cases in which the activation level was
higher than that in the corresponding adjacent normal tissue. They
were all infiltrative ductal carcinoma with lymph node metastasis
and negative PR.
Phenotype formation of breast cancer cell
line transfected with R-Ras and R-Ras38V
To further address the role of R-Ras in
transformation-related phenotype formation in breast cancer cells,
R-Ras and R-Ras38V, which is a constitutively-activated mutant of
R-Ras, were transfected into MCF-7 cells (Fig. 4A), and cell proliferation, migration
and cell cycle phases were analyzed. After the MCF-7 cells were
transfected with pcDNA3.1 or pcDNA3.1R-Ras for 3 days, the rate of
cell proliferation declined to 35–40%. The results showed that
R-Ras inhibited cell proliferation (Fig. 4B). Cell cycle phase distribution was
assessed by flow cytometry. after the MCF-7 cells were transfected
with pcDNA3.1, the percentage of cells in the G0/G1 stage was
63.33±10.88%. In the S stage, this percentage was 27.26±9.50%, and
in the G2/M stage, it declined to 9.4±1.57%. After the MCF-7 cells
were transfected with pcDNA3.1R-Ras38V, the percentage of cells in
the G0/G1 stage was 69.67±10.66%. In the S stage this percentage
was 18.51±9.95%, and in the G2/M stage it was 11.82±2.92%. The
percentage of cells dropped by 32.10% in the S stage, when
comparing the two groups (P<0.01) (Fig. 4C). This demonstrated that the cell
cycle was restricted at the S stage in the pcDNA3.1 R-Ras38V group;
the ability of DNA synthesis decreased, and R-Ras38V arrested cell
cycle progression. The migratory capacities of the MCF-7 cell were
reduced after transfection. Following comparison of the pcDNA3.1
and pcDNA3.1R-Ras38V groups, the cell transmembrane migratory count
declined by 36.11% on average. When comparing the pcDNA3.1 group
with the pcDNA3.1R-Ras group, the cell transmembrane migratory
count declined by 2.7% (Fig. 4D).
Thus, R-Ras38V inhibited cell migration in the presence of
serum.
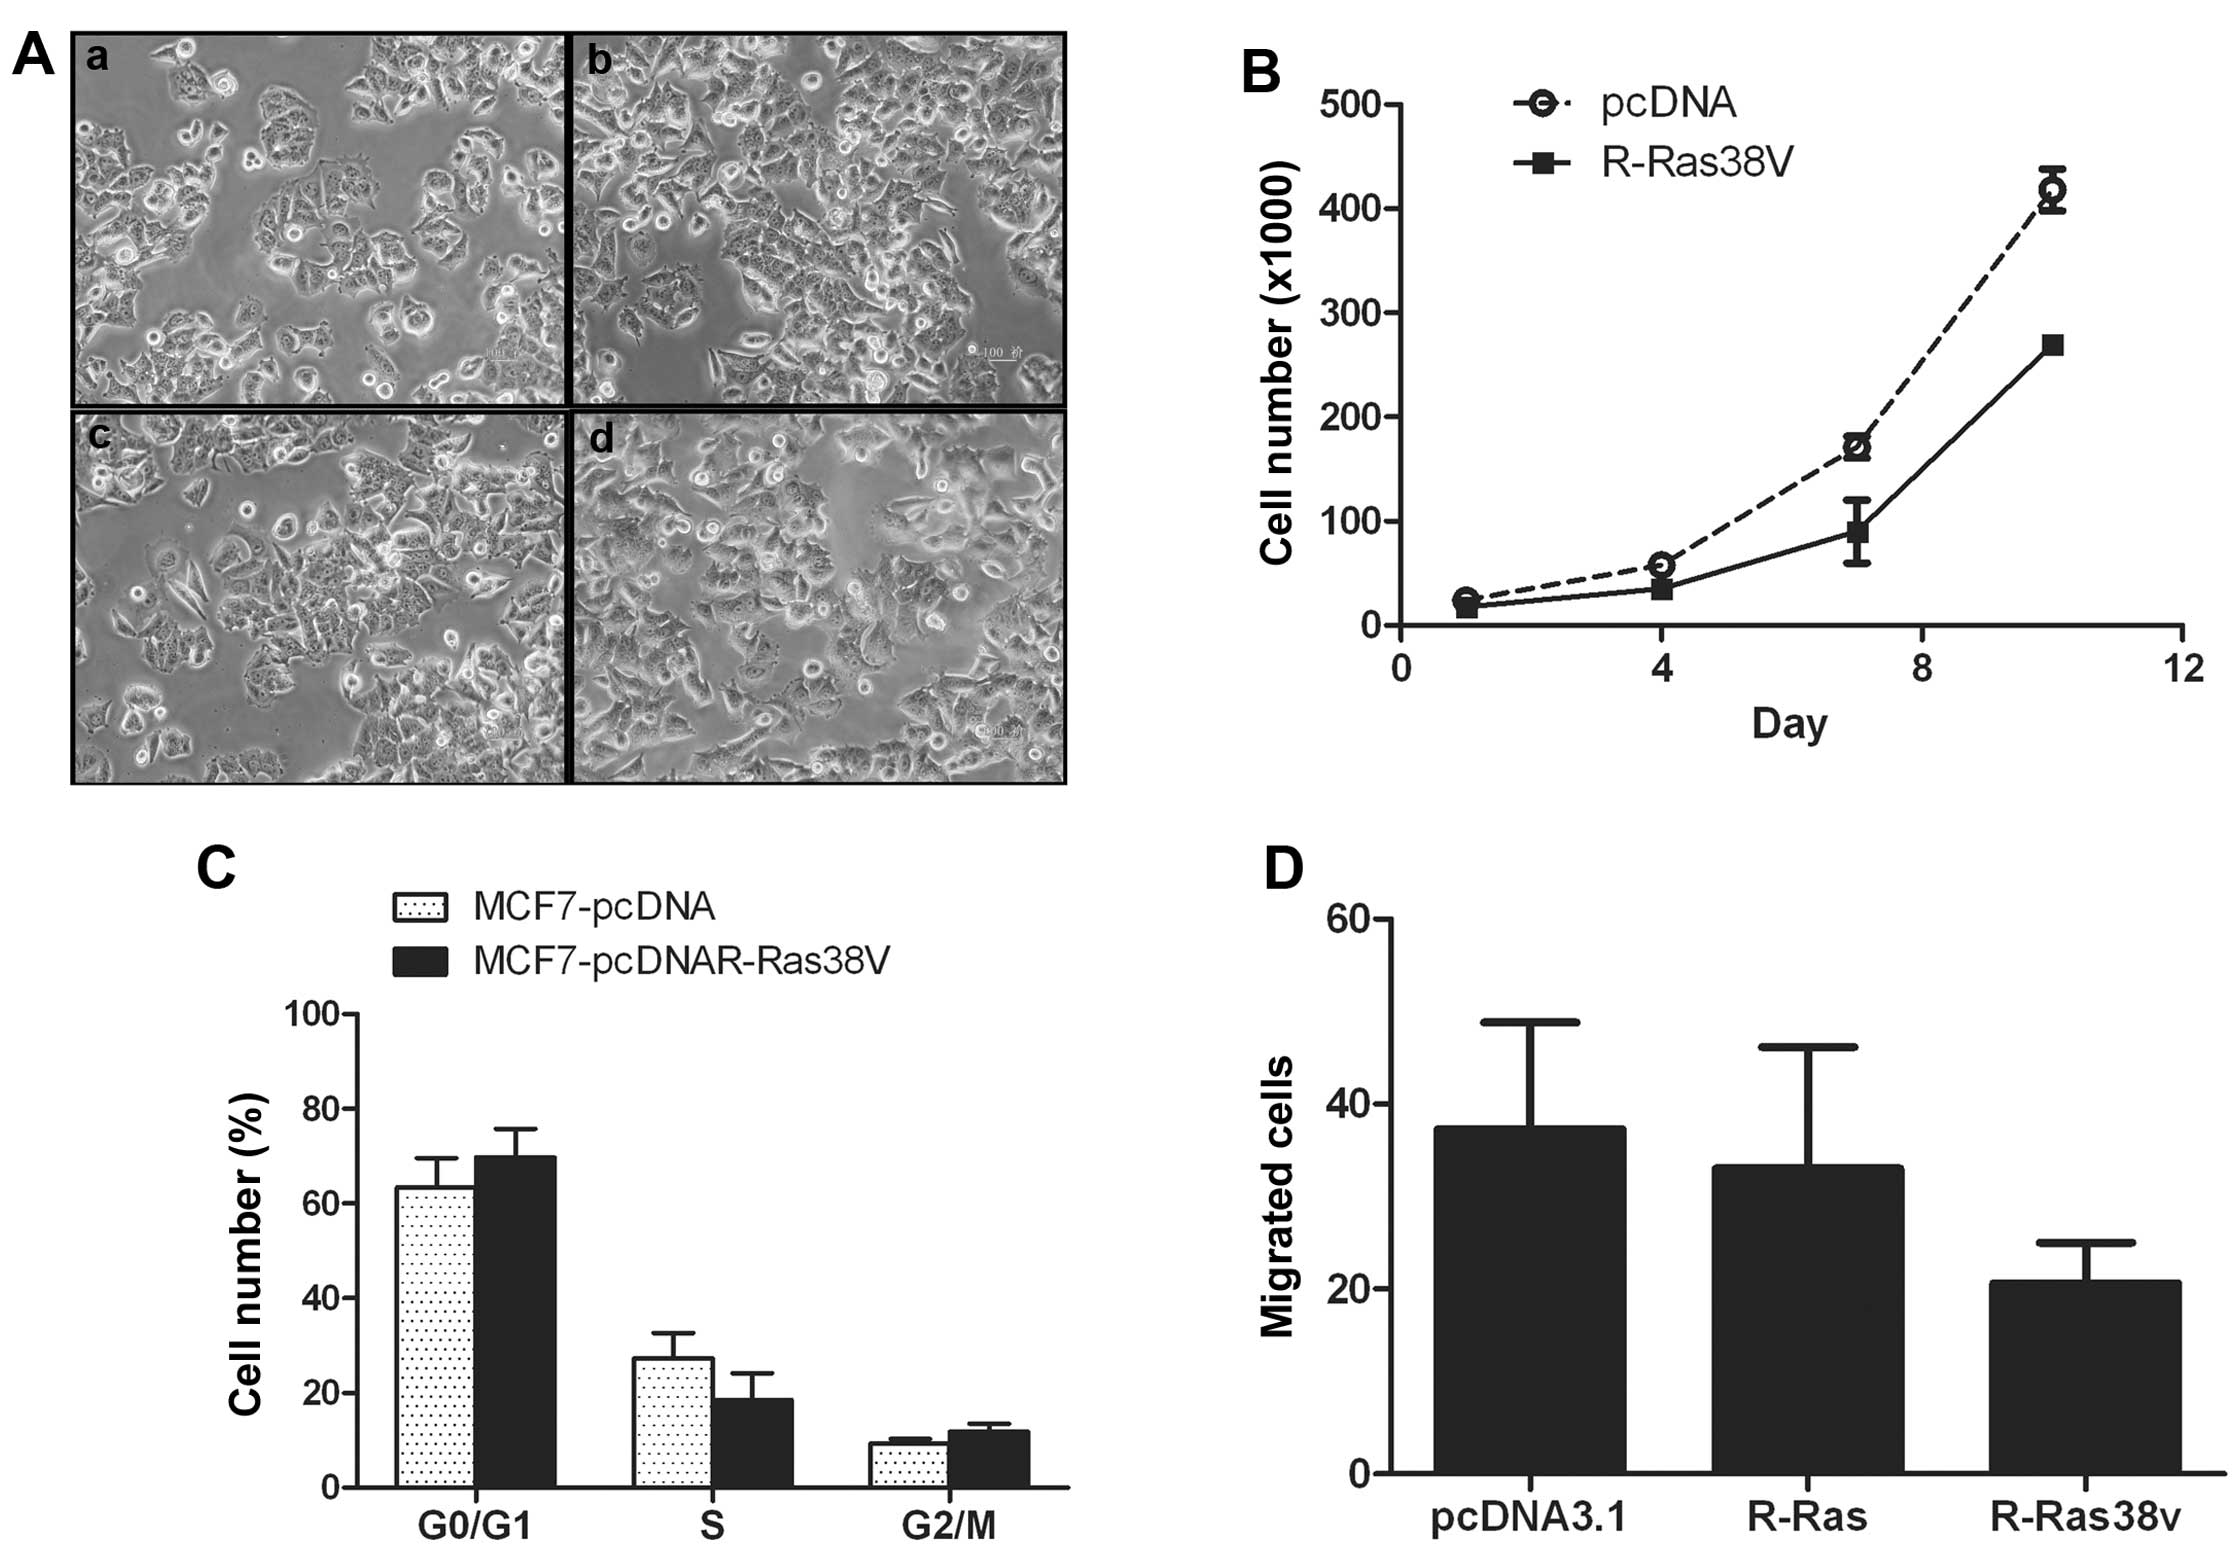 | Figure 4Overexpression and overactivation of
R-Ras inhibits MCF-7 cell proliferation, DNA replication and
migration. (A) Images of MCF-7 cell clones following stable
transfection: a, MCF-7; b, MCF-7-pcDNA3.1; c, MCF-7-pcDNA3.1R-Ras;
d, MCF-7-pcDNA3.1R-Ras38V. (B) Following the transfection of MCF-7
cells with pcDNA3.1R-Ras, proliferation of MCF-7 cells was
inhibited. (C) Cell cycle phase distribution was assessed by flow
cytometry. The cell cycle of MCF-7 cells transfected with
pcDNA3.1R-Ras38V was arrested in S phase. (D) R-Ras inhibited cell
migration. Vector-transfected MCF-7 cells (vector), activated
R-Ras-transfected MCF-7 cells (R-Ras38V), or R-Ras-transfected
MCF-7 cells were placed in collagen I-coated Transwell filters (8
μm pores). After 24 h, following migration through the filters,
cells on the underside of the filter were stained and counted. The
mean count of 10 visual fields was determined. Data shown are the
mean ± standard error values from experiments that were conducted
in duplicate. |
Clinical significance of the expression
and activation of R-Ras in breast cancer
Table I shows that
the total protein level of R-Ras was correlated with lymph node
metastasis (P=0.0474) and tumor diameter (P=0.0002). No correlation
with age range (P=0.1296), histologic types (P=0.3803) and
histologic grades (P=0.2358) was noted. The relationship between
R-Ras-GTP protein expression and clinical pathological characters
is summarized in Table II. The
results showed that the protein level of R-Ras-GTP was correlated
with lymph node metastasis (P=0.0171). However, there was no
correlation with age range, tumor diameter, histologic types and
histologic grades.
 | Table IRelationship between total R-Ras
protein expression and clinicopathological characteristics of
breast cancer cases. |
Table I
Relationship between total R-Ras
protein expression and clinicopathological characteristics of
breast cancer cases.
| Parameters | Cases (n) | R-Ras/GAPDH mean ±
SD | P-value |
|---|
| Age (years) | | | 0.1296 |
| <50 | 37 | 0.20±0.06 | |
| ≥50 | 32 | 0.30±0.21 | |
| Diameter of tumor
(cm) | | | 0.0002a |
| <2 | 21 | 0.42±0.23 | |
| ≥2 | 48 | 0.11±0.21 | |
| Histologic
type | | | 0.3803 |
| Ductal
carcinoma | 64 | 0.25±0.14 | |
| Others | 5 | 0.20±0.01 | |
| Lymph node
metastasis | | | 0.0474a |
| Without | 27 | 0.34±0.26 | |
| With | 42 | 0.19±0.04 | |
| Histologic
grades | | | 0.2358 |
| I–II | 53 | 0.31±0.11 | |
| II–III | 16 | 0.23±0.15 | |
| PR status | | | 0.6161 |
| − | 38 | 0.26±0.17 | |
| + | 17 | 0.30±0.12 | |
| ++ − +++ | 14 | 0.17±0.06 | |
| ER status | | | 0.0159a |
| − | 31 | 0.18±0.04 | |
| + | 11 | 0.21±0.04 | |
| ++ | 21 | 0.26±0.12 | |
| +++ | 6 | 0.73±0.90 | |
| Table IICorrelation of R-RasGTP protein
expression and clinicopathological characteristics of the breast
cancer cases. |
Table II
Correlation of R-RasGTP protein
expression and clinicopathological characteristics of the breast
cancer cases.
| Clinicopathological
characteristics | Reduced group (53
cases) | Non-reduced group
(16 cases) | P-value |
|---|
| Age (years) | 50.85±96.39 | 49.19±125.49 | 0.2839 |
| Diameter of tumor
(cm) | 2.24±0.53 | 1.90±0.5 | 0.0503 |
| Lymph node
metastasis | 4.89±21.04 | 1.96±7.93 | 0.0171a |
| Histological
grade | 2.14±0.12 | 2.00±0.13 | 0.0907 |
| PR | 1.06±1.13 | 0.5±0.67 | 0.0169a |
| ER | 1.09±1.12 | 0.49±0.64 | 0.0119a |
Since the breast is a hormonal action-targeted organ
and the negative expression of the progesterone receptor (PR) and
the estrogen receptor (ER) result in poor prognosis (25), within the tumor samples, we also
examined PR and ER by immunohistochemistry. PR and ER are located
in the nucleus. The positive rate of PR was 55.7% in 69 of the
breast cancer cases whereas the positive rate of ER was 49.92%. In
addition, total R-Ras protein levels were also positively
associated with ER (P=0.0159), while R-Ras-GTP protein expression
was negatively associated with PR (P=0.0169) and ER (P=0.0119).
Discussion
The Ras superfamily is a small G protein molecular
switch that transduces an upstream signal into downstream
effectors. The classic Ras proteins include H-Ras, N-Ras and K-Ras.
The other proteins include Rap, Ral, R-Ras, Rho, Rin and Rit
(26). Since the role of classic
Ras in the process of human tumorigenesis has been well
established, the R-Ras proteins have been reported to be involved
in multiple biological functions, such as induction of cell
transformation in fibroblasts, inhibition of cell proliferation in
endothelial and smooth muscle cells and spatial modulation of cell
migration (16,27,28).
Although R-Ras protein expression has been investigated in several
types of tumor tissues (i.e., cervical and brain tumor tissues), it
has never been previously investigated in breast tumor tissue. In
the present study, we systematically investigated the function of
R-Ras as a mediator in breast cancer using a unique and
comprehensive approach using seven testing methods, which increased
the reliability of our experimental results with the capability of
cross-validation. For the first time, we analyzed the R-Ras RNA
expression level, as well as measured the total protein and
activated protein levels using both breast tissue samples and
standard breast cell lines.
Based on our experimental results, the median
relative R-Ras mRNA ratio was 6-fold higher in normal tissue than
this ratio in cancer tissue (P=0.00000, P<0.01). Our immunoblot
results showed an overexpression of R-Ras protein in normal breast
cancer compared with carcinoma; particularly for R-Ras-GTP, we
found that it was only activated in 10 of 69 breast cancer tissue
samples compared to the paired tumor-adjacent normal tissues (57 of
69). Through the in vivo experiment, we also found that the
expression and activity level of R-Ras decreased in breast cancer
tissues when compared to normal tissue adjacent to carcinoma.
Significant correlations were found between clinicopathological
features including tumor diameter and lymph node metastasis. It was
negatively correlated to the size of the tumor diameter and the
metastatic state. These results suggest that R-Ras expression
inhibits the tumor growth, and also significantly inhibits tumor
metastasis. With the development of breast cancer, the expression
level of R-Ras weakened gradually, and this low R-Ras expression
level may cause mammary cells to become cancerous. Regarding
prognosis, the amount of R-Ras may also be inversely associated
with cancer prognosis (e.g., tumor diameter, metastatic levels).
Lower R-Ras protein levels indicate higher amounts of activity in
breast cancer.
In order to analyze the effects of R-Ras total
protein levels and the protein activity on the biological
characteristics of breast cancer cells, R-Ras was overexpressed or
overactivated in the MCF-7 cell line, and its effect on the MCF-7
cell biological characteristics was assessed. The results showed
that tumor cell proliferation, the invasive ability and movement
ability were significantly lower, and the number of cells in the S
phase of the cell cycle was lowered. The results showed that
R-Ras38V inhibited cell proliferation, migration and cell cycle
progression in the presence of serum. Collectively, our results
indicate that R-Ras activation may negatively regulate the
transformation of breast epithelial cells, and the loss of
activation of R-Ras may be involved in the carcinogenesis of breast
cancer.
Notably, our experimental results did not coincide
with the results of several studies conducted by other researchers
who investigated the correlation between R-Ras protein expression
and the development of other types of cancers. In some reports, the
R-Ras gene was considered to be ubiquitously expressed in
all organs and tissues. A number of reports showed that
R-Ras expression and phosphorylation were correlated with
increasing grade of gliomas. The R-Ras mRNA ratios were
significantly higher in glioblastoma samples than those in
anaplastic astrocytoma tissues, low-grade astrocytoma tissues and
normal brain tissues (29). R-Ras
reportedly promotes tumor growth of cervical epithelial cells
(29). In addition, R-Ras was
reported to induce cell transformation in fibroblasts and to induce
a more invasive phenotype in breast epithelial T47D cells (22,26).
R-Ras was found to increase cervical epithelial cell migratory
potential over collagen through a pathway that involves PI3-K
(31).
Our experimental results were conflicting. The
amount of R-Ras protein showed an inverse association with the risk
of breast cancer cell development and metastatic levels. This
finding is contradictory to previous observations that showed
positive associations between R-Ras protein levels and other types
of cancers (28–30). As to the role of R-Ras in breast
cancer, we analyzed the problem from three aspects. In regards to
the cell lines, previously reported studies used T47D cells and
fibroblasts; while in the present study, total R-Ras protein
expression was increased only in T47D cells. However, in whole
tissue, the total R-Ras protein and R-Ras activity protein
expression were decreased. Hence, further investigation and
validation on this subject are required by other independent
research groups.
For cell proliferation conditions, the biological
actions of R-Ras are mediated by multiple effectors.
PI3-K-dependent signaling cascades are critical to its function.
The estrogen receptor (ER) and progesterone receptor (PR) also
mediate signaling events inducing distinct responses in breast
cells. In the present study involving 69 cases of breast cancer,
the positive rate of ER was 55.7% and the positive rate of PR was
49.92%. Recent studies demonstrate the existence of cross-talk
between EGFR signaling pathways and ER signaling pathways. EGF,
IGF-I can modulate the expression and activity of the estrogen
receptor-α (ER-α) via the PI 3-K/Akt pathway in ER-α-positive
breast cancer cell lines. In breast cancer, R-Ras mediates
inhibition of insulin signaling associated with the suppression of
estrogen action in breast cancer cells. R-Ras participates in
cross-talk between estrogen and insulin/IGF-1 signaling (24). Our data showed that R-Ras and
R-Ras-GTP participate in estrogen signaling; however, total R-Ras
protein levels were also positively associated with ER, while
R-Ras-GTP protein expression was negatively associated with PR and
ER. In regards to tumor angiogenesis, as a tumor grows in size, it
stimulates the formation of new blood vessels (16) in vivo, and the role of R-Ras
is an important negative regulator of vascular regeneration and
promotes quiescence of vascular cells. The R-ras gene
disruption in mice rendered these animals susceptible to the
excessive proliferative response of neointimal smooth muscle cells
to acute arterial injury. Forced expression of activated R-Ras
(R-Ras38V) suppressed mitogenic and invasive activities of growth
factor-stimulated endothelial cells and arterial smooth muscle
cells. Hence, further investigation and validation on this subject
is required by other independent research groups.
Although the association between R-Ras protein
expression or activity and breast cancer development has been
investigated by other research groups, this is the first study to
use both breast cancer cell lines and breast tumor specimens to
comprehensively investigate the association between a new genetic
biomarker (R-Ras protein) and breast cancer. Hence, this study has
a number of unique characteristics. It used a mixed testing dataset
including 12 breast cancer-related cell lines and 69 matched pairs
of breast tissue samples acquired from resected breast tumors. We
also applied four well-established and commonly acceptable
biological testing methods to acquire testing signals and then
conducted cross validation of our results using these different
testing methods. To the best of our knowledge, this increased the
accuracy and reliability of our results. As a result, compared to
previous studies, our study provides more comprehensive
experimental and data analysis results.
Further research of R-Ras is warranted. It has
potential clinical significance in cancer detection and diagnosis.
R-Ras protein is a new biomarker with high specificity. Due to this
unique characteristic, it can provide valuable complimentary or
supplementary diagnostic information along with other existing
biomarkers or cancer-related genes. Hence, R-Ras may also be a new
predictor of cancer prognosis. Regarding cancer treatment efficacy
assessment, increasing R-Ras protein levels following chemotherapy
or radiation therapy may indicate favorable response to treatment
of the patient. In regards to new cancer drug development, the
development and use of drugs that help increase R-Ras protein
inside the human body may help cancer prevention and/or reduce the
risk of cancer recurrence.
In summary, the present study provides evidence for
an important role of R-Ras in breast cancer development. It
suggests that deregulation of the balance of protein activity in
cells may be an important component of breast tumorigenesis.
Acknowledgements
The present study was supported in part by the
Heilongjiang Province Natural Science Foundation of China (grant
no. D200981) and was supported by the National Natural Science
Foundation of China (grant no. 81172204). We thank Professor
Zaishun Jin for technical support. This study was also supported by
the Program for Innovation Team in Science and Technology of the
Heilongjiang Province University.
References
|
1
|
Webb CP, Van Aelst L, Wigler MH and Vande
Woude GF: Signaling pathways in Ras-mediated tumorigenicity and
metastasis. Proc Natl Acad Sci USA. 95:8773–8778. 1998. View Article : Google Scholar : PubMed/NCBI
|
|
2
|
Lowe DG, Capon DJ, Delwart E, et al:
Structure of the human and murine R-ras genes, novel genes
closely related to ras proto-oncogenes. Cell. 48:137–146.
1987.PubMed/NCBI
|
|
3
|
Tada M, Kobayashi T, Kontani K and Katada
T: Recent progress in the research on small GTP-binding protein.
Nihon Yakurigaku Zasshi. 130:373–379. 2007.(In Japanese).
|
|
4
|
Hall A: The cellular functions of small
GTP-binding proteins. Science. 249:635–640. 1990. View Article : Google Scholar : PubMed/NCBI
|
|
5
|
Bourne HR, Sanders DA and Mccormick F: The
GTPase superfamily: a conserved switch for diverse cell functions.
Nature. 348:125–132. 1990. View
Article : Google Scholar : PubMed/NCBI
|
|
6
|
Self AJ, Caron E, Paterson HF and Hall A:
Analysis of R-Ras signaling pathways. J Cell Sci. 114:1357–1366.
2001.PubMed/NCBI
|
|
7
|
Oertli B, Han J, Marte BM, et al: The
effector loop and prenylation site of R-Ras are involved in the
regulation of integrin function. Oncogene. 19:4961–4969. 2000.
View Article : Google Scholar : PubMed/NCBI
|
|
8
|
Fernandez-Sarabia MJ and Bischoff JR:
Bcl-2 associates with the ras related protein R-ras
p23. Nature. 366:274–285. 1993. View
Article : Google Scholar : PubMed/NCBI
|
|
9
|
Wang HG, Millan JA, Cox AD, et al: R-Ras
promotes apoptosis caused by growth factor deprivation via a Bcl-2
suppressible mechanism. J Cell Biol. 129:1103–1114. 1995.
View Article : Google Scholar : PubMed/NCBI
|
|
10
|
Hughes PE, Oertli B, Han J, et al: R-Ras
regulation of integrin function. Methods Enzymol. 333:163–171.
2001. View Article : Google Scholar : PubMed/NCBI
|
|
11
|
Kinashi T, Katagiri K, Watanabe S, et al:
Distinct mechanisms of α5β1 integrin activation by Ha-Ras and
R-Ras. J Biol Chem. 275:22590–22596. 2000.
|
|
12
|
Kwong L, Wozniak MA, Collins AS, et al:
R-Ras promotes focal adhesion formation through focal adhesion
kinase and p130Cas by a novel mechanism that differs
from integrins. Mol Cell Biol. 23:933–949. 2003. View Article : Google Scholar : PubMed/NCBI
|
|
13
|
Wang B, Zou JX, Ek-Rylander B, et al:
R-Ras contains a proline-rich site that binds to SH3 domains and is
required for integrin activation by R-Ras. J Biol Chem.
275:5222–5227. 2000. View Article : Google Scholar : PubMed/NCBI
|
|
14
|
Furuhjelm J and Peränen J: The C-terminal
end of R-Ras contains a focal adhesion targeting signal. J Cell
Sci. 116:3729–3738. 2003. View Article : Google Scholar : PubMed/NCBI
|
|
15
|
Oinuma I, Ito Y, Katoh H and Negishi M:
Semaphorin 4D/Plexin-B1 stimulates PTEN activity through
R-RasGTPase-activating protein activity, inducing growth cone
collapse in hippocampal neurons. J Biol Chem. 285:28200–28209.
2010. View Article : Google Scholar : PubMed/NCBI
|
|
16
|
Komatsu M and Ruoslahti E: R-Ras is a
global regulator of vascular regeneration that suppresses intimal
hyperplasia and tumor angiogenesis. Nat Med. 11:1346–1350. 2005.
View Article : Google Scholar : PubMed/NCBI
|
|
17
|
Inuzuka T, Tsuda M, Kawaguchi H, et al:
Transcription factor 8 activates R-Ras to regulate angiogenesis.
Biochem Biophys Res Commun. 379:510–523. 2009. View Article : Google Scholar : PubMed/NCBI
|
|
18
|
Sawada J and Komatsu M: Normalization of
tumor vasculature by R-Ras. Cell Cycle. 11:4285–4296. 2012.
View Article : Google Scholar : PubMed/NCBI
|
|
19
|
Sawada J, Urakami T, Li F, et al: Small
GTPase R-Ras regulates integrity and functionality of tumor blood
vessels. Cancer Cell. 22:235–249. 2012. View Article : Google Scholar : PubMed/NCBI
|
|
20
|
Xu L and Komatsu M: Promoter cloning and
characterization of the anti-vascular proliferation gene,
R-ras: role of Ets- and Sp-binding motifs. J Biol Chem.
284:2706–2718. 2009. View Article : Google Scholar : PubMed/NCBI
|
|
21
|
Erdogan M, Pozzi A, Bhowmick N, et al:
Transforming growth factor-β (TGF-β) and TGF-β-associated kinase 1
are required for R-Ras-mediated transformation of mammary
epithelial cells. Cancer Res. 68:6224–6231. 2008.
|
|
22
|
Keely PJ, Rusyn EV, Cox AD and Parise LV:
R-Ras signals through specific integrin α cytoplasmic domains to
promote migration and invasion of breast epithelial cells. J Cell
Biol. 145:1077–1088. 1999.
|
|
23
|
Yu Y and Feig LA: Involvement of R-Ras and
RalGTPases in estrogen-independent proliferation of breast cancer
cells. Oncogene. 21:7557–7568. 2002. View Article : Google Scholar : PubMed/NCBI
|
|
24
|
Yu Y, Hao Y and Feig LA: The R-RasGTPase
mediates cross talk between estrogen and insulin signaling in
breast cancer cells. Mol Cell Biol. 26:6372–6380. 2006. View Article : Google Scholar : PubMed/NCBI
|
|
25
|
Ross JS, Linette GP, Stec J, et al: Breast
cancer biomarkers and molecular medicine. Expert Rev Mol Diagn.
3:573–585. 2003. View Article : Google Scholar
|
|
26
|
Valencla A, Chardin P, Wittinghofer A, et
al: The ras protein family: evolutionary tree and role of conserved
amino acids. Biochemistry. 30:4637–4648. 1991. View Article : Google Scholar : PubMed/NCBI
|
|
27
|
Cox AD, Brtva TR, Lowe DG, et al: R-Ras
induces malignant, but not morphologic, transformation of NIH3T3
cells. Oncogene. 9:3281–3288. 1994.PubMed/NCBI
|
|
28
|
Wozniak MA, Kwong L, Chodniewicz D, et al:
R-Ras controls membrane protrusion and cell migration through the
spatial regulation of Rac and Rho. Mol Biol Cell. 16:84–96. 2005.
View Article : Google Scholar : PubMed/NCBI
|
|
29
|
Nakada M, Niska JA, Tran NL, et al:
EphB2/R-Ras signaling regulates glioma cell adhesion, growth, and
invasion. Am J Pathol. 167:565–576. 2005. View Article : Google Scholar : PubMed/NCBI
|
|
30
|
Rincón-Arano H, Rosales R, Mora N, et al:
R-Ras promotes tumor growth of cervical epithelial cells. Cancer.
97:575–585. 2003.PubMed/NCBI
|
|
31
|
Mora N, Rosales R and Rosales C: R-Ras
promotes metastasis of cervical cancer epithelial cells. Cancer
Immunol Immunother. 56:535–544. 2007. View Article : Google Scholar : PubMed/NCBI
|
|
32
|
Wang J, Yao M, Gu J, et al: Blocking HSF1
by dominant- negative mutant to sensitize tumor cell to
hyperthermia. Biochem Biophys Res Commun. 290:1454–1461. 2002.
View Article : Google Scholar : PubMed/NCBI
|