Introduction
Oral squamous cell carcinoma (OSCC) is one of the
most frequently diagnosed types of cancer worldwide, with more than
500,000 new patients diagnosed annually in the world (1). OSCC accounts for the highest incidence
of malignant tumors in the head and neck, and patients are often
prone to tumor invasion and metastasis. In addition, OSCC is the
sixth most common type of cancer worldwide, accounting for ~5% of
all malignant tumors (2). Although
there are currently many treatments available for OSCC, including
surgical resection, radiotherapy and chemotherapy, the patient
prognosis remains relatively poor. These treatments also tend to
present serious side effects, for example, postoperative
recurrence, postoperative hematoma, tooth decay, radiation
osteonecrosis, gastrointestinal reactions and systemic diseases
after chemotherapy. Therefore, elucidation of the molecular
mechanism underlying oral cancer is required in order to identify
novel therapeutic targets and diagnostic markers. An increasing
number of studies have revealed that microRNAs (miRNAs/miRs) are
closely associated with the occurrence and development of OSCC
(3–5).
miRNAs are a class of small molecular non-coding
RNAs, 19–24 nucleotides in length, which act through targeting
mRNAs. Since the discovery of miRNAs, more than 2,500 human miRNAs
have been reported (6). The abnormal
expression of miRNAs, when comparing normal and cancerous tissues,
is closely associated with biological processes in tumors,
including the cell cycle, proliferation, differentiation, growth
and apoptosis (7). miRNAs can act as
oncogenes or tumor-suppressor genes (8–11).
However, greater understanding of the involvement of miRNAs in the
development and progression of OSCC is required. miR-543, a member
of the miRNA family, has become a key item of interest in recent
years. It has been revealed to have an abnormal expression and
serve an important role in a variety of different types of cancers,
including lung cancer (12), gastric
cancer (13), hepatocellular
carcinoma (14), breast cancer
(15), colorectal cancer (16) and ovarian cancer (17), to name a few. Nevertheless, the role
of miR-543 in OSCC remains unknown.
Previous studies have demonstrated that cytochrome
P450 is involved in the treatment of tumors, such as hepatocellular
carcinoma, prostate cancer and bladder cancer, but also has a
strong correlation with the occurrence and development of tumors
(18–20). Cytochrome P450 family 3 subfamily A
member 5 (CYP3A5) is a member of the cytochrome P450 superfamily of
enzymes that are involved in the metabolic processes of endogenous
molecules including drugs, exogenous carcinogens and steroids
(21). Early studies have reported
that the abnormal expression of CYP3A5 may be associated with the
progression of HCC and may serve as a target for the treatment of
hepatitis C-associated HCC as well as a marker (22). However, the associations between
CYP3A5 and OSCC have not been reported. In the present study, it
was demonstrated that CYP3A5 exhibits low expression in OSCC
tissues and cell lines, may serve as a direct target gene for
miR-543 and promotes the growth of OSCC cells.
Materials and methods
Cell culture
Three oral cancer cell lines (SCC9, SCC25 and CAL27)
and one normal human oral keratinocyte (HOK) cell line were used in
the present study. SCC9, SCC25, and CAL27 cells are human tongue
squamous cell carcinoma cell lines, of which SCC9 was a gift from
Wuhan University (Hubei, China), SCC25 was purchased from the
Biological Resources Center of the ATCC (The Global Bioresource
Center, Manassas, VA, USA), and CAL27 was obtained from the Center
Laboratory of Stomatology Hospital of Guangzhou Medical University
(Guangdong, China). HOK cells are normal human oral keratinocyte
strains (23) which were purchased
from the ScienCell Research Laboratories, Inc. (no. 2610; San
Diego, CA, USA). The cancer cell lines were grown in 100%
Dulbecco's modified Eagle's medium (DMEM)/F12 medium containing 10%
fetal bovine serum (FBS; Gibco; Thermo Fisher Scientific, Inc.,
Waltham, MA, USA). The HOK cells were maintained in 100% DMEM
medium containing 10% FBS. All cells were cultured at 37°C in a
humidified atmosphere with 5% CO2.
Clinical specimens
The present study was approved by the Research
Ethics Committee of the Stomatology Hospital of Guangzhou Medical
University (Guangdong, China). Written informed consent was
obtained from all of the patients recruited. All of the oral
carcinoma tissues and adjacent normal tissues were collected from
patients who had undergone surgery at the Stomatology Hospital of
Guangzhou Medical University from January 2016 to June 2017. A
total of 20 patients, including 9 males and 11 females were
recruited. Twelve individuals were 50 years of age or older, 8
individuals were younger than 50 years. The age range was 35–70
years old, with an average age of 50.4±7.56 years. The inclusion
criteria for patients with OSCC were: i) histological confirmation
of OSCC; and ii) no prior history of any other type of cancer.
Transfection of miR-543 mimic and
inhibitor
Chemically modified miR-543 mimics, miRNA mimic
negative control (NC), miR-543 inhibitor and miRNA inhibitor NC,
were transfected into cells using GenMute transfection reagent
(SignaGen Laboratories, Rockville, MD, USA) according to the
manufacturer's protocol (24), in
order to determine the levels of upregulated or downregulated
expression in various genes, such as CYP3A5, CYB5R4, BIRC6, NR3C1
and PRKG1, and also to observe the effect of the OSCC cell line
phenotype. The sequences are listed in Tables I and II.
 | Table I.Sequences of the miR-543 mimic or
inhibitor or NC and CYP3A5 siRNA or siRNA NC. |
Table I.
Sequences of the miR-543 mimic or
inhibitor or NC and CYP3A5 siRNA or siRNA NC.
| Name | Sequence (5′ to
3′) |
|---|
| miR-543 mimic |
AAACAUUCGCGGUGCACUUCUU |
| miRNA mimic NC |
UUUGUACUACACAAAAGUACUG |
| miR-543
inhibitor |
UACUUAAUGAGAAGUUGCCCGUGUUUUUUUCGCUUUAUUUGUGACGAAACAUUCGCGGUGCACUUCUUUUUCAGUAU |
| miRNA inhibitor
NC | mirVana™ miRNA
Inhibitor, Negative Control #1, hermoFisher Scientific, cat. no.
4464076 |
| CYP3A5 siRNA |
TCTGTCTTCACAAATCGAA |
| siRNA NC | RiboBio, cat. no.
siN05815122147 |
| Table II.Primer sequences of the genes used
for this study. |
Table II.
Primer sequences of the genes used
for this study.
| Gene | Primer sequence (5′
to 3′) |
|---|
| hsa-miR-543 |
ACATTCGCGGTGCACTTCTT |
| CYP3A5 | F:
TGTTATTCTGTCTTCACAAATCGAA |
|
| R:
CCTCAAGTTTCTCACCAATACATCT |
| CYB5R4 | F:
TTGACCCAACGATGAACCTGA |
|
| R:
AAGGATCTAACGGGATTAAAAGGC |
| BIRC6 | F:
GTGAACTGGGATAATCTTGAGGAAA |
|
| R:
GCTGTGATGAGGAGCGACTTG |
| BCL6B | F:
TCCGCAGATTGAGCAGTGGTA |
|
| R:
CAGAACTGTGAGGCTGTGGCA |
| NR3C1 | F:
GTTTCTGCGTCTTCACCCTCACT |
|
| R:
CATTTCCCATCACTTTTGTTTCTGT |
| PRKG1 | F:
AGGATGAGATTTTCTGGCTTG |
|
| R:
ATTCTCAGGGATAGAGGTTCG |
| TNFSF11 | F:
TGATGAAAGGAGGAAGCA |
|
| R:
GTAAGGAGGGGTTGGAGA |
| EIF1 | F:
TGTAACCATTTGGGGTCCGCTT |
|
| R:
TTTGTAATCTTAGGGCTCTGGGCTT |
| ING1 | F:
CACCTCAACAAAGGCAGCAAT |
|
| R:
GGACAAAGCCCTGGAGAAATC |
| GADPH | F:
AAGAAGGTGGTGAAGCAGG |
|
| R:
GAAGGTGGAAGAGTGGGAGT |
| U6 | F:
GGAACGATACAGAGAAGATTAGC |
|
| R:
TGGAACGCTTCACGAATTTGCG |
Transfection of CYP3A5 small
interfering (si)RNA
CYP3A5 siRNA and NC were transfected into SCC9 cells
using GenMute transfection reagent (SignaGen Laboratories)
according to the manufacturer's protocol, in order to observe the
effect of the SCC9 cell phenotype. The sequences are listed in
Table I.
Cell proliferation assays
Cell proliferation was measured using a Cell
Counting Kit-8 (CCK-8; Dojindo Laboratories, Kumamoto, Japan). A
total of ~5×10³ OSCC cells were plated into 96-well
plates, and 10 µl of the CCK-8 solution was added into each well 0,
1, 2 and 3 days following cell plating. The 96-well plates were
incubated for 4 h at 37°C, and the absorbancies at each time-point
were measured at 450 nm using a microplate reader. Each experiment
was repeated three times.
Colony formation assay
The clonogenicity of a single cell was detected by a
colony formation assay. The different groups of cells were added to
each well of 6-well plates and cultured in DMEM/F12 medium
containing 10% FBS for 10 days. SCC9 and CAL27 cells were collected
using 0.25% trypsin and the concentration was adjusted to 600
cells/pPetri dish; SCC25 cells were adjusted to a concentration to
300 cells/Petri dish, which was diluted with 2 ml of preheated
culture media prior to culture at 5% CO2 and 37°C for 10
days. Colony formation was terminated when the colony was visible
to the naked eye. Once visible, cells were washed twice with
phosphate-buffered saline (PBS), and then 4% paraformaldehyde was
added for 30 min to fix the cells prior to staining with crystal
violet for 30 min. Following this, the number of colonies was
counted and the colony formation rate was calculated as follows:
Colony formation rate=(Number of colonies/Inoculated cell number)
×100%.
Cell cycle analysis
The BD propidium iodide (PI) Cell Cycle Detection
Kit (BD Biosciences, San Jose, CA, USA) was used to detect the cell
cycle in SCC9, SCC25 and CAL27 cells according to the
manufacturer's instructions. The cells were digested with trypsin
and collected after centrifugation at 845 × g. Following
collection, the cells were washed twice with cold PBS. Cells were
harvested, fixed with 70% ice-cold ethanol at 4°C overnight and
then re-suspended. The cells were then collected via centrifugation
at 2535 × g, washed twice with PBS, centrifuged again, and finally
stained with PI at room temperature for 30 min in the dark. Cell
cycle assays were performed using a flow cytometer (BD
Biosciences). The results were analyzed using Modfit LT software
(Verity Software House, Inc., Topsham, ME, USA). Each experiment
was repeated three times.
Apoptosis assays
A BD Annexin V-Fluorescein Isothiocyanate (FITC)
Apoptosis Detection Kit (BD Biosciences) was used to detect the
levels of apoptosis in SCC9, SCC25 and CAL27 cells according to the
manufacturer's instructions. The cells were digested with trypsin
and collected after centrifugation at 845 × g. Following
collection, the cells were washed twice with cold PBS. The cell
pellet (~1–5×10⁵ cells) was re-suspended in 500 µl
Binding Buffer. Then, 5 µl Annexin V-FITC and 5 µl PI were added
and mixed at room temperature (protected from light) for 20 min.
Within 1 h, the cells were detected by flow cytometry (BD
Biosciences). The green fluorescence of Annexin V-FITC was detected
through a FITC channel (FL1); and PI red fluorescence was detected
by a PI channel (FL2 or FL3). Cells that did not undergo
apoptosis-inducing treatment were used as the controls for
fluorescence compensation setting adjustments. Each experiment was
repeated three times.
Invasion and migration assays
Transwell migration and invasion assays were
performed with an 8-µm pore size transwell chamber (Corning Inc.,
Corning, NY, USA). For invasion assays, membranes were coated with
50 µl of growth factor-reduced Matrigel (BD Biosciences).
Serum-starved cells (80,000 cells/well) were plated into the upper
chamber in 200 µl of serum-free DMEM/F12. As the chemoattractant,
500 µl of complete medium was used in the lower chamber. For
migration and invasion assays, the cells were incubated for 24 h.
Assessment of migration and invasion was performed by gently
removing the cells in the interior part of the insert with a cotton
swab. Cells on the bottom of the membrane were fixed with 4%
paraformaldehyde for 20 min and stained with 1% crystal violet
solution. The excess dye was washed away and then dried for 20 min.
Fluorescence microscopy was performed and photographs were captured
while counting cells using Image Tool (Leica DM4000; Leica
Mocrosystems, Tokyo, Japan). In Transwell migration and invasion
assays, 100 nM miRNA inhibitor or 75 nM miRNA mimic or 100 nM
CYP3A5 siRNA were transfected 48 h prior to cell seeding on the
upper chamber. Each experiment was repeated three times.
Reverse transcription-quantitative
polymerase chain reaction (RT-qPCR)
Total RNAs were extracted using TRIzol reagent
(Thermo Fisher Scientific, Inc.) according to the manufacturer's
protocol and then quantified using NanoDrop 2000 (Thermo Fisher
Scientific, Inc.). The PrimeScript™ RT Reagent Kit (Takara
Biotechnology Co., Ltd., Dalian, China) was utilized for RT-PCR.
microRNAs were extracted using RNAiso reagent (Takara Biotechnology
Co., Ltd.) and then quantified using NanoDrop 2000 (Thermo Fisher
Scientific, Inc.). RT-qPCR was subsequently performed according to
the SYBR® Premix Ex Taq II ™ kit instructions (Takara
Biotechnology Co., Ltd.). The reaction conditions were as follows:
95°C for 30 sec; and 95°C for 5 sec, 55°C for 30 sec and 72°C for
30 sec for 40 cycles. Primers for the target genes are listed in
Table II. For each sample, gene
expression was analyzed using the 2−ΔΔCq method
(25). The results were normalized
against an internal control (U6 RNA for miRNAs or GAPDH for mRNA).
All experiments were repeated at least three times.
Western blotting
Cells were washed twice with ice-cold PBS and
re-suspended in ice-cold radioimmunoprecipitation assay buffer
containing 1 mmol/l phenylmethanesulfonyl fluoride and a cocktail
of protease inhibitors (1:100 dilution; Beyotime, Institute of
Biotechnology, Nantong, China). Samples were centrifuged at 10,140
× g at 4°C for 15 min. Supernatants were recovered and total
protein concentration was quantified using a bicinchoninic acid
protein assay kit (Beyotime, Institute of Biotechnology). Equal
amounts of protein were loaded and separated on 10% SDS-PAGE and
transferred to polyvinylidene fluoride membranes (PALL, Life
Sciences, Port Washington, NY, USA). The amount of protein loaded
per channel was 20 µg. Membranes were blocked for 2 h at room
temperature with 5% milk in PBS containing 0.05% Tween-20 (PBST),
and then incubated overnight with the following primary antibody
(1:1,000; cat. no. ab108624) and anti-β-actin (1:5,000; cat. no.
ab8227) (both from Abcam, Cambridge, UK). Membranes were then
washed three times with PBST, incubated with secondary antibody
anti-rabbit IgG H&L (HRP) (1:4,000; cat. no. ab205718) (Abcam)
for 2 h, washed three times with PBST, and visualized using an
Enhanced Chemiluminescence (ECL) system. β-actin served as the
internal loading control. The protein bands were quantified by
densitometry using QuantityOne software (Bio-Rad, Laboratories,
Inc., Hercules, CA, USA), and the values are expressed relative to
β-actin. Each experiment was repeated three times.
miRNA target gene prediction
The relationship between miRNAs and genes was
predicted by miRNA target prediction software based on TargetScan
(http://www.targetscan.org) and miRDB
(http://www.mirdb.org/). Target genes associated
with target score and growth or proliferation were screened and
then verified in OSCC cell lines. Some of target genes are listed
in Tables III and IV.
| Table III.Partial list of target genes of
miR-543 predicted by TargetScan. |
Table III.
Partial list of target genes of
miR-543 predicted by TargetScan.
| Cumulative weighted
context++ score | Representative
miRNA | Target gene | Gene name |
|---|
| −0.58 | hsa-miR-543 | CYP3A5 | Cytochrome P450,
family 3, subfamily A, polypeptide 5 |
| −0.55 | hsa-miR-543 | NANP | N-acetylneuraminic
acid phosphatase |
| −0.53 | hsa-miR-543 | FBXO34 | F-box protein
34 |
| −0.45 | hsa-miR-543 | TMEM203 | Transmembrane
protein 203 |
| −0.45 | hsa-miR-543 | TAF13 | TAF13 RNA
polymerase II, TATA box binding protein (TBP)-associated factor, 18
kDa |
| −0.39 | hsa-miR-543 | TNFSF11 | Tumor necrosis
factor (ligand) superfamily, member 11 |
| −0.38 | hsa-miR-543 | FBXO47 | F-box protein
47 |
| −0.38 | hsa-miR-543 | CYB5R4 | Cytochrome b5
reductase 4 |
| −0.37 | hsa-miR-543 | FMNL2 | Formin-like 2 |
| −0.37 | hsa-miR-543 | KIN | KIN, antigenic
determinant of recA protein homolog (mouse) |
| −0.37 | hsa-miR-543 | SCP2 | Sterol carrier
protein 2 |
| −0.36 | hsa-miR-543 | PCBP1 | poly(rC) binding
protein 1 |
| −0.36 | hsa-miR-543 | EIF1 | Eukaryotic
translation initiation factor 1 |
| −0.35 | hsa-miR-543 |
SERPINI1 | Serpin peptidase
inhibitor, clade I (neuroserpin), member 1 |
| −0.33 | hsa-miR-543 | C3orf14 | Chromosome 3 open
reading frame 14 |
| −0.33 | hsa-miR-543 | ING1 | Inhibitor of growth
family, member 1 |
| Table IV.Partial list of target genes of
miR-543 predicted by miRDB. |
Table IV.
Partial list of target genes of
miR-543 predicted by miRDB.
| Target score | miRNA name | Gene symbol | Gene
description |
|---|
| 100 | hsa-miR-543 | FBXO34 | F-box protein
34 |
| 99 | hsa-miR-543 | TBC1D1 | TBC1 domain family
member 1 |
| 99 | hsa-miR-543 | DMXL2 | Dmx like 2 |
| 99 | hsa-miR-543 | ONECUT2 | One cut homeobox
2 |
| 99 | hsa-miR-543 | NWD2 | NACHT and WD repeat
domain containing 2 |
| 99 | hsa-miR-543 | MAPK1 | Mitogen-activated
protein kinase 1 |
| 99 | hsa-miR-543 | GPCPD1 |
Glycerophosphocholine phosphodiesterase
1 |
| 99 | hsa-miR-543 | LIFR | LIF receptor α |
| 99 | hsa-miR-543 | KLHL5 | Kelch like family
member 5 |
| 99 | hsa-miR-543 | PER3 | Period circadian
regulator 3 |
| 99 | hsa-miR-543 | ANO5 | Anoctamin 5 |
| 98 | hsa-miR-543 | IL1A | Interleukin 1
α |
| 98 | hsa-miR-543 | FMNL2 | Formin like 2 |
| 97 | hsa-miR-543 | TNFSF11 | TNF superfamily
member 11 |
| 96 | hsa-miR-543 | PRKG1 | Protein kinase
cGMP-dependent 1 |
| 96 | hsa-miR-543 | NR3C1 | Nuclear receptor
subfamily 3 group C member 1 |
| 96 | hsa-miR-543 | CYB5R4 | Cytochrome b5
reductase 4 |
| 93 | hsa-miR-543 | BIRC6 | Baculoviral IAP
repeat containing 6 |
| 92 | hsa-miR-543 | ING1 | Inhibitor of growth
family member 1 |
| 82 | hsa-miR-543 | BCL6B | BCL6B,
transcription repressor |
Correlation analysis (26)
According to the expression levels of miR-543 and
CYP3A5 in 20 pairs of OSCC tissues, the correlation of expression
levels was analyzed, and the correlation equation was calculated
statistically to obtain the linear regression relationship. First,
we analyzed the expression level of miR-543 and CYP3A5 in 20 pairs
of OSCC tissues by linear regression. The Enter regression method
was used to obtain the linear regression equation and R value. Then
we used the Enter method to verify the equation.
mRNA profile data and miRNA survival
analysis
The UALCAN (http://ualcan.path.uab.edu/) data from The Cancer
Genome Atlas (TCGA), was then used to online analyze the gene
CYP3A5 expression in head and neck squamous cell carcinoma (HNSC)
(27). OncoLnc (http://www.oncolnc.org) was used as a tool for
interactively exploring survival correlations (28). OncoLnc dataset contains survival data
for 250 patients from HNSC cancer studies performed by TCGA.
Luciferase dual-reporter assays
293T cells are most commonly used in dual luciferase
reporter gene assays (29,30). 293T cells were obtained from the
Center Laboratory of Stomatology Hospital of Guangzhou Medical
University (Guangdong, China). 293T cells were co-transfected with
the miR-543-expressing plasmid or control vector, the indicated
firefly luciferase reporter plasmids and a Renilla
luciferase plasmid with a ratio of 2:2:1 (31,32).
Lysates were collected 72 h post-transfection. Firefly and
Renilla luciferase activities were measured using a
Dual-Luciferase Reporter System (Promega Corporation, Madison, WI,
USA). Detection value ratio=Renilla luciferase detection
value/firefly luciferase detection value.
Immunohistochemistry (IHC)
IHC staining of human OSCC tissues was performed on
deparaffinized OSCC tissue sections using primary antibody against
CYP3A5 (dilution, 1:100; cat. no. ab108624; Abcam) overnight at
4°C. For the negative control for immunohistochemistry analysis,
the primary antibody was replaced with normal IgG (dilution 1:100;
cat. no. ab172730; Abcam) overnight at 4°C. The slides were
subsequently treated with biotinylated anti-rabbit secondary
antibody anti-rabbit IgG H&L (HRP) (dilution 1:4,000; cat. no.
ab205718; Abcam) and counterstained with hematoxylin. Control
experiments were performed using non-immune immunoglobulins as
opposed to specific antibody. Immunostained images were captured
using a digital camera; five images were captured at random.
Statistical analysis
SPSS 20.0 software (IBM Corp., Armonk, NY, USA) was
used for statistical analysis, and the data are presented as the
mean ± standard error of the mean. Statistical analysis was
performed using a paired t-test or one-way analysis of variance
(ANOVA). The data of three or more groups were evaluated using
analysis of variance and least significant difference (LSD) post
hoc tests when the variance was normal. P<0.05 was considered to
indicate a statistically significant difference. All experiments
were conducted at least three times.
Results
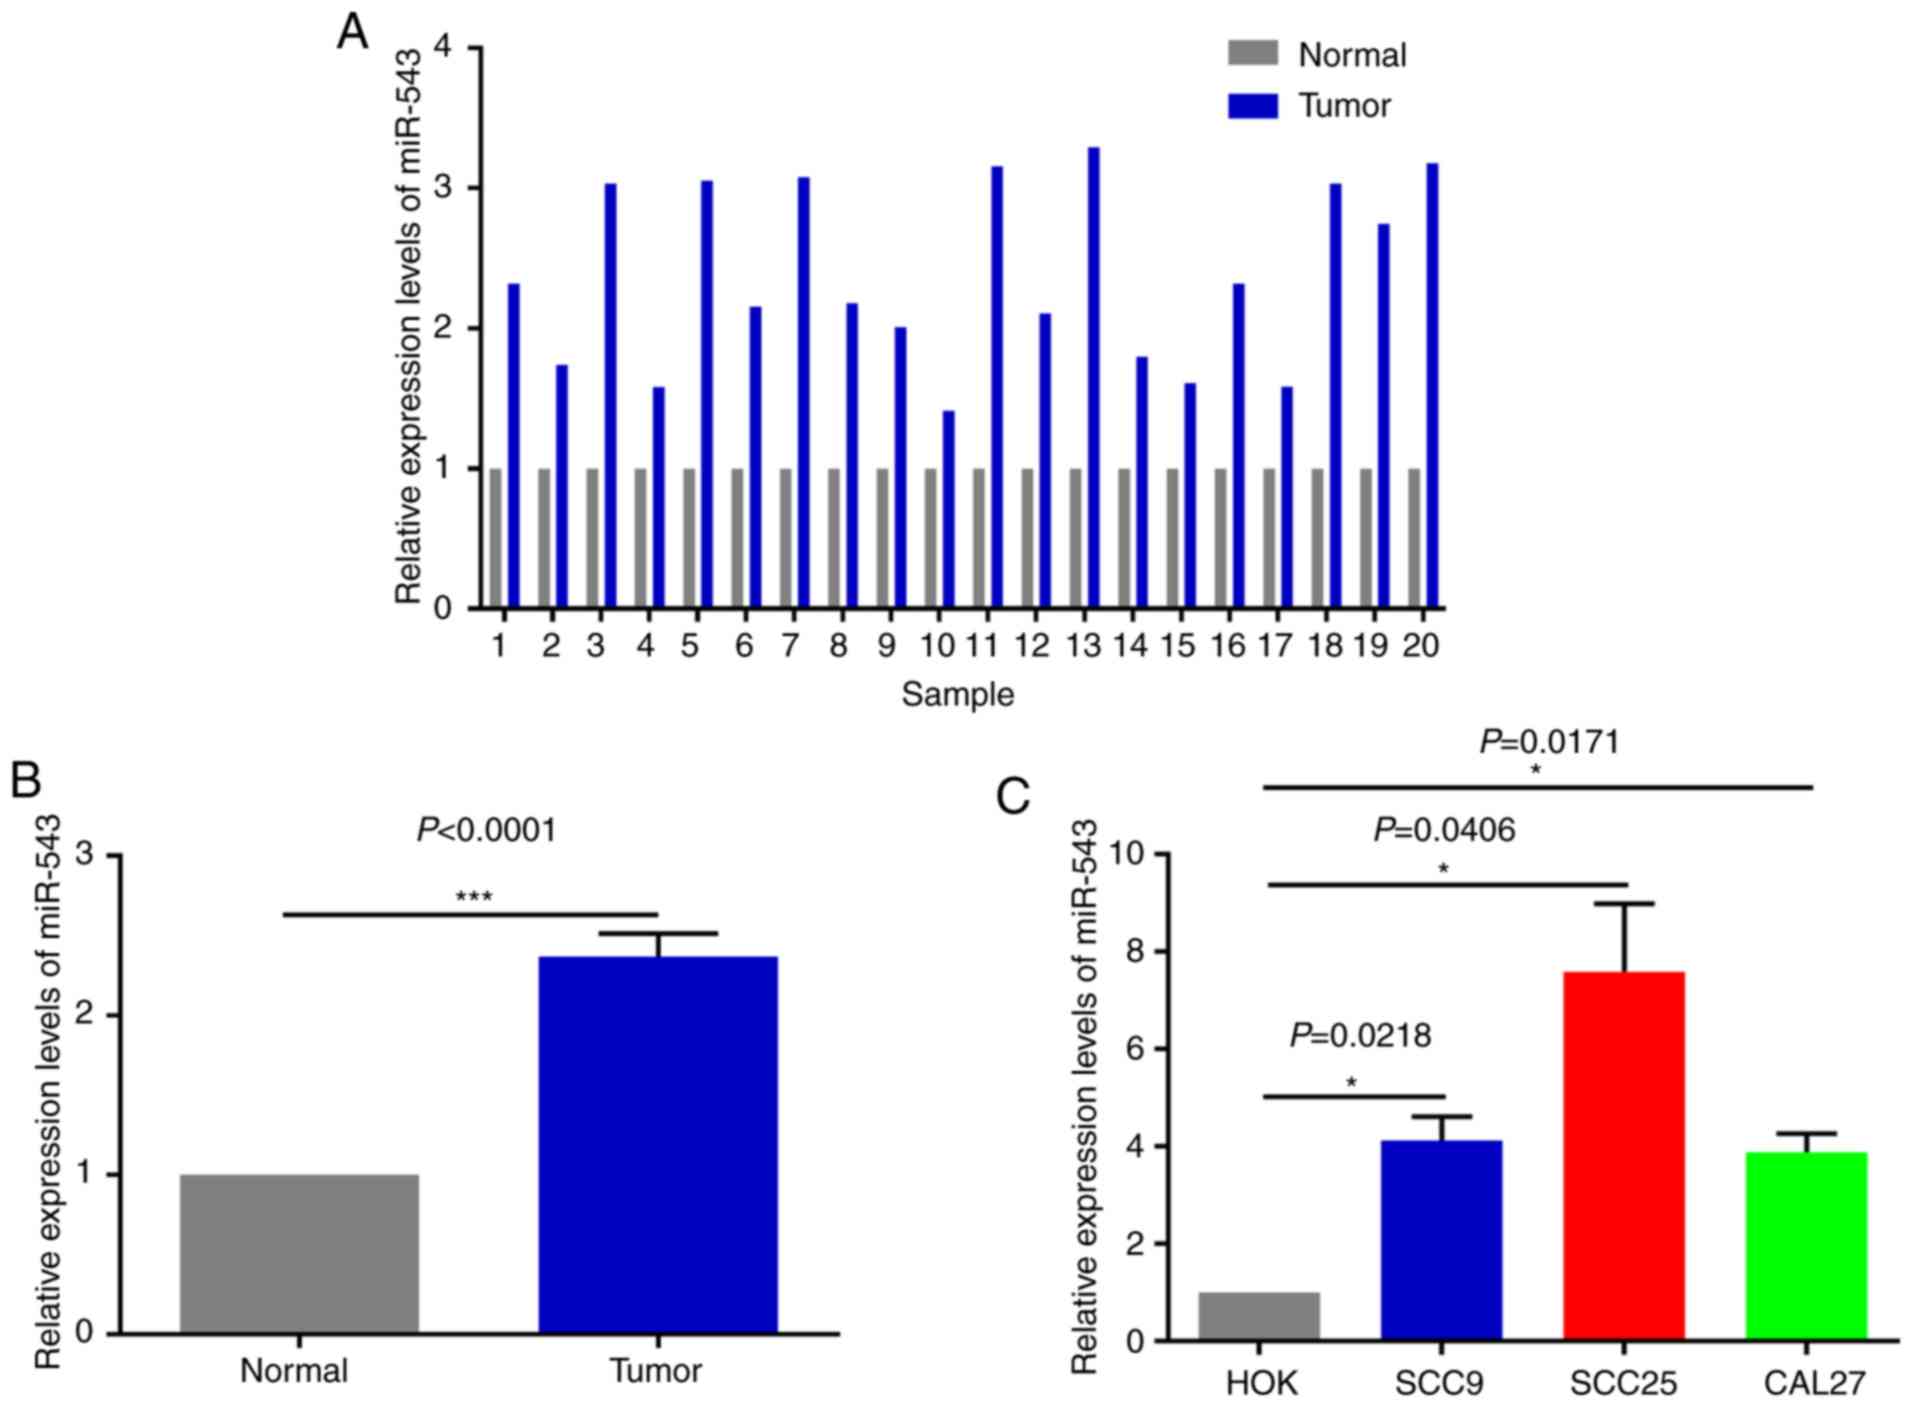
High expression of miR-543 in OSCC
cell lines and human tissues
In order to investigate the potential mechanism of
miR-543 in OSCC, the expression of miR-543 was detected by RT-qPCR
in 20 pairs of OSCC tissues and adjacent non-tumor tissues obtained
during clinical operations (Fig. 1A).
The results of RT-qPCR demonstrated that miR-543 was significantly
increased in cancerous tissues when compared with that noted in the
adjacent non-tumor tissues (Fig. 1B;
P<0.0001). In order to further determine the role of miR-543 in
OSCC, the gene expression levels of miR-543 in the OSCC cell lines
SCC9, SCC25 and CAL27 were detected. When compared with human
normal oral keratinocytes (HOK) cells, miR-543 exhibited a higher
expression in SCC9, SCC25 and CAL27 cells (Fig. 1C).
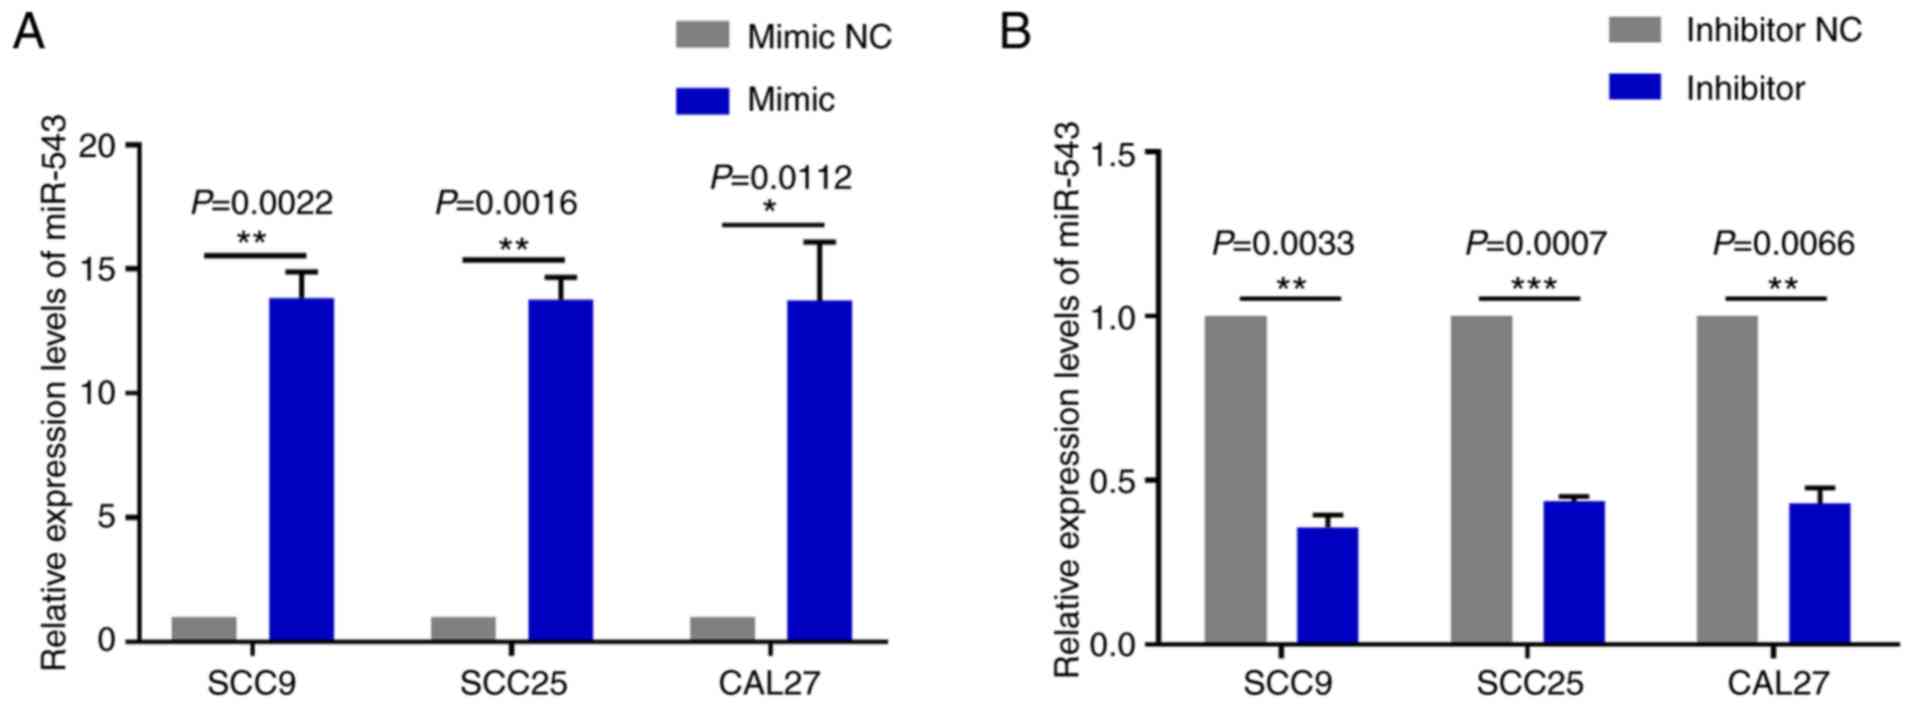
miR-543 promotes the growth of OSCC
cell lines in vitro
To investigate the mechanism of action underlying
miR-543 in OSCC, the present study attempted to determine whether
miR-543 affects OSCC cell line proliferation. SCC9, SCC25 and CAL27
cells were transfected with mimic NC, miR-543 mimic, inhibitor NC
or miR-543 inhibitor; the results demonstrated a high transfection
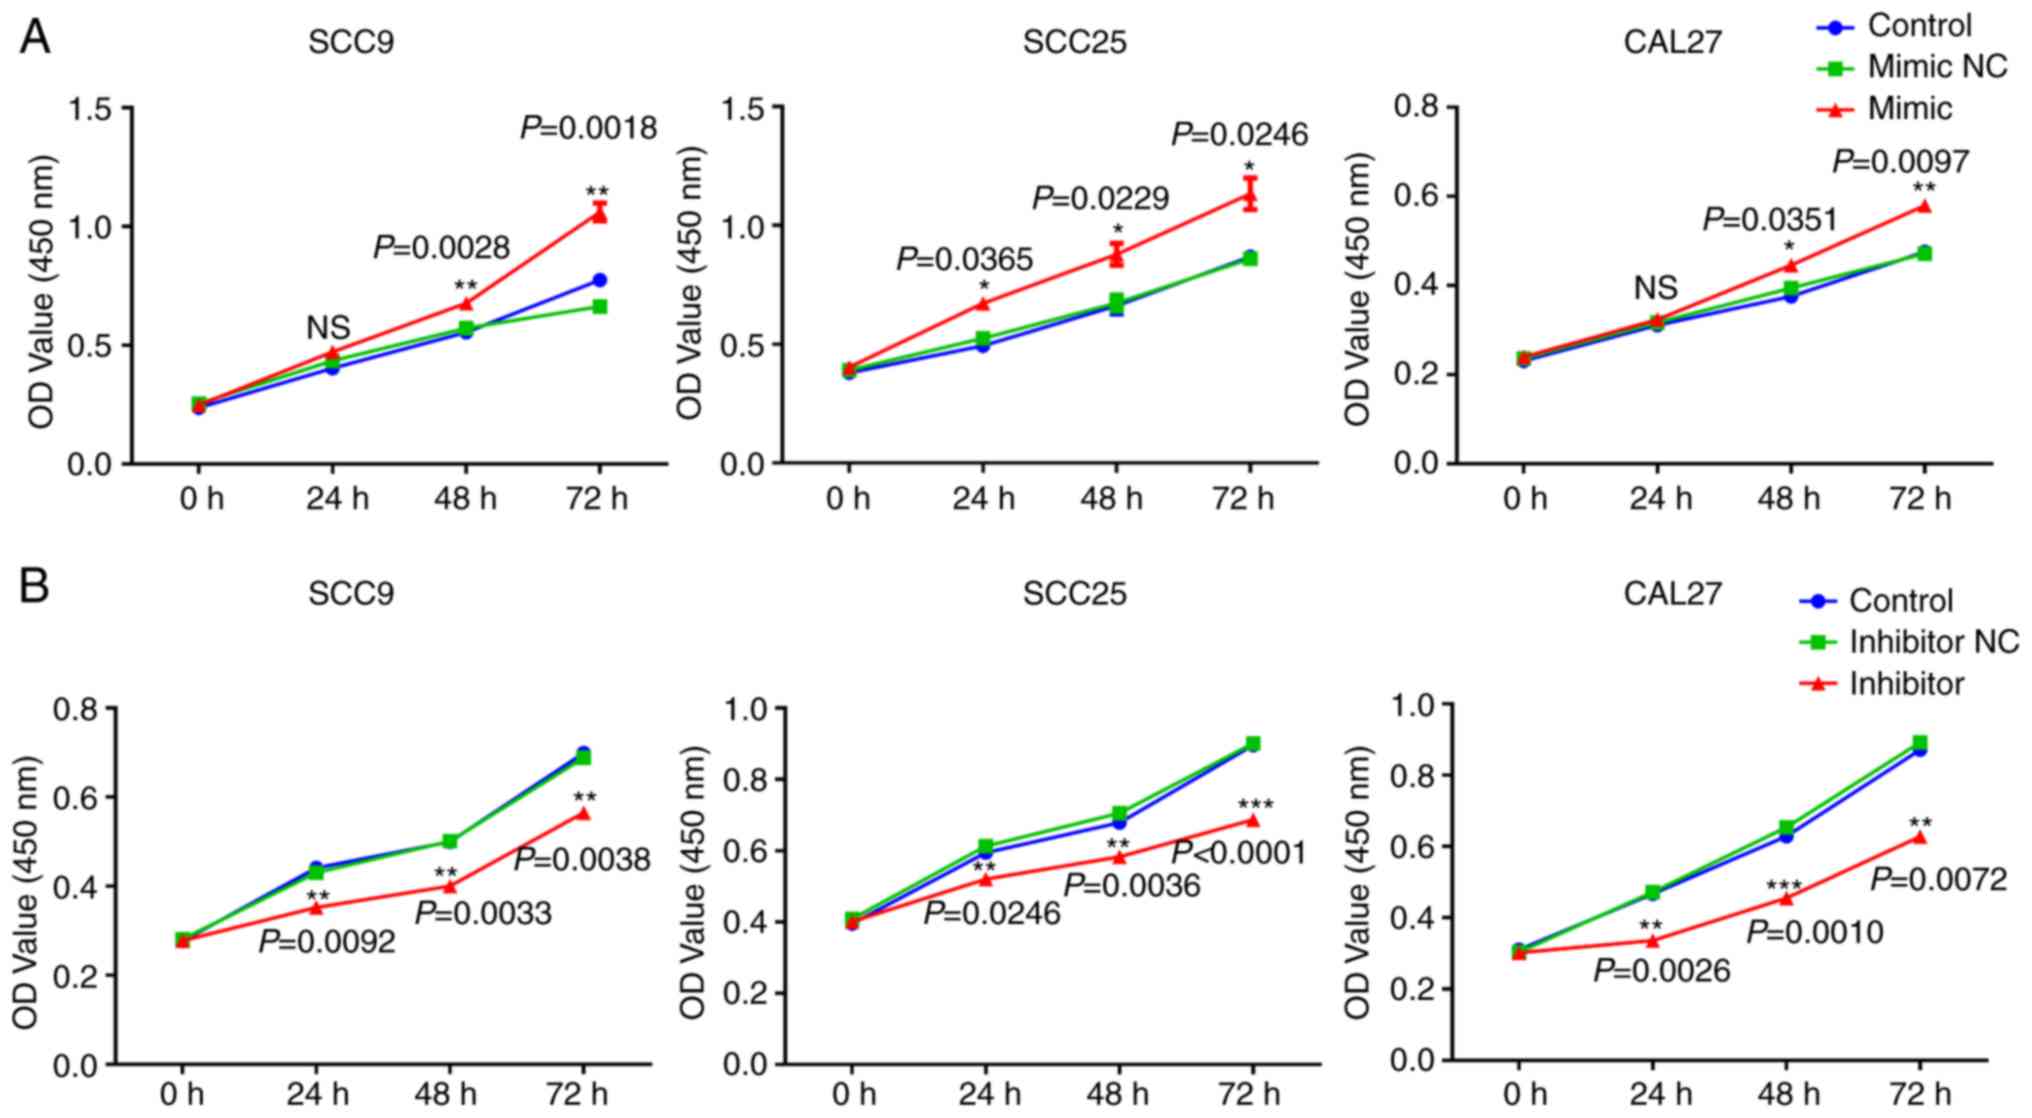
efficiency (Fig. 2A and B). The CCK-8
assay results indicated that when compared with the NC group,
overexpression of miR-543 significantly increased the proliferation
of OSCC cell lines (Fig. 3A). By
contrast, miR-543 inhibitor significantly decreased the
proliferation of OSCC cell lines (Fig.
3B). In addition, the clone formation rates of the miR-543
mimic groups were increased when compared to the NC groups
(Fig. 3C), whereas in the miR-543
inhibitor groups, the opposite results were observed for the clone
formation rates of the three cell lines (Fig. 3D).
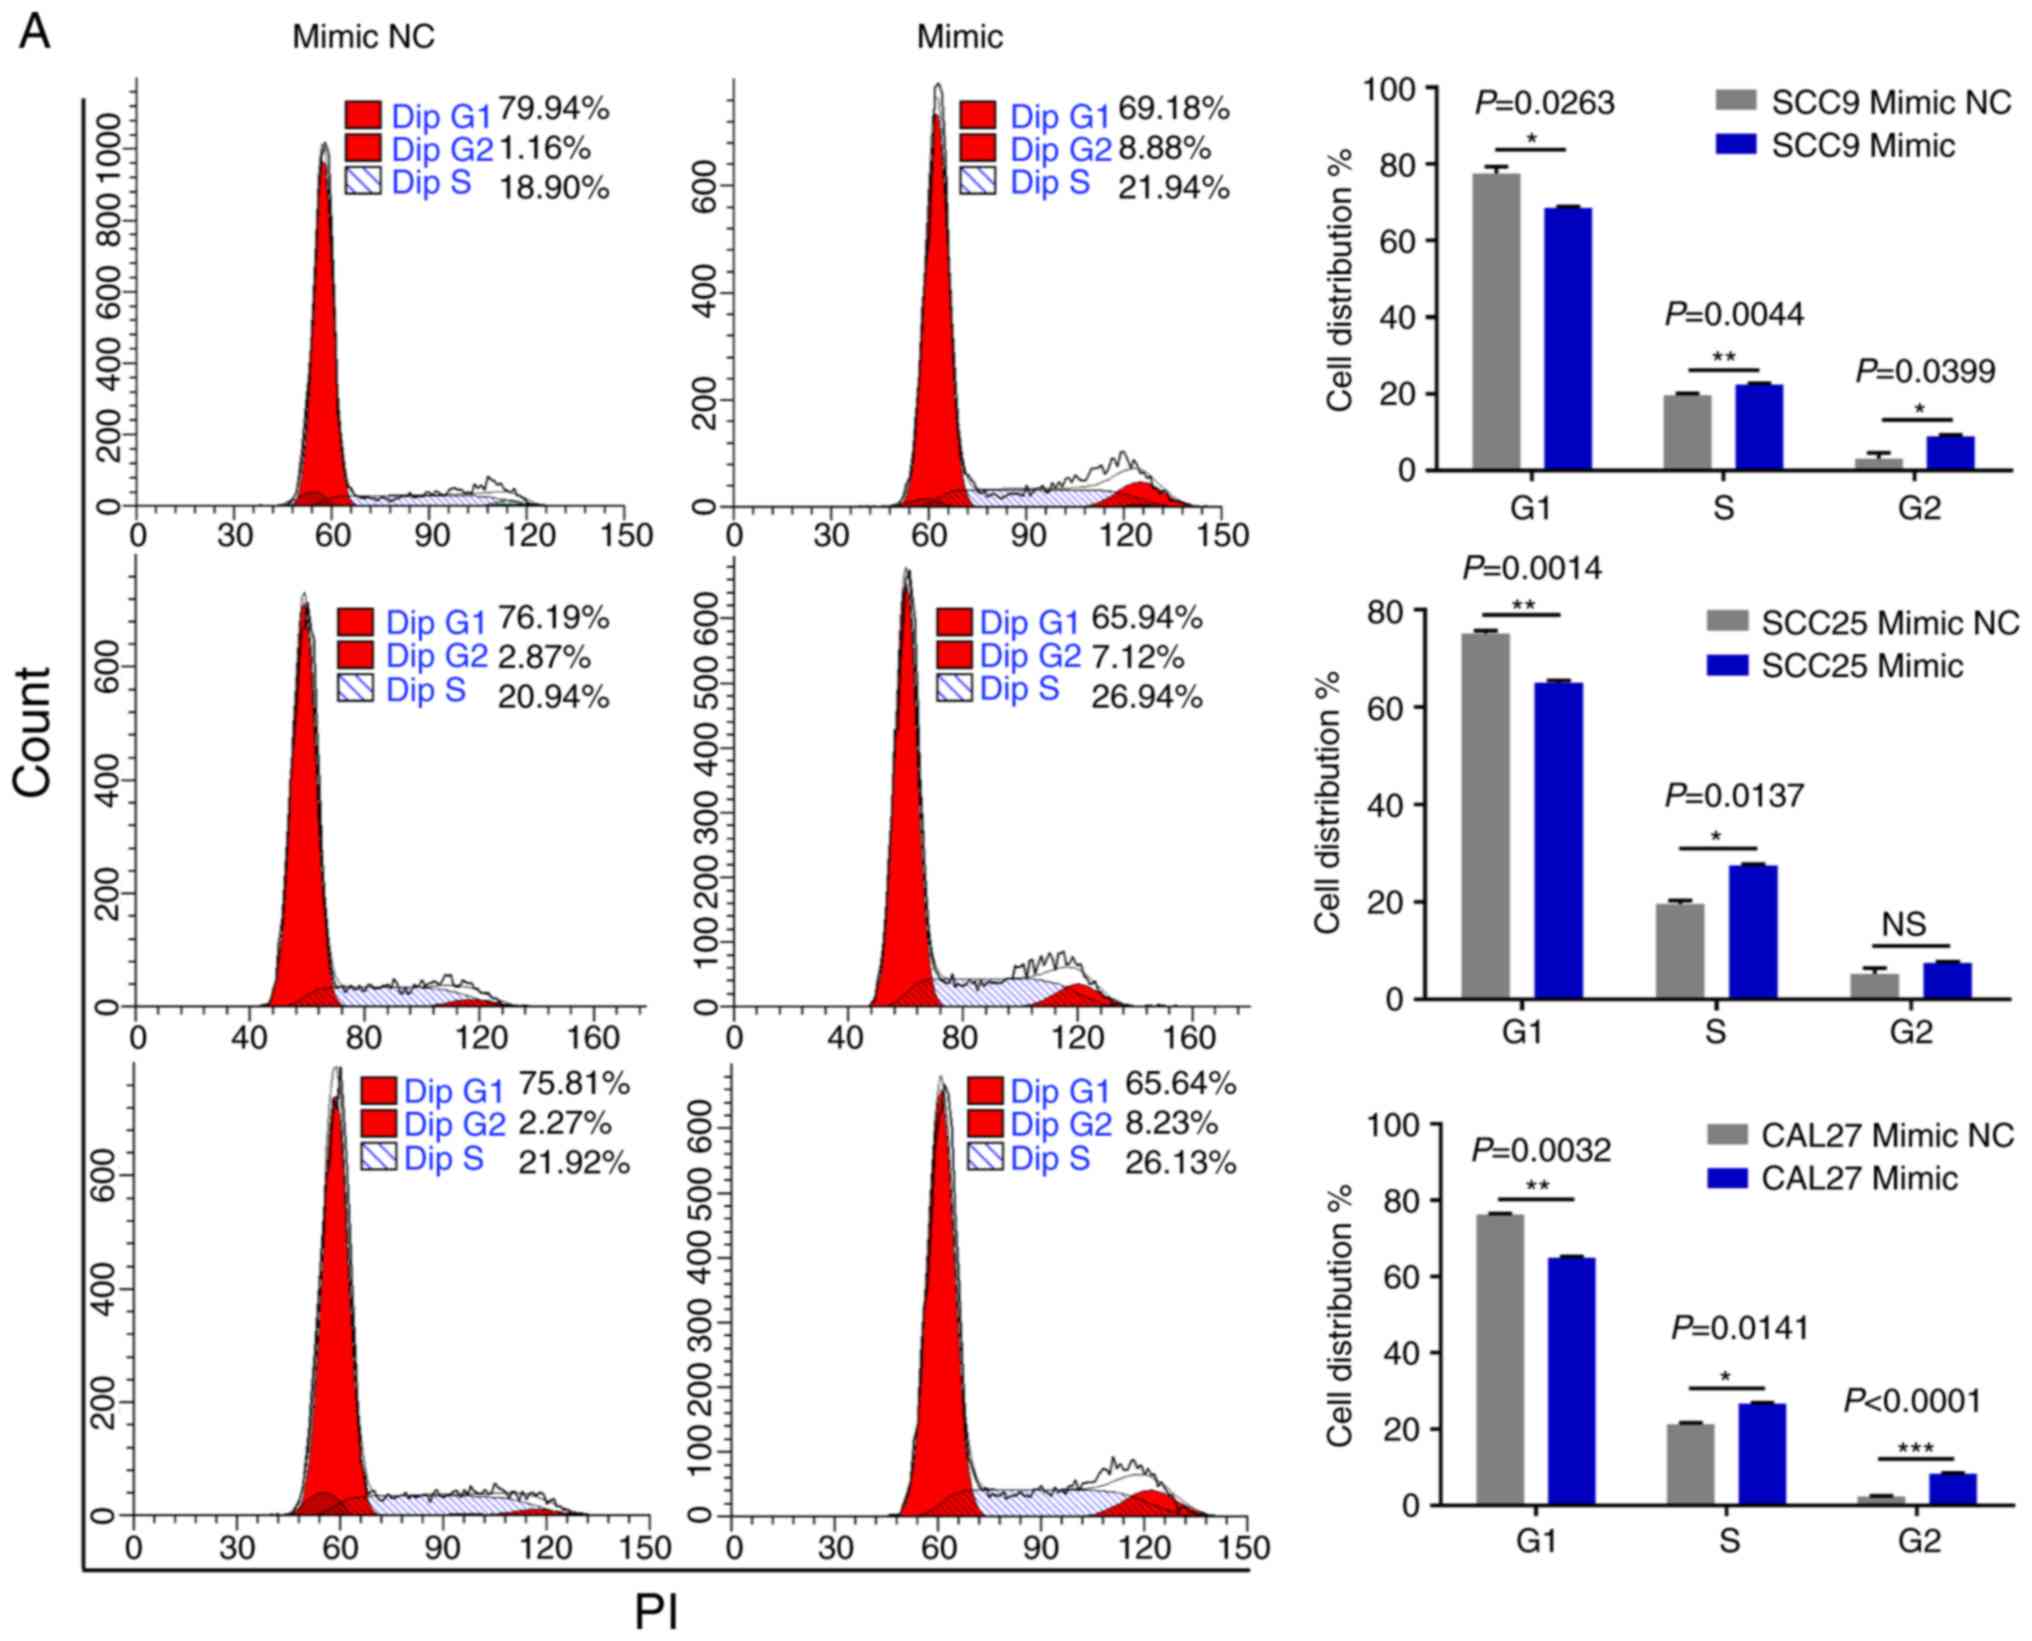
miR-543 promotes the cell cycle and
inhibits cell apoptosis in OSCC cell lines
As miR-543 promoted the proliferation of OSCC cells,
the present study then performed cell cycle assays. OSCC cell lines
treated with miR-543 mimics had a significantly reduced cell
population in the G1 phase and increased cell populations in the G2
phase when compared with the mimic NC group, as determined by flow
cytometry (Fig. 4A). By contrast,
transfection with the miR-543 inhibitors induced G1 arrest in OSCC
cell lines (Fig. 4B). Subsequently,
cell apoptosis was measured using a flow cytometer. As expected,
the apoptotic rate was declined when cells were transfected with
miR-543 mimics (Fig. 5A), while the
apoptotic rate was increased in the miR-543 inhibitor groups
(Fig. 5B). In summary, results
indicated that miR-543 may act as an oncogene in OSCC.
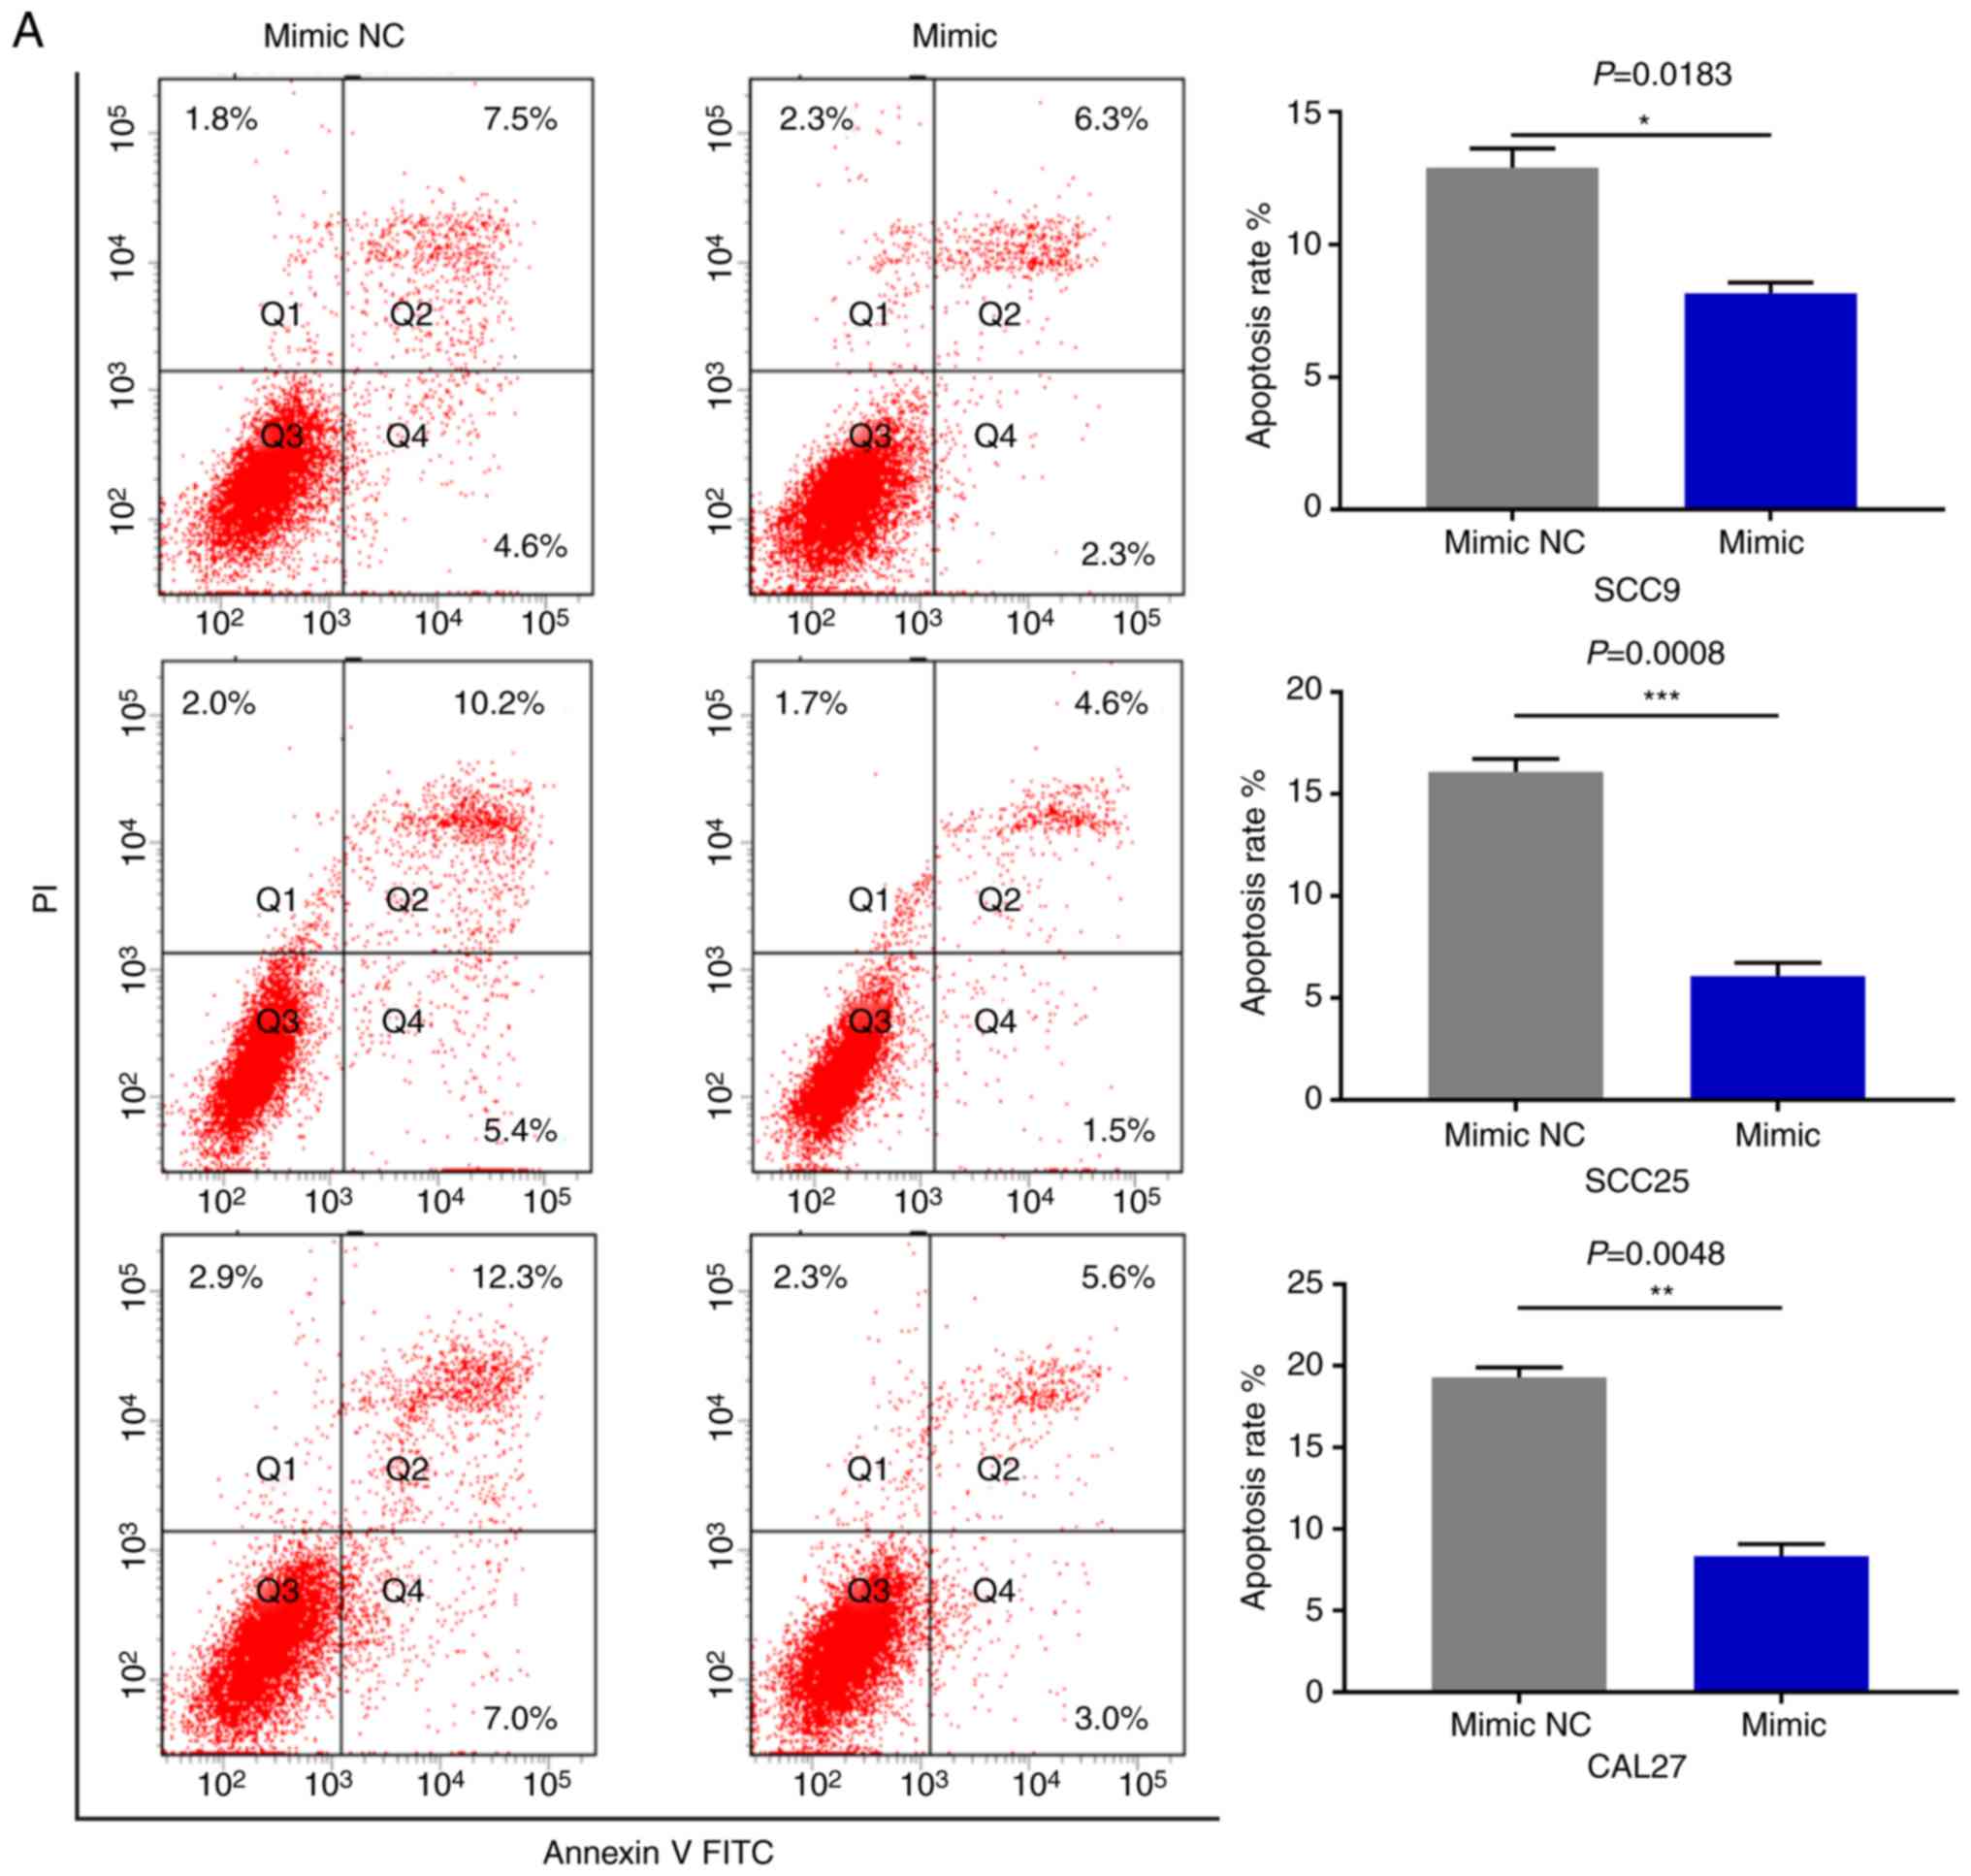 | Figure 5.miR-543 inhibits the cell apoptosis
of OSCC cell lines. FCM was used to detect the cell apoptosis. (A)
FCM revealed that the apoptotic rates of SCC9, SCC25 and CAL27
cells were decreased by 5.07, 9.37 and 10.97% on average following
transfection with the miR-543 mimic, respectively. FCM, flow
cytometry; miR, microRNA; OSCC, oral squamous cell carcinoma; NC,
negative control. (B) The apoptotic rates of SCC9, SCC25 and CAL27
cells were increased by 7.83, 8.33 and 7.8% on average following
transfection with the miR-543 inhibitor, respectively. *P<0.05,
**P<0.01, ***P<0.001. FCM, flow cytometry; miR, microRNA;
OSCC, oral squamous cell carcinoma; NC, negative control. |
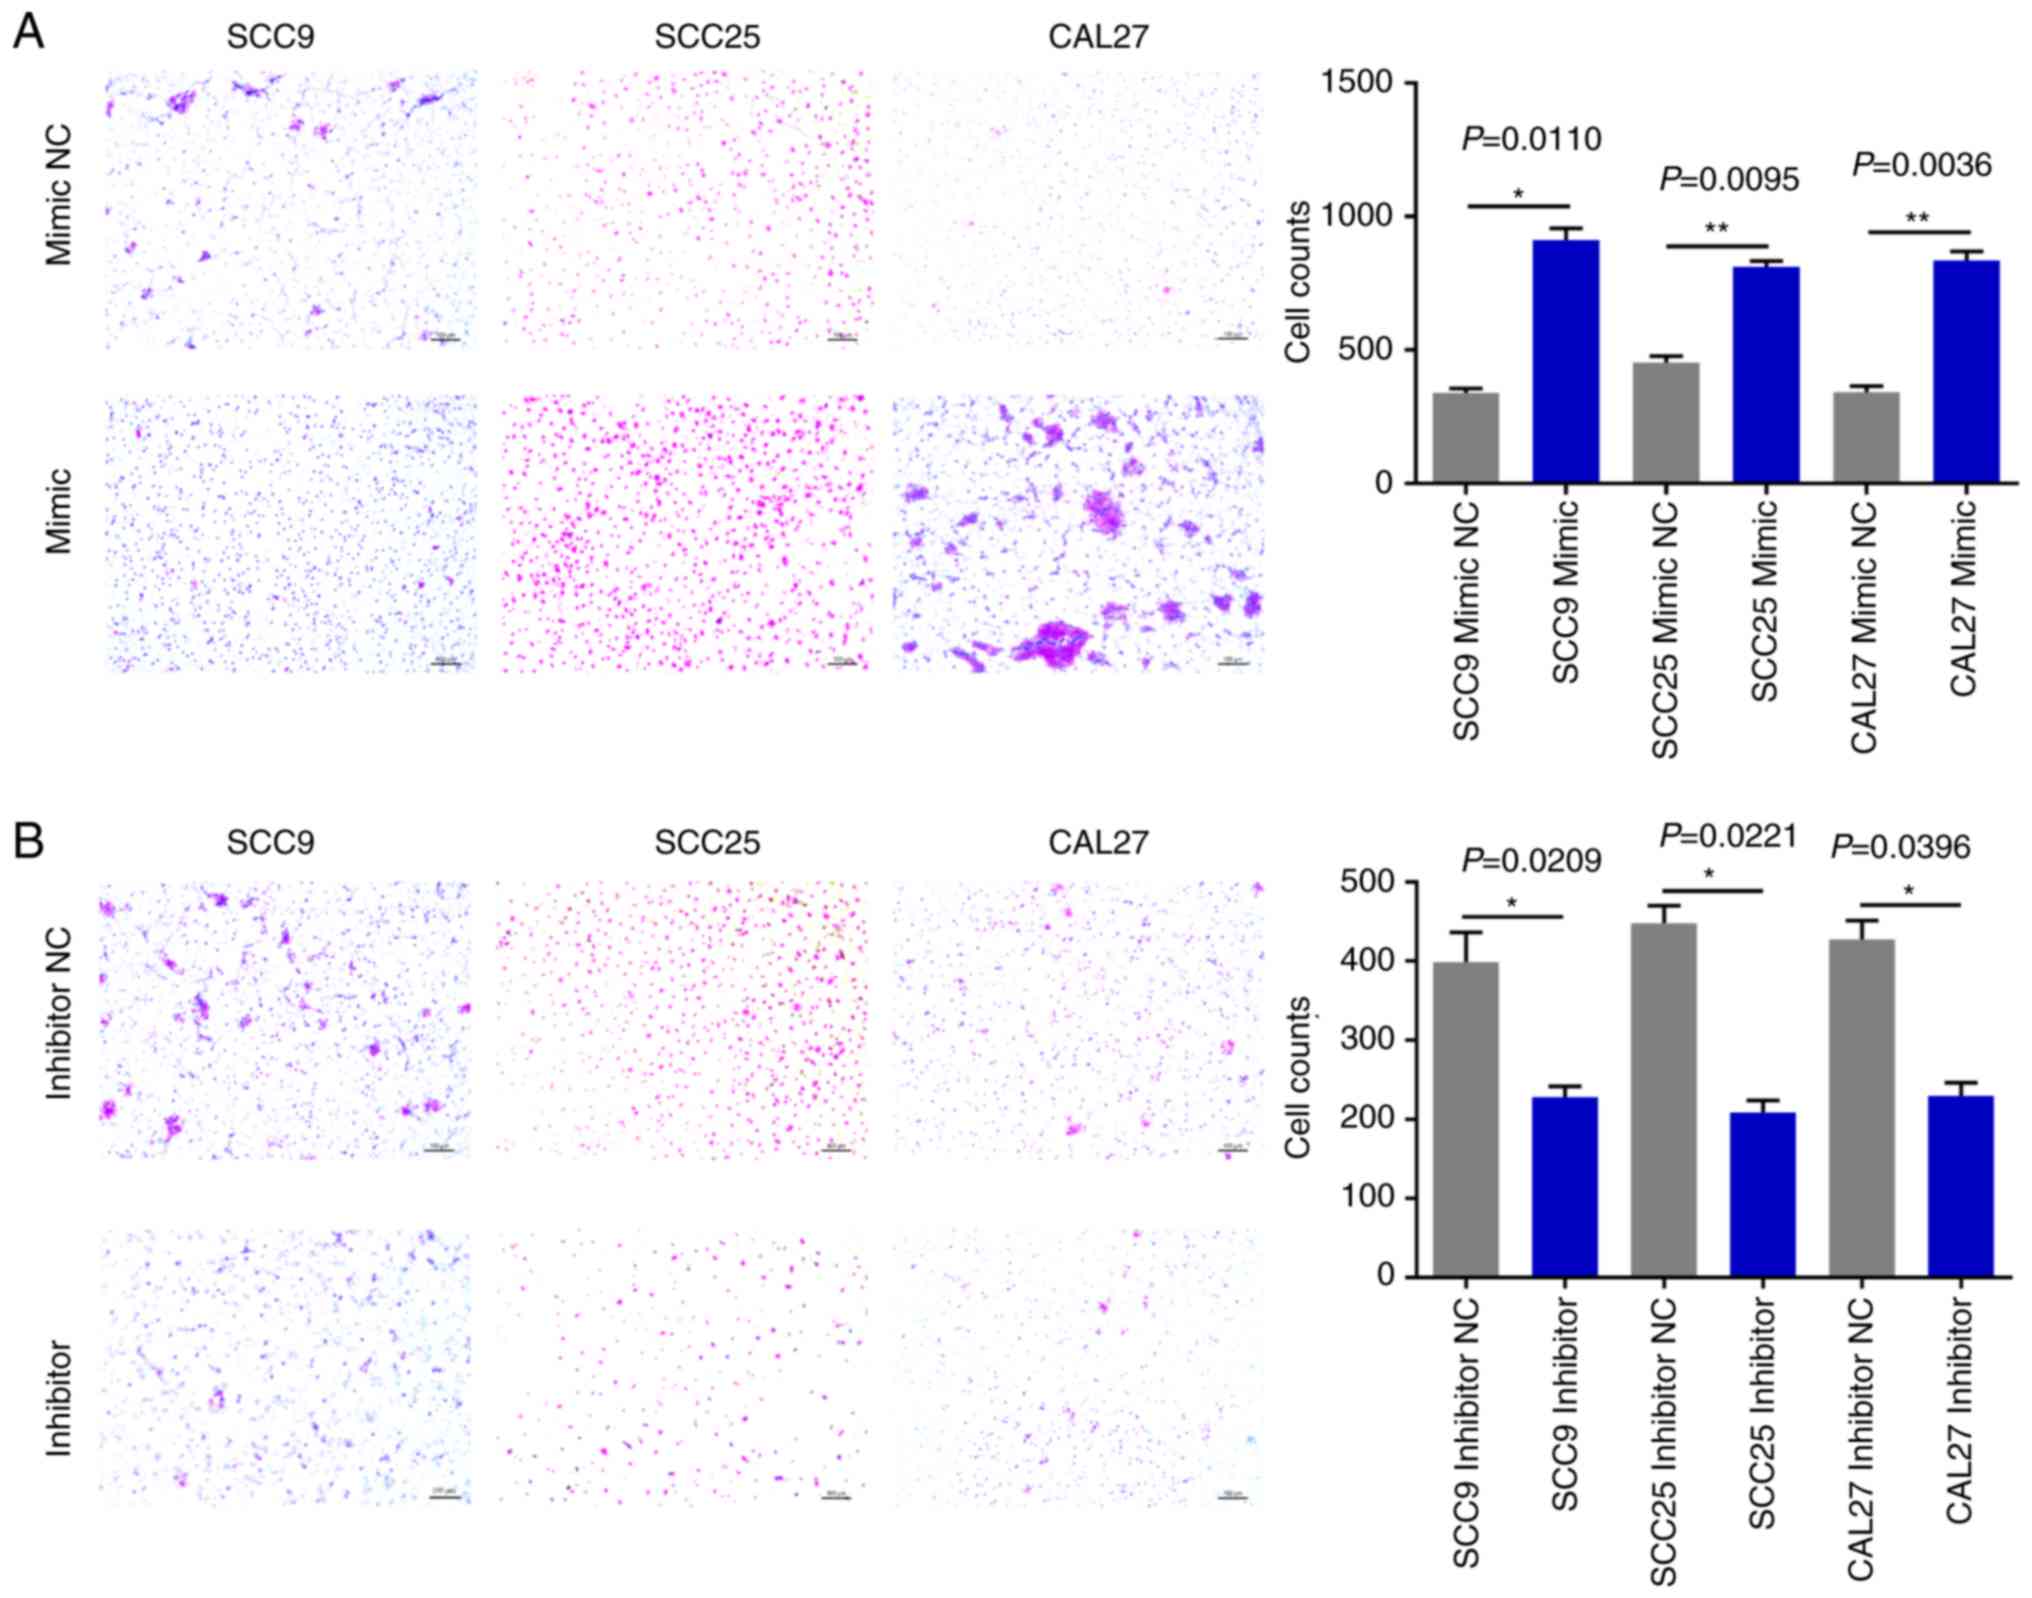
miR-543 promotes OSCC cell line
invasion and migration
The effects of miR-543 on OSCC cell migration and
invasion were then evaluated. The Matrigel Transwell assays
revealed that compared with the NC groups, miR-543 mimics
significantly increased OSCC cell invasion (Fig. 6A). By contrast, the miR-543 inhibitor
groups exhibited markedly reduced invasion in the three cell lines
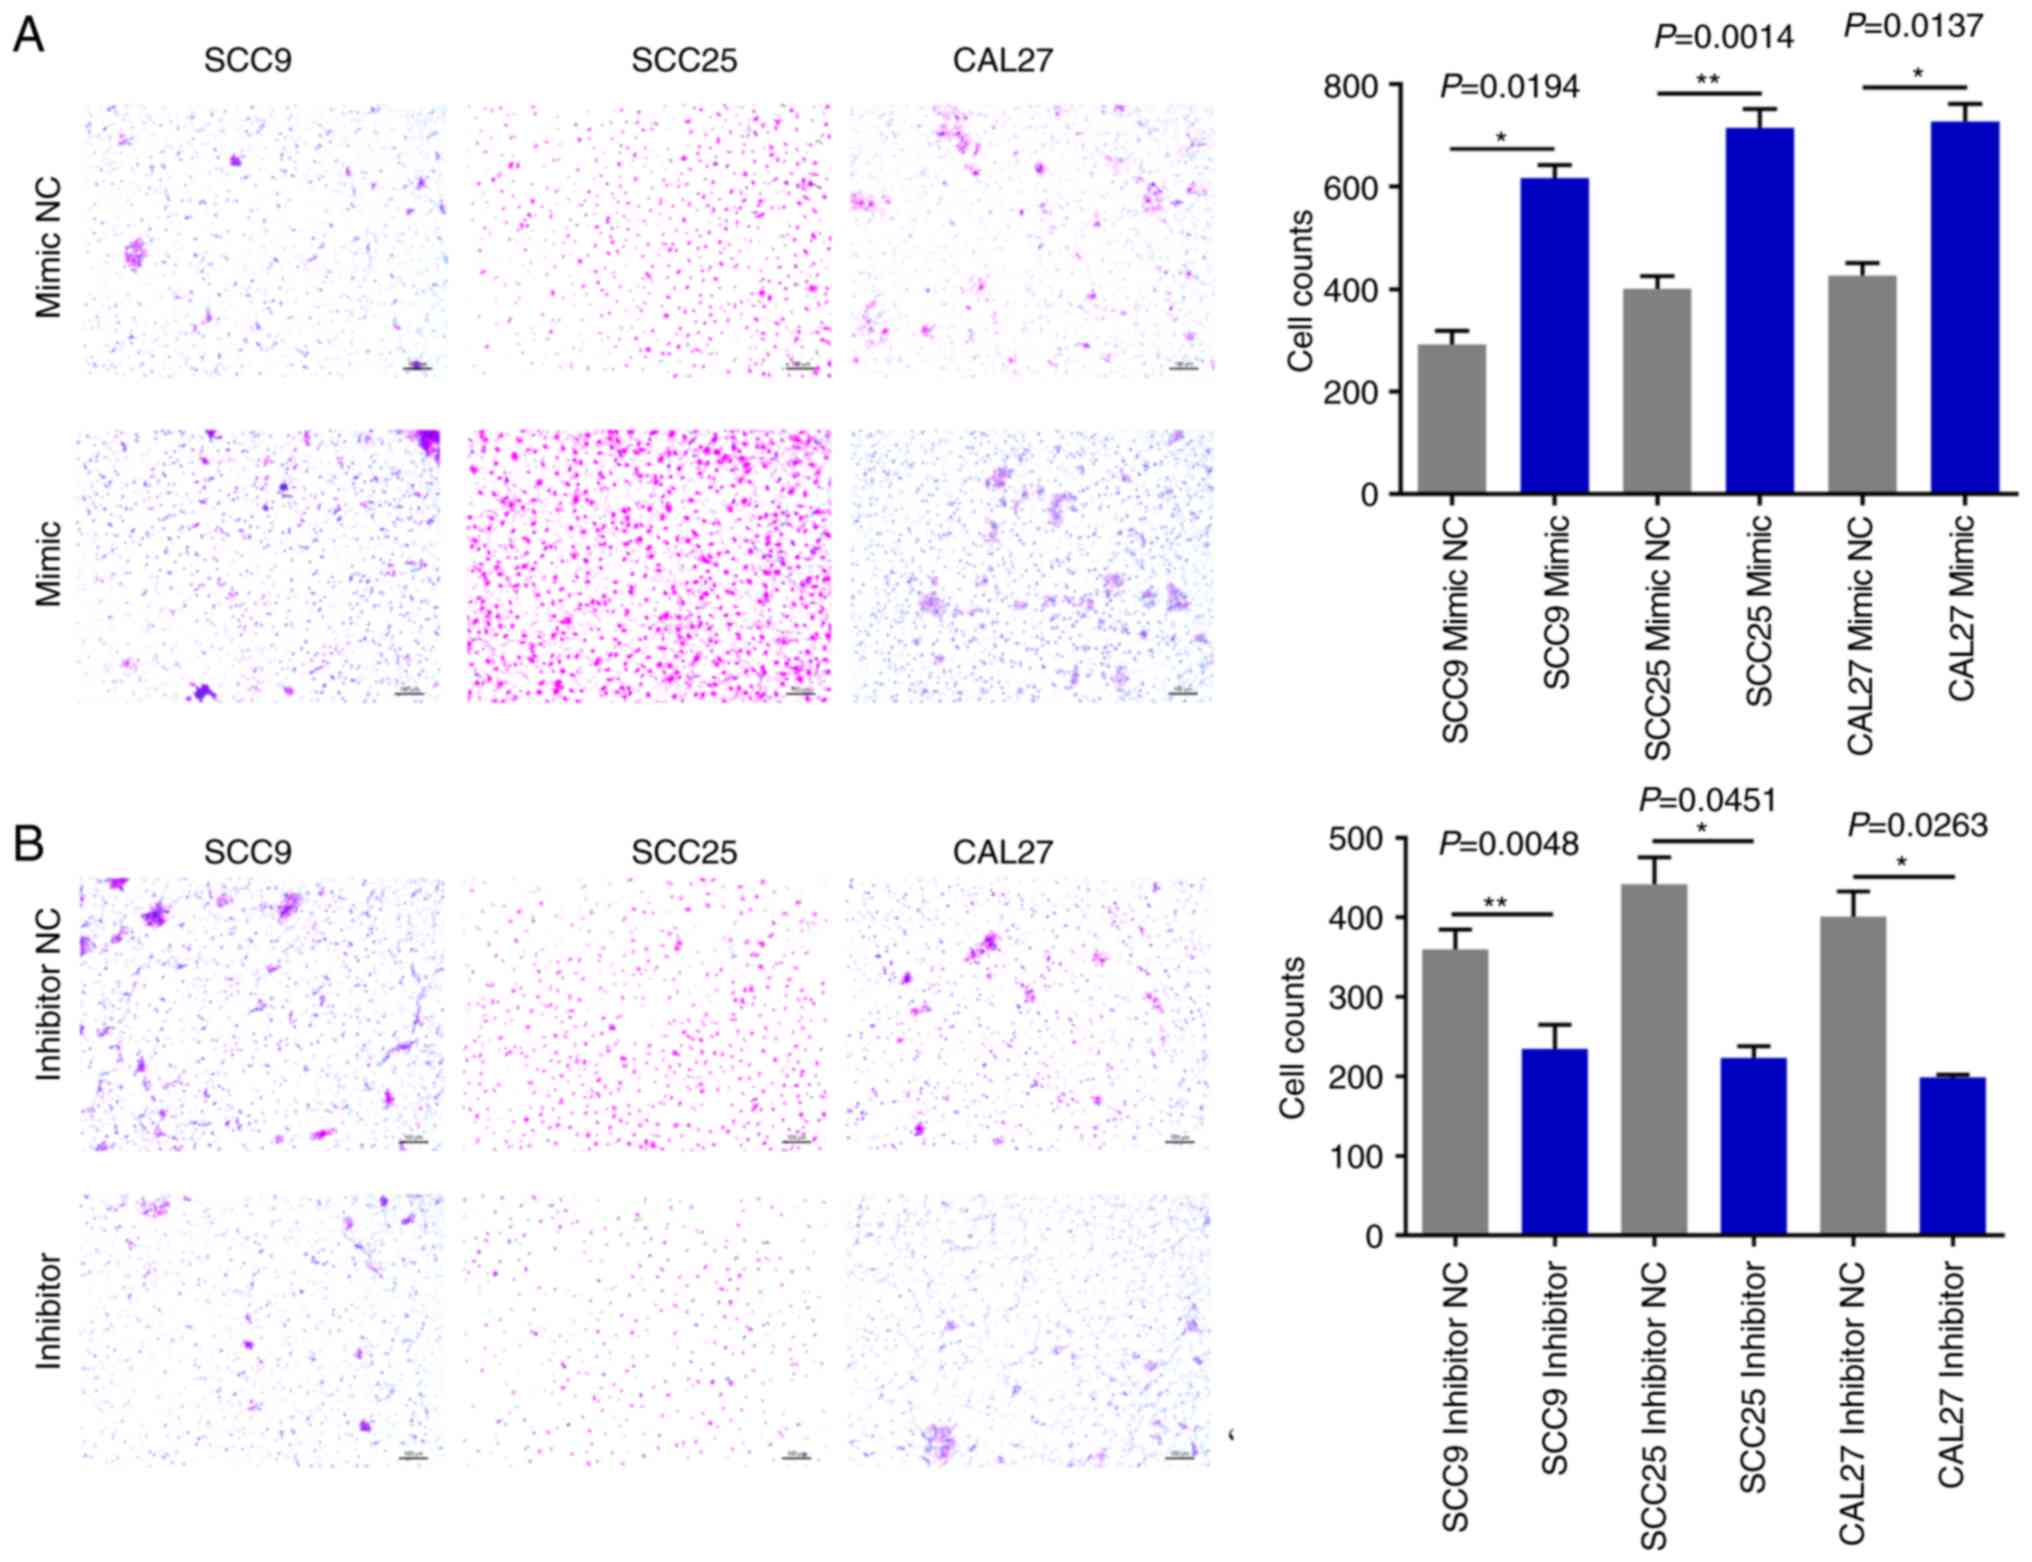
(Fig. 6B). In addition, the Transwell
assays demonstrated that overexpression of miR-543 promoted the
migration of OSCC cell lines (Fig.
7A); whereas, the miR-543 inhibitor significantly decreased
cell migration in the OSCC cell lines (Fig. 7B). The experiments carried out in
Figs. 2–7 utilized OSCC cell lines for self-control
experiments to observe phenotypic changes of cancer cells by
upregulating or downregulating the expression of miR-543 (33).
CYP3A5 is a direct target gene of
miR-543
In order to detect miR-543 effector protein
molecules, the present study used the bioinformatics website
TargetScan to predict the potential target genes of miR-543. Target
genes associated with growth or proliferation were screened and
then verified in OSCC cell lines. The results revealed that CYP3A5
was significantly negatively correlated with miR-543, and only
CYP3A5 was significantly expressed at low levels in the three OSCC
cell lines when compared with a number of target genes (Fig. 8A). Therefore, the present study aimed
to verify whether CYP3A5 is a downstream target gene of miR-543.
First of all, the possible binding sites between CYP3A5 and miR-543
were predicted using TargetScan (Fig.
8B). Then luciferase reporter gene assays were performed using
co-transfected miR-543 mimic or mimic NC and the CYP3A5 3′
untranslated region (3′UTR) wild-type (WT) or CYP3A5 3′-UTR mutant
(MUT) in 293T cells. The overexpression of miR-543 significantly
reduced the luciferase activity of WT CYP3A5 3′UTR, while the MUT
CYP3A5 3′UTR induced virtually no change (Fig. 8C). Therefore, it was confirmed that
CYP3A5 directly binds with miR-543, and that CYP3A5 acts as a
downstream target gene of miR-543 in order to exert its influence
on OSCC. In addition, the present study measured the changes in the
mRNA and protein levels of CYP3A5 by upregulating or downregulating
miR-543. The results revealed that the mRNA and protein expressions
of CYP3A5 were decreased following miR-543 overexpression in the
three OSCC cell lines (Fig. 8D and
F). By contrast, the mRNA and protein expression of CYP3A5 was
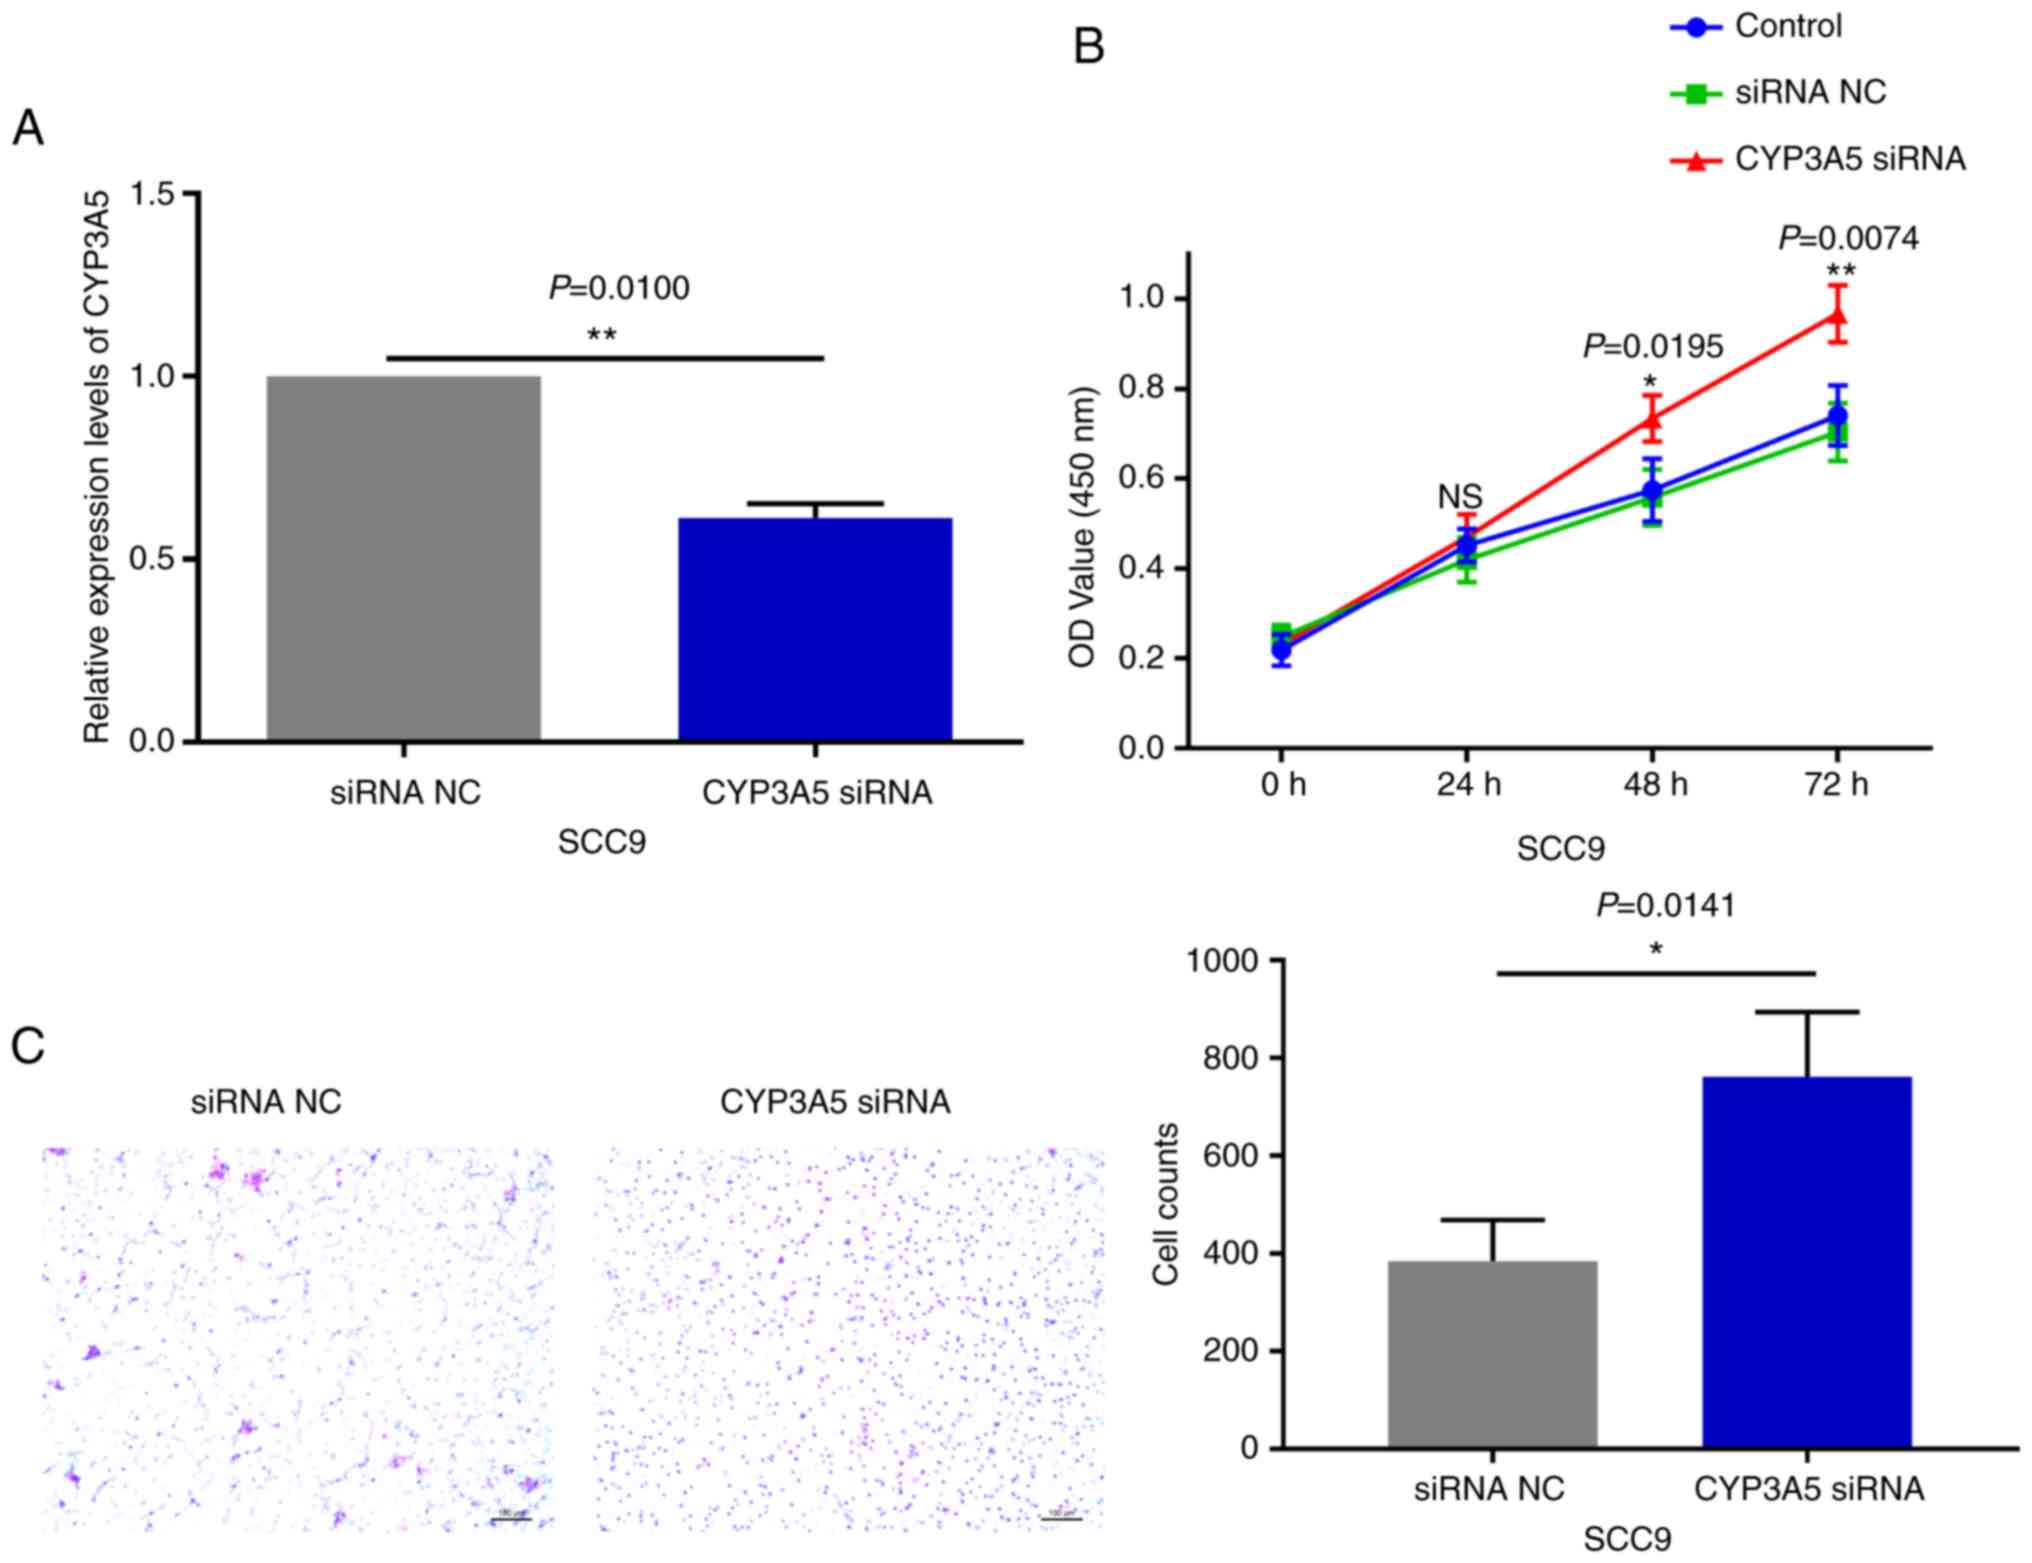
upregulated following miR-543 knockdown (Fig. 8E and G). In addition, transfection
with CYP3A5 siRNA significantly reduced the expression levels in
SCC9 cells (Fig. 9A). It was also
demonstrated that reducing the expression of CYP3A5 promoted the
proliferation of SCC9 cells (Fig. 9B)
and promoted the invasion of SCC9 cells (Fig. 9C). In summary, CYP3A5 may be a direct
target gene of miR-543 in OSCC cell lines.
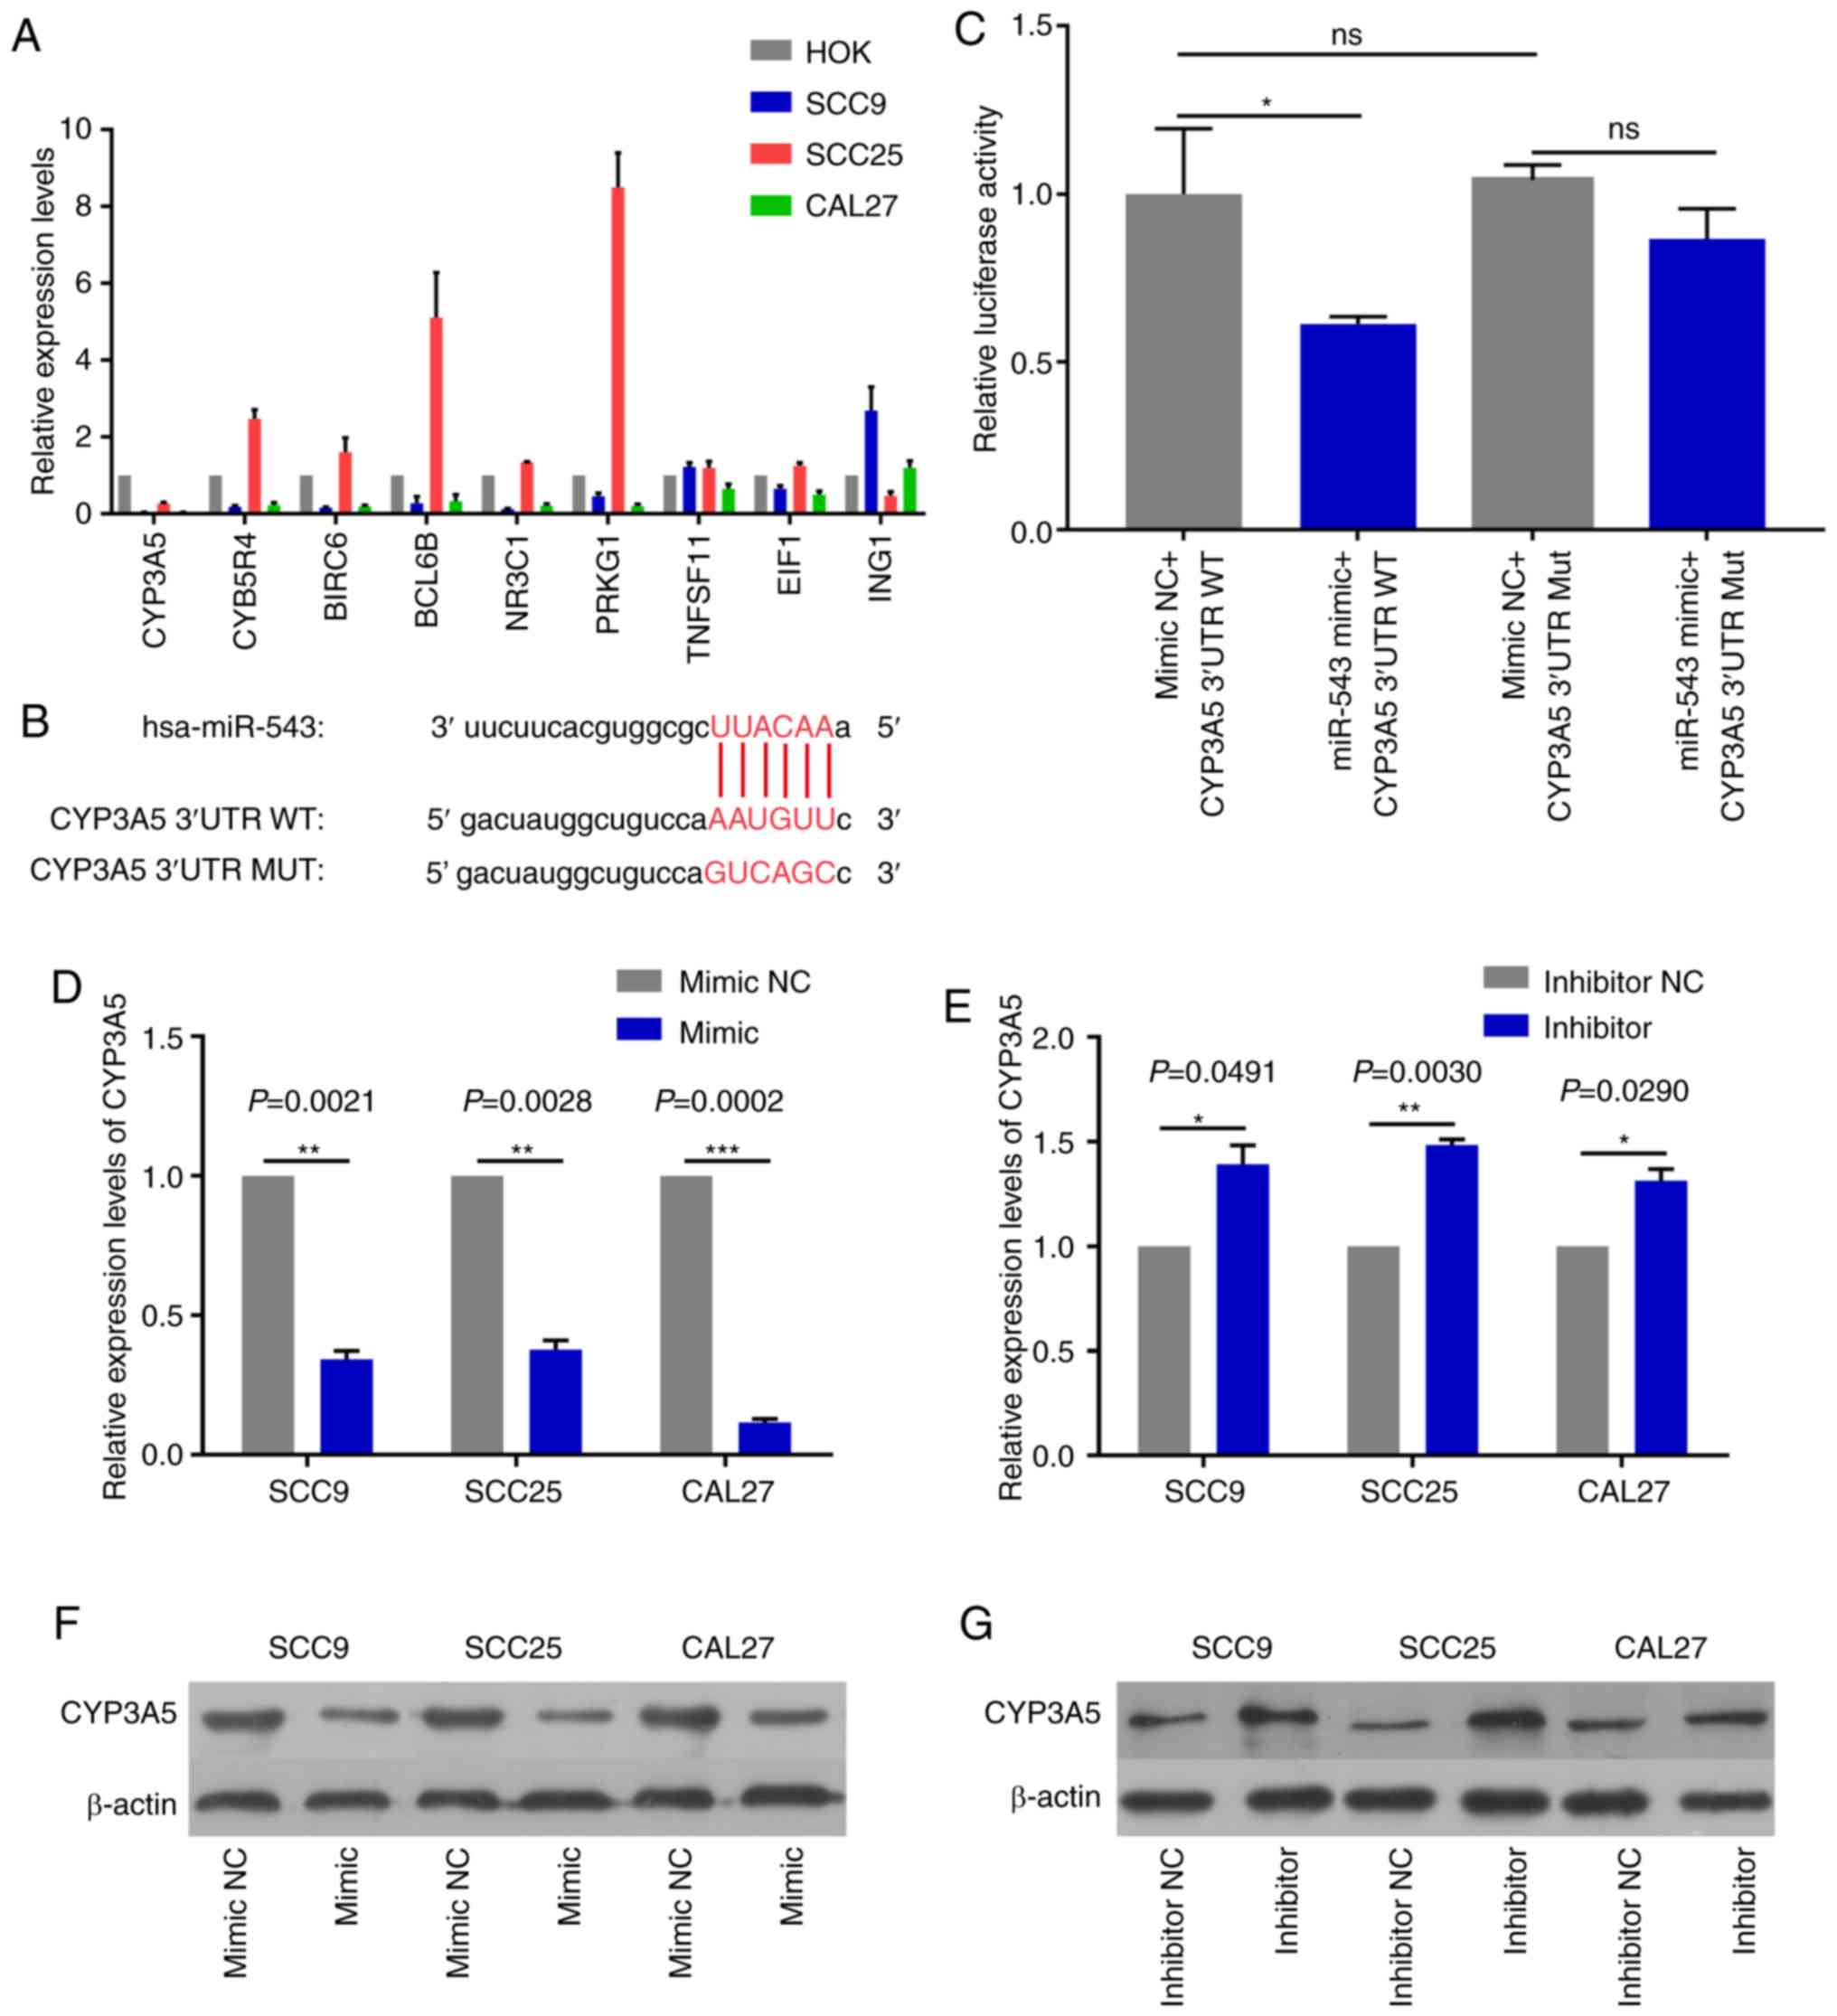 | Figure 8.CYP3A5 is a direct target gene of
miR-543. (A) The screened target genes were initially validated in
OSCC cell lines, and it was determined that the expression level of
CYP3A5 had an inverse correlation with miR-543 in the OSCC cell
lines. (B) The sequence of the miR-543 binding site within the
3′UTR of human CYP3A5. (C) CYP3A5 had a direct binding role with
miR-543. Analysis of the relative luciferase activities of
CYP3A5-WT and CYP3A5-MUT in 293T cells. The results revealed that
overexpression of miR-543 significantly reduced the luciferase
activity of WT CYP3A5 3′UTR, while the MUT CYP3A5 3′UTR had
virtually no change. CYP3A5 (D) mRNA and (F) protein expression
were decreased in SCC9, SCC25 and CAL27 cells following treatment
with miR-543 mimic when compared with the mimic NC. CYP3A5 (E) mRNA
and (G) protein expression were decreased in SCC9, SCC25 and CAL27
cells following treatment with the miR-543 inhibitor when compared
with the inhibitor NC. *P<0.05, **P<0.01, ***P<0.001; ns,
not significant; miR, microRNA; OSCC, oral squamous cell carcinoma;
NC, negative control; CYP3A5, cytochrome P450 family 3 subfamily A
member 5; UTR, untranslated region; MUT, mutant; WT, wild-type. |
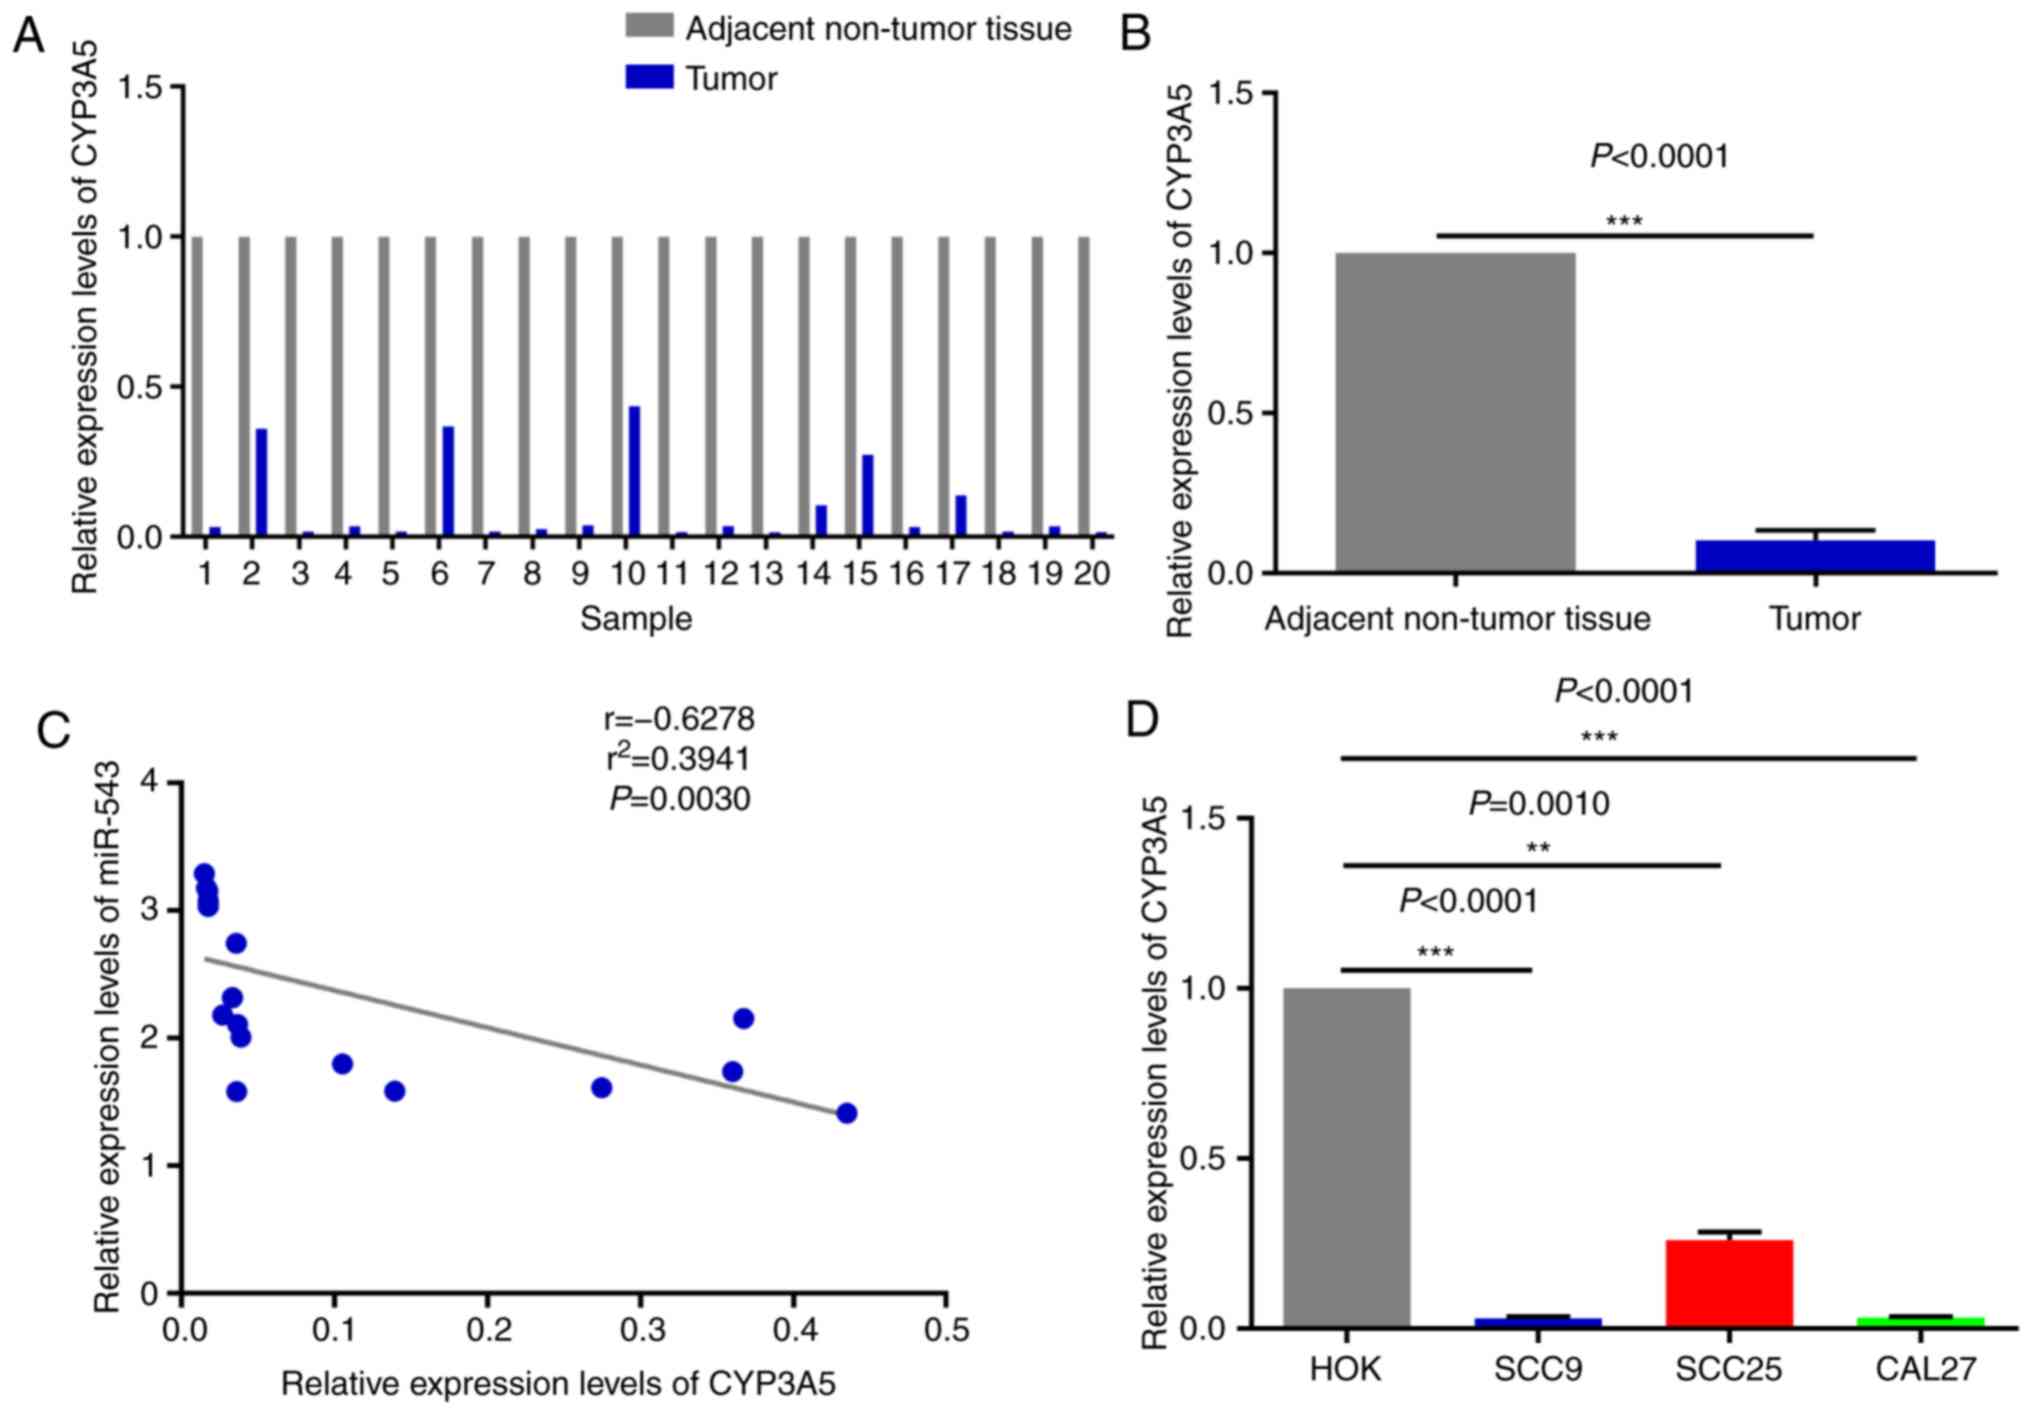
CYP3A5 is negatively associated with
miR-543 expression in OSCC
The expression pattern of miR-543 and CYP3A5 was
next analyzed in OSCC. The results demonstrated that CYP3A5 was
weakly expressed in the 20 pairs of OSCC tissues when compared with
the adjacent non-tumor tissues, as determined by RT-qPCR (Fig. 10A and B); it was also inversely
correlated with the expression of miR-543 in OSCC samples (Fig. 1A and B). In addition, correlation
analysis (y=−2.923× +2.668) of the expression levels of CYP3A5 and
miR-543 was conducted in 20 pairs of OSCC tissues. Then we use the
Enter method to verify the equation to obtain F=11.71, P=0.0030,
statistically significant. The results revealed that there was a
significant negative correlation between CYP3A5 and miR-543, and
the results were consistent with those of our predictions (Fig. 10C). Therefore, it was further
demonstrated that miR-543 targets CYP3A5 in OSCC to serve specific
roles. Similarly, CYP3A5 was significantly downregulated in OSCC
cell lines (Fig. 10D) and was
negatively correlated with the expression levels of miR-543
(Fig. 1C). In the present study,
miR-543 was expressed at a higher level in the SCC25 than the SCC9
and CAL27 cells (Fig. 1C), and the
expression of CYP3A5 was also expressed at a higher level in SCC25
than the SCC9 and CAL27 cells (Fig.
10D). The reason may be that one miRNA may target multiple
genes, and the expression level of each target gene may vary.
Therefore, miR-543 suppressed the expression of CYP3A5 in this
study, but it is also possible that the expression of CYC3A5 is
relatively higher in SCC25 than in SCC9 and CAL27 cells. The
experiments were repeated at least three times, and we confirmed
that the levels of expression of CYC3A5 were relatively higher in
SCC25 cells than levels in the SCC9 and CAL27 cells.
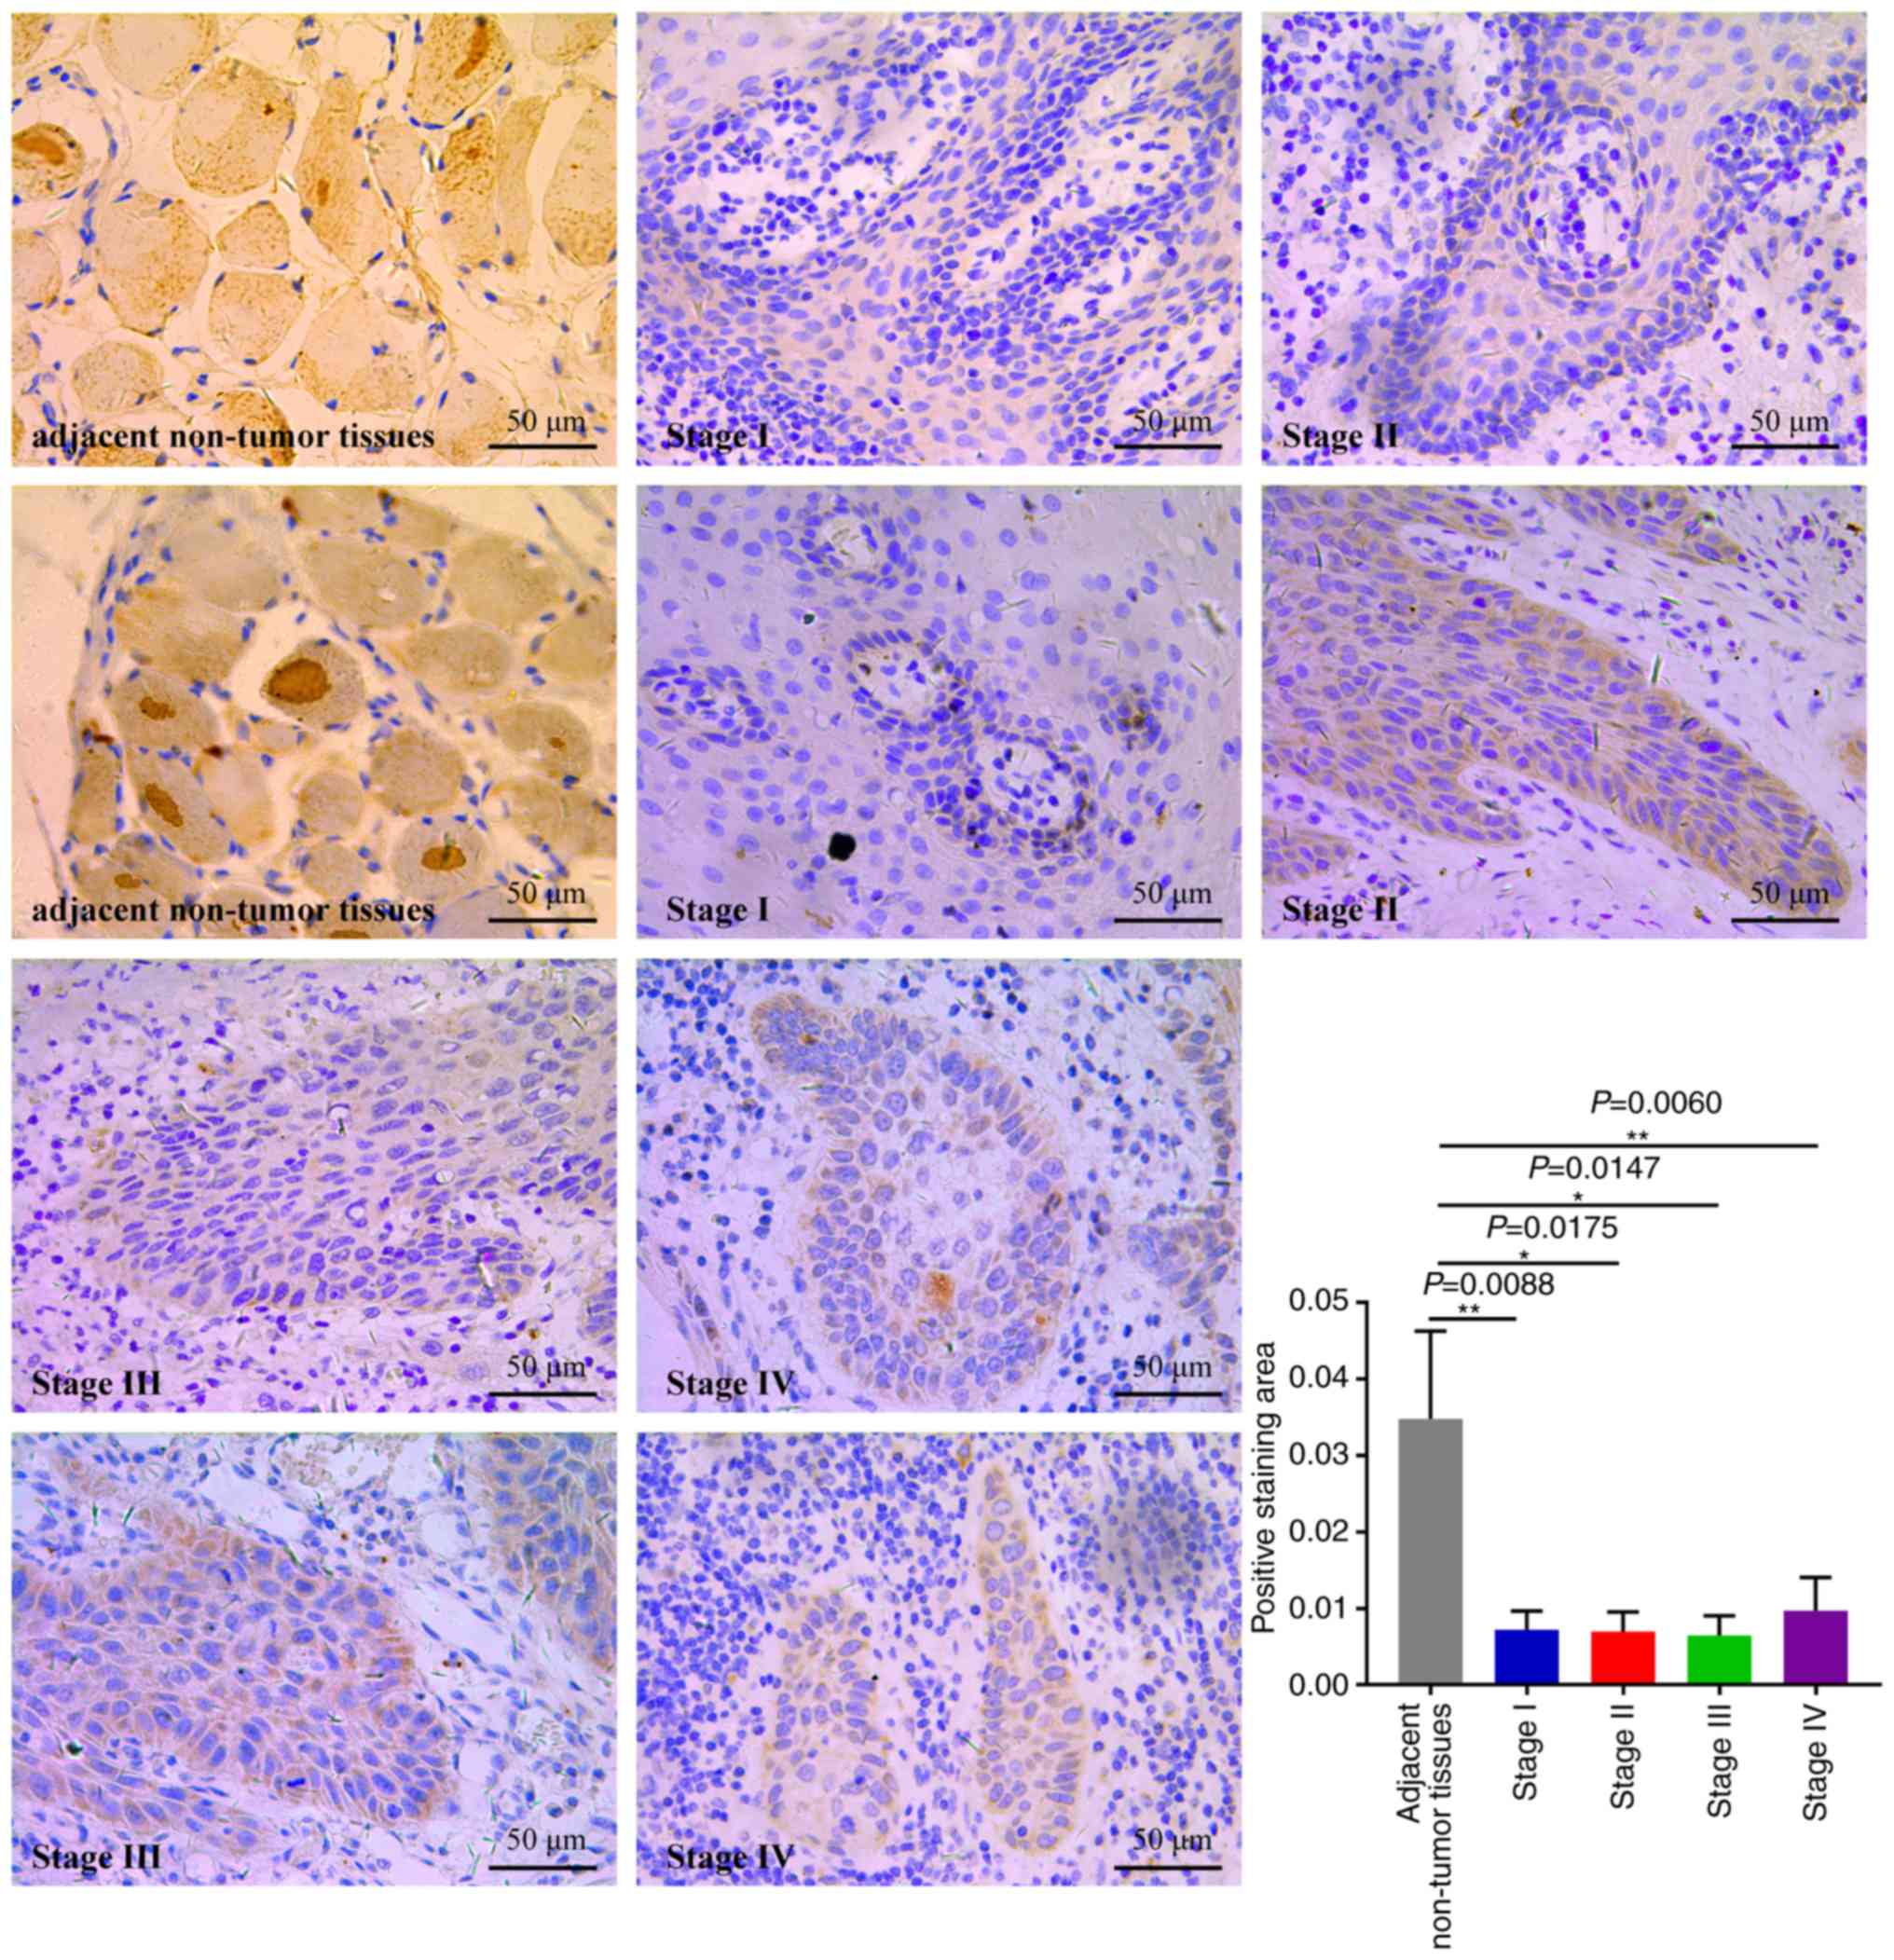
Next, IHC assays were performed to evaluate CYP3A5
expression in 20 OSCC specimens (Fig.
11). The expression of CYP3A5 was analyzed in cancerous
tissues, comparing OSCC tissues with adjacent non-tumor tissues.
CYP3A5 consistently exhibited positive expression in OSCC adjacent
non-tumor tissues; however, the rate of CYP3A5 positive expression
was significantly lower in cancerous tissues. The findings revealed
that the expression of CYP3A5 in each tumor stage was lower than
that in the paracancerous tissue, but there was no significant
difference between each stage. This result is consistent with the
results of the biological website analysis of the expression of
CYP3A5 in each stage of HNSC (27).
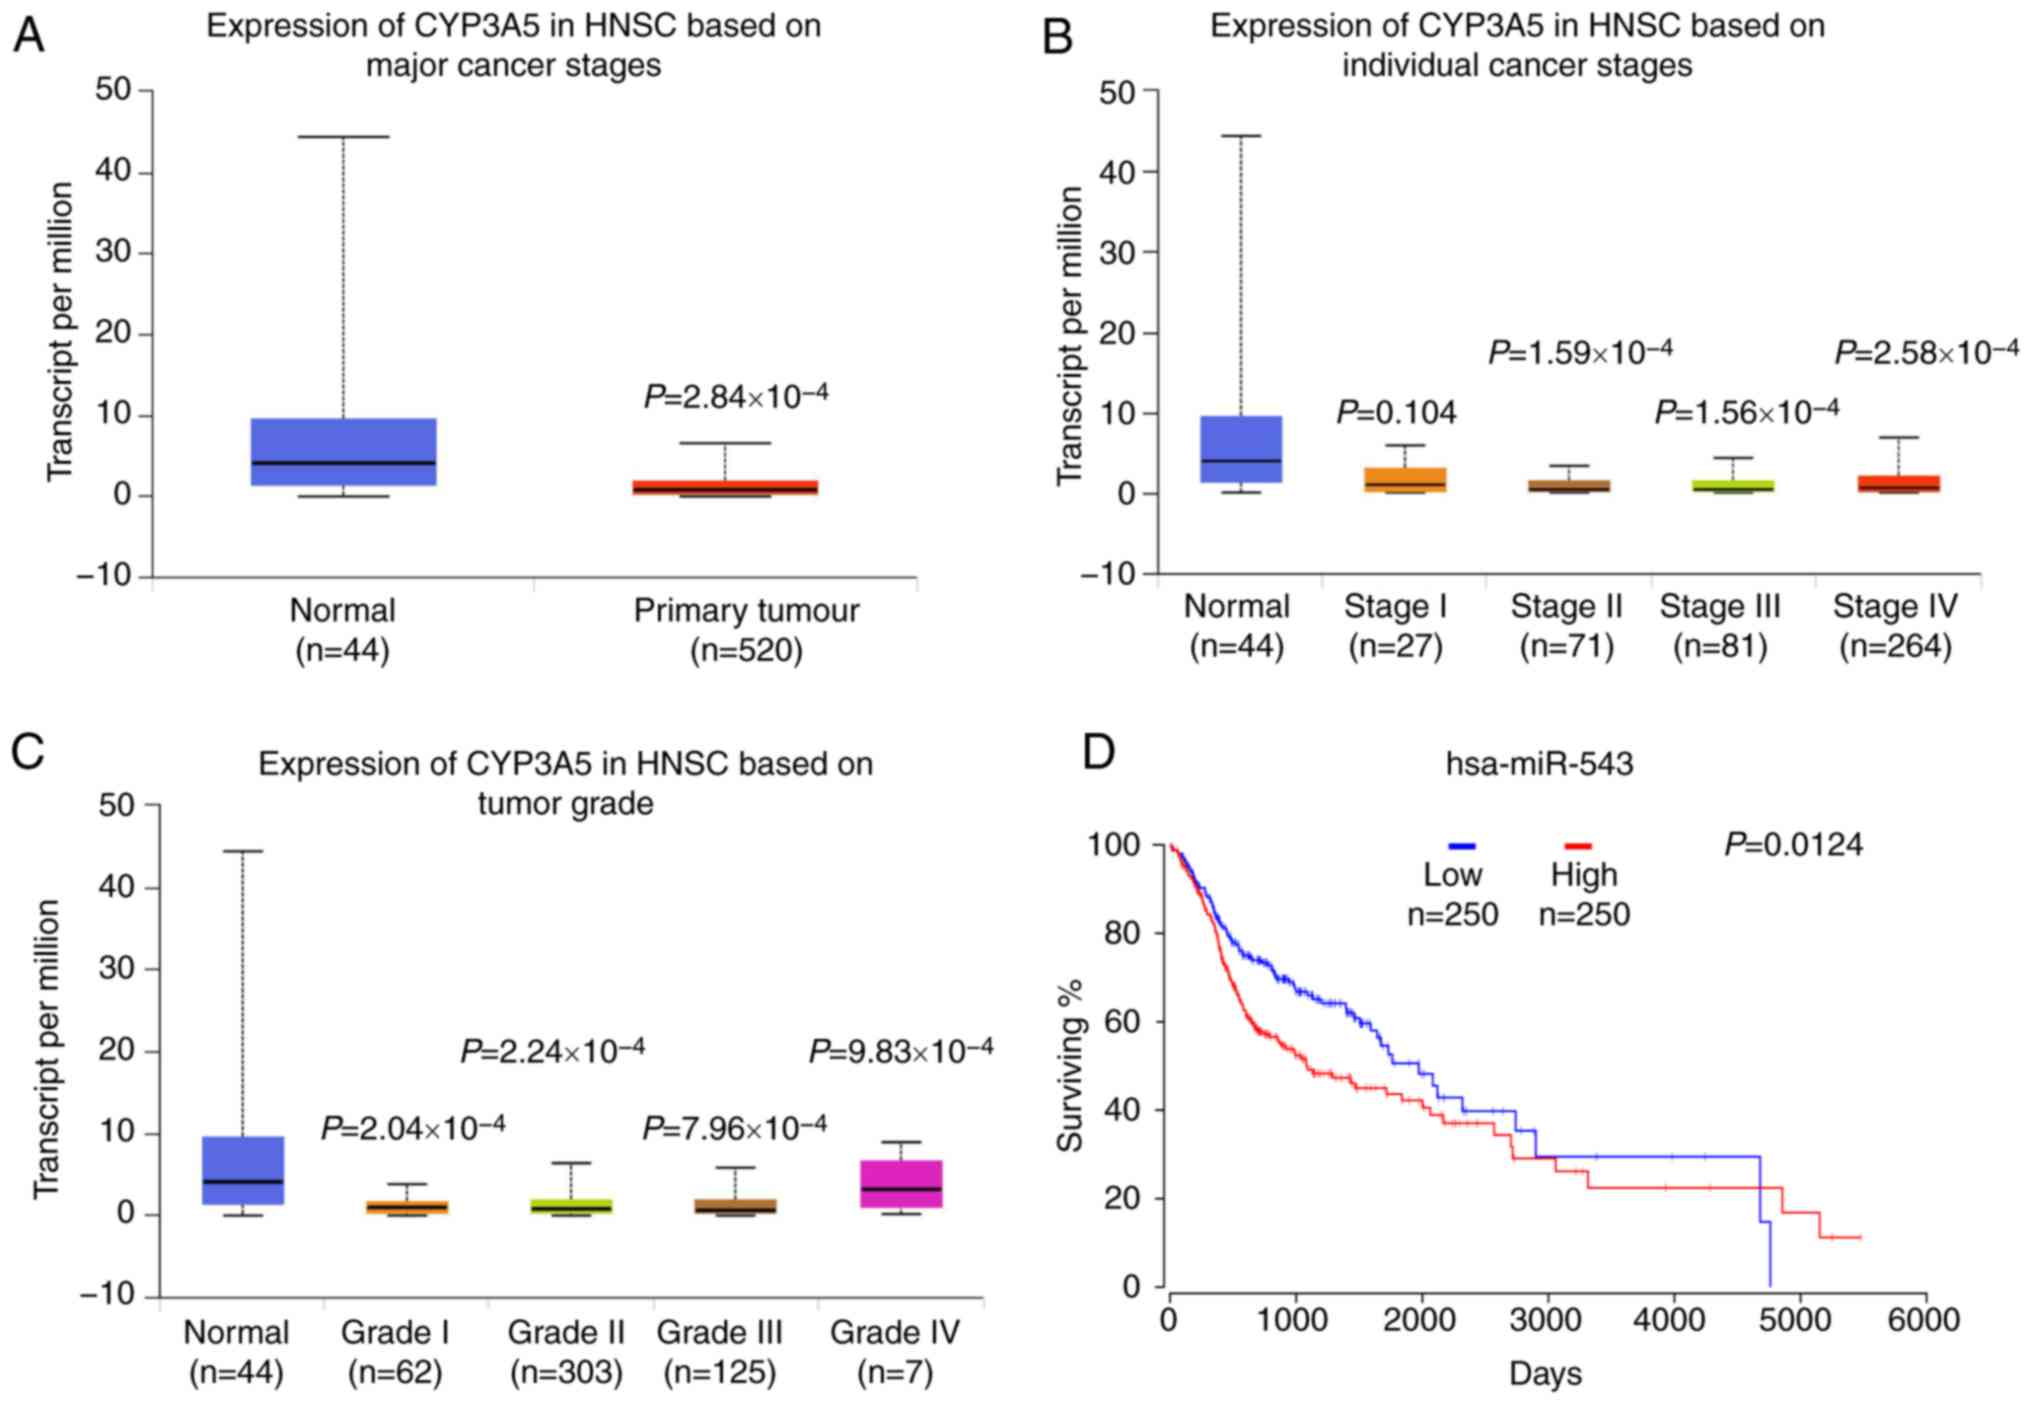
UALCAN data were then used to analyze the gene
CYP3A5 expression in HNSC. Data from TCGA revealed that when
compared with normal tissues, CYP3A5 exhibited a lower expression
level in cancerous tissues, as well as low expression levels in all
four stages of the tumor (Fig. 12A).
The expression of CYP3A5 in various clinical stages of HNSC was
then investigated. Similarly, low expression levels of CYP3A5 were
also observed in each stage (Fig.
12B). These results are consistent with the above experimental
results. In addition, the expression analysis of CYP3A5 in HNSC
tumor stages also revealed low expression levels of CYP3A5 in each
tumor stage (Fig. 12C). These
results correspond with the previous results of the present study.
Taken together, this analysis revealed that CYP3A5 expression may
be negatively correlated with miR-543 expression.
High expression of miR-543 predicts
the poor prognosis of HNSC patients
Survival analysis was also performed to evaluate
whether miR-543 expression levels could predict HNSC prognosis.
OncoLnc was employed to analyze the associations between miRNA or
mRNA expression with survival, using all of the TCGA data obtained.
Kaplan-Meier Plot analysis demonstrated that patients with higher
levels of miR-543 had significantly poorer survival than patients
with lower miR-543 expression levels (Fig. 12D; log-rank P=0.0124). These results
indicated that miR-543 may be closely associated with the prognosis
of patients.
Discussion
Oral squamous cell carcinoma (OSCC) is one of the
most common types of malignancies worldwide. Although the treatment
of patients with oral cancer has improved in recent years, the
overall 5-year survival rate has shown no significant improvement,
remaining at ~50% (34). Thus, the
development of novel targets for clinical therapy is urgently
required and clinically significant. Therefore, understanding the
pathogenesis of OSCC and identifying novel gene therapy options has
been a key area of interest in recent years. miRNA expression has
been associated with the occurrence and progression of various
tumors and miRNAs have been revealed to act as tumor-suppressor
genes or oncogenes (35–38). It has also been demonstrated that
aberrantly expressed miRNAs can regulate OSCC progression and that
miRNAs may become targets for future therapy (39–42).
Previous studies have demonstrated that miR-543 may
act as a tumor-suppressor gene or oncogene (43,44).
Earlier research found that miR-543 exhibits low expression in
glioma, and induced tumor cell apoptosis, inhibited growth, the
cell cycle, migration and the invasion of cancer cells (45). In previous research, it was
demonstrated that miR-543 suppressed breast cancer cell
proliferation, cell cycle and induced apoptosis by the
extracellular signal-regulated kinase-2 (ERK2)/mitogen-activated
protein kinase (MAPK) signaling pathway, and the phosphorylation of
downstream factors including RSK2 and MSK1 was impeded (15). However, the present study did not
further verify whether miR-543 affects OSCC through the ERK2/MAPK
signaling pathway, which will be a direction for subsequent
research. In addition, miR-543 exhibited a similar decrease in
colorectal cancer and inhibited the growth, invasion and metastasis
of colon cancer by targeting kirsten rat sarcoma viral oncogene
homolog, metastasis-associated 1 and high mobility group AT-hook 2
genes (46). However, additional
studies have revealed that miR-543 is highly expressed in
colorectal cancer (16). In addition,
miR-543 was upregulated in lung cancer, and promoted the cell
proliferation and invasion of non-small cell lung cancer by
targeting phosphatase and tensin homolog protein (12). In gastric cancer and osteosarcoma,
miR-543 was observed to be overexpressed and to serve as an
oncogene to promote cancer cell proliferation and glycolysis
(13,47). Furthermore, miR-543 was also found to
be highly expressed in prostate cancer and was confirmed to
directly target receptor-interacting serine/threonine-protein
kinase 1 to promote cell proliferation and induce
epithelial-mesenchymal transition, which promoted cell invasion and
migration in vitro and in vivo (48).
However, the expression and the biological function
of miR-543 in OSCC are still unclear. It was proposed that miR-543
may serve an important role in OSCC. Firstly, in the present study,
miR-543 expression was revealed to be significantly upregulated in
human OSCC tissues when compared with that noted in paired adjacent
non-cancerous normal tissues. Similarly, miR-543 was also
significantly upregulated in three OSCC cell lines. miR-543
overexpression and knockdown models were established in SCC9, SCC25
and CAL27 cell lines. The results demonstrated that overexpression
of miR-543 in the three OSCC cell lines promoted cell
proliferation, invasion, migration and cell cycle progression from
the G1 phase to the S and G2 phases, whereas cell apoptosis was
suppressed. By contrast, inhibition of miR-543 suppressed the
proliferation, invasion, migration and cell cycle progression of
OSCC, while the levels of cell apoptosis were elevated. Taken
together, the results suggested that miR-543 may act as a potential
oncogene that contributes to the progression, invasion and
metastasis of OSCC. But the absence of a non-cancerous cell line as
a negative control and the absence of an untreated cell group are
the limitations of this study.
In the present study, CYP3A5 was identified as a
direct target of miR-543. The supporting results were as follows:
i) A complementary sequence of miR-543 was identified by site
prediction in the 3′UTR of CYP3A5 mRNA; ii) the expression levels
of miR-543 and CYP3A5 were negatively correlated in OSCC; and iii)
the overexpression of miR-543 resulted in a significant decrease in
CYP3A5 at the mRNA and protein levels, whereas the inhibition of
miR-543 resulted in the opposite outcome. The overexpression of
miR-543 inhibited CYP3A5 3′UTR luciferase reporter activity and
this effect was attenuated via mutations in the miR-543 seed
binding site. These results indicated that miR-543 may function as
a tumor oncogene in OSCC mediated by the inhibition of CYP3A5
expression.
CYP3A5 is one of the major members of the cytochrome
P450 CYP3A subfamily, and has been the focus of many previous
studies investigating the associations with drug metabolism, CYP3A5
polymorphism and cancer risk (49–53). In
recent years, many studies have revealed that CYP3A5 is abnormally
expressed in a variety of tumors, while its abnormal expression is
closely associated with tumor invasion and metastasis (54,55). In
previous research, CYP3A5 was demonstrated to be highly expressed
in patients with osteosarcoma and to be associated with metastasis
and prognosis; thus, CYP3A5 may serve as a biomarker of
osteosarcoma (56). In addition, the
expression level of CYP3A5 was significantly decreased in HCC and
inhibited the invasion and metastasis of HCC through the transducer
of regulated cAMP response binding element-binding protein
2/protein kinase B signaling pathway (22). Consistent with these, the results of
the present study indicated that the expression of CYP3A5 is
reduced in human OSCC. CYP3A5 is a direct target gene of miR-543,
and its expression is negatively correlated with miR-543 levels in
OSCC. In addition, upregulation of miR-543 may promote cell
proliferation, invasion and migration by inhibiting the expression
of CYP3A5 in the OSCC cell lines.
In conclusion, the present study highlights the
important role of miR-543 in promoting the cell proliferation,
invasion and migration of OSCC cells by repressing of the
expression of CYP3A5. The results indicate that miR-543 may serve
as a potential biomarker and treatment target for OSCC in the
future.
Acknowledgements
The authors would like to thank Stomatology Hospital
of Guangzhou Medical University for kindly providing the OSCC
samples for the present study. The authors also thank Dr Zhichao
Zheng (Key Laboratory of Oral Medicine, Guangzhou Institute of Oral
Disease, Stomatology Hospital of Guangzhou Medical University,
Guangzhou, Guangdong, China) for his great help in writing this
paper.
Funding
The present study was supported by Science and
Technology Project of Guangdong (grant no. 2013B021800186), the
Project of Department of Education of Guangdong Province (grant no.
2017KQNCX162) and the Project of Guangzhou Municipal Health
Commission (grant no. 20181A011103).
Availability of data and materials
The datasets used and/or analyzed during the current
study are available from the corresponding author on reasonable
request.
Authors' contributions
WC, JZ, YW, XC and XZ performed the experiments and
analyzed the data. LW, LG and YY guided the experiments and
designed the study. WC and JZ wrote the manuscript. LW, WC, JZ, YY
and LG gave final approval of the version to be published. All
authors read and approved the manuscript and agree to be
accountable for all aspects of the research in ensuring that the
accuracy or integrity of any part of the work are appropriately
investigated and resolved. All authors read and approved the final
manuscript.
Ethics approval and consent to
participate
Prior to the start of the study, ethical review
approval was obtained and the subject's written informed consent
was obtained. The study was approved by the Ethics Committee of the
Stomatology Hospital of Guangzhou Medical University (no.
KY2017015, Guangzhou, China), and written consent was acquired from
the patients.
Patient consent for publication
Not applicable.
Competing interests
The authors declare that they have no competing
interests.
References
|
1
|
Warnakulasuriya S: Global epidemiology of
oral and oropharyngeal cancer. Oral Oncol. 45:309–316. 2009.
View Article : Google Scholar : PubMed/NCBI
|
|
2
|
Ferlay J, Soerjomataram I, Dikshit R, Eser
S, Mathers C, Rebelo M, Parkin DM, Forman D and Bray F: Cancer
incidence and mortality worldwide: Sources, methods and major
patterns in GLOBOCAN 2012. Int J Cancer. 136:E359–E386. 2015.
View Article : Google Scholar : PubMed/NCBI
|
|
3
|
Wu BH, Xiong XP, Jia J and Zhang WF:
Micrornas: New actors in the oral cancer scene. Oral Oncol.
47:314–319. 2011. View Article : Google Scholar : PubMed/NCBI
|
|
4
|
Murugan AK, Munirajan AK and Alzahrani AS:
MicroRNAs: Modulators of the ras oncogenes in oral cancer. J Cell
Physiol. 231:1424–1431. 2016. View Article : Google Scholar : PubMed/NCBI
|
|
5
|
Chawla JP, Iyer N, Soodan KS, Sharma A,
Khurana SK and Priyadarshni P: Role of miRNA in cancer diagnosis,
prognosis, therapy and regulation of its expression by Epstein-Barr
virus and human papillomaviruses: With special reference to oral
cancer. Oral Oncol. 51:731–737. 2015. View Article : Google Scholar : PubMed/NCBI
|
|
6
|
Kozomara A and Griffiths-Jones S: miRBase:
Annotating high confidence microRNAs using deep sequencing data.
Nucleic Acids Res. 42:D68–D73. 2014. View Article : Google Scholar : PubMed/NCBI
|
|
7
|
Shah MY and Calin GA: MicroRNAs as
therapeutic targets in human cancers. Wiley Interdiscip Rev RNA.
5:537–548. 2014. View Article : Google Scholar : PubMed/NCBI
|
|
8
|
Mirnezamia AH, Pickard K, Zhang L,
Primrose JN and Packham G: MicroRNAs: Key players in carcinogenesis
and novel therapeutic targets. Eur J Surg Oncol. 35:339–347. 2009.
View Article : Google Scholar : PubMed/NCBI
|
|
9
|
Shah MY, Ferrajoli A, Sood AK,
Lopezberestein G and Calin GA: microRNA therapeutics in cancer-an
emerging concept. Ebiomedicine. 12:34–42. 2016. View Article : Google Scholar : PubMed/NCBI
|
|
10
|
Chou J, Shahi P and Werb Z:
microRNA-mediated regulation of the tumor microenvironment. Cell
Cycle. 12:3262–3271. 2013. View
Article : Google Scholar : PubMed/NCBI
|
|
11
|
Esposito CL, Cerchia L, Catuogno S, Vita
GD, Dassie JP, Santamaria G, Swiderski P, Condorelli G, Giangrande
PH and de Franciscis V: Multifunctional aptamer-miRNA conjugates
for targeted cancer therapy. Mol Ther. 22:1151–1163. 2014.
View Article : Google Scholar : PubMed/NCBI
|
|
12
|
Bi M, Chen W, Yu H, Wang J, Ding F, Tang
DJ and Tang C: miR-543 is up-regulated in gefitinib-resistant
non-small cell lung cancer and promotes cell proliferation and
invasion via phosphatase and tensin homolog. Biochem Biophys Res
Commun. 480:369–374. 2016. View Article : Google Scholar : PubMed/NCBI
|
|
13
|
Li J, Dong G, Wang B, Gao W and Yang Q:
miR-543 promotes gastric cancer cell proliferation by targeting
SIRT1. Biochem Biophys Res Commun. 469:15–21. 2016. View Article : Google Scholar : PubMed/NCBI
|
|
14
|
Yu L, Zhou L, Cheng Y, Sun L, Fan J, Liang
J, Guo M, Liu N and Zhu L: MicroRNA-543 acts as an oncogene by
targeting PAQR3 in hepatocellular carcinoma. Am J Cancer Res.
4:897–906. 2014.PubMed/NCBI
|
|
15
|
Chen P, Xu W, Luo Y, Zhang Y, He Y, Yang S
and Yuan Z: MicroRNA 543 suppresses breast cancer cell
proliferation, blocks cell cycle and induces cell apoptosis via
direct targeting of ERK/MAPK. Onco Targets Ther. 10:1423–1431.
2017. View Article : Google Scholar : PubMed/NCBI
|
|
16
|
Sun J, Zhou J, Dong M and Sheng W:
Dysregulation of MicroRNA-543 expression in colorectal cancer
promotes tumor migration and invasion. Mol Carcinog. 56:250–257.
2017. View
Article : Google Scholar : PubMed/NCBI
|
|
17
|
Song N, Liu H, Ma X and Zhang S: Placental
growth factor promotes metastases of ovarian cancer through
MiR-543-regulated MMP7. Cell Physiol Biochem. 37:1104–1112. 2015.
View Article : Google Scholar : PubMed/NCBI
|
|
18
|
Mbatchi LC, Gassiot M, Pourquier P,
Goberna A, Mahammedi H, Mourey L, Joly F, Lumbroso S, Evrard A and
Houede N: Association of NR1I2, CYP3A5 and ABCB1 genetic
polymorphisms with variability of temsirolimus pharmacokinetics and
toxicity in patients with metastatic bladder cancer. Cancer
Chemother Pharmacol. 80:653–659. 2017. View Article : Google Scholar : PubMed/NCBI
|
|
19
|
Wahlang B, Falkner KC, Cave MC and Prough
RA: Role of cytochrome P450 monooxygenase in carcinogen and
chemotherapeutic drug metabolism. Adv Pharmacol. 74:1–33. 2015.
View Article : Google Scholar : PubMed/NCBI
|
|
20
|
Mitra R, Guo Z, Milani M, Mesaros C,
Rodriguez M, Nguyen J, Luo X, Clarke D, Lamba J, Schuetz E, et al:
CYP3A4 mediates growth of estrogen receptor-positive breast cancer
cells in part by inducing nuclear translocation of phospho-Stat3
through biosynthesis of (±)-14,15-epoxyeicosatrienoic acid (EET). J
Biol Chem. 286:17543–17559. 2011. View Article : Google Scholar : PubMed/NCBI
|
|
21
|
Fleming I: The cytochrome P450 pathway in
angiogenesis and endothelial cell biology. Cancer Metastasis Rev.
30:541–555. 2011. View Article : Google Scholar : PubMed/NCBI
|
|
22
|
Jiang F, Chen L, Yang YC, Wang XM, Wang
RY, Li L, Wen W, Chang YX, Chen CY, Tang J, et al: Cyp3a5 functions
as a tumor suppressor in hepatocellular carcinoma by regulating
mTORC2/Akt signaling. Cancer Res. 75:1470–1481. 2015. View Article : Google Scholar : PubMed/NCBI
|
|
23
|
Tanasubsinn P, Aung WPP, Pata S, Laopajon
W, Makeudom A, Sastraruji T, Kasinrerk W and Krisanaprakornkit S:
Overexpression of ADAM9 in oral squamous cell carcinoma. Oncol
Lett. 15:495–502. 2018.PubMed/NCBI
|
|
24
|
Li P, Wei X, Guan Y, Chen Q, Zhao T, Sun C
and Wei L: MicroRNA-1 regulates chondrocyte phenotype by repressing
histone deacetylase 4 during growth plate development. FASEB J.
28:3930–3941. 2014. View Article : Google Scholar : PubMed/NCBI
|
|
25
|
Livak KJ and Schmittgen TD: MAnalysis of
relative gene expression data using real-time quantitative PCR and
the 2(-Delta Delta C(T) method. Methods. 25:402–408. 2001.
View Article : Google Scholar : PubMed/NCBI
|
|
26
|
Liu F, Lou K, Zhao X, Zhang J, Chen W,
Qian Y, Zhao Y, Zhu Y and Zhang Y: miR-214 regulates papillary
thyroid carcinoma cell proliferation and metastasis by targeting
PSMD10. Int J Mol Med. 42:3027–3036. 2018.PubMed/NCBI
|
|
27
|
Chandrashekar DS, Bashel B, Balasubramanya
SAH, Creighton CJ, Poncerodriguez I, Chakravarthi BVSK and
Varambally S: Ualcan: A portal for facilitating tumor subgroup gene
expression and survival analyses. Neoplasia. 19:649–658. 2017.
View Article : Google Scholar : PubMed/NCBI
|
|
28
|
Anaya J: OncoLnc: Linking TCGA survival
data to mRNAs, miRNAs, and lncRNAs. PeerJ Comput Sci. 2:e672016.
View Article : Google Scholar
|
|
29
|
Zhang GJ, Li JS, Zhou H, Xiao HX, Li Y and
Zhou T: MicroRNA-106b promotes colorectal cancer cell migration and
invasion by directly targeting DLC1. J Exp Clin Cancer Res.
34:732015. View Article : Google Scholar : PubMed/NCBI
|
|
30
|
Liu HN, Qie P, Yang G and Song YB:
miR-181b inhibits chemoresistance in cisplatin-resistant H446 small
cell lung cancer cells by targeting Bcl-2. Arch Med Sci.
14:745–751. 2018.PubMed/NCBI
|
|
31
|
Clément T, Salone V and Rederstorff M:
Dual luciferase gene reporter assays to study miRNA function.
Methods Mol Biol. 1296:187–198. 2015. View Article : Google Scholar : PubMed/NCBI
|
|
32
|
Yang Y, Huang G, Zhou Z, Fewell JG and
Kleinerman ES: miR-20a regulates Fas expression in osteosarcoma
cells by modulating Fas promoter activity and can be
therapeutically targeted to inhibit lung metastases. Mol Cancer
Ther. 17:130–139. 2018. View Article : Google Scholar : PubMed/NCBI
|
|
33
|
Pink RC, Samuel P, Massa D, Caley DP,
Brooks SA and Carter DR: The passenger strand, miR-21-3p, plays a
role in mediating cisplatin resistance in ovarian cancer cells.
Gynecol Oncol. 137:143–151. 2015. View Article : Google Scholar : PubMed/NCBI
|
|
34
|
de Vicente JC, Rodríguez-Santamarta T,
Rosado P, Peña I and de Villalaín L: Survival after free flap
reconstruction in patients with advanced oral squamous cell
carcinoma. J Oral Maxillofac Surg. 70:453–459. 2012. View Article : Google Scholar : PubMed/NCBI
|
|
35
|
Garzon R, Calin GA and Croce CM: MicroRNAs
in cancer. Annu Rev Med. 60:167–179. 2009. View Article : Google Scholar : PubMed/NCBI
|
|
36
|
Gorenchtein M, Poh CF, Saini R and Garnis
C: MicroRNAs in an oral cancer context-from basic biology to
clinical utility. J Dent Res. 91:440–446. 2012. View Article : Google Scholar : PubMed/NCBI
|
|
37
|
Li L and Ma HQ: MicroRNA-216a inhibits the
growth and metastasis of oral squamous cell carcinoma by targeting
eukaryotic translation initiation factor 4b. Mol Med Rep.
12:3156–3162. 2015. View Article : Google Scholar : PubMed/NCBI
|
|
38
|
Kawakita A, Yanamoto S, Yamada SI, Naruse
T, Takahashi H, Kawasaki G and Umeda M: MicroRNA-21 promotes oral
cancer invasion via the Wnt/β-catenin pathway by targeting DKK2.
Pathol Oncol Res. 20:253–261. 2014. View Article : Google Scholar : PubMed/NCBI
|
|
39
|
Peng SC, Liao CT, Peng CH, Cheng AJ, Chen
SJ, Huang CG, Hsieh WP and Yen TC: MicroRNAs MiR-218, MiR-125b, and
Let-7g predict prognosis in patients with oral cavity squamous cell
carcinoma. PLoS One. 9:e1024032014. View Article : Google Scholar : PubMed/NCBI
|
|
40
|
Min A, Zhu C, Peng S, Rajthala S, Costea
DE and Sapkota D: MicroRNAs as important players and biomarkers in
oral carcinogenesis. Biomed Res Int. 2015:1869042015. View Article : Google Scholar : PubMed/NCBI
|
|
41
|
Tsai SC, Huang SF, Chiang JH, Chen YF,
Huang CC, Tsai MH, Tsai FJ, Kao MC and Yang JS: The differential
regulation of microRNAs is associated with oral cancer. Oncol Rep.
38:1613–1620. 2017. View Article : Google Scholar : PubMed/NCBI
|
|
42
|
Farooqi AA, Shu CW, Huang HW, Wang HR,
Chang YT, Fayyaz S, Yuan SF, Tang JY and Chang HW: TRAIL, Wnt,
sonic hedgehog, TGFβ, and miRNA signalings are potential targets
for oral cancer therapy. Int J Mol Sci. 18(pii): E15232017.
View Article : Google Scholar : PubMed/NCBI
|
|
43
|
Skalsky RL and Cullen BR: Reduced
expression of brain-enriched microRNAs in glioblastomas permits
targeted regulation of a cell death gene. PLoS One. 6:e242482011.
View Article : Google Scholar : PubMed/NCBI
|
|
44
|
Zhai F, Cao C, Zhang L and Zhang J:
miR-543 promotes colorectal cancer proliferation and metastasis by
targeting KLF4. Oncotarget. 8:59246–59256. 2017. View Article : Google Scholar : PubMed/NCBI
|
|
45
|
Xu L, Yu J, Wang Z, Zhu Q, Wang W and Lan
Q: miR-543 functions as a tumor suppressor in glioma in
vitro and in vivo. Oncol Rep. 38:725–734. 2017.
View Article : Google Scholar : PubMed/NCBI
|
|
46
|
Fan C, Lin Y, Mao Y, Huang Z, Liu AY, Ma
H, Yu D, Maitikabili A, Xiao H, Zhang C, et al: MicroRNA-543
suppresses colorectal cancer growth and metastasis by targeting
KRAS, MTA1 and HMGA2. Oncotarget. 7:21825–21839. 2016.PubMed/NCBI
|
|
47
|
Zhang H, Guo X, Xing F, Wang T, Hu Z, Que
X, Tian Q, Zhu T, Guo G, Huang W and Li X: MiRNA-543 promotes
osteosarcoma cell proliferation and glycolysis by partially
suppressing PRMT9 and stabilizing HIF-1α protein. Oncotarget.
8:2342–2355. 2017.PubMed/NCBI
|
|
48
|
Du Y, Liu XH, Zhu HC, Wang L, Ning JZ and
Xiao CC: MiR-543 promotes proliferation and epithelial-mesenchymal
transition in prostate cancer via targeting RKIP. Cell Physiol
Biochem. 41:1135–1146. 2017. View Article : Google Scholar : PubMed/NCBI
|
|
49
|
Wacher VJ, Wu CY and Benet LZ: Overlapping
substrate specificities and tissue distribution of cytochrome P450
3A and P-glycoprotein: Implications for drug delivery and activity
in cancer chemotherapy. Mol Carcinog. 13:129–134. 1995. View Article : Google Scholar : PubMed/NCBI
|
|
50
|
Lamba JK, Lin YS, Schuetz EG and Thummel
KE: Genetic contribution to variable human CYP3A-mediated
metabolism. Adv Drug Deliv Rev. 54:1271–1294. 2002. View Article : Google Scholar : PubMed/NCBI
|
|
51
|
Wojnowski L: Genetics of the variable
expression of CYP3A in humans. Ther Drug Monit. 26:192–199. 2004.
View Article : Google Scholar : PubMed/NCBI
|
|
52
|
Picard N, Rouguiegmalki K, Kamar N,
Rostaing L and Marquet P: CYP3A5 genotype does not influence
everolimus in vitro metabolism and clinical pharmacokinetics in
renal transplant recipients. Transplantation. 91:652–656. 2011.
View Article : Google Scholar : PubMed/NCBI
|
|
53
|
Zayed BEM and Mehaney D: The effect of
CYP3A5 polymorphism on cyclosporine plasma level in Egyptian renal
transplant recipients. Comp Clin Pathol. 23:1–5. 2014.
|
|
54
|
Islam MS, Mostofa AG, Ahmed MU, Bin Sayeed
MS, Hassan MR and Hasnat A: Association of CYP3A4, CYP3A5
polymorphisms with lung cancer risk in Bangladeshi population.
Tumor Biol. 35:1671–1678. 2014. View Article : Google Scholar
|
|
55
|
Ma LM, Liu HC, Ruan LH and Feng YM: CYP3A5
* 3 genetic polymorphism is associated with childhood acute
lymphoblastic leukemia risk: A meta-analysis. Biomed J. 38:428–432.
2015. View Article : Google Scholar : PubMed/NCBI
|
|
56
|
Dhaini HR, Thomas DG, Giordano TJ, Johnson
TD, Biermann JS, Leu K, Hollenberg PF and Baker LH: Cytochrome P450
CYP3A4/5 expression as a biomarker of outcome in osteosarcoma. J
Clin Oncol. 21:2481–2485. 2003. View Article : Google Scholar : PubMed/NCBI
|