Introduction
Thyroid carcinoma is the leading cause of increasing
morbidity and mortality οf head and neck neoplasms, and 80% of
patients with thyroid carcinoma have papillary thyroid carcinoma
(PTC) (1). A study revealed that
PTC has heterogeneous molecular characteristics and widely
changeable clinical behavior during the development of the tumor as
compared to other tumors in humans. Some PTCs are lethal clinically
due to the tolerance to conventional radiotherapy and drug therapy
in PTC (2).
The mammalian genome contains hundreds of microRNA
(miRNA) and non-coding RNAs with a length of 18–25 nucleotides,
regulating the expression of 30% of human genes (3), and a miRNA may function as a tumor
suppressor by inhibiting the expression of an oncogene. In
addition, tumor progression is promoted by reducing the expressions
of certain tumor suppressors (4).
Aberrant miRNA expression has been confirmed in the majority of
diseases including all major cancers. However, only few human
miRNAs, including miR-449 (1),
miR-129-5p (5) and miR-146-5p
(6), has been demonstrated to be
aberrantly expressed in PTC. A study reported that miR-449 acts as
a tumor suppressor by inducing cell senescence and apoptosis
(7).
Notch is a multifunctional transmembrane receptor
and can regulate the differentiation, development, proliferation
and survival of normal cells or cancer cells in various cases.
Notch signaling transduction consists of four Notch receptors
(Notch 1, 2, 3 and 4) and five ligands [Delta 1, 3, 4 and Jagged
(Jag) 1 and 2] (8). The Notch
signaling pathway has been revealed to contribute to the
progression of several cancers, including the proliferation,
invasion and apoptosis of cancer cells (9,10).
Some studies have revealed that Notch1 and its ligand Jagged1 may
play a key role in epithelial-mesenchymal transition and cancer
stem cell regulation during the occurrence and development of a
tumor, and that the alteration of Notch1 expression leads to the
alteration of the Notch signaling pathway, which affects the
expression of downstream Jagged1 (11–13).
Many studies have revealed that the Notch signaling pathway has an
impact on the proliferation, invasion and apoptosis of non-small
cell lung cancer and pancreatic cancer cells, further affecting the
expression of proliferation-related factor PCNA, invasion-related
factors MMP-2, MMP-9 and apoptosis-related factor Bcl-2 (13–15).
However, it is hard to interpret the specific mechanism of Notch
signaling pathway in thyroid carcinoma. Bioinformatics prediction
revealed that there is a target relationship between miR-449a and
Notch1, and miR-449 plays a role in cancers by acting as a tumor
suppressor (16). Therefore, it was
speculated that miR-449a may suppress the Notch signaling pathway,
inhibit the proliferation and invasion of PTC cells, and promote
PTC cell apoptosis by targetedly downregulating Notch 1
expression.
Materials and methods
Cell culture
Human papillary thyroid carcinoma cell line TPC-1
(cat. no. JH-H1522; Shanghai Jihe Biotechnology Co. Ltd.) was
cultured with RPMI-1640 medium containing 10% fetal bovine serum
(FBS), 50 U/ml penicillin and 100 µg/ml streptomycin (all from
Gibco; Thermo Fisher Scientific, Inc.) in a 5% CO2 cell
incubator (model number: Thromo3111; Thermo Fisher Scientific,
Inc.) at 37°C. The medium was renewed every day. Cells were
passaged on 3–4 days. Well-grown cells in the logarithmic phase
were collected for subsequent experiments.
Cell grouping and transfection
Human papillary thyroid carcinoma cell line TPC-1 in
the logarithmic phase was seeded in 6-well plates at a density of
1×10⁵ cells/well and cultured with serum-free and
double-antibody-free RPMI-1640 medium the day before transfection.
Cells were divided into 6 groups: The control group (without any
treatment), the negative control (NC) group (transfection with NC
plasmid), the miR-449a mimic group (transfection with miR-449a
mimic), the miR-449a inhibitor group (transfection with miR-449a
inhibitor), the DAPT group (addition of 5 µM DAPT), and the
miR-449a inhibitor + DAPT group (transfection with miR-449a
inhibitor and addition of DAPT). Transfection was performed
strictly according to the instructions of the Lipofectamine 2000
reagent. A total of 8 µl Lipofectamine 2000 (Thermo Fisher
Scientific, Inc.) were mixed with 200 µl phosphate-buffered saline
(PBS) (Thermo Fisher Scientific, Inc.), standing for 5 min; 50
nmol/l miR-449a mimic, miR-449a inhibitor or NC plasmid dry powders
(Shanghai GenePharma Co., Ltd.) were mixed with 200 µl PBS,
standing for 5 min. The two mixtures were mixed by slightly
shaking, and then allowed to stand for 20 min at room temperature.
Then 5 µM DAPT and the aforementioned mixture were added to 6-well
plates and mixed gently. The medium was replaced by the medium
containing 10% fetal bovine serum (Gibco; Thermo Fisher Scientific,
Inc.) after 8 h of transfection. After 48 h of transfection, the
cells were collected for subsequent experiments.
Dual-luciferase reporter system
The binding site of miR-449a and Notch1 was analyzed
through a bioinformatics prediction website (www.targetscan.org). Then the target relationship
between miR-449a and Notch1 was verified by dual-luciferase
reporter system. A dual-luciferase reporter gene vector of the
target gene SP1 and mutant on the binding site of miR-449a and
Notch1 were constructed: PGL3-Notch1 wt and PGL3-Notch1 mut.
Renilla plasmid and two reporter plasmids were
co-transfected with miR-449a plasmid and NC plasmid into 293T cells
(Chinese Academy of Sciences Cell Bank, Shanghai, China). A dual
luciferase reporter assay was carried out 24 h after cell
transfection. Cells were lysed with 1X passive lysis buffer
(Promega) and centrifuged at 12,000 × g for 1 min. The supernatant
was collected. A dual-luciferase reporter kit (Promega Corp.) was
used according to the instructions to assess luciferase activity.
The lysed cell samples were pipetted into EP tubes. Every 10-µl
cell sample was mixed with 100 µl firefly luciferase working
solution to assess the firefly luciferase activity and then mixed
with 100 µl Renilla luciferase working solution to assess
the Renilla luciferase activity. The relative luciferase
activity was calculated as follows: Firefly luciferase
activity/Renilla luciferase activity.
qRT-PCR
Total RNA of cells collected after transfection for
48 h was extracted using TRIzol (cat. no. 16096020; Thermo Fisher
Scientific, Inc.) and Rapid Tissue Cellular miRNA Extraction Kit
(cat. no. B1802; Harbin HaiGene Biotechnology Co., Ltd.) and
reverse-transcribed into cDNA using TaqMan MicroRNA Assays Reverse
Transcription Primer (Thermo Scientific Scientific, Inc.).
SYBR® Premix Ex Taq™ II kit (Xingzhi Biotechnology Co.,
Ltd., China) was used to carry out fluorescence quantitative
polymerase chain reaction (PCR). The reaction solution was
comprised of 25 µl SYBR® Premix Ex Taq™ II (2X), 2 µl
PCR forward primer, 2 µl PCR reverse primer, l µl ROX Reference Dye
(50X), 4 µl DNA templates, and 16 µl ddH2O. Fluorescence
quantitative PCR was performed by ABI PRISM® 7300 system
(Prism® 7300; Shanghai Kunke Instruments and Equipment
Co., Ltd.). Reaction conditions were as follows: Pre-denaturation
at 95°C for 10 min, 32 cycles of denaturation at 95°C for 15 sec
and annealing at 60°C for 30 sec followed by extension at 72°C for
1 min. The 2−ΔΔCq method was used to calculate the
relative expression of the target gene (17). The following formulas were used:
ΔCq=Cq (target gene)-Cq (GAPDH); ΔΔCq=ΔCq
(experimental group)-ΔCq (control group). U6
was used as the internal reference of miR-449a, and for other genes
GAPDH was used as the internal reference. Primers are presented in
Table I.
 | Table I.Primer sequences. |
Table I.
Primer sequences.
| Gene | Sequence |
|---|
| miR-449a | F:
5′-GCTGGCAGTGTATTGTTA-3′ |
|
| R:
5′-GTGCAGGGTCCGAGGT-3′ |
| Notch1 | F:
5′-CAGCGAATCCGAOGACTATG-3′ |
|
| R:
5′-CAGGCGTGTTGTTCTCACAG-3′ |
| Jagged1 | F:
5′-AGTCACTGGCACGGTYGTAG-3′ |
|
| R:
5′-TCGCTGTATCTGTCCACCTG-3′ |
| PCNA | F:
5′-GTGCAGAACTTGGAAATGGAAAC-3′ |
|
| R:
5′-TI'GAAGAGAGTGGAGTGGCT-3′ |
| MMP-2 | F:
5′-CAGGAGGAGAAGGCTGTGTT-3′ |
|
| R:
5′-AGGGTGCTGGCTGAGTAGAT-3′ |
| MMP-9 | F:
5′-AGAACCAATCTCACCGACAGG-3′ |
|
| R:
5′-CGACTCTCCACGCATCTCT-3′ |
| Bcl-2 | F:
5′-AACACCAGAATCAAGTGTGG-3′ |
|
| R:
5′-TCAGGTGGACCACAGGTGGC-3′ |
| Bax | F:
5′-ACGGTITCATcCAGGATCGAGCC-3′ |
|
| R:
5′-AGGCGGTGAGGACTCCAGCC-3′ |
| U6 | F:
5′-CTCGCTTCGGCAGCACATATACT-3′ |
|
| R:
5′-ACGCTTCACGAATTTGCGTGTC-3′ |
| GAPDH | F:
5′-GGGTGATGCTCGTGCTGAGTATGT-3′ |
|
| R:
5′-AAGAATGGGTGTTGCTGTTGAAGTC-3′ |
Western blotting
After transfection for 48 h, the cells were washed
three times with precooled PBS. Total protein in cells was
extracted using RIPA lysate containing PMSF (cat. no. R0010;
Solarbio Life Sciences). Protein concentration was assessed by BCA
kit (Thermo Fisher Scientific, Inc.), and deionized water was used
for the zero setting. The sample was mixed with loading buffer and
boiled in a metal bath at 100°C for 10 min. Then 50 µg protein
samples were added for sample application, and electrophoresis was
performed for 3 h at a constant voltage of 70 V. Proteins were
transferred to PVDF membranes (cat. no. ISEQ00010; EMD Millipore)
by wet method with a constant current of 150 mA. The membranes were
sealed with 5% skimmed milk powder at room temperature for 2 h. The
milk was discarded, and the residual milk was washed off with
Tris-buffered saline Tween (TBST). The membranes were incubated
with primary antibodies rabbit anti-human Notch1 (product code
ab194123; 1:5,000), Jagged1 (product code ab7771; 1:500), PCNA
(product code ab92552; 1:5,000), MMP-2 (product code ab37150;
1:5,000), MMP-9 (product code ab73734; 1:5,000), Bax (product code
ab32503; 1:1,000), Bcl-2 (product code ab32124; 1:1,000) and GAPDH
(cat. no. ab22555; 1:2,000, all from Abcam) at 4°C overnight. Then
the membranes were washed with TBST three times, for 6 min each
time. The membrane was incubated with horseradish
peroxidase-labeled goat anti-rabbit IgG antibody (1:5,000, Beijing
Zhongshan Biotechnology Co., Ltd.) for 2 h. Then the membranes were
washed with TBST three times, for 6 min each time, followed by
immersing in Tris-buffered saline. The same volume of solution A
(luminol) and B (peroxide) in an ECL fluorescent assay kit
(BB-3501; BestBio, Shanghai, China) was mixed and added on the
membrane drop wise. Imaging was performed by gel imager using a
Bio-Rad image analysis system (Bio-Rad Laboratories, Inc.) and
analyzed by ImageJ 2.0 software (National Institutes of Health).
The relative protein content was calculated as follows: Gray value
of the target protein band/gray value of the GAPDH band.
Cell proliferation detection by
EdU
Cells in the logarithmic phase were seeded into a
24-well plate at a density of 4×10³ cells/well and
cultured to the normal growth phase. EdU was diluted using cell
culture medium to prepare 50 µM EdU solutions. EdU solutions (100
µl) were added to each well, and reacted with medium for 2 h. The
medium was then discarded. Cells were washed twice with PBS, for 5
min each time. Cell fixative was supplemented with PBS containing
4% paraformaldehyde and added into each well at 37°C for 30 min.
Then the reaction mixture was pipetted. PBS was supplemented with
0.5% Triton X-100 to prepare fresh penetrating agent. Fresh
penetrating agent (100 µl) was added to each well, followed by
reaction on the shaking table at 37°C for 10 min. Then cells were
washed with PBS for 5 min. 1X Apollo® staining solution
(100 µl) was added, and the plate was coated with tin foil paper
followed by reaction on a shaking table at 37°C for 30 min. Then
the staining solution was discarded. Fresh penetrating agent (100
µl) was added to each well and reacted three times, each time for
10 min. Then the penetrating agent was discarded. After each
reaction, cells were washed with methanol twice and PBS once,
successively, for 5 min each time. The prepared 1X Hoechst33342 dye
solution was stored in a dark place. 1X Hoechst33342 dye solution
(100 µl) was added to each well, and the plate was coated with tin
foil paper followed by reaction on the shaking table at 37°C for 30
min. Then the dye solution was discarded. Each well was washed
three times with 100 µl PBS. Stained cells were observed under a
fluorescence microscope. Five visual fields (200×) were selected
randomly under an inverted microscope. EdU-stained cells
(proliferative cells) and Hoechst33342 stained cells (total cells)
were counted. The cell proliferation rate was calculated as
follows: Cell proliferation rate=number of proliferative
cells/number of total cells ×100%. The experiment was repeated
three times.
Cell cycle and apoptosis detection by
flow cytometry
After transfection for 48 h, cells were washed with
PBS three times and centrifuged at 2,200 × g for 20 min. The
supernatant was discarded. The cell concentration was adjusted to
1×10⁵ cells/ml using PBS. Precooled 75% ethanol (1 ml)
was added to the cells and placed at 4°C for 1 h. Then cells were
centrifuged at 1,300 × g for 5 min and washed with PBS three times.
Rnase A (120 µl; Thermo Fisher Scientific, USA) was added to the
cells in a dark place followed by a water bath at 37°C for 40 min.
Cells were dyed with 500 µl propidium iodide (PI) (Sigma-Aldrich;
Merck KGaA), mixed, and placed in a dark place at 4°C for 30 min.
Red fluorescence at an excitation wavelength of 488 nm was recorded
by flow cytometry (BeckmanCoulter) to detect the cell cycle.
After transfection for 48 h, cells were digested by
EDTA-free trypsin (Thermo Fisher Scientific, Inc.) and collected to
a flow tube. Cells were centrifuged at 2,200 × g for 30 min, and
the supernatant was discarded. Cells were washed with precooled PBS
three times and centrifuged at 2,200 × g for 20 min. The
supernatant was discarded. HEPES buffer, Annexin-V-FITC and PI
(50:1:2) were used to prepare an Annexin V-FITC/PI dye solution
according to the instruction of Annexin-V-FITC apoptosis assays kit
(Sigma, USA). Cells were mixed with 100 µl dye solution and
incubated at room temperature for 15 min. Then cells were mixed
with 1 ml HEPES buffer (Thermo Fisher Scientific, Inc.) by shaking.
Cell apoptosis was detected at an excitation wavelength of 488 nm
by flow cytometry.
Cell invasion detection by Transwell
assay
Transwell chambers were placed into 96-well plates.
The upper chamber of the Transwell chamber was coated with Matrigel
diluent (1:8) and dried at room temperature. Cells were digested by
trypsin and rinsed with PBS three times. Cells were re-suspended
with RPMI-1640 medium at a density of 1×10⁵ cells/ml.
The Matrigel-coated (Qcbio Science & Technologies Co., Ltd.)
upper chamber was supplemented with 300 µl cell suspension.
RPMI-1640 medium (500 µl) containing 10% fetal bovine serum (Gibco;
Thermo Fisher Scientific, Inc.) was added to the lower chamber.
After 24 h of conventional culture, the Transwell chamber was
removed, and unnecessary cells on the upper chamber were wiped off
gently with cotton swabs. Cells were fixed with 4% paraformaldehyde
(Beijing Leagene Biotechnology Co., Ltd.) for 20 min, dyed with
0.5% crystal violet solution (Beijing Solarbio Science &
Technology Co., Ltd.) for 10 min, and washed with PBS three times.
Imaging was performed in 5 visual fields (×200) that were randomly
selected under an inverted microscope. The number of cells
permeating the membrane were counted.
Statistical analysis
SPSS 21.0 (IBM Corp.) software was used to analyze
the data. The measurement data were expressed as the mean ±
standard deviation. Comparison among groups was performed by
one-way ANOVA in conjunction with Tukey's post hoc test for
pairwise comparison. A P-value of <0.05 was considered to be
statistically significant.
Results
Negative target regulation of miR-449a
on Notch1
A specific binding site of miR-449a and Notch1 was
identified through analysis using bioinformatics prediction website
microrna.org (http://www.microrna.org/microrna/home.do) (Fig. 1A). Results of the dual-luciferase
reporter assay revealed that compared with the NC group, the
luciferase activity of wild-type Notch1 was significantly reduced
(P<0.05), and there was no significant difference in the
luciferase activity of mutational-Notch1 in the miR-449a mimic
group (P>0.05) (Fig. 1B),
indicating the negative target regulation of miR-449a on
Notch1.
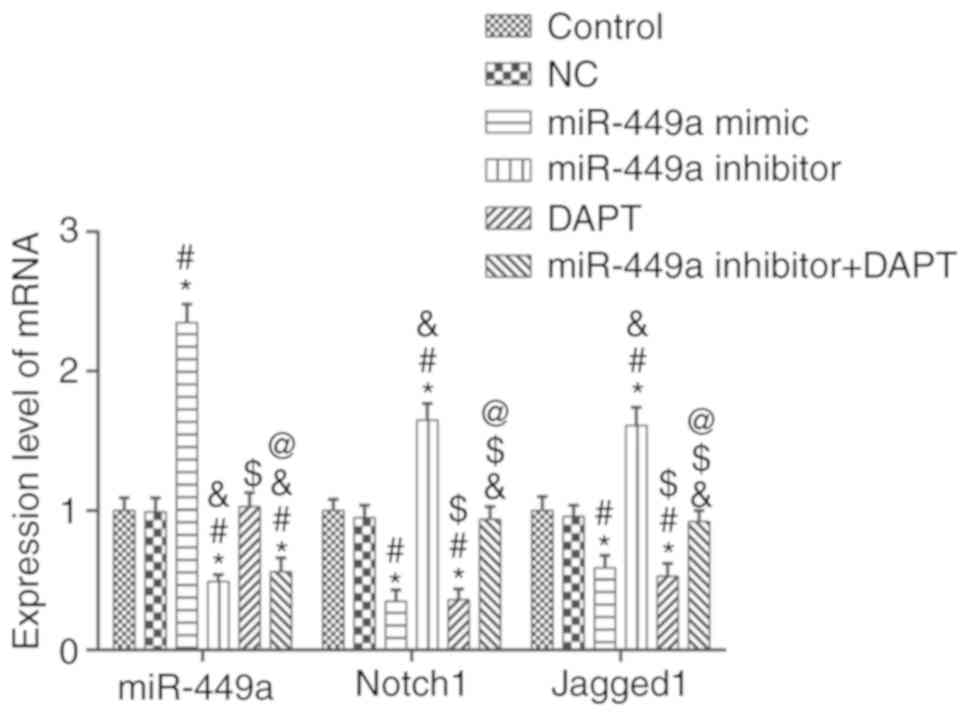
miR-449a, Notch1 and Jagged1 mRNA
expression levels
The mRNA expression levels of miR-449a and Notch1,
signaling pathway-related factors, were detected by qRT-PCR
(Fig. 2). Compared to the control
group, there was no significant difference in the expression of
genes in the NC group (P>0.05), however, the mRNA expression of
Notch1 and Jagged1 in the miR-449a mimic group and DAPT group were
significantly decreased (both P<0.05). In dddition, Notch1 and
Jagged1 mRNA expression levels in the miR-449a inhibitor group were
significantly increased (both P<0.05). Compared with the
miR-449a inhibitor group, Notch1 and Jagged1 mRNA expression levels
in the miR-449a inhibitor + DAPT group were significantly decreased
(both P<0.05). miR-449a was significantly increased in miR-449a
mimic group and significantly decreased in the miR-449a inhibitor
group and miR-449a inhibitor + DAPT group (all P<0.05).
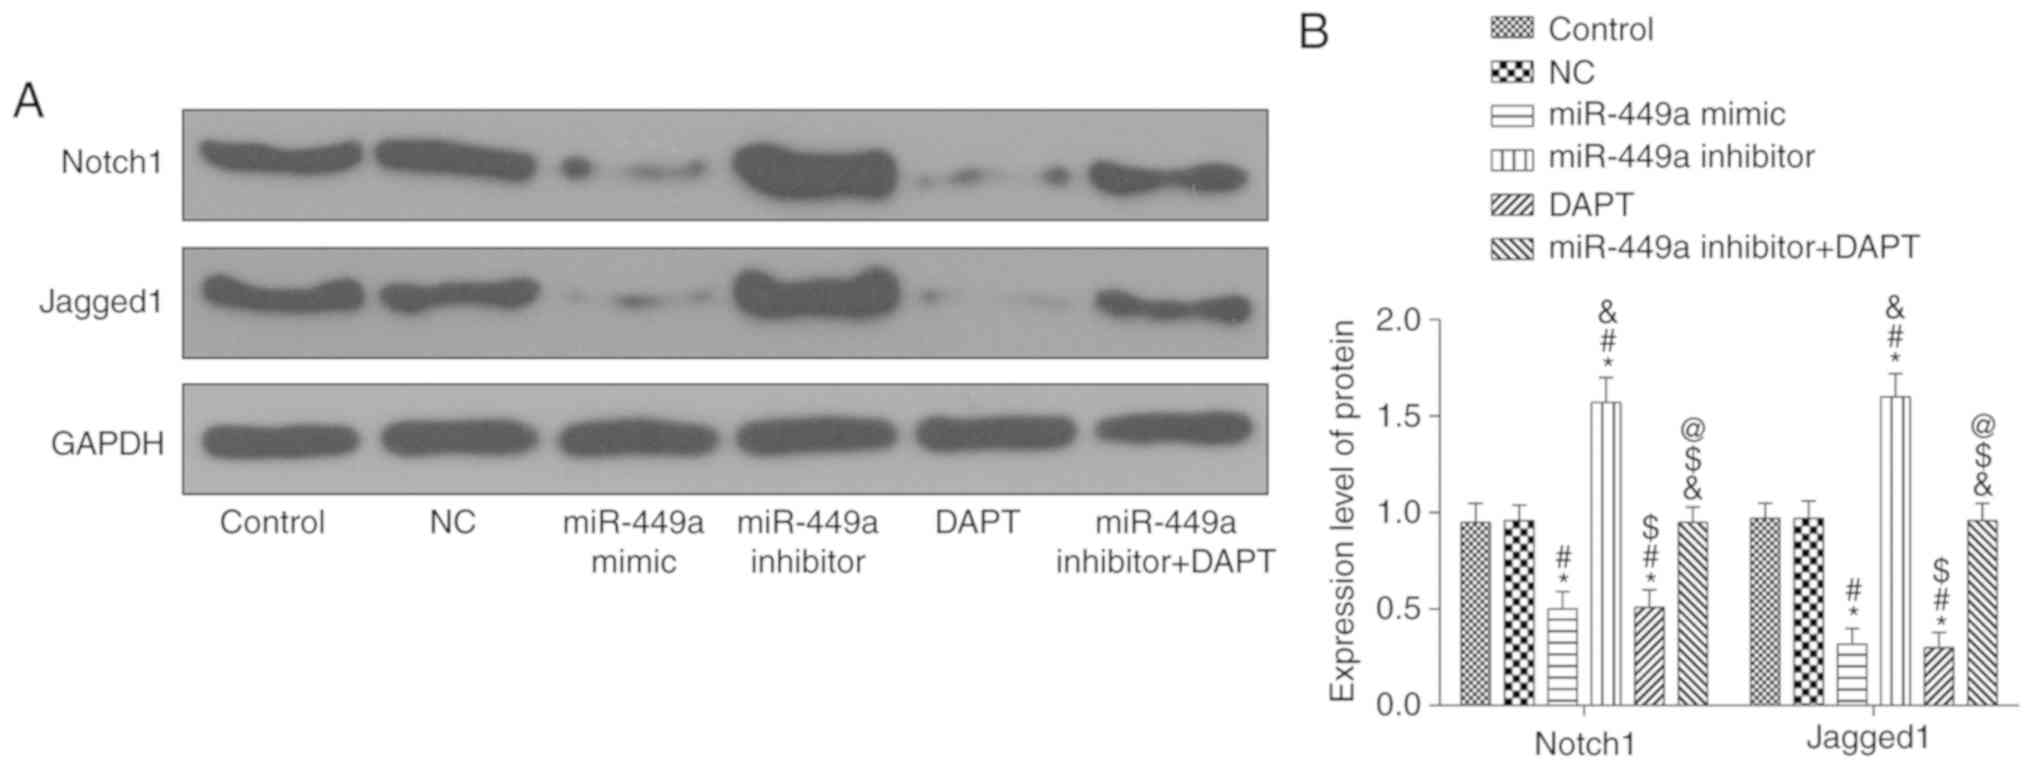
Notch1 and Jagged1 protein expression
levels
Results of western blotting are presented in
Fig. 3. Compared with the control
group, there was no significant difference in the protein
expression levels of genes in the NC group (P>0.05), however,
the protein expression levels of Notch1 and Jagged1 in the miR-449a
mimic group and DAPT group were significantly decreased (both
P<0.05). In addition, Notch1 and Jagged1 protein expression
levels in the miR-449a inhibitor group were significantly increased
(both P<0.05). Compared with the miR-449a inhibitor group,
Notch1 and Jagged1 protein expression levels in the miR-449a
inhibitor + DAPT group were significantly decreased (both
P<0.05).
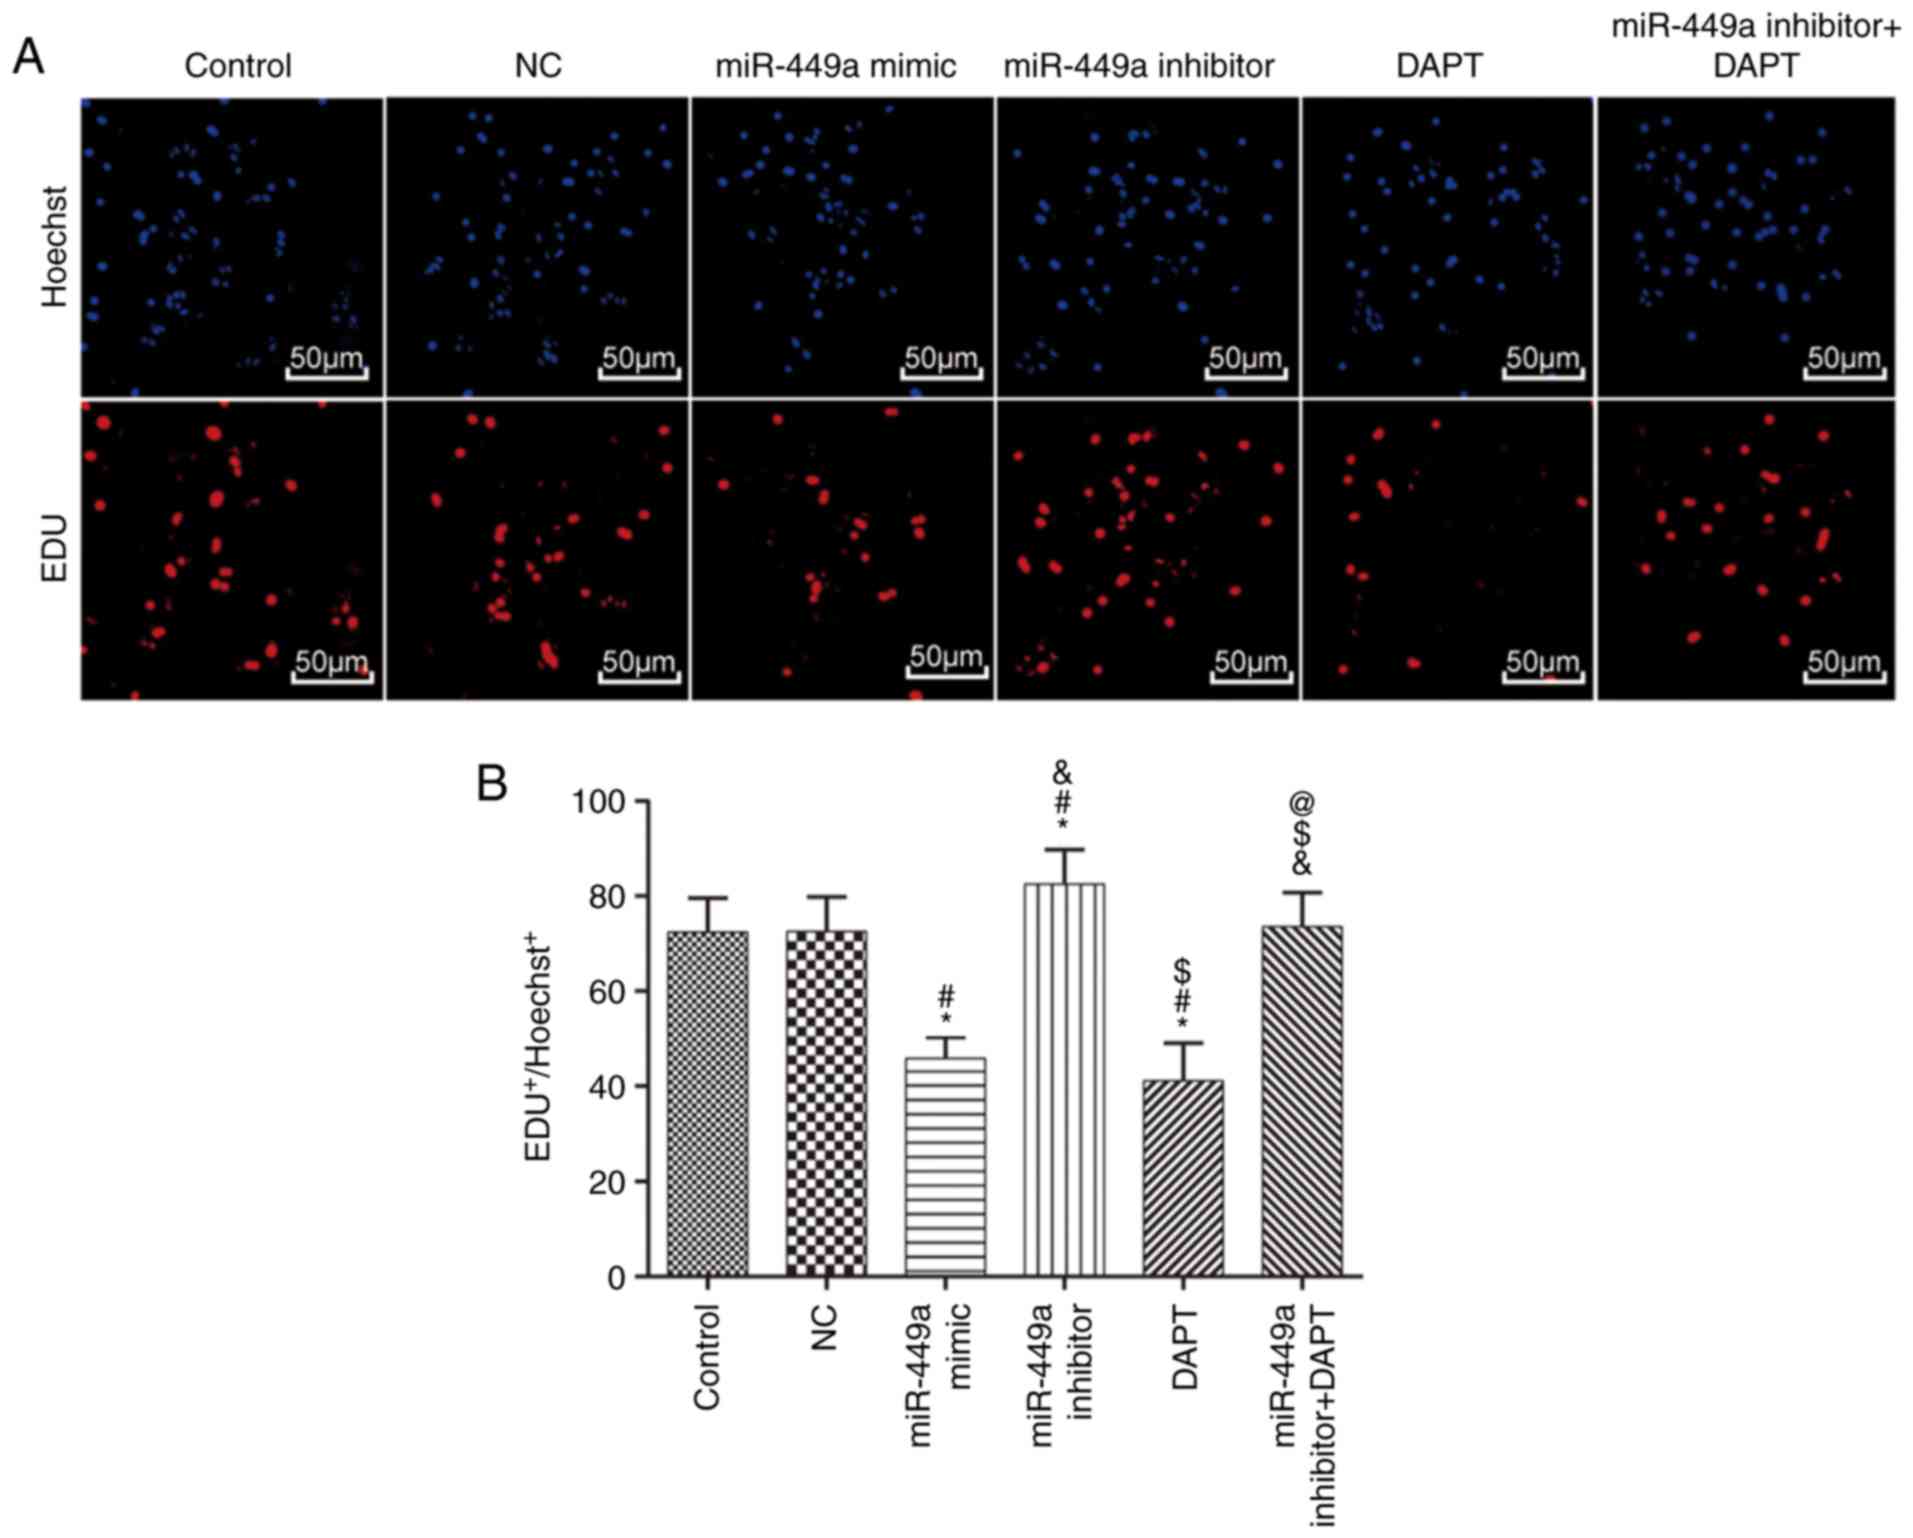
Cell proliferation
Results of EdU are presented in Fig. 4. Compared with the control group,
there was no significant difference in the EdU-positive cell rate
in the NC group (P>0.05), however, the EdU-positive cell rate in
the miR-449a mimic group and DAPT group was significantly lower
(both P<0.05). In addition, the EdU-positive cell rate in the
miR-449a inhibitor group was significantly higher (P<0.05).
Compared with miR-449a inhibitor group, the EdU-positive cell rate
in the miR-449a inhibitor + DAPT group was significantly decreased
(P<0.05).
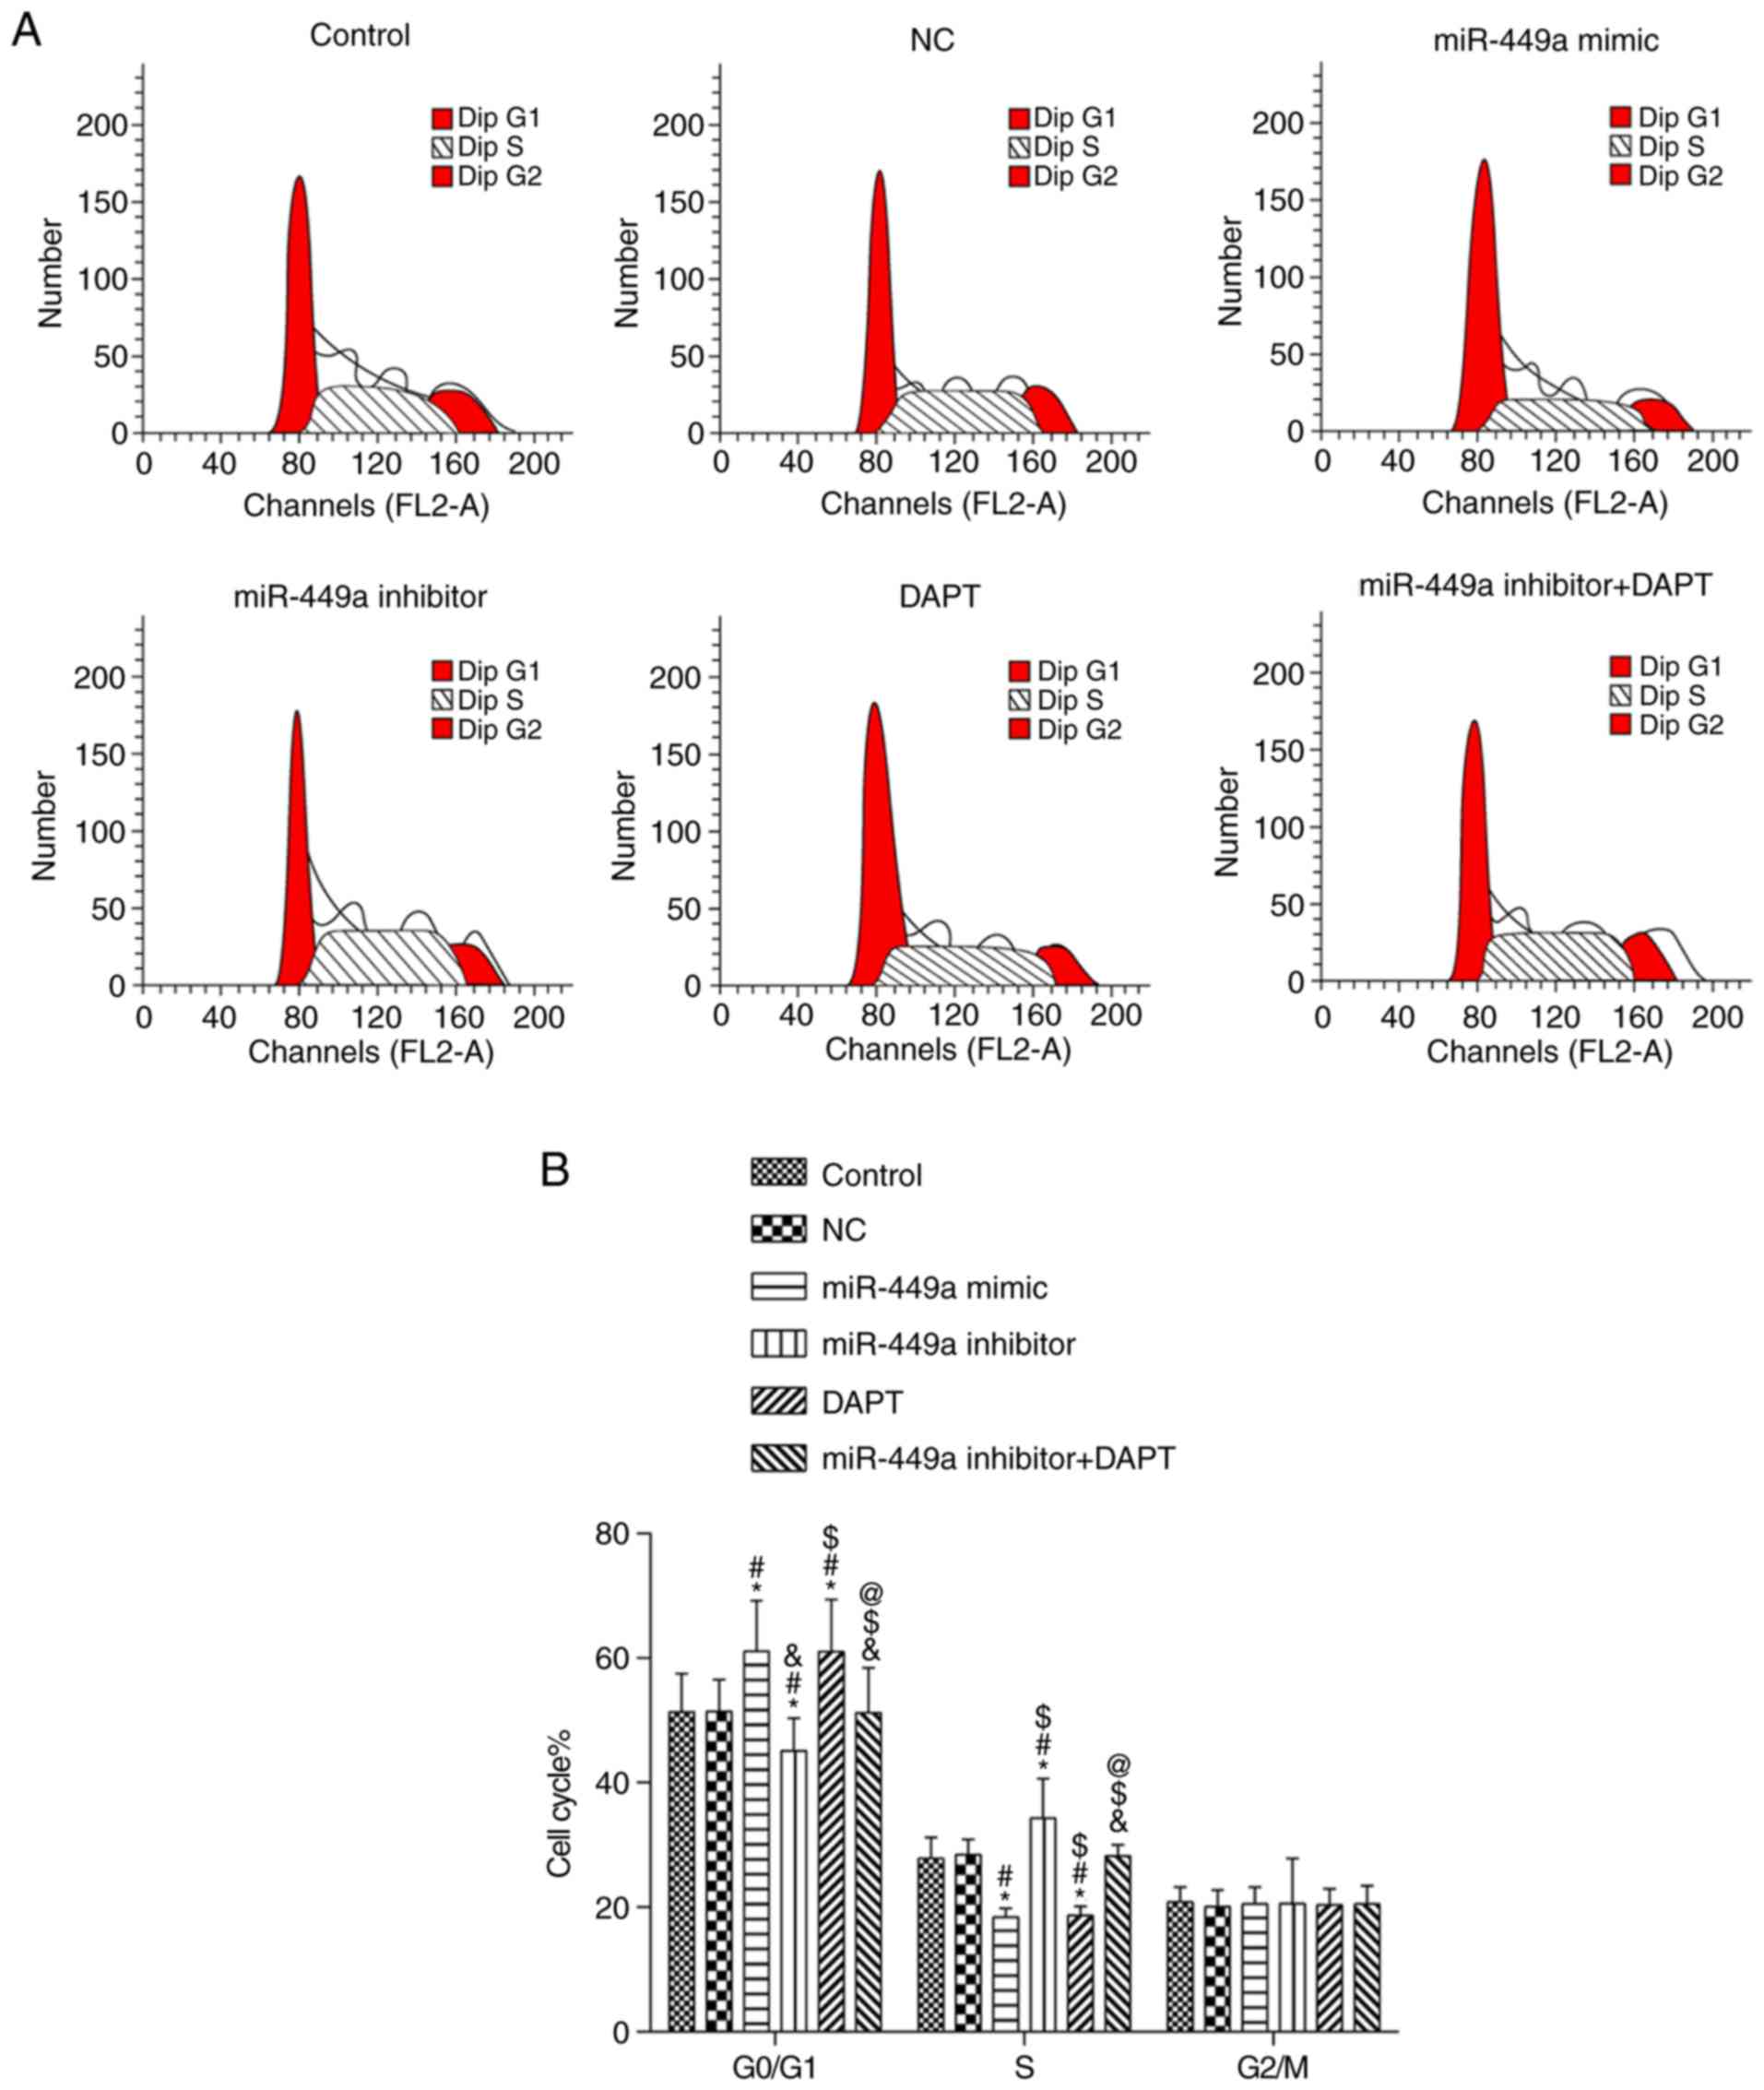
Cell cycle
Results of flow cytometry are presented in Fig. 5. Compared with the control group,
there was no significant difference in each phase in the NC group
and miR-449a inhibitor + DAPT group (both P>0.05); there was a
significant increase of cells in the G1 phase and a significant
decrease of cells in the S phase in the miR-449a mimic group and
DAPT group (both P<0.05). There was also a significant decrease
of cells in the G1 phase and a significant increase of cells in the
S phase in the miR-449a inhibitor group (both P<0.05). Compared
with miR-449a inhibitor group, there was a significant increase of
cells in the G1 phase and a significant decrease of cells in the S
phase in the miR-449a inhibitor + DAPT group (both P<0.05).
There was no significant difference in cells in the G2 phase among
groups (P>0.05).
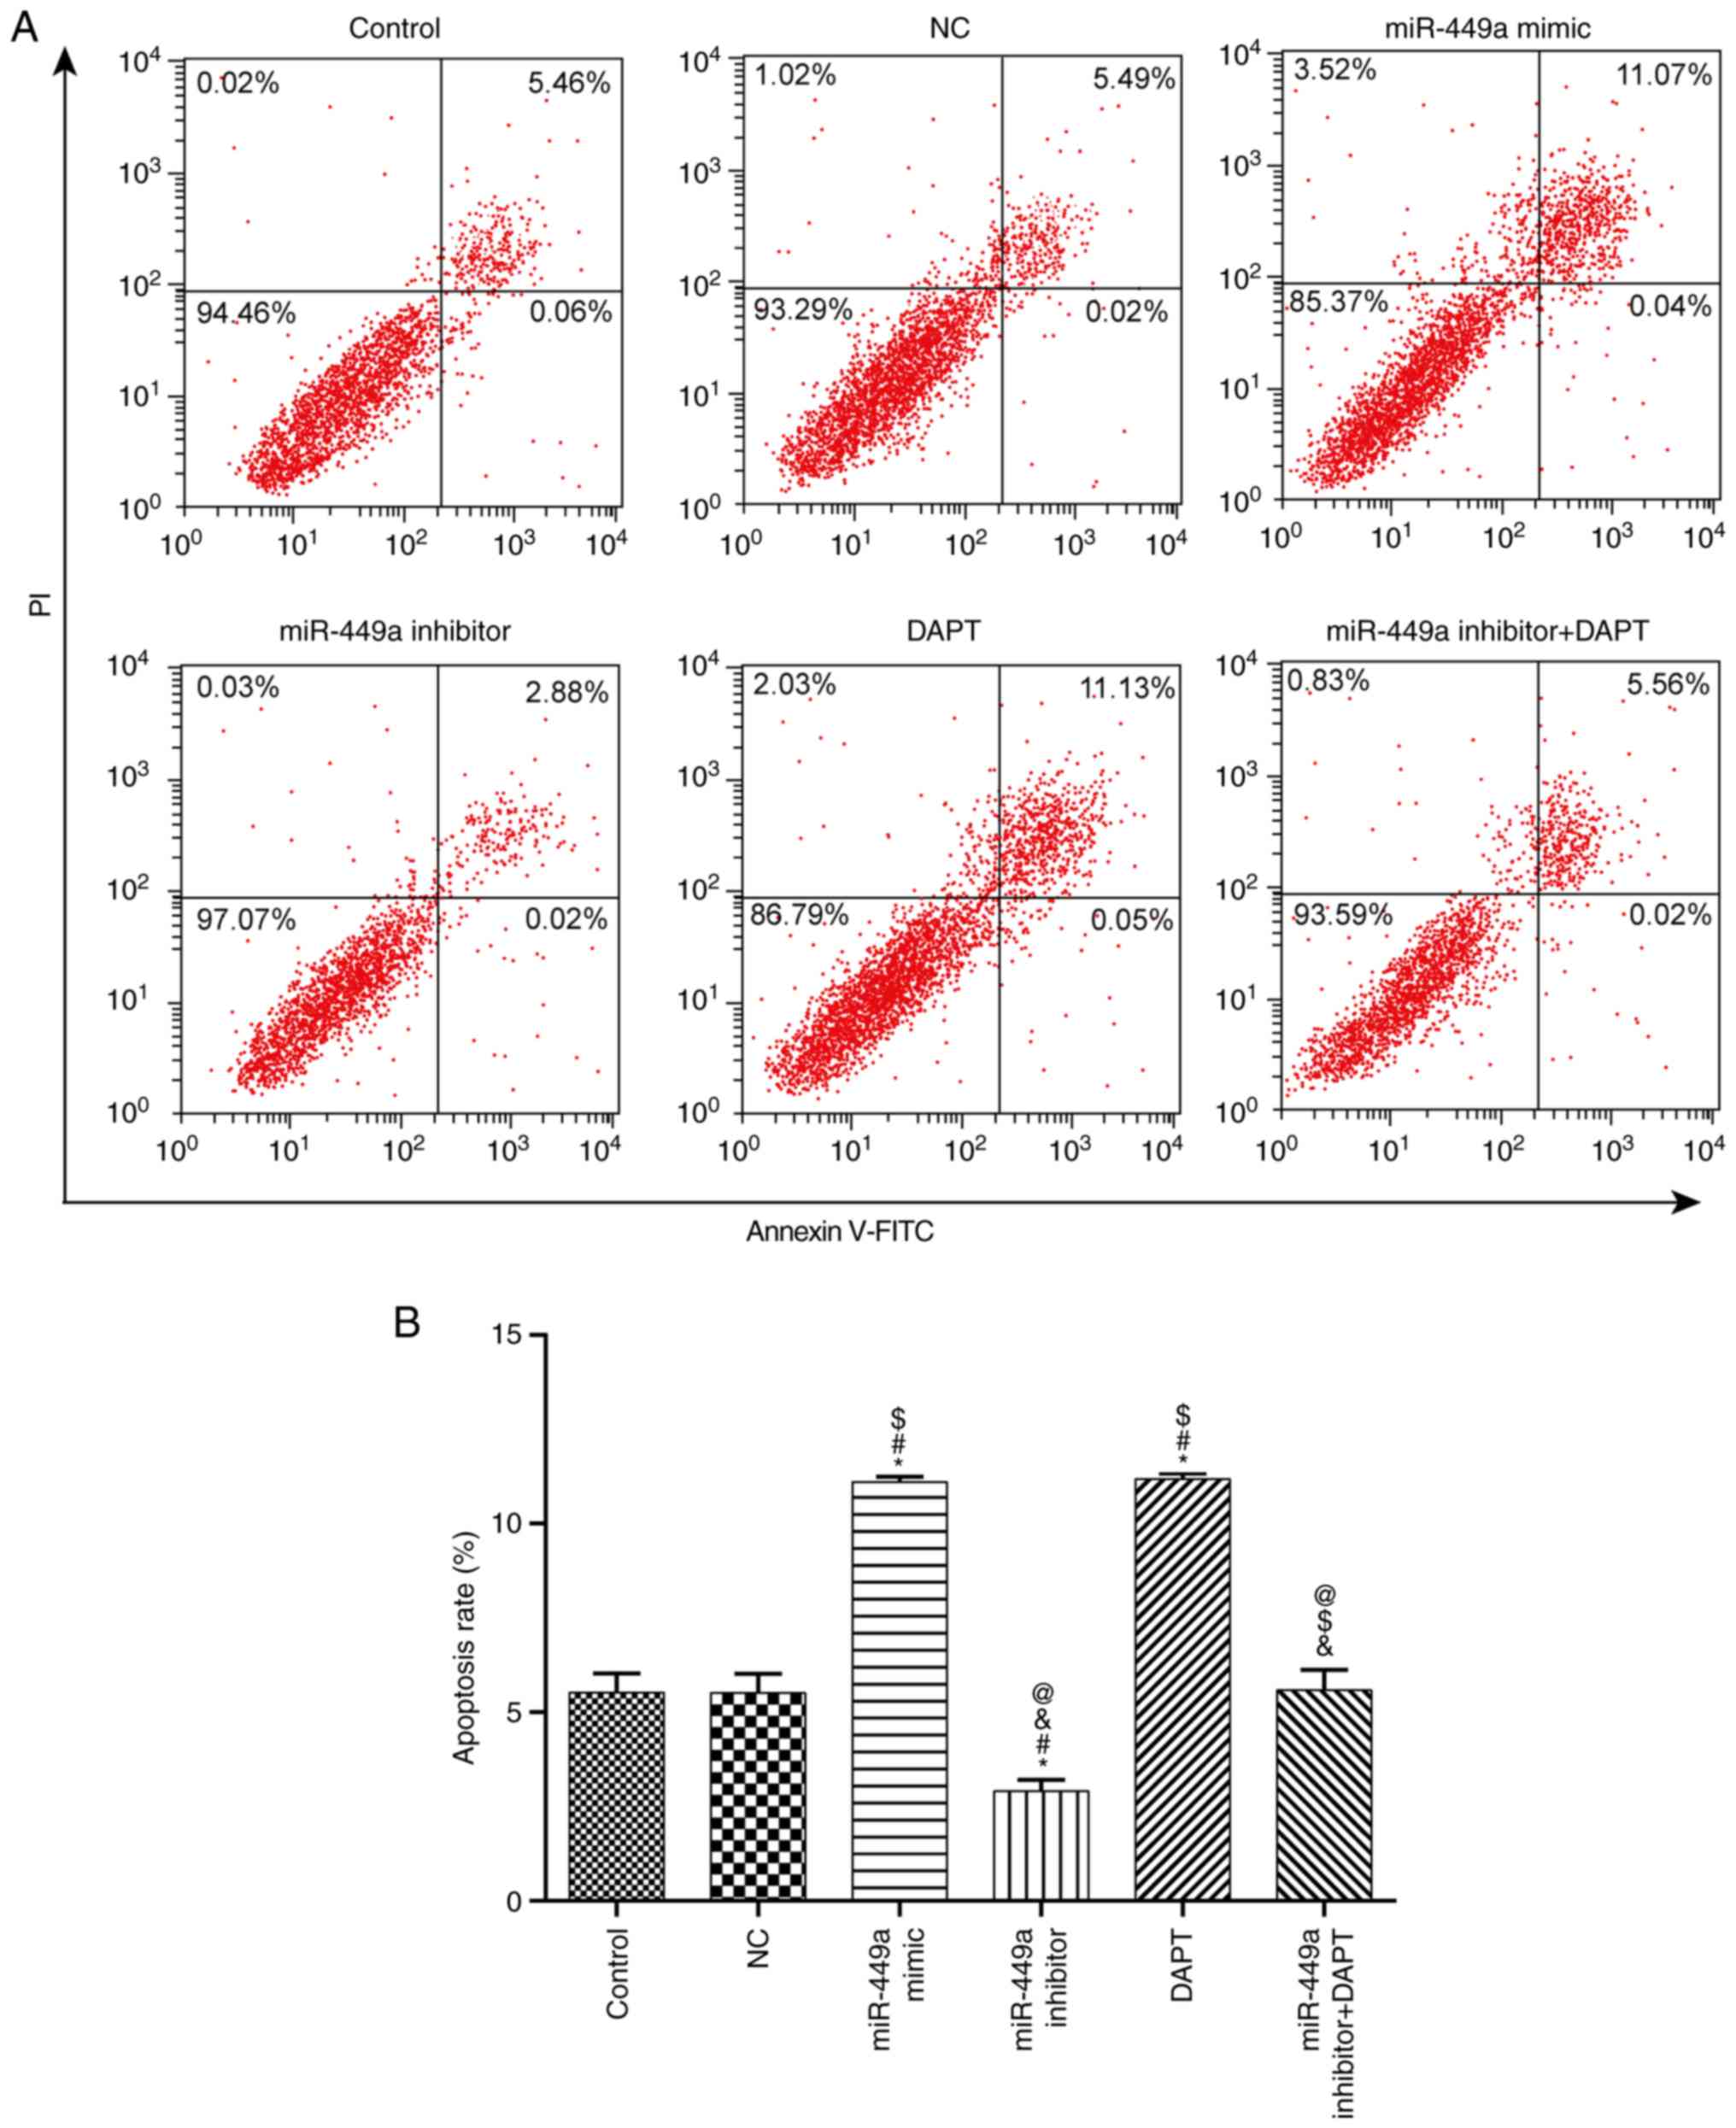
Apoptosis
Apoptosis was detected by flow cytometry (Fig. 6). Compared with the control group,
there was no significant difference in apoptosis in the NC group
and miR-449a inhibitor + DAPT group (both P>0.05), however,
apoptosis was significantly increased in the miR-449a mimic group
and DAPT group (both P<0.05), and significantly decreased in the
miR-449a inhibitor group (P<0.05).
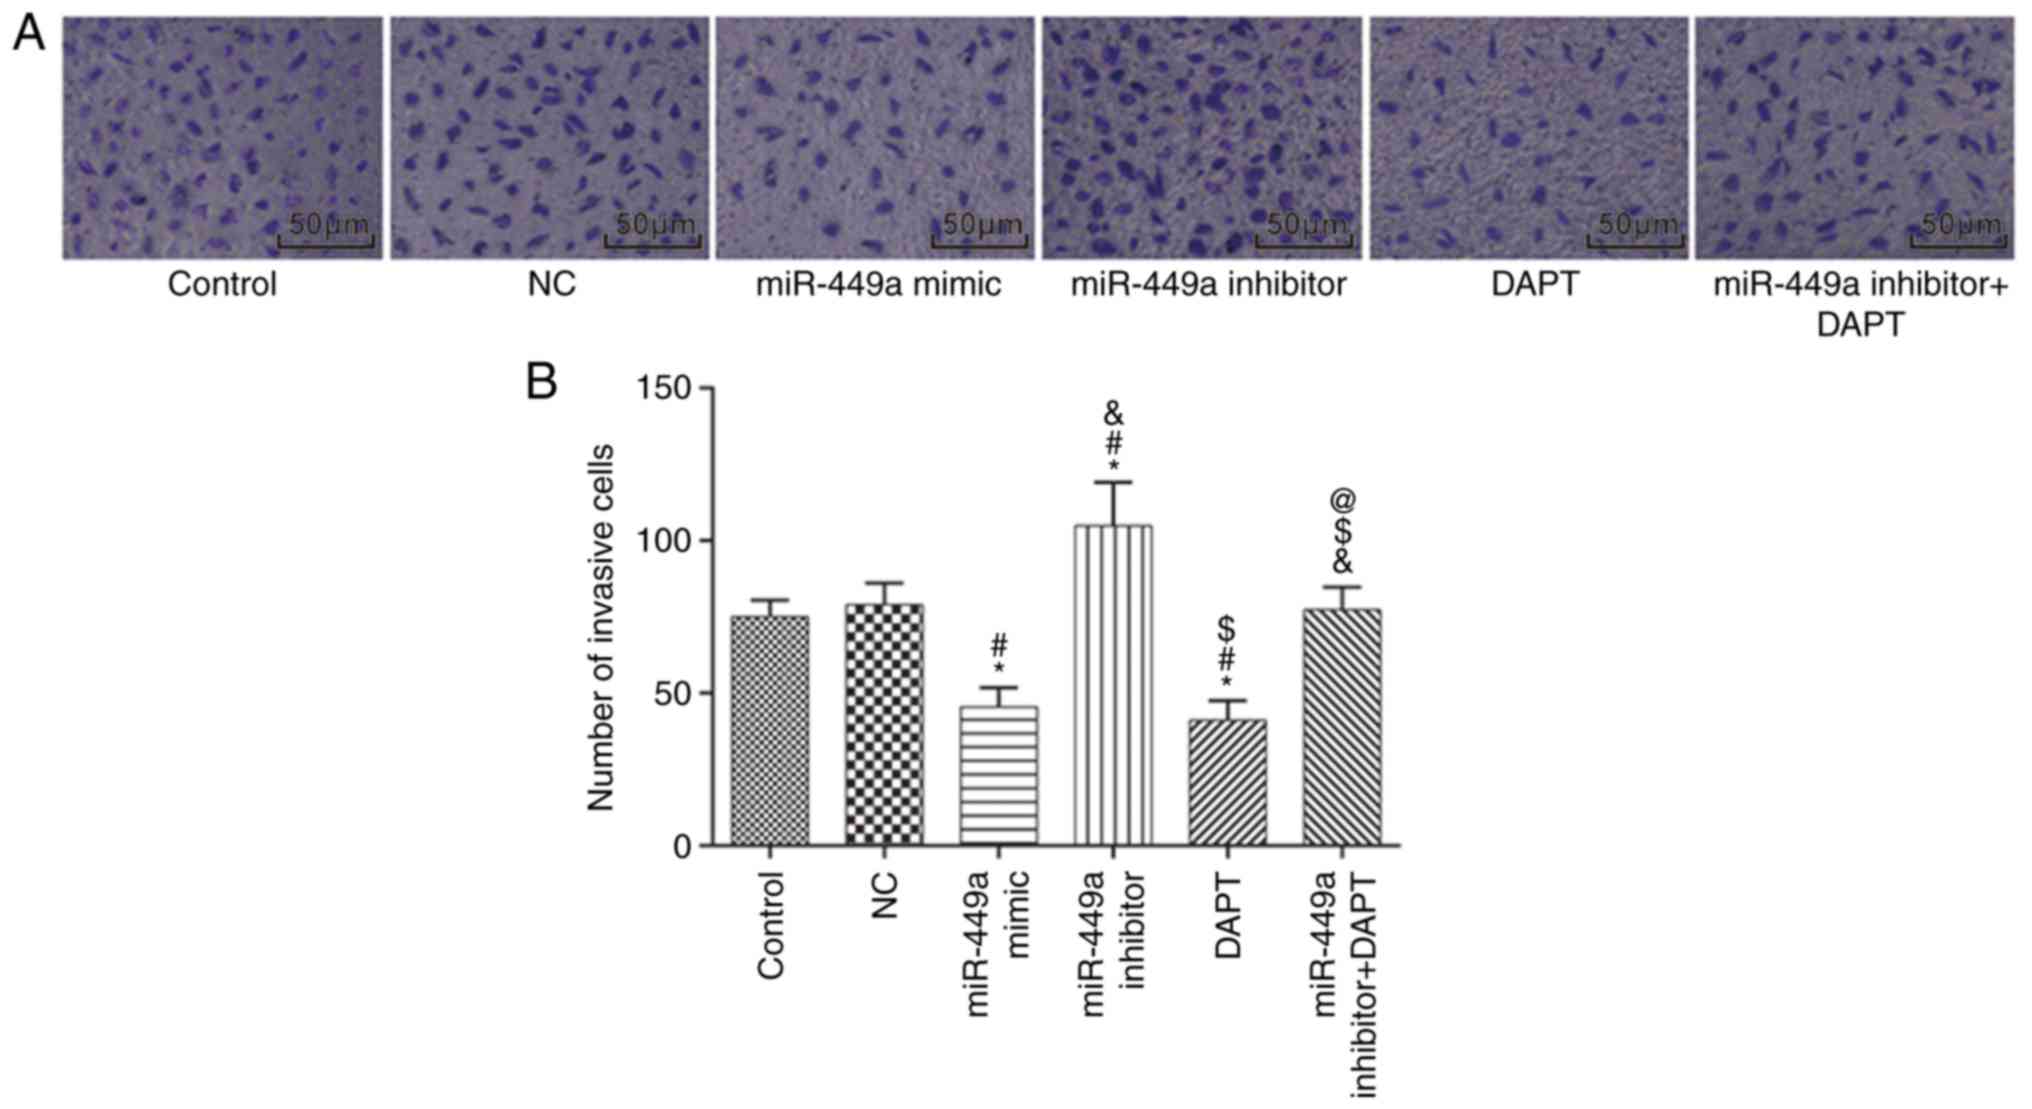
Cell invasion
Cell invasion was detected by Transwell assay
(Fig. 7). Compared with the control
group, there was no significant difference in the number of
invasive cells in the NC group and the miR-449a inhibitor + DAPT
group (both P>0.05); the number of invasive cells was
significantly decreased in the miR-449a mimic group and DAPT group
(both P<0.05), and significantly increased in the miR-449a
inhibitor group (P<0.05). Compared with the miR-449a inhibitor
group, the number of invasive cells was significantly decreased in
the miR-449a inhibitor + DAPT group (P<0.05).
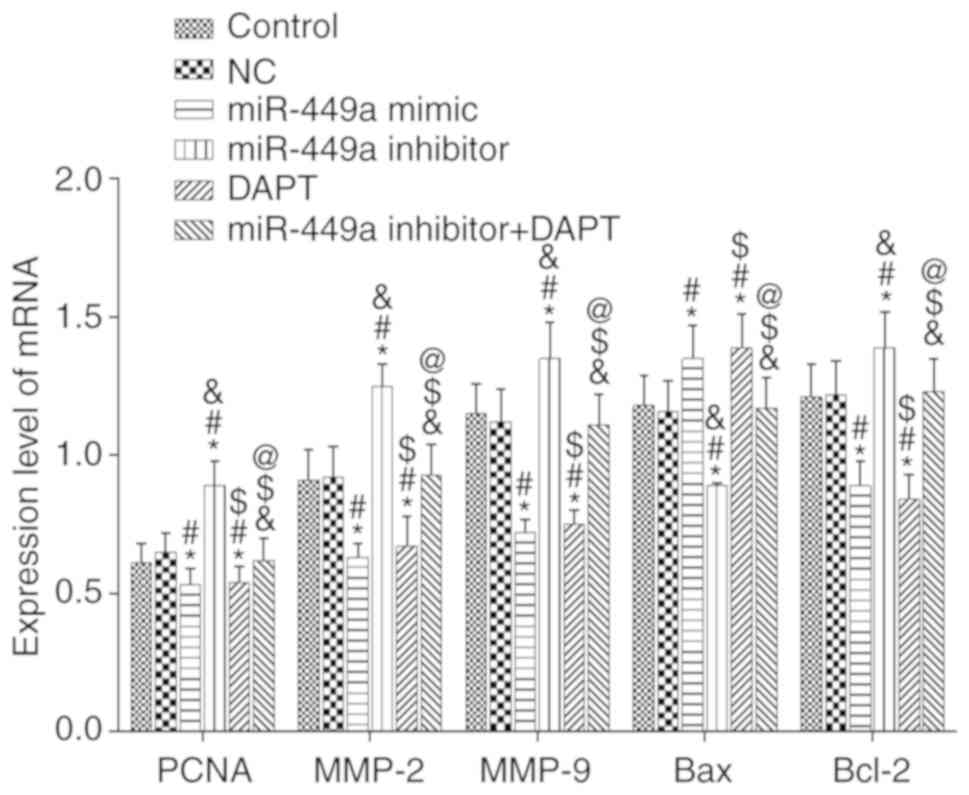
mRNA expression of PCNA, MMP-2, MMP-9,
Bcl-2 and Bax
The mRNA expression of proliferation-related factor
PCNA, invasion-related factors MMP-2, MMP-9 and apoptosis-related
factors Bcl-2 and Bax were detected by qRT-PCR (Fig. 8). Compared with the control group,
there was no significant difference in the expression of these
genes in the NC group and the miR-449a inhibitor + DAPT group (all
P>0.05), however, there was a significant decrease in the mRNA
expression of PCNA, MMP-2, MMP-9 and Bcl-2 and an increase of Bax
mRNA expression in the miR-449a mimic group and DAPT group (all
P<0.05). In addition, there was a significant increase in the
mRNA expression of PCNA, MMP-2, MMP-9 and Bcl-2 and a decrease of
Bax mRNA expression in the miR-449a inhibitor group (all
P<0.05). Compared with the miR-449a inhibitor group, there was a
significant decrease in the mRNA expression of PCNA, MMP-2, MMP-9
and Bcl-2 and increase of Bax mRNA expression in miR-449a inhibitor
+ DAPT group (all P<0.05).
Protein expression of PCNA, MMP-2,
MMP-9, Bcl-2 and Bax
The results of the western blotting are presented in
Fig. 9. Compared with the control
group, there was no significant difference in the expression of
these proteins in the NC group and miR-449a inhibitor + DAPT group
(all P>0.05), however, there was a significant decrease in the
protein expression of PCNA, MMP-2, MMP-9 and Bcl-2 and an increase
of Bax protein expression in the miR-449a mimic group and DAPT
group (all P<0.05). In addition, there was a significant
increase in the protein expression of PCNA, MMP-2, MMP-9 and Bcl-2
and a decrease of Bax protein expression in the miR-449a inhibitor
group (all P<0.05). Compared with the miR-449a inhibitor group,
there was a significant decrease in the protein expression of PCNA,
MMP-2, MMP-9 and Bcl-2 and an increase of Bax protein expression in
the miR-449a inhibitor + DAPT group (all P<0.05).
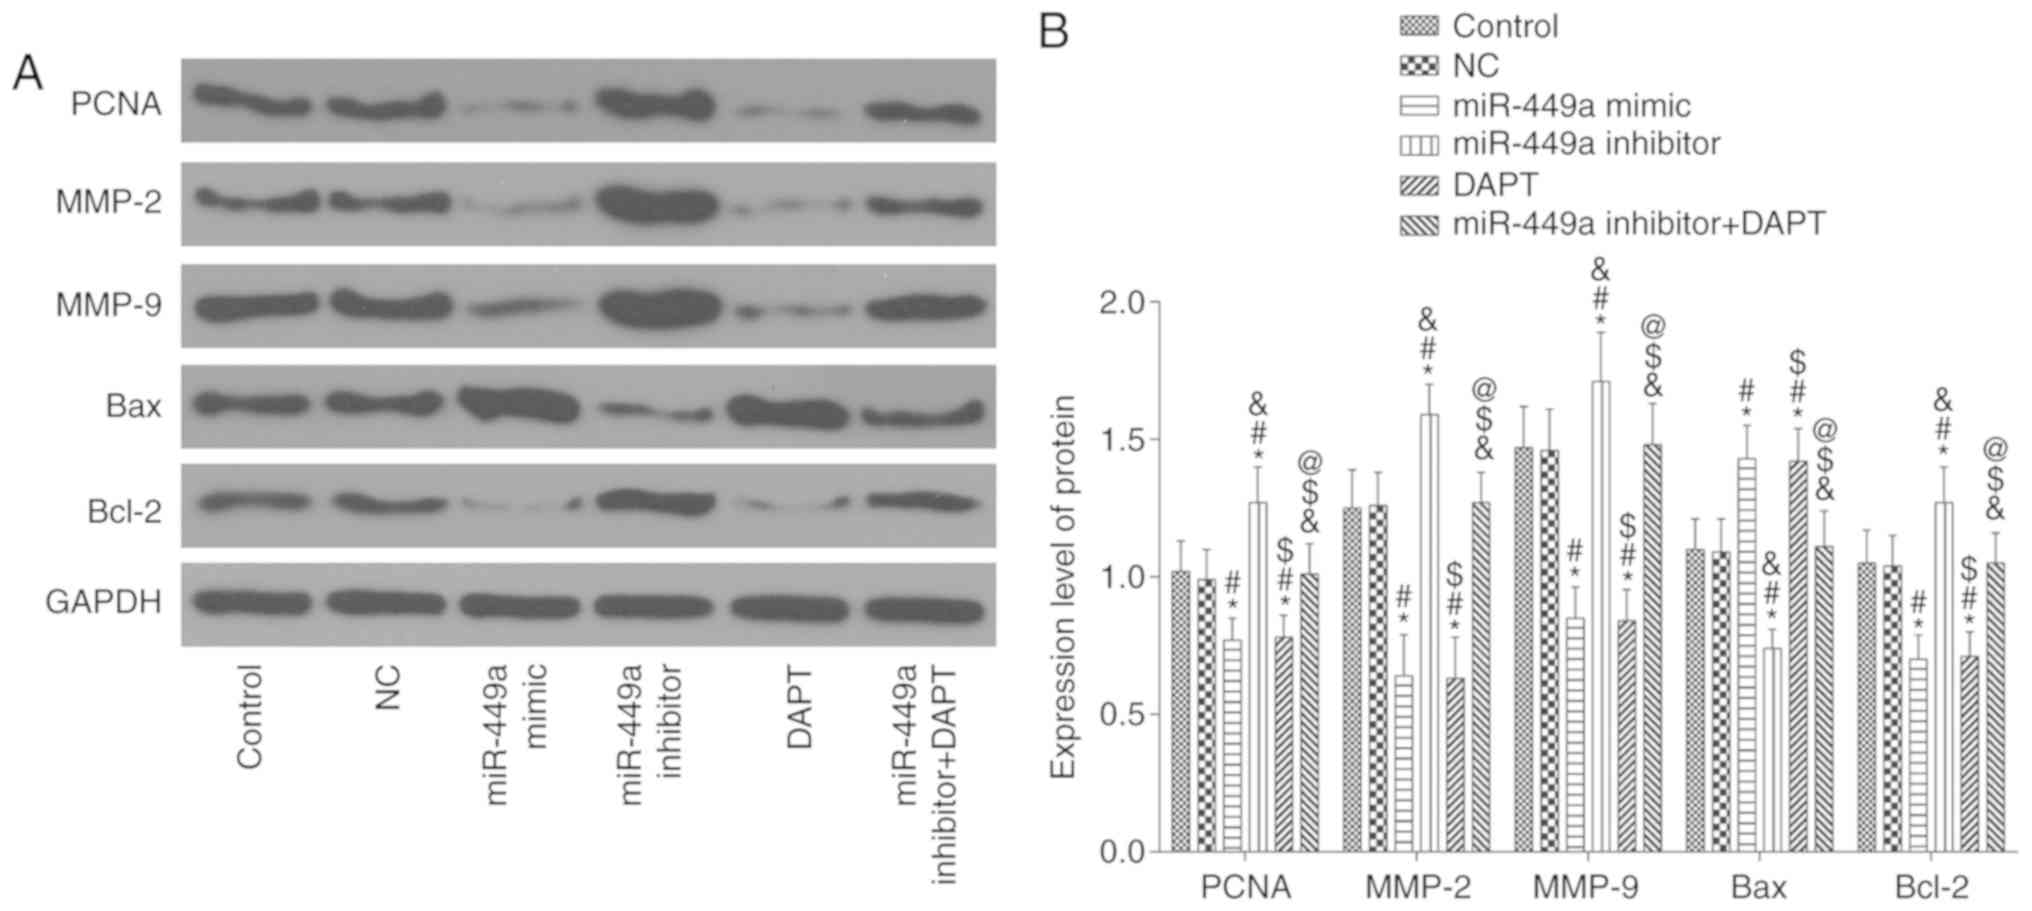 | Figure 9.PCNA, MMP-2, MMP-9, Bax and Bcl-2
protein expression. (A) Protein bands. (B) PCNA, MMP-2, MMP-9, Bax
and Bcl-2 protein expression. *P<0.05, compared with the control
group; #P<0.05, compared with the NC group;
&P<0.05, compared with the miR-449a mimic group;
$P<0.05, compared with the miR-449a inhibitor group;
@P<0.05, compared with the DAPT group. NC, negative
control. |
Discussion
Thyroid carcinoma is one of the most common
malignant tumors in the head and neck, and PTC is the most common
cancer among thyroid carcinomas, accounting for about 80%. The
latest clinical data indicate that the incidence rate of thyroid
carcinoma is on the rise worldwide (18). PTC has been revealed to be
accompanied by distant lymphatic metastasis when diagnosed, due to
the strong invasive ability of PTC cells and unapparent symptoms at
the early stage. It is hard to trace the pathogenesis of PTC.
Therefore, it is urgent to explore the molecular mechanism in the
development of PTC and to develop broad-spectrum molecular targets
and therapeutic drugs.
The downregulation of miR-449 has been observed in
various human malignant tumors including lung cancer (19), gastric cancer (20) and colon cancer stem cells (21). The Notch receptor is a decisive
factor of cell fate during the process of normal cell development
(22,23). The Notch signaling pathway as an
important mechanism determining cell fate plays a vital role in the
regulation of cell differentiation and development (21). The Notch signaling pathway also
plays an important role in cell proliferation and apoptosis
(24–26). Aberrantly high-expression of Notch
receptor and its ligands in cancer cells has been confirmed in
various cancers (27,28).
It has been confirmed in some literature that Notch1
expression is increased in PTC and can promote downstream Jagged1
expression by activating the Notch signaling pathway, affecting the
apoptosis, proliferation and invasion of PTC cells (29). In the present study, the Notch
signaling pathway inhibitor DAPT was used to treat thyroid
carcinoma cells TPC-1. It was revealed that there was significantly
decreased expression of Notch1 and Jagged1, proliferation-related
factor PCNA, invasion-related factors MMP-2, MMP-9 and apoptosis
inhibitor Bcl-2 expression in cells, increased expression of
apoptosis promoter Bax, decreased cell proliferation, blocked cell
cycle progression, an increased apoptosis rate, and decreased cell
invasion. The results revealed that the inhibition of the Notch
signaling pathway suppressed the proliferation and invasion of PTC
cells and promoted their apoptosis, which was consistent with
previous research. To further explore the regulatory mechanism of
the upstream Notch signaling pathway, it was predicted through a
bioinformatics prediction website that there was a target
relationship between Notch1 and miR-449. A previous study also
indicated that miR-449 had an inhibitory effect on a variety of
cancers (30). By dual-luciferase
reporter assay, the negative regulation of miR-449 on Notch1 was
also confirmed. TPC-1 cells were transfected with miR-449 mimic,
miR-449 inhibitor and miR-449 inhibitor + DAPT, and the results
revealed that miR-449 overexpression inhibited the proliferation
and invasion of PTC cells and promoted their apoptosis. miR-449
inhibited the Notch signaling pathway by targetedly inhibiting
Notch1 expression, which downregulated Jagged1 expression,
inhibited the proliferation and invasion of PTC cells, and promoted
their apoptosis. Moreover, the inhibition of the Notch signaling
pathway recovered the promotion of PTC progression induced by
miR-449 silencing. In the present study, the downregulation of
miR-449 expression was detected in TPC-1 cells.
In the present study, it was confirmed that miR-449a
mediated the Notch signaling pathway by targeting Notch1 to inhibit
PTC progression. The underlying mechanism of PTC was further
elucidated, which established the theoretical basis for PTC
treatment in clinical practice. In addition, mice experiments are
required to verify the aforementioned results. However, the
relationship between miR-449a and PTC, the molecular mechanism of
the miR-449a downstream Notch1 gene which affects PTC, and the
targeted regulatory network of miR-449a in PTC are not entirely
clear yet.
Acknowledgements
Not applicable.
Funding
The present study was supported by the Affiliated
Hospital of Guilin Medical University (no. 20170109-7).
Availability of data and materials
The analysed data sets generated during the study
are available from the corresponding author on reasonable
request.
Authors' contributions
YH contributed to all the tasks, including data
collection, data analysis, experimental operation, manuscript
design and writing. FF and RY made substantial contributions to the
revision of the manuscript, the design of the study, and
interpretation of data for this study. All authors provided final
approval of the version to be published.
Ethics approval and consent to
participate
Not applicable.
Patient consent for publication
Not applicable.
Competing interests
The authors declare that they have no competing
interests.
Glossary
Abbreviations
Abbreviations:
|
PTC
|
papillary thyroid carcinoma
|
|
miRNA
|
microRNA
|
|
NC
|
negative control
|
|
PBS
|
phosphate-buffered saline
|
|
PCR
|
polymerase chain reaction
|
|
TBST
|
tris-buffered saline Tween
|
|
PI
|
propidium iodide
|
References
|
1
|
Li Z, Huang X, Xu J, Su Q, Zhao J and Ma
J: miR-449 overexpression inhibits papillary thyroid carcinoma cell
growth by targeting RET kinase-β-catenin signaling pathway. Int J
Oncol. 49:1629–1637. 2016. View Article : Google Scholar : PubMed/NCBI
|
|
2
|
Wu D, Liu J, Chen J, He H, Ma H and Lv X:
miR-449a suppresses tumor growth, migration, and invasion in
non-small cell lung cancer by targeting a HMGB1-Mediated NF-κB
signaling pathway. Oncol Res. 27:227–235. 2019. View Article : Google Scholar : PubMed/NCBI
|
|
3
|
Zhang YL, Li XB, Hou YX, Fang NZ, You JC
and Zhou QH: The lncRNA XIST exhibits oncogenic properties via
regulation of miR-449a and Bcl-2 in human non-small cell lung. Acta
Pharmacol Sin. 38:371–381. 2017. View Article : Google Scholar : PubMed/NCBI
|
|
4
|
Ji C, Xu Q, Guo L, Wang X, Ren Y, Zhang H,
Zhu W, Ming Z, Yuan Y, Ren X, et al: eEF-2 Kinase-targeted miR-449b
confers radiation sensitivity to cancer cells. Cancer Lett.
418:64–74. 2018. View Article : Google Scholar : PubMed/NCBI
|
|
5
|
Zhang H, Cai Y, Zheng L, Zhang Z, Lin X
and Jiang N: Long noncoding RNA NEAT1 regulate papillary thyroid
cancer progression by modulating miR-129-5p/KLK7 expression. J Cell
Physiol. 233:6638–6648. 2018. View Article : Google Scholar : PubMed/NCBI
|
|
6
|
Geraldo MV, Fuziwara CS, Friguglieti CU,
Costa RB, Kulcsar MA, Yamashita AS and Kimura ET: MicroRNAs
miR-146-5p and let-7f as prognostic tools for aggressive papillary
thyroid carcinoma: A case report. Arq Bras Endocrinol Metabol.
56:552–557. 2012. View Article : Google Scholar : PubMed/NCBI
|
|
7
|
Bou Kheir T, Futoma-Kazmierczak E,
Jacobsen A, Krogh A, Bardram L, Hother C, Grønbaek K, Federspiel B,
Lund AH and Friis-Hansen L: miR-449 inhibits cell proliferation and
is down-regulated in gastric cancer. Mol Cancer. 10:292011.
View Article : Google Scholar : PubMed/NCBI
|
|
8
|
Kim HJ, Kim MJ, Kim A, Jung CW, Park S,
Koh JS and Myung JK: The role of notch1 signaling in anaplastic
thyroid carcinoma. Cancer Res Treat. 49:509–517. 2017. View Article : Google Scholar : PubMed/NCBI
|
|
9
|
Cao YW, Wan GX, Sun JP, Cui XB, Hu JM,
Liang WH, Zheng YQ, Li WQ and Li F: Implications of the
Notch1-Snail/Slug-epithelial to mesenchymal transition axis for
lymph node metastasis in infiltrating ductal carcinoma. Kaohsiung J
Med Sci. 31:70–76. 2015. View Article : Google Scholar : PubMed/NCBI
|
|
10
|
Gopalakrishnan N, Sivasithamparam ND and
Devaraj H: Synergistic association of Notch and NFκB signaling and
role of Notch signaling in modulating epithelial to mesenchymal
transition in colorectal adenocarcinoma. Biochimie. 107:310–318.
2014. View Article : Google Scholar : PubMed/NCBI
|
|
11
|
Wang Z, Li Y, Kong D and Sarkar FH: The
role of Notch signaling pathway in epithelial-mesenchymal
transition (EMT) during development and tumor aggressiveness. Curr
Drug Targets. 11:745–751. 2010. View Article : Google Scholar : PubMed/NCBI
|
|
12
|
Bao B, Wang Z, Ali S, Kong D, Li Y, Ahmad
A, Banerjee S, Azmi AS, Miele L and Sarkar FH: Notch-1 induces
epithelial-mesenchymal transition consistent with cancer stem cell
phenotype in pancreatic cancer cells. Cancer Lett. 307:26–36. 2011.
View Article : Google Scholar : PubMed/NCBI
|
|
13
|
Hu KF, Kong XY, Zhong MC, Wan HY, Lin N
and Pei XH: Brucine inhibits bone metastasis of breast cancer cells
by suppressing Jagged1/Notch1 signaling pathways. Chin J Integr
Med. 23:110–116. 2017. View Article : Google Scholar : PubMed/NCBI
|
|
14
|
Yang Q, Cao X, Tao G, Zhou F, Zhao P, Shen
Y and Chen X: Effects of FOXJ2 on TGF-beta1-induced
epithelial-mesenchymal transition through Notch signaling pathway
in non-small lung cancer. Cell Biol Int. 41:79–83. 2017. View Article : Google Scholar : PubMed/NCBI
|
|
15
|
Bi YL, Min M, Shen W and Liu Y: Numb/Notch
signaling pathway modulation enhances human pancreatic cancer cell
radiosensitivity. Tumour Biol. 37:15145–15155. 2016. View Article : Google Scholar : PubMed/NCBI
|
|
16
|
Cheng J, Wu Q, Lv R, Huang L, Xu B, Wang
X, Chen A and He F: MicroRNA-449a inhibition protects H9C2 cells
against hypoxia/reoxygenation-induced injury by targeting the
Notch-1 signaling pathway. Cell Physiol Biochem. 46:2587–2600.
2018. View Article : Google Scholar : PubMed/NCBI
|
|
17
|
Livak K and Schmittgen T: Analysis of
relative gene expression data using real-time quantitative PCR and
the 2(-Delta Delta C(T)) method. Methods. 25:402–408. 2001.
View Article : Google Scholar : PubMed/NCBI
|
|
18
|
Hu J, Li C, Liu C, Zhao S, Wang Y and Fu
Z: Expressions of miRNAs in papillary thyroid carcinoma and their
associations with the clinical characteristics of PTC. Cancer
Biomark. 18:87–94. 2017. View Article : Google Scholar : PubMed/NCBI
|
|
19
|
Luo W, Huang B, Li Z, Li H, Sun L, Zhang
Q, Qiu X and Wang E: MicroRNA-449a is downregulated in non-small
cell lung cancer and inhibits migration and invasion by targeting
c-Met. PLoS One. 8:e647592013. View Article : Google Scholar : PubMed/NCBI
|
|
20
|
Yang X, Wang HL, Liang HW, Liang L, Wen
DY, Zhang R, Chen G and Wei DM: Clinical significance of
microRNA-449a in hepatocellular carcinoma with microarray data
mining together with initial bioinformatics analysis. Exp Ther Med.
15:3247–3258. 2018.PubMed/NCBI
|
|
21
|
Li F, Liang J and Bai L: MicroRNA-449a
functions as a tumor suppressor in pancreatic cancer by the
epigenetic regulation of ATDC expression. Biomed Pharmacother.
103:782–789. 2018. View Article : Google Scholar : PubMed/NCBI
|
|
22
|
Aster JC, Pear WS and Blacklow SC: The
varied roles of notch in cancer. Annu Rev Pathol. 12:245–275. 2017.
View Article : Google Scholar : PubMed/NCBI
|
|
23
|
Rong C, Feng Y and Ye Z: Notch is a
critical regulator in cervical cancer by regulating Numb splicing.
Oncol Lett. 13:2465–2470. 2017. View Article : Google Scholar : PubMed/NCBI
|
|
24
|
Yang X, Duan B and Zhou X: Long non-coding
RNA FOXD2-AS1 functions as a tumor promoter in colorectal cancer by
regulating EMT and Notch signaling pathway. Eur Rev Med Pharmacol
Sci. 21:3586–3591. 2017.PubMed/NCBI
|
|
25
|
Zhou Y, An Q, Guo RX, Qiao YH, Li LX,
Zhang XY and Zhao XL: miR424-5p functions as an anti-oncogene in
cervical cancer cell growth by targeting KDM5B via the Notch
signaling pathway. Life Sci. 171:9–15. 2017. View Article : Google Scholar : PubMed/NCBI
|
|
26
|
Shen Q, Cohen B, Zheng W, Rahbar R, Martin
B, Murakami K, Lamorte S, Thompson P, Berman H, Zúñiga-Pflücker JC,
et al: Notch shapes the innate immunophenotype in breast cancer.
Cancer Discov. 7:1320–1335. 2017. View Article : Google Scholar : PubMed/NCBI
|
|
27
|
Li C, Liu S, Yan R, Han N, Wong KK and Li
L: CD54-NOTCH1 axis controls tumor initiation and cancer stem cell
functions in human prostate cancer. Theranostics. 7:67–80. 2017.
View Article : Google Scholar : PubMed/NCBI
|
|
28
|
Cai H, Yao J, An Y, Chen X, Chen W, Wu D,
Luo B, Yang Y, Jiang Y, Sun D and He X: LncRNA HOTAIR acts a
competing endogenous RNA to control the expression of notch3 via
sponging miR-613 in pancreatic cancer. Oncotarget. 8:32905–32917.
2017.PubMed/NCBI
|
|
29
|
Jung CW, Kong JS, Seol H, Park S, Koh JS,
Lee SS, Kim MJ, Choi IJ and Myung JK: Expression of activated
Notch1 and Hey1 in papillary thyroid carcinoma. Histopathology.
70:301–308. 2017. View Article : Google Scholar : PubMed/NCBI
|
|
30
|
Sun J, Shi R, Zhao S, Li X, Lu S, Bu H, Ma
X and Su C: E2F8, a direct target of miR-144, promotes papillary
thyroid cancer progression via regulating cell cycle. J Exp Clin
Cancer Res. 36:402017. View Article : Google Scholar : PubMed/NCBI
|