Introduction
Patient-derived xenograft (PDX) models are valuable
tools for preclinical cancer research studies (1). Several studies have reported that
patient-derived glioma stem cells (GSCs) maintain the phenotype and
genotype characteristics of the original tumors (2–4), and
GSC-derived xenografts recapitulate the distinctive cytological
hallmarks and diverse histological variants of the original tumors
(5). Therefore, PDX glioma models
have been considered as reliable tools to explore the biological
characteristics, therapeutic response and imaging biomarkers of
glioma (6).
Magnetic resonance imaging (MRI) is widely used for
clinical diagnosis, monitoring treatment and prognostic evaluation
of gliomas (7–9). Conventional MRI, including
T1-weighted and T2-weighted imaging provides
information on the anatomical structures of tumors and surrounding
tissues (10). Diffusion weighted
imaging (DWI)-MRI allows for non-invasive evaluation of the random
motion of water molecules (11),
and the apparent diffusion coefficient (ADC) value quantitatively
and accurately reflects the dispersion of water molecules and the
density of tumor cells, respectively, thereby providing information
on the growth and proliferation of tumor cells (12).
Dynamic contrast-enhanced (DCE)-MRI technology uses
two compartment models to determine the change in the concentration
of the contrast agent over time. The transfer coefficient
(Ktrans) derived from DCE-MRI can be used to reflect the
permeability of blood vessels, whereas the plasma volume parameter
(Vp) can be used to reflect plasma volume. Furthermore,
the volume fraction of the extravascular extracellular space
(Ve) can be used to reflect the volume of extracellular
space outside of the blood vessel. Finally, the rate transfer
coefficient (Kep) can be used to reflect the reflux rate
of the contrast agent via the changes in signal intensity of the
contrast agent over time in the blood vessels and extravascular
spaces (13,14). These MRI features are closely
associated with the histological classification and metabolic
process of glioma (15,16), which can reflect the molecular
characteristics (17) and genotype
(18) of this tumor type, and thus
provide a reliable basis for individualized diagnosis and treatment
(19).
However, whether the MRI features obtained from
patient-derived glioma xenograft models, which reflect the
biological characteristics and therapeutic response to glioma, are
equally applicable to the original human tumors has not been
determined, to the best of our knowledge. Therefore, the aim of the
present study was to examine the differences noted in the
characteristics of conventional MRI, DWI-MRI and DCE-MRI methods
between the original tumors and the corresponding patient-derived
orthotopic glioma xenografts. The aim of the present study was to
provide an experimental basis for the clinical application of
xenograft-derived MRI biomarkers.
Materials and methods
Clinical cases and experimental
animals
The subjects recruited for the present study
provided informed consent and consent for publication. Consent for
involvement of patients without the ability to suitably make their
own decisions was provided by their legal guardian. Surgical
specimens from 7 patients (referred to as patients 1–7) with
primary high-grade glioma who underwent surgery at the Daping
Hospital were collected between December 2016 and December 2017.
Tumors were graded according to the World Health Organization (WHO)
classification of tumors of the nervous system (20). Each tumor specimen was divided into
three sections under sterile conditions. The first section was used
to extract primary tumor stem cell spheres, which were subsequently
used to establish orthotopic xenograft models. The second section
was embedded in paraffin for histopathological analysis and the
third section was used for transcriptome sequencing. The study
involving patients was approved by the Human Research Ethics
Committees of Daping Hospital at the Army Medical University
(Chongqing, China; approval no. 2014-9).
The xenografts were grown, and MRI was performed on
the tumor-bearing mice during the later stages of tumor growth.
Tumor tissues were obtained for histopathological staining and
transcriptome sequencing. All non-obese diabetic-severe-combined
immunodeficiency (NOD-SCID) nude mice used in the present study
were purchased from the Department of Experimental Animals (Daping
Hospital, Army Medical University). All protocols involving the use
of animals were performed according to the International Principles
of Laboratory Animal Care (21) and
were approved by the Animal Use Subcommittee of the Daping Hospital
at the Army Medical University. Tumor-bearing mice were sacrificed
via cervical vertebra dislocation when they exhibited clinical
signs that suggested impending death, such as emaciation, weakness
or obvious spinal curvature. Confirmation of euthanasia was
performed by assessing cardiac arrest and mydriasis. All mice
included in the present study exhibited a single tumor, the maximum
level of cachexia observed was a body weight loss ≤20% compared
with the age-matched controls. The mean diameter of the xenograft
was <1.2 cm and the maximum diameter was 1.27 cm.
Magnetic resonance scanning and
post-processing of patients
MRI scans were performed using a 3.0 Tesla MRI
scanner (Magnetom Verio; Siemens AG) with a 16-channel head coil.
The conventional MRI included axial and sagittal
T1-weighted, and T2-weighted sequences. The
sequence parameters were as follows: T1-weighted imaging
(T1WI), repetition time (TR)/echo time (TE)=250/2.67 ms,
slice thickness=5 mm, field of view (FOV)=230×230 mm;
T2-weighted imaging (T2WI), TR/TE=4,900/96
ms, SL=5 mm, FOV=230×230 mm; DWI-MRI: TR=6,600 ms, TE=100 ms, b=0,
500, 1,000 sec/mm2, slice thickness=5 mm. DCE-MRI was
performed as follows: Two sets of T1-weighted images
were scanned with the T1-vibe sequence [TR/TE=5.08/1.74
ms, FOV=260×260 mm, matrix=138×192, slice thickness=5 mm, flip
angle (FA)=2° and 15°] and subsequently 75 consecutive scans were
performed using the T1-twist sequence (TR/TE=4.82/1.88
ms, matrix=138×192, slice thickness=3.6 mm, FOV=260×260 mm, FA=12°)
at 5.3 sec intervals. At the 6th phase, 0.1 mmol/kg gadolinium
contrast (Ominscan, GE Healthcare) agent was injected via the elbow
vein at a rate of 4 ml/sec.
ADC maps were calculated automatically using a
Siemens syngo MR Workstation (version VE36A; Siemens AG) based on
DWI-MRI scanning. Subsequently, the ADC value of the tumor was
calculated using the hot-spot method (22). A total of five regions of interest
(ROIs) with lower ADC values were selected in the tumor area and
the ADC values of the contralateral healthy brain tissues were
measured. The relative apparent diffusion coefficient (rADC) values
were calculated from the ratio of the tumor area to the healthy
brain tissue area. The rADC value of the tumor was represented by
the average rADC value of the five ROIs.
The DCE-MRI data were imported into a GE workstation
and OmniKinetics software (version 2.0; GE Healthcare) was used for
analysis. An Extend-Tofts model was selected as the hemodynamic
model (23). The arterial input
function (AIF) was calculated by placing an ROI on the middle
cerebral artery and the time and signal intensity curve of the
brain functions were obtained from the AIF. Subsequently, the
software estimated the Ktrans map. Five ROIs with higher
Ktrans values were selected in the tumor area and the
Ktrans value of the tumor was represented by the average
Ktrans value of the five ROIs. The MRI data were
analyzed by two experienced researchers.
Primary glioma stem-cell spheres
culture
Fresh glioma tissue from the ~1 mm3
pieces were digested in papain (Worthington Biochemical
Corporation) at 37°C for ~15 min, filtered through a 200 µm filter
and centrifuged at 300 × g for 3 min at room temperature. The
supernatant was discarded and the cells were resuspended in
DMEM/F-12 supplemented with N-2, B-27 (all from Gibco; Thermo
Fisher Scientific, Inc.), epidermal growth factor (20 ng/ml;
Sigma-Aldrich Merck KGaA) and basic fibroblast growth factor (20
ng/ml; PeproTech, Inc.) and cultured in an incubator with 5%
CO2 at 37°C (24).
Establishment of orthotopic xenograft
glioma models
Xenografts were established in the right basal
ganglia of NOD-SCID nude mice. The glioma stem cell spheres were
digested with trypsin (Gibco; Thermo Fisher Scientific, Inc.) for 3
min and the supernatant was discarded by centrifugation. The pellet
was resuspended in PBS to a density of ~1×10⁴ cells/ml.
Following anesthesia with 5% chloral hydrate (300 mg/kg), a total 5
µl cell suspension was aspirated with a micro-injector and the
needle was vertically inserted at 1.8 mm posterior and 2.2 mm to
the right of the intersection between the midline and the posterior
canthus line of the brain in the NOD-SCID nude mice. The needle was
initially inserted to a depth of ~3.5 mm and withdrawn to 0.5 mm
depth. The cell suspension was slowly injected (at ~1 µl/min) and
the needle was withdrawn following ~10 min of cell transfer. Glioma
stem cell spheres form each human glioma tissue were implanted into
5 NOD-SCID nude mice. In total, 35 mice were used in the present
study.
Magnetic resonance scanning and
post-processing of xenografts
A Bruker 7.0 T MRI scanner for small animals
(BioSpec 70/20 USR; Bruker Corporation) was used and MRI was
performed during the later stages of xenograft growth. After
anesthesia with isoflurane (3% for induction and 1.5% for
maintenance), tumor bearing mice were fixed in a flat position and
scanned in the later phases of tumor growth. The MRI scanning
included coronal T2WI, sagittal T1WI,
T1WI contrast enhanced, DWI-MRI and DCE-MRI. The
sequence parameter settings for T2W1 were as follows:
Turbo-RARE sequence, repetition time/echo time=4,000 ms/45 ms,
FOV=25×25 mm, matrix sizes=256×256, slice thicknesses=0.5 mm.
Similarly for T1WI, the following parameter settings
were used: TR/TE=600 ms/14 ms, FOV=25×25 mm, slice thicknesses=0.5
mm. For DWI, the parameter settings were as follows: TR/TE=3,000
ms/50 ms, FOV=35×35 mm, slice thicknesses=0.5 mm, b=0, 500, 1,000
sec/mm2. Finally, for DCE-MRI the FLASH sequence was
used with a repetition time/echo time of 25.0 ms/1.8 ms. In
addition, the following settings were used: FOV=25×25 mm, matrix
sizes=128×128, slice thicknesses=0.5 mm, slices=5, and
FA=5°/15°/20°/30°. FAs of 5°, 15°, 20° and 30° were used to perform
pre-contrast scans and subsequently 100 consecutive scans were
performed with an FA of 15°. At the 4th phase, 0.1 mmol/kg
gadolinium contrast agent was administered via tail-vein injection
manually within 3 sec.
ADC maps were calculated automatically using Bruker
image display and processing software (Paravision version 6.0.1;
Bruker Corporation) based on DWI-MRI scanning. A total of five ROIs
with lower ADC values were selected in the tumor area and the ADC
values of the contralateral healthy brain tissues were measured.
The rADC values were calculated from the ratio of the tumor area
and the healthy brain tissue. The rADC value of the tumor was
represented by the average rADC value of the five ROIs.
The DCE-MRI data were processed following import
into OmniKinetics. The Ktrans maps were calculated
following a ‘reference region’ model proposed by Cárdenas-Rodríguez
et al (25), a total of five
ROIs with higher Ktrans values were selected in the
tumor area and the Ktrans value of the tumor was
represented by the average Ktrans values of these five
ROIs. The MRI data were analyzed by two experienced
radiologist.
Immunohistochemical staining and blood
vessel quantification
Hematoxylin and eosin (H&E) and
immunohistochemical staining were performed on surgical specimens
and on the corresponding xenograft samples following paraffin
embedding, as described previously (26). The antibodies used were raised in
rabbits against human CD34 (1:30; cat. no. ab81289; Abcam). The
serial sections were prepared at 2 µm thickness and were used for
immunohistochemical staining following dewaxing in xylene. Antigen
retrieval was performed in a boiling EDTA solution (pH 9.0) for 2.5
min. The sections were washed with PBS following cooling.
H2O2 (10%) and goat serum (Beyotime Institute
of Biotechnology) were used to block endogenous peroxidase activity
and nonspecific antigens, respectively. Each slice was incubated
overnight with the corresponding primary antibody at 4°C. The
specimens were washed with PBS and incubated with horseradish
peroxidase-conjugated goat anti-rabbit secondary antibodies at 37°C
for 30 min. 3, 3′-diaminobenzidine was used to visualize the
antigen signal.
A total of five ROIs were selected using the
hot-spot method. The images were visualized by light microscopy
with ×200 magnification. The number, diameters and areas of the
CD34-positive lumens were measured, and the average values were
used as the tumor microvascular density, diameter and area,
respectively. All pathological data for the tissues were measured
by two highly experienced staff members who were blinded to the
experimental groups.
Transcriptome sequencing and screening
of differentially expressed genes
The original tumors (patient tumors 1, 2 and 3) and
the corresponding xenografts (xenografts 1, 2 and 3) were collected
for transcriptome sequencing (Wuhan Seqhealth). The differences in
mRNA expression levels between the original tumors and the
xenografts were compared. Total RNA was extracted from the glioma
tissues using TRIzol® reagent (Invitrogen; Thermo Fisher
Scientific, Inc.). Following removal of the ribosomal RNA and
double-stranded RNA, the mRNA was reverse-transcribed into
double-stranded cDNA. Polymerase chain reaction (PCR) was performed
to amplify and establish the RNA library, which was assessed for
nucleotide purity. Agarose gel electrophoresis was used to exclude
severely degraded nucleic acid samples, and subsequently, the
concentration of nucleic acids was measured using Qubit 2.0 (Thermo
Fisher Scientific, Inc.). Samples with a concentration >200
ng/µl and a total quantity >0.8 mg were considered as suitable
samples. The RNA library was sequenced on an Illumina sequencer
(Illumina, Inc.). Gene expression levels were determined by several
reads per kilobase per million reads and further processed with
sample biological repeat correlation testing. Differentially
expressed genes were screened between xenografts and their
corresponding original tumors (fold change >2; P<0.05). Gene
Ontology (GO) (27,28) analysis was performed to analyze the
functions of the differentially expressed genes.
Statistical analysis
SPSS version 19.0 (IBM, Corp.) was used for
statistical analysis. A paired t-test was used to compare
differences of rADC, microvessel density, microvessel area and
diameter values between original tumors and the corresponding
xenografts. A Wilcoxon signed-rank test was used to compare
differences of Ktrans values between the original tumors
and corresponding xenografts. MRI data and pathological result
reproducibility were assessed using intraclass correlation
coefficient (ICC). P<0.05 was considered to indicate a
statistically significant difference.
Results
Differences in MRI features between
xenografts and original tumors
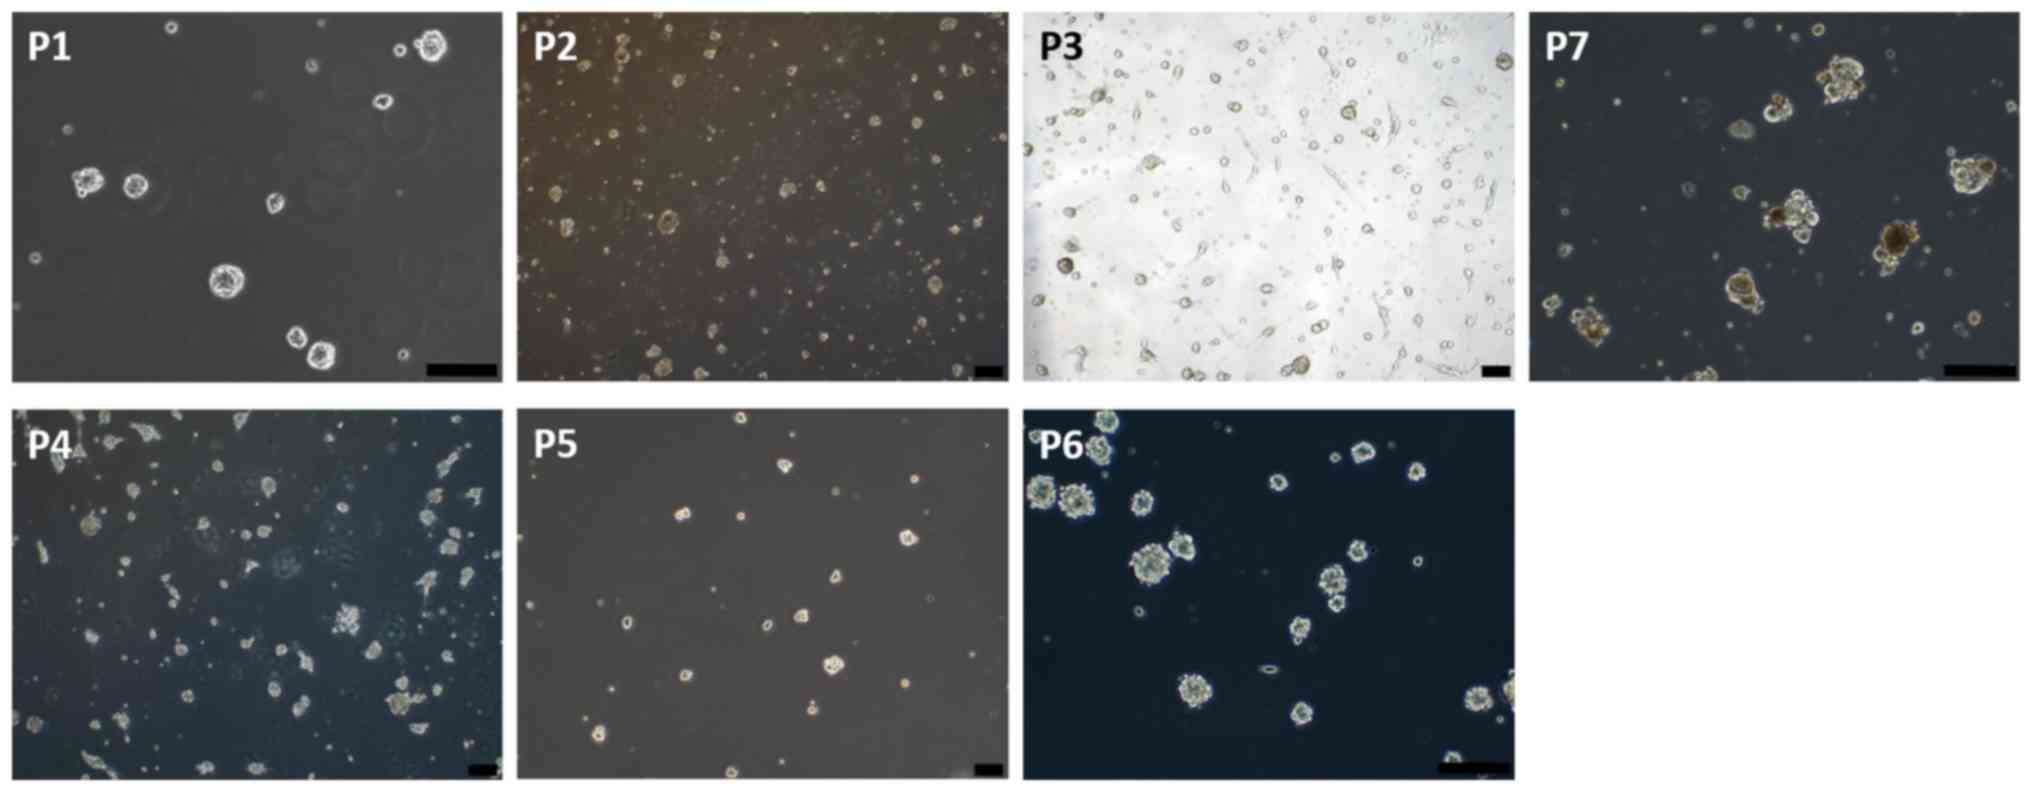
The 7 glioma patients enrolled in the present study
included 6 glioblastoma cases (patients 1, 2, 3, 4, 6 and 7) and 1
anaplastic astrocytoma patient (patient-5) (Table I). Glioma stem cell spheres were
extracted from the surgical specimens of the patients (Fig. 1), and the orthotopic glioma
xenograft model was successfully established in all NOD-SCID nude
mice. The growth pattern of the xenografts were divided into two
categories. The first category included 6 cases of tumor with
diffuse growth (xenografts 1, 2, 3, 4, 5 and 6), with 5 mice per
group. The second category was for the one tumor case with nodular
growth (xenograft 7; n=5 mice).
 | Table I.Patient characteristics. |
Table I.
Patient characteristics.
| Case no. | Age, year | Sex | Diagnosis | WHO grade |
|---|
| 1 | 58 | Male | GBM | IV |
| 2 | 48 | Male | GBM | IV |
| 3 | 50 | Female | GBM | IV |
| 4 | 67 | Male | GBM | IV |
| 5 | 48 | Female | AOD | III |
| 6 | 57 | Male | GBM | IV |
| 7 | 46 | Female | GBM | IV |
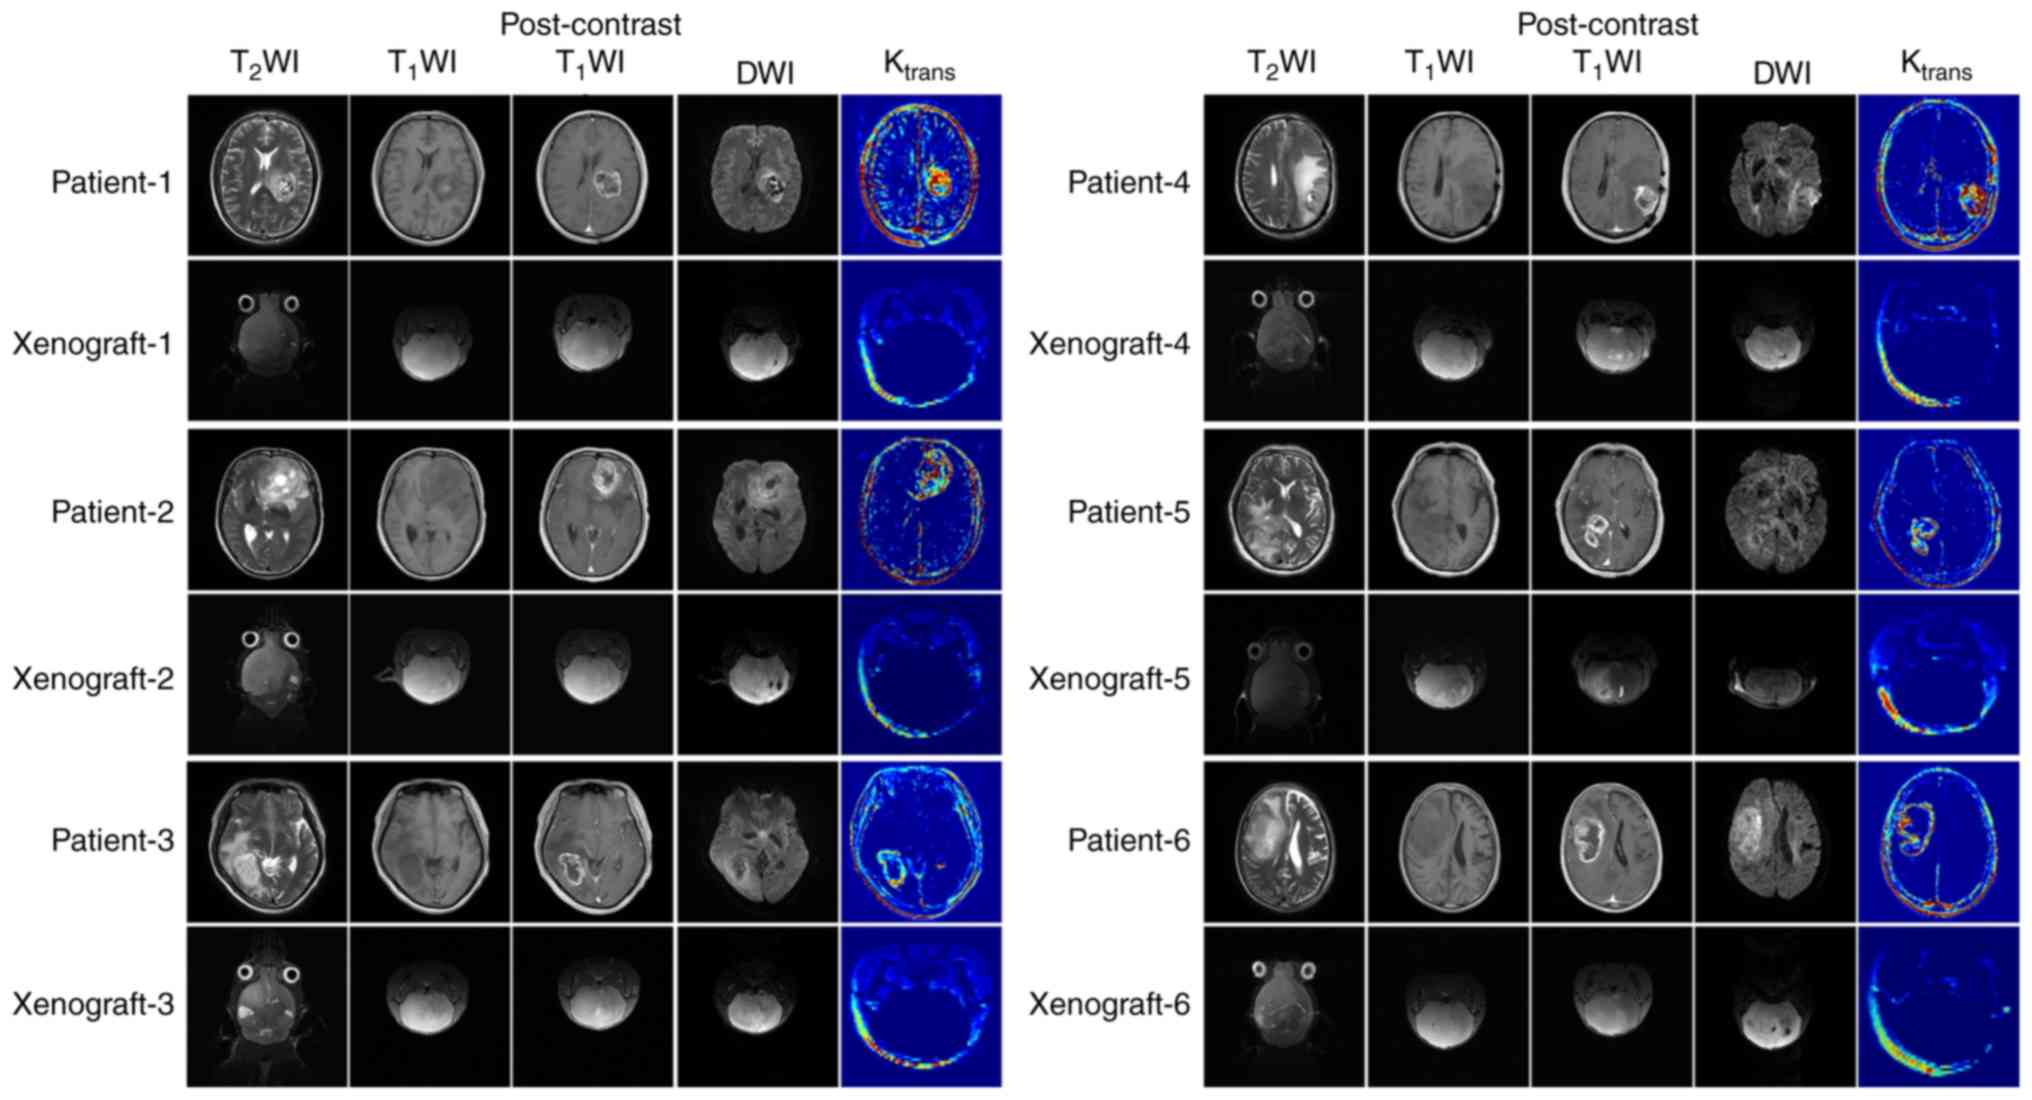
The differences in the MRI features between
xenografts and original tumors are described in Table II. The original tumor samples did
not have clear tumor boundaries or evidence of edema around the
tumor mass. However, certain tumor specimens (patients 3 and 7)
possessed a boundary between the tumor and the normal brain tissue
in certain regions. The intra-tumoral signals were heterogeneous
and multiple necrosis and cystic degeneration were evident. DWI
indicated significant high signal intensity in the tumor area
region (b=1,000 sec/mm2). Following gadolinium contrast
enhancement, marked annular contrast enhancement was observed. The
tumor area indicated apparent annular high signal intensity as
determined by the Ktrans map (Fig. 2).
| Table II.Differences in the MRI features
between xenografts and original tumors. |
Table II.
Differences in the MRI features
between xenografts and original tumors.
| Case | Intra-tumoral
signals | Peritumoral
edema | Post-contrast
enhancement | Tumor boundary | Signal intensity of
Ktrans map |
|---|
| P1 | Heterogeneous | Yes | Marked | Unclear | High |
| X1 | Homogeneous | No | Mild | Unclear | Low |
| P2 | Heterogeneous | Yes | Marked | Unclear | High |
| X2 | Homogeneous | No | Mild | Unclear | Low |
| P3 | Heterogeneous | Yes | Marked | Unclear | High |
| X3 | Homogeneous | No | Mild | Unclear | Low |
| P4 | Heterogeneous | Yes | Marked | Unclear | High |
| X4 | Homogeneous | No | Mild | Unclear | Low |
| P5 | Heterogeneous | Yes | Marked | Unclear | High |
| X5 | Homogeneous | No | Mild | Unclear | Low |
| P6 | Heterogeneous | Yes | Marked | Unclear | High |
| X6 | Homogeneous | No | Mild | Unclear | Low |
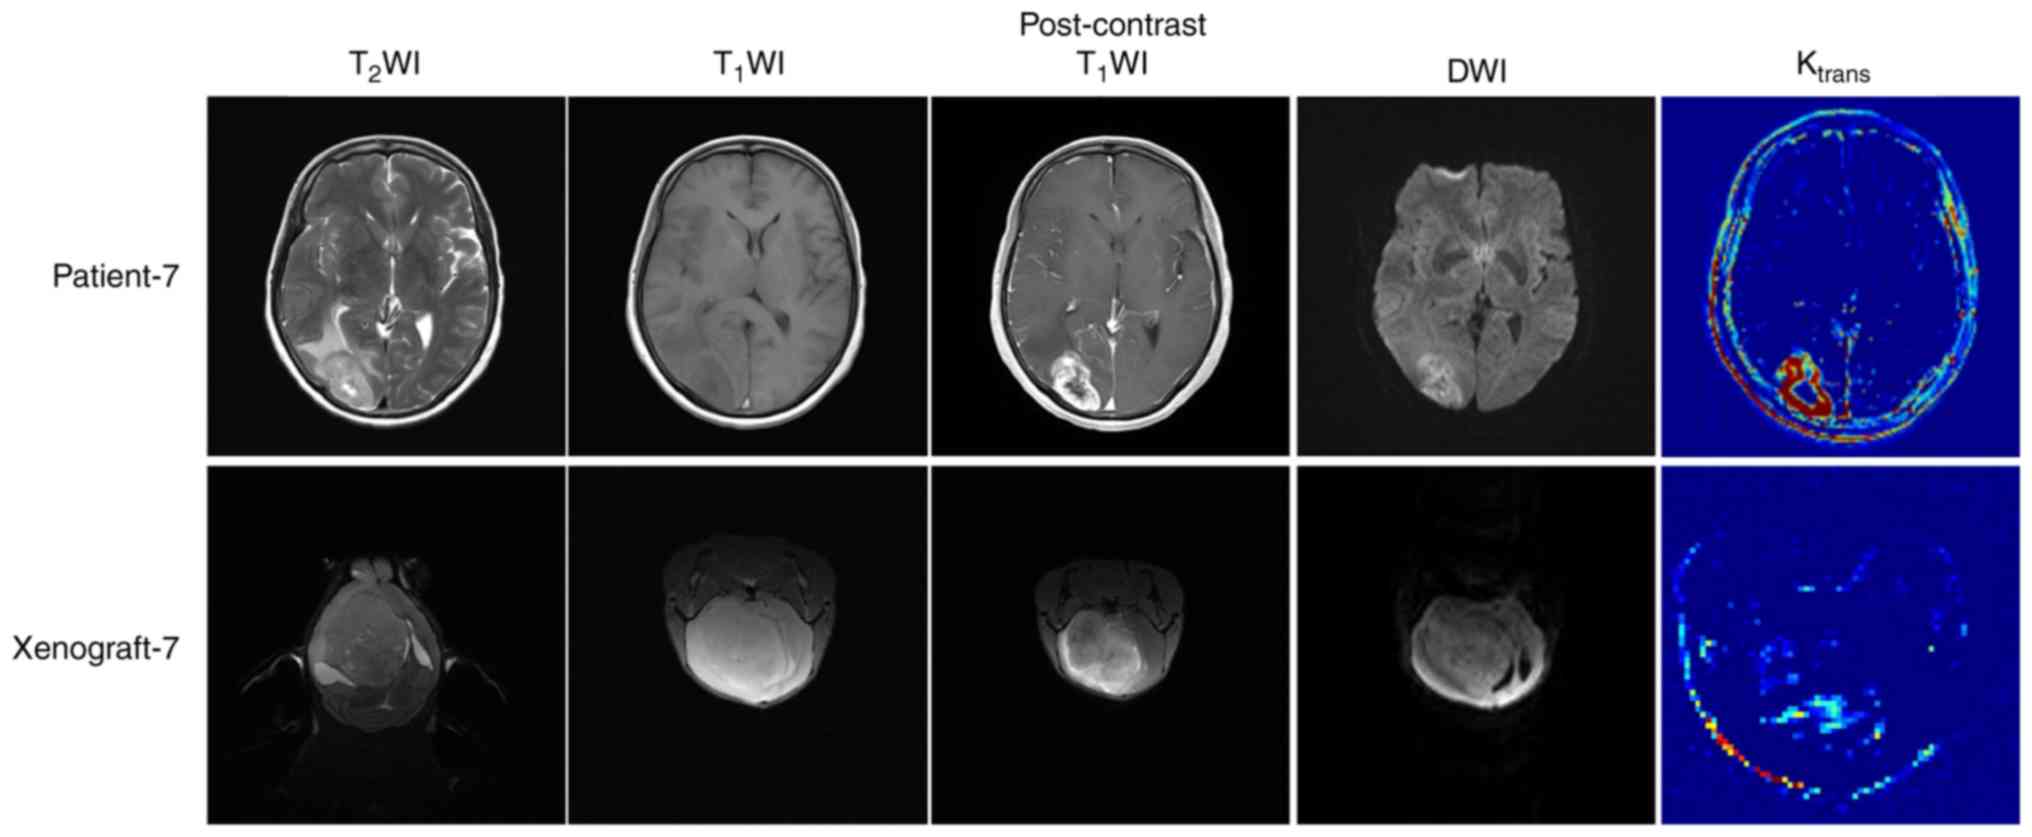
| P7 | Heterogeneous | Yes | Marked | Unclear | High |
| X7 | Heterogeneous | Yes | Moderate | Clear | Moderate |
The most significant difference noted in the MRI
features between the 6 cases of diffusely grown xenografts and the
original tumors was the mild enhancement occurring in the local
area of the xenografts. The ktrans value of the
xenografts was significantly lower compared with the original
tumors. In addition, the internal signal of the tumor was
homogeneous in the absence of edema (Fig. 2). This finding was different when
compared with the corresponding signal noted in the original tumors
(Fig. 2). A clear demarcation
between the xenografts and the normal brain tissue was noted in
only one case of tumor nodular growth between the two groups
(xenografts and human tumor). This was the major difference in the
imaging characteristics between these two groups. In addition, the
enhancement degree of the xenografts and the Ktrans
value of the tumor area were significantly lower compared with the
original tumors (Fig. 3). The
Ktrans values of all the xenografts were lower compared
with the corresponding values of the original tumors, and the rADC
values of all the xenograft samples were higher compared with the
corresponding values of the original tumors (P=0.016 and P=0.001,
respectively; Figs. 2 and 3; Table
III). The measurement results were determined using the ICC
test, a measure of consistency of results, and the ICC value was
0.962, suggesting the consistency was good.
| Table III.Ktrans and rADC values of
the original tumors and the corresponding xenografts. |
Table III.
Ktrans and rADC values of
the original tumors and the corresponding xenografts.
| MRI derived
parameters | Original
tumors | Xenografts | P-value |
|---|
|
ktrans | 1.058±0.257
min−1 | 0.070±0.185
min−1 | 0.016a |
| rADC | 0.718±0.076 | 0.940±0.044 | 0.001b |
Among the 6 cases of orthotopic glioma xenograft
models with diffuse growth, xenograft-5 was derived from a case of
WHO grade III anaplastic astrocytoma, and the rest were derived
from glioblastoma. Xenograft 5 showed diffuse growth with a
homogeneous internal signal, mild enhancement present in the local
area and almost no high signal on the Ktrans map, which
were the same as the other xenografts with diffuse growth (Fig. 2). The rADC values of xenograft-5
(0.948±0.033) were not significantly different from those of other
xenografts (0.937±0.055) with diffuse growth (P=0.301).
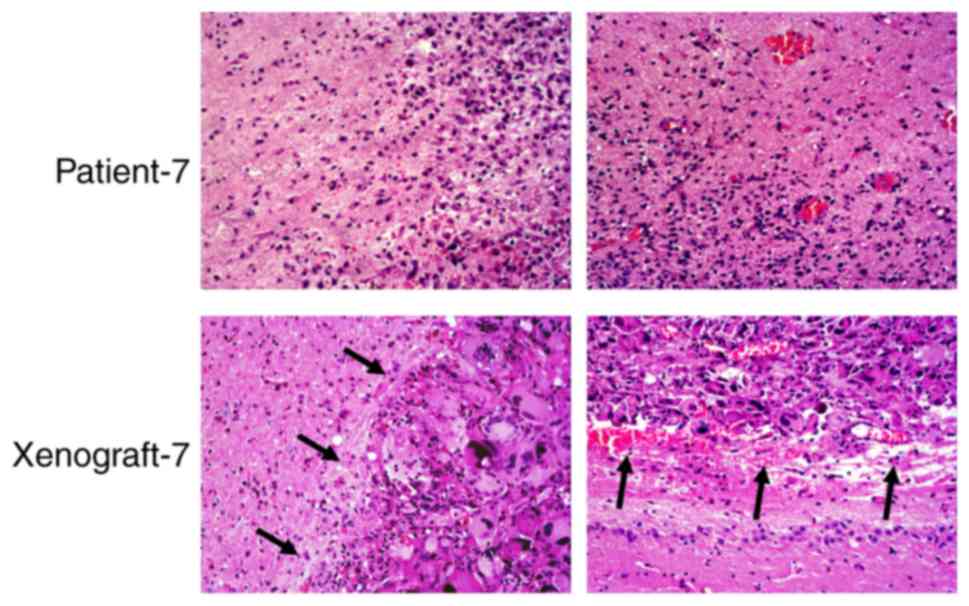
Differences in histopathological
features between xenografts and original tumors
H&E staining of the xenografts and human tumor
tissues indicated that the boundary of the xenograft tissues was
clear, whereas that of the patient tumor was unclear. An example is
shown for patient-7 and the corresponding xenograft, where the
patient exhibited nodular growth (Fig.
4). However, the tumor boundary was not clear in xenografts
with diffuse growth and the corresponding original tumors (Fig. S1). CD34 staining showed that the
microvessel area and diameter of the 6 ×enograft cases that
exhibited diffuse growth were significantly lower compared with the
patient tumors (P=0.009 and P=0.007, respectively). There were no
significant differences in the microvessel density between the
xenografts and the patient tumors (Fig.
5). These findings were verified using an ICC test, with an ICC
value of 0.955.
Differences in gene expression between
xenografts and the corresponding original tumors
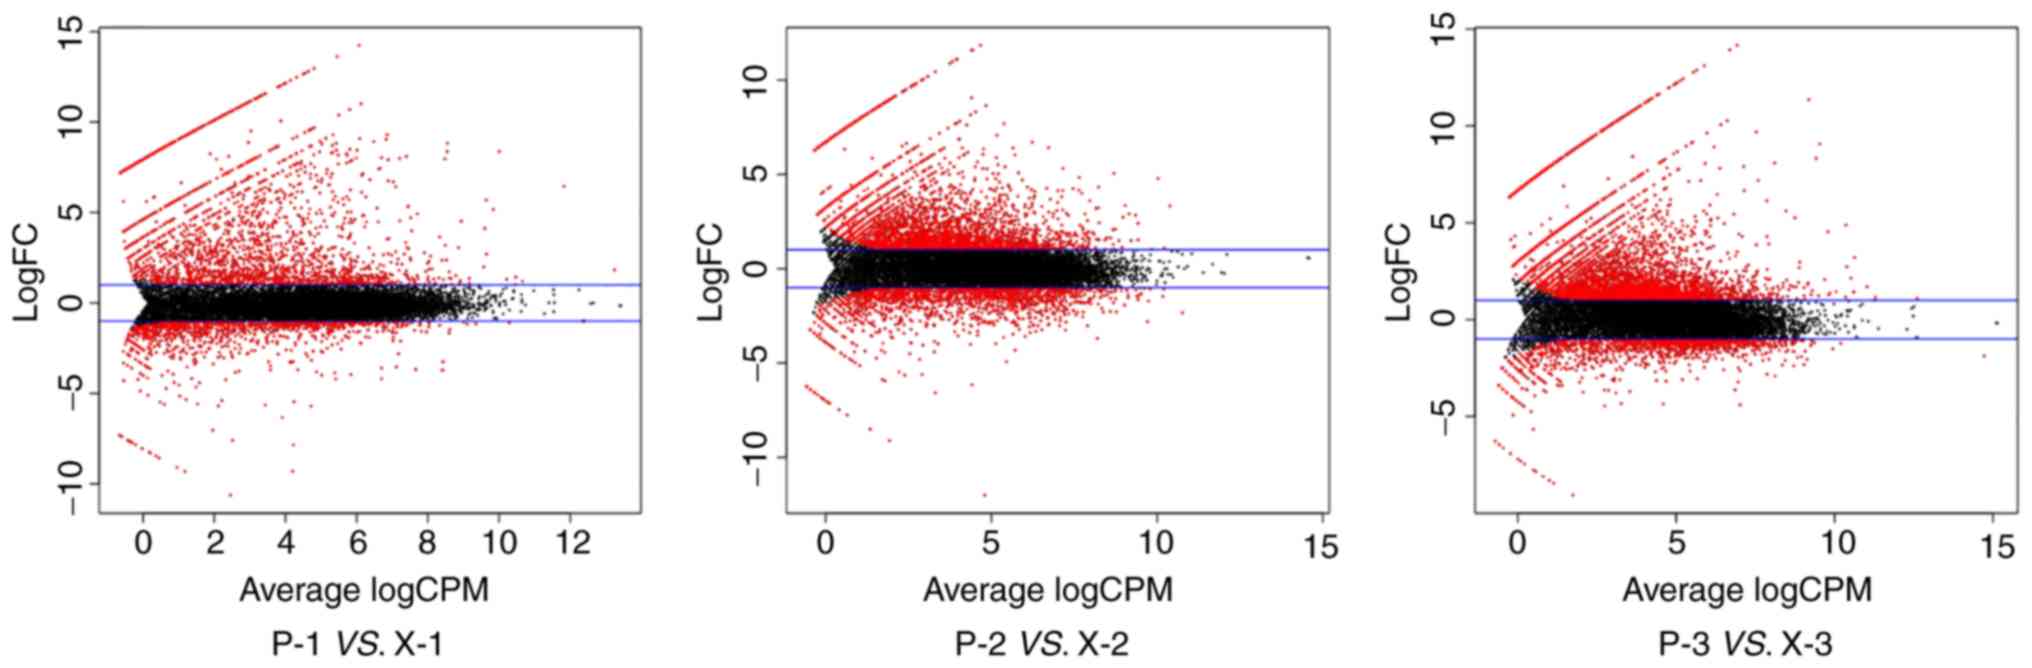
The differences in gene expression of the samples
from patients 1, 2 and 3, and the corresponding xenografts are
presented in Fig. 6. The black dots
between the blue lines represent genes with expression differences
<2-fold and the red dots represent genes with differences in
expression >2-fold. The red dots above the blue lines represent
genes with higher expression in the original tumors compared with
the xenografts, whereas the red dots below the blue lines represent
genes with lower expression in the original tumors compared with
the xenografts. Significant differences were noted in the gene
expression levels between primary tumors and xenografts.
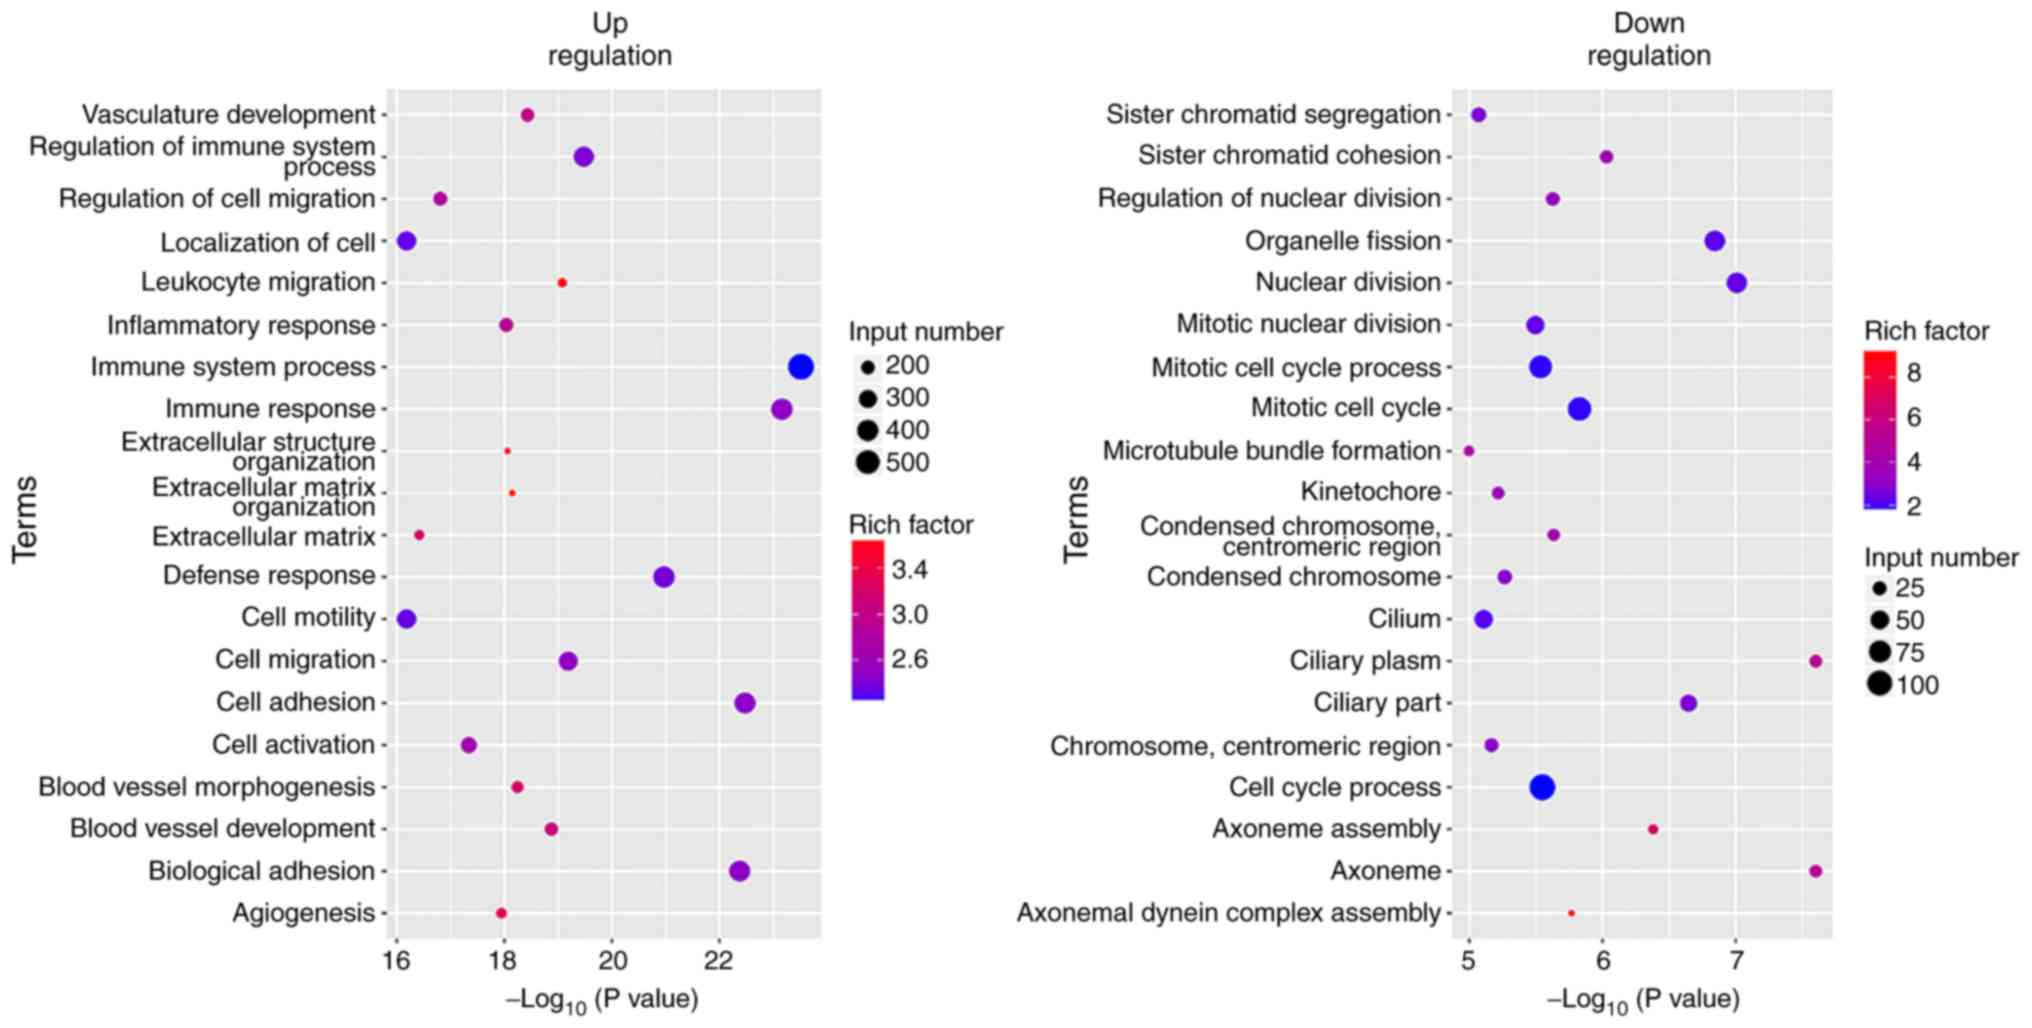
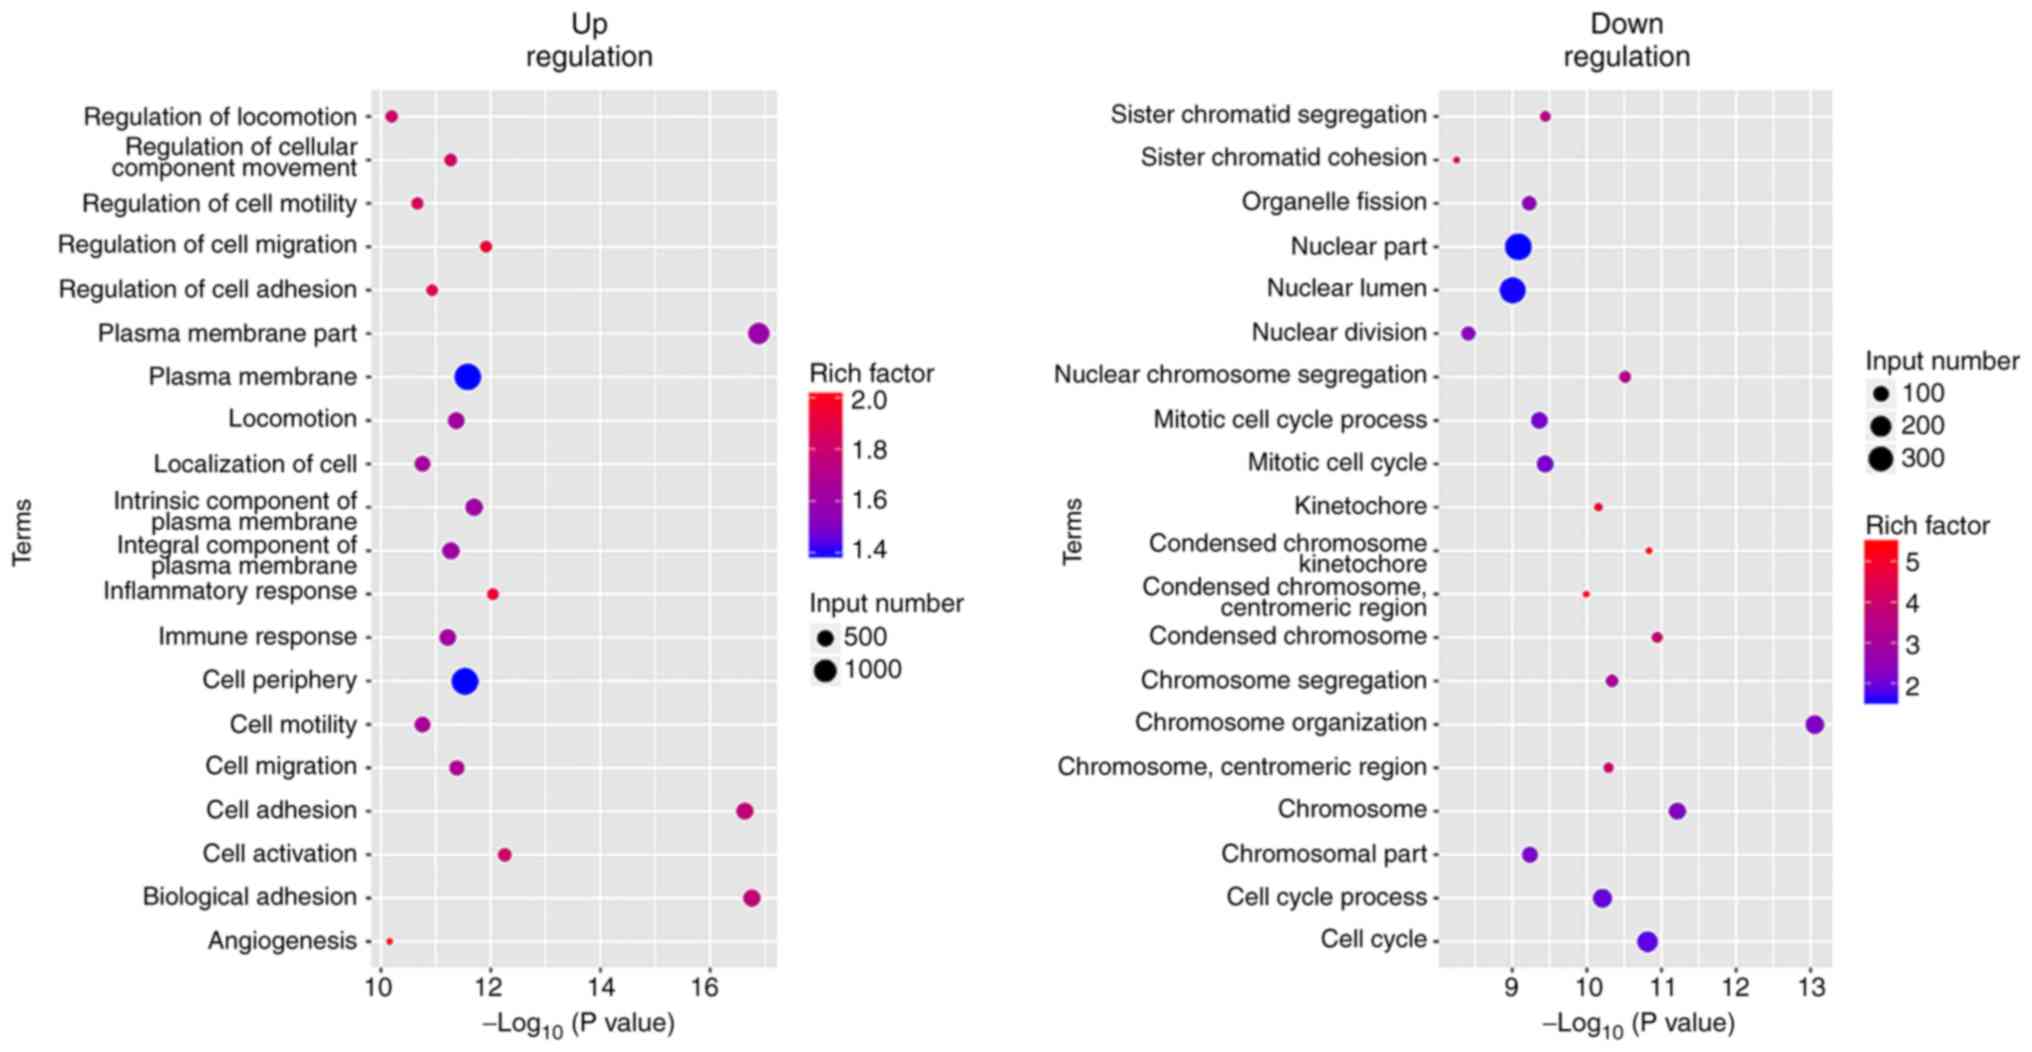
GO analysis of the differentially expressed genes
revealed that tumor cell characteristics and extracellular
matrix-associated genes (cell activation, cell adhesion, cell
migration, cell motility and extracellular matrix associated
genes), angiogenesis-associated genes (angiogenesis and vasculature
development) and immune-associated genes (immune response, immune
system process and immune effector process) were highly expressed
in the original tumors. The expression levels of the genes that
were involved in cell cycle and nuclear division were increased in
the xenografts (Figs. 7–9).
Discussion
PDX glioma models are important platforms for
assessing the pre-clinical characteristics of tumors.
Patient-derived glioblastoma xenograft models are a reliable
translational platform that can recapitulate histopathological
properties and maintain the genomic characteristics of parental
tumors in situ (29). PDX
adamantinomatous craniopharyngioma models recapitulate the
radiological features of the original tumors (30).
In the present study, the MRI features of high-grade
gliomas and of the corresponding xenografts were considerably
different. The primary differences observed in the MRI features
between the 6 cases of diffusely grown xenografts and the
corresponding original tumors were a mild enhancement in the local
area of the xenografts and homogeneous internal signal, and the
Ktrans values of the xenografts were significantly lower
compared with the original tumors. CD34 staining further
demonstrated that the microvessel area and diameter of the 6 cases
of diffusely grown xenografts were significantly lower compared
with the original patient tumors, consistent with the
characteristics of MRI. The MRI characteristics of the nodular
xenograft growth samples were compared with those of the
corresponding original tumors. A clear demarcation between the
xenograft and the normal brain tissues was noted. H&E staining
of the nodular xenograft portion and of the original patient tumor
indicated that the boundary of the xenograft was clear, whereas in
the original patient tumor, the boundaries were unclear. Although
there was only one case with nodular growth, it was reported that
gliomas had nodular growth in mice models and had relatively clear
boundaries with normal brain tissue (31–33).
These results show there were notable differences in the MRI
characteristics between patient-derived orthotopic xenograft models
and the corresponding original tumors.
The MRI features are closely associated with gene
expression. Transcriptome sequencing of the original tumors and
their corresponding xenografts revealed significant differences in
gene expression. GO analysis of the differentially expressed genes
indicated that the expression levels of the immune-associated
genes, angiogenesis-associated genes, tumor cell characteristics
and extracellular matrix-associated genes were significantly
increased in the original tumors. Since certain mesenchymal
components in the growth process of xenografts were derived from
NOD-SCID nude mice (34,35), the expression levels of
immune-associated genes were decreased in the xenografts. The
contrast enhancement and increased Ktrans value
indicated that the original tumors exhibited significant angiogenic
activity and high vascular permeability (36), which may be attributed to the
increased expression levels of the angiogenesis-associated genes in
the original tumors (37–39). The rADC values of the original
tumors were significantly lower compared with the xenografts, which
may be attributed with the higher expression levels of the cell
adhesion and extracellular matrix-associated genes noted in the
original tumors, which in turn resulted in a higher cell density
(40,41). Therefore, the differences noted in
gene expression levels may underlie the differences noted in the
MRI features between the original tumors and the corresponding
xenografts.
Although PDX models can maintain the
histopathological features and genotypes of the original tumors,
the gene expression levels exhibit temporal and spatial
heterogeneity and are affected by the tumor microenvironment
(42–44). The expression levels of the genes
varied according to the different stages of tumor growth and
therefore the xenografts assessed may represent only a specific
growth stage of the original patient tumor. This may also explain
the potent antitumor efficacy of specific treatment strategies on
xenografts which are not observed in subsequent human clinical
trials (45,46). Therefore, it is particularly
important to examine the original patient tumor growth stage when
using xenograft models, or to use appropriate tumor models to
examine the biological characteristics, therapeutic response and
corresponding MRI biomarkers of these tumors.
The present study has certain limitations. The
number of experimental samples was considerably low; thus glioma
surgical specimens will continue to be collected to establish and
assess more orthotopic xenografts, expanding the sample size, and
thus providing additional experimental basis for comparing the
similarities and differences between xenografts and the
corresponding original tumors. Gene expression between xenografts
with nodular growth and the corresponding original tumor should be
compared. However, the surgical sample obtained from patient-7 was
insufficient. After the extraction of primary tumor cells and
histological analysis, the RNA extracted from the remaining tumor
tissues failed to pass the quality test for establishment of an RNA
library; therefore differences in the gene expression of patient-7
and xenograft-7 were not compared. However, there were significant
differences in the MRI features between patient-7 and
xenograft-7.
Since the tumor microenvironment of nude mice and
patients varies, studying the expression differences of GSCs
between xenografts and the corresponding original tumors has an
important role in preclinical research of gliomas (47,48),
for example, this may be the reason why some drugs have notable
antitumor effects on animal models (49,50),
but did not exhibit a desirable response in clinical trials
(46,51), which will be one of the future
directions of our lab. The lack of comparison between GSC providers
is also one of the limitations of the present study. Analyzing the
relationship between MRI characteristics and gene characteristics
is of great significance for the accurate diagnosis and
personalized treatment of gliomas. Thus, this will be taken into
consideration in our future studies.
In summary, the present study demonstrated that
patient-derived orthotopic xenograft glioma models in mice could
not be used to replicate the MRI features of the original tumors by
comparing conventional MRI, DWI-MRI and DCE-MRI characteristics of
these two distinct groups. The differential expression of certain
genes may underlie the differences observed in the MRI features
between original tumors and the corresponding xenografts. Together,
the results of the present study showed that MRI biomarkers
obtained from PDXs should be interpreted with caution.
Supplementary Material
Supporting Data
Acknowledgements
Not applicable.
Funding
The present study was supported by the National
Natural Science Foundation of China (grant nos. 81871421 and
81571660) and the Clinical Scientific Foundation of Institute of
Surgery Research, Daping Hospital, at the Third Military Medical
University (grant no. 2014YLC03).
Availability of data and materials
All data generated and/or analyzed during this study
are available from the corresponding author on reasonable
request.
Authors' contributions
WZ and XC conceived and designed the experiments. WX
and JZ performed the experiments and wrote the first draft of the
manuscript. BZ performed clinical case collection. YG performed MRI
scanning. JF and SW performed MRI data post-processing and
analysis. HT and TX performed the transcriptome sequencing.
Ethics approval and consent to
participate
The present study was approved by the Ethics
Committees of the Daping Hospital, at the Army Medical University
(Chongqing, China). Written informed consent for participation was
obtained from patients and/or their legal guardians.
Patient consent for publication
Written consent for publication was obtained from
patients and/or their legal guardians.
Competing interests
The authors declare that they have no competing
interests.
References
|
1
|
Koga Y and Ochiai A: Systematic review of
patient-derived xenograft models for preclinical studies of
anti-cancer drugs in solid tumors. Cells. 8(pii): E4182019.
View Article : Google Scholar : PubMed/NCBI
|
|
2
|
De Witt Hamer PC, Van Tilborg AA, Eijk PP,
Sminia P, Troost D, Van Noorden CJ, Ylstra B and Leenstra S: The
genomic profile of human malignant glioma is altered early in
primary cell culture and preserved in spheroids. Oncogene.
27:2091–2096. 2008. View Article : Google Scholar : PubMed/NCBI
|
|
3
|
Lee J, Kotliarova S, Kotliarov Y, Li A, Su
Q, Donin NM, Pastorino S, Purow BW, Christopher N, Zhang W, et al:
Tumor stem cells derived from glioblastomas cultured in bFGF and
EGF more closely mirror the phenotype and genotype of primary
tumors than do serum-cultured cell lines. Cancer Cell. 9:391–403.
2006. View Article : Google Scholar : PubMed/NCBI
|
|
4
|
Laks DR, Crisman TJ, Shih MY, Mottahedeh
J, Gao F, Sperry J, Garrett MC, Yong WH, Cloughesy TF, Liau LM, et
al: Large-scale assessment of the gliomasphere model system. Neuro
Oncol. 18:1367–1378. 2016. View Article : Google Scholar : PubMed/NCBI
|
|
5
|
Wakimoto H, Mohapatra G, Kanai R, Curry WT
Jr, Yip S, Nitta M, Patel AP, Barnard ZR, Stemmer-Rachamimov AO,
Louis DN, et al: Maintenance of primary tumor phenotype and
genotype in glioblastoma stem cells. Neuro Oncol. 14:132–144. 2012.
View Article : Google Scholar : PubMed/NCBI
|
|
6
|
Gargiulo G: Next-generation in vivo
modeling of human cancers. Front Oncol. 8:4292018. View Article : Google Scholar : PubMed/NCBI
|
|
7
|
Patel P, Baradaran H, Delgado D, Askin G,
Christos P, John Tsiouris A and Gupta A: MR perfusion-weighted
imaging in the evaluation of high-grade gliomas after treatment: A
systematic review and meta-analysis. Neuro Oncol. 19:118–127. 2017.
View Article : Google Scholar : PubMed/NCBI
|
|
8
|
Suh CH, Kim HS, Jung SC, Choi CG and Kim
SJ: Perfusion MRI as a diagnostic biomarker for differentiating
glioma from brain metastasis: A systematic review and
meta-analysis. Eur Radiol. 28:3819–3831. 2018. View Article : Google Scholar : PubMed/NCBI
|
|
9
|
Aquino D, Gioppo A, Finocchiaro G,
Bruzzone MG and Cuccarini V: MRI in Glioma immunotherapy: Evidence,
pitfalls, and perspectives. J Immunol Res. 2017:58139512017.
View Article : Google Scholar : PubMed/NCBI
|
|
10
|
Pope WB and Brandal G: Conventional and
advanced magnetic resonance imaging in patients with high-grade
glioma. Q J Nucl Med Mol Imaging. 62:239–253. 2018. View Article : Google Scholar : PubMed/NCBI
|
|
11
|
Minosse S, Marzi S, Piludu F and Vidiri A:
Correlation study between DKI and conventional DWI in brain and
head and neck tumors. Magn Reson Imaging. 42:114–122. 2017.
View Article : Google Scholar : PubMed/NCBI
|
|
12
|
Sinkus R, Van Beers BE, Vilgrain V,
DeSouza N and Waterton JC: Apparent diffusion coefficient from
magnetic resonance imaging as a biomarker in oncology drug
development. Eur J Cancer. 48:425–431. 2012. View Article : Google Scholar : PubMed/NCBI
|
|
13
|
Zhang J, Liu H, Tong H, Wang S, Yang Y,
Liu G and Zhang W: Clinical applications of contrast-enhanced
perfusion MRI techniques in gliomas: Recent advances and current
challenges. Contrast Media Mol Imaging. 2017:70641202017.
View Article : Google Scholar : PubMed/NCBI
|
|
14
|
Bernstein JM, Homer JJ and West CM:
Dynamic contrast-enhanced magnetic resonance imaging biomarkers in
head and neck cancer: Potential to guide treatment? A systematic
review. Oral Oncol. 50:963–970. 2014. View Article : Google Scholar : PubMed/NCBI
|
|
15
|
Guo H, Kang H, Tong H, Du X, Liu H, Tan Y,
Yang Y, Wang S and Zhang W: Microvascular characteristics of
lower-grade diffuse gliomas: Investigating vessel size imaging for
differentiating grades and subtypes. Eur Radiol. 29:1893–1902.
2019. View Article : Google Scholar : PubMed/NCBI
|
|
16
|
Linnik IV, Scott ML, Holliday KF,
Woodhouse N, Waterton JC, O'Connor JP, Barjat H, Liess C, Ulloa J,
Young H, et al: Noninvasive tumor hypoxia measurement using
magnetic resonance imaging in murine U87 glioma xenografts and in
patients with glioblastoma. Magn Reson Med. 71:1854–1862. 2014.
View Article : Google Scholar : PubMed/NCBI
|
|
17
|
Ahn SS, Shin NY, Chang JH, Kim SH, Kim EH,
Kim DW and Lee SK: Prediction of methylguanine methyltransferase
promoter methylation in glioblastoma using dynamic
contrast-enhanced magnetic resonance and diffusion tensor imaging.
J Neurosurg. 121:367–373. 2014. View Article : Google Scholar : PubMed/NCBI
|
|
18
|
Smits M and van den Bent MJ: Imaging
correlates of adult glioma genotypes. Radiology. 284:316–331. 2017.
View Article : Google Scholar : PubMed/NCBI
|
|
19
|
van Dijken BRJ, van Laar PJ, Holtman GA
and van der Hoorn A: Diagnostic accuracy of magnetic resonance
imaging techniques for treatment response evaluation in patients
with high-grade glioma, a systematic review and meta-analysis. Eur
Radiol. 27:4129–4144. 2017. View Article : Google Scholar : PubMed/NCBI
|
|
20
|
Louis DN, Perry A, Reifenberger G, von
Deimling A, Figarella-Branger D, Cavenee WK, Ohgaki H, Wiestler OD,
Kleihues P and Ellison DW: The 2016 World Health Organization
classification of tumors of the central nervous system: A summary.
Acta Neuropathol. 131:803–820. 2016. View Article : Google Scholar : PubMed/NCBI
|
|
21
|
Workman P, Aboagye EO, Balkwill F, Balmain
A, Bruder G, Chaplin DJ, Double JA, Everitt J, Farningham DA,
Glennie MJ, et al: Guidelines for the welfare and use of animals in
cancer research. Br J Cancer. 102:1555–1577. 2010. View Article : Google Scholar : PubMed/NCBI
|
|
22
|
Jackson A, O'Connor JP, Parker GJ and
Jayson GC: Imaging tumor vascular heterogeneity and angiogenesis
using dynamic contrast-enhanced magnetic resonance imaging. Clin
Cancer Res. 13:3449–3459. 2007. View Article : Google Scholar : PubMed/NCBI
|
|
23
|
Sourbron SP and Buckley DL: Classic models
for dynamic contrast-enhanced MRI. NMR Biomed. 26:1004–1027. 2013.
View Article : Google Scholar : PubMed/NCBI
|
|
24
|
Pollard SM, Yoshikawa K, Clarke ID, Danovi
D, Stricker S, Russell R, Bayani J, Head R, Lee M, Bernstein M, et
al: Glioma stem cell lines expanded in adherent culture have
tumor-specific phenotypes and are suitable for chemical and genetic
screens. Cell Stem Cell. 4:568–580. 2009. View Article : Google Scholar : PubMed/NCBI
|
|
25
|
Cárdenas-Rodríguez J, Howison CM and Pagel
MD: A linear algorithm of the reference region model for DCE-MRI is
robust and relaxes requirements for temporal resolution. Magn Reson
Imaging. 31:497–507. 2013. View Article : Google Scholar : PubMed/NCBI
|
|
26
|
Xue W, Du X, Wu H, Liu H, Xie T, Tong H,
Chen X, Guo Y and Zhang W: Aberrant glioblastoma neovascularization
patterns and their correlation with DCE-MRI-derived parameters
following temozolomide and bevacizumab treatment. Sci Rep.
7:138942017. View Article : Google Scholar : PubMed/NCBI
|
|
27
|
Ashburner M, Ball CA, Blake JA, Botstein
D, Butler H, Cherry JM, Davis AP, Dolinski K, Dwight SS, Eppig JT,
et al: Gene ontology: Tool for the unification of biology. The Gene
Ontology Consortium. Nat Genet. 25:25–29. 2000. View Article : Google Scholar : PubMed/NCBI
|
|
28
|
The Gene Ontology Consortium, . The Gene
Ontology Resource: 20 years and still GOing strong. Nucleic Acids
Res. 47:D330–D338. 2019. View Article : Google Scholar : PubMed/NCBI
|
|
29
|
Joo KM, Kim J, Jin J, Kim M, Seol HJ,
Muradov J, Yang H, Choi YL, Park WY, Kong DS, et al:
Patient-specific orthotopic glioblastoma xenograft models
recapitulate the histopathology and biology of human glioblastomas
in situ. Cell Rep. 3:260–273. 2013. View Article : Google Scholar : PubMed/NCBI
|
|
30
|
Boult JKR, Apps JR, Hölsken A, Hutchinson
JC, Carreno G, Danielson LS, Smith LM, Bäuerle T, Buslei R,
Buchfelder M, et al: Preclinical transgenic and patient-derived
xenograft models recapitulate the radiological features of human
adamantinomatous craniopharyngioma. Brain Pathol. 28:475–483. 2018.
View Article : Google Scholar : PubMed/NCBI
|
|
31
|
Wong K, Young GS, Makale M, Hu X, Yildirim
N, Cui K, Wong ST and Kesari S: Characterization of a human
tumorsphere glioma orthotopic model using magnetic resonance
imaging. J Neurooncol. 104:473–481. 2011. View Article : Google Scholar : PubMed/NCBI
|
|
32
|
Lenting K, Verhaak R, Ter Laan M,
Wesseling P and Leenders W: Glioma: Experimental models and
reality. Acta Neuropathol. 133:263–282. 2017. View Article : Google Scholar : PubMed/NCBI
|
|
33
|
Garcia-Romero N, Gonzalez-Tejedo C,
Carrión-Navarro J, Esteban-Rubio S, Rackov G, Rodríguez-Fanjul V,
Oliver-De La Cruz J, Prat-Acín R, Peris-Celda M, Blesa D, et al:
Cancer stem cells from human glioblastoma resemble but do not mimic
original tumors after in vitro passaging in serum-free media.
Oncotarget. 7:65888–65901. 2016. View Article : Google Scholar : PubMed/NCBI
|
|
34
|
Xu WW, Li B, Guan XY, Chung SK, Wang Y,
Yip YL, Law SY, Chan KT, Lee NP, Chan KW, et al: Cancer
cell-secreted IGF2 instigates fibroblasts and bone marrow-derived
vascular progenitor cells to promote cancer progression. Nat
Commun. 8:143992017. View Article : Google Scholar : PubMed/NCBI
|
|
35
|
Terai S, Fushida S, Tsukada T, Kinoshita
J, Oyama K, Okamoto K, Makino I, Tajima H, Ninomiya I, Fujimura T,
et al: Bone marrow derived ‘fibrocytes’ contribute to tumor
proliferation and fibrosis in gastric cancer. Gastric Cancer.
18:306–313. 2015. View Article : Google Scholar : PubMed/NCBI
|
|
36
|
Hutterer M, Hattingen E, Palm C,
Proescholdt MA and Hau P: Current standards and new concepts in MRI
and PET response assessment of antiangiogenic therapies in
high-grade glioma patients. Neuro Oncol. 17:784–800. 2015.
View Article : Google Scholar : PubMed/NCBI
|
|
37
|
Reyes-Botero G, Dehais C, Idbaih A,
Martin-Duverneuil N, Lahutte M, Carpentier C, Letouzé E, Chinot O,
Loiseau H, Honnorat J, et al: Contrast enhancement in
1p/19q-codeleted anaplastic oligodendrogliomas is associated with
9p loss, genomic instability, and angiogenic gene expression. Neuro
Oncol. 16:662–670. 2014. View Article : Google Scholar : PubMed/NCBI
|
|
38
|
Liu X, Li Y, Sun Z, Li S, Wang K, Fan X,
Liu Y, Wang L, Wang Y and Jiang T: Molecular profiles of tumor
contrast enhancement: A radiogenomic analysis in anaplastic
gliomas. Cancer Med. 7:4273–4283. 2018. View Article : Google Scholar : PubMed/NCBI
|
|
39
|
Kickingereder P, Wiestler B, Graf M,
Heiland S, Schlemmer HP, Wick W, Wick A, Bendszus M and Radbruch A:
Evaluation of dynamic contrast-enhanced MRI derived microvascular
permeability in recurrent glioblastoma treated with bevacizumab. J
Neurooncol. 121:373–380. 2015. View Article : Google Scholar : PubMed/NCBI
|
|
40
|
Robba T, Chianca V, Albano D, Clementi V,
Piana R, Linari A, Comandone A, Regis G, Stratta M, Faletti C and
Borrè A: Diffusion-weighted imaging for the cellularity assessment
and matrix characterization of soft tissue tumour. Radiol Med.
122:871–879. 2017. View Article : Google Scholar : PubMed/NCBI
|
|
41
|
Schob S, Surov A, Wienke A, Meyer HJ,
Spielmann RP and Fiedler E: Correlation Between aquaporin 4
expression and different DWI parameters in grade I meningioma. Mol
Imaging Biol. 19:138–142. 2017. View Article : Google Scholar : PubMed/NCBI
|
|
42
|
Tse V, Xu L, Yung YC, Santarelli JG, Juan
D, Fabel K, Silverberg G and Harsh G IV: The temporal-spatial
expression of VEGF, angiopoietins-1 and 2, and Tie-2 during tumor
angiogenesis and their functional correlation with tumor
neovascular architecture. Neurol Res. 25:729–738. 2003. View Article : Google Scholar : PubMed/NCBI
|
|
43
|
Nikbakht H, Panditharatna E, Mikael LG, Li
R, Gayden T, Osmond M, Ho CY, Kambhampati M, Hwang EI, Faury D, et
al: Spatial and temporal homogeneity of driver mutations in diffuse
intrinsic pontine glioma. Nat Commun. 7:111852016. View Article : Google Scholar : PubMed/NCBI
|
|
44
|
Phillips LM, Zhou X, Cogdell DE, Chua CY,
Huisinga A, R Hess K, Fuller GN and Zhang W: Glioma progression is
mediated by an addiction to aberrant IGFBP2 expression and can be
blocked using anti-IGFBP2 strategies. J Pathol. 239:355–364. 2016.
View Article : Google Scholar : PubMed/NCBI
|
|
45
|
Gilbert MR, Dignam JJ, Armstrong TS, Wefel
JS, Blumenthal DT, Vogelbaum MA, Colman H, Chakravarti A, Pugh S,
Won M, et al: A randomized trial of bevacizumab for newly diagnosed
glioblastoma. N Engl J Med. 370:699–708. 2014. View Article : Google Scholar : PubMed/NCBI
|
|
46
|
Schäfer N, Gielen GH, Kebir S, Wieland A,
Till A, Mack F, Schaub C, Tzaridis T, Reinartz R, Niessen M, et al:
Phase I trial of dovitinib (TKI258) in recurrent glioblastoma. J
Cancer Res Clin Oncol. 142:1581–1589. 2016. View Article : Google Scholar : PubMed/NCBI
|
|
47
|
Baysan M, Woolard K, Bozdag S, Riddick G,
Kotliarova S, Cam MC, Belova GI, Ahn S, Zhang W, Song H, et al:
Micro-environment causes reversible changes in DNA methylation and
mRNA expression profiles in patient-derived glioma stem cells. PLoS
One. 9:e940452014. View Article : Google Scholar : PubMed/NCBI
|
|
48
|
Wang D, Li JR, Zhang YH, Chen L, Huang T
and Cai YD: Identification of differentially expressed genes
between original breast cancer and xenograft using machine learning
algorithms. Genes (Basel). 9(pii): E1552018. View Article : Google Scholar : PubMed/NCBI
|
|
49
|
Siegelin MD, Raskett CM, Gilbert CA, Ross
AH and Altieri DC: Sorafenib exerts anti-glioma activity in vitro
and in vivo. Neurosci Lett. 478:165–170. 2010. View Article : Google Scholar : PubMed/NCBI
|
|
50
|
Yan D, Kowal J, Akkari L, Schuhmacher AJ,
Huse JT, West BL and Joyce JA: Inhibition of colony stimulating
factor-1 receptor abrogates microenvironment-mediated therapeutic
resistance in gliomas. Oncogene. 36:6049–6058. 2017. View Article : Google Scholar : PubMed/NCBI
|
|
51
|
Galanis E, Anderson SK, Lafky JM, Uhm JH,
Giannini C, Kumar SK, Kimlinger TK, Northfelt DW, Flynn PJ, Jaeckle
KA, et al: Phase II study of bevacizumab in combination with
sorafenib in recurrent glioblastoma (N0776): A north central cancer
treatment group trial. Clin Cancer Res. 19:4816–4823. 2013.
View Article : Google Scholar : PubMed/NCBI
|