Introduction
Endometrial cancer (EC) is the sixth most common
cancer in women worldwide and the second most common gynecologic
neoplasm after cervical cancer. According to IARC/GLOBOCAN data
(1), a worldwide increase of 52.7%
in incidence and 70.6% in mortality is expected in EC for the year
2040.
According to its histopathological characteristics,
EC is classified in two categories: Type I or endometrioid
endometrial carcinomas (EEC), and type II or non-endometrioid
endometrial carcinomas (NEEC) (2).
EEC is the most frequent histological type (~80% of all cases);
when diagnosed at an early stage [stage I, according to the
classification of the International Federation of Gynecology and
Obstetrics (FIGO), 2009] (3) and
low histological grade, it is associated with a good prognosis and
5-year survival rates of 90% (4,5).
However, 13–25% of patients with EEC suffer recurrence and
metastatic disease, which is associated with a poor outcome
(6–10).
The lower survival rates of patients with relapsed
stage I EEC depend on disease distribution. It has been reported
that 5-year survival is reduced to 55% for pelvic recurrences and
to 17% for extra-pelvic recurrences (11). Notably, patients diagnosed with
advanced disease (stage III/IV) have a high risk of recurrence and
are more likely to have extra-pelvic metastases at the time of
recurrence (12).
Early diagnosis is critical in recurrent EC
management. In this context, despite the benefits of the FIGO 2009
surgical-pathological staging system (3), some limitations have been reported. In
particular, in Stage I EC, an inaccurate prognostic assessment may
lead to unnecessary follow-up for the majority of patients or to
suboptimal treatment of patients who will eventually suffer
relapse.
The challenge to improve current EC decision-making
and management has involved deepening the understanding of the
molecular basis of EC, in order to identify molecular entities with
altered expression and/or functions, known as biomarkers. In recent
decades, a number of tissue biomarkers have been introduced for EC
prognosis (13,14). In addition, several studies have
proposed EC molecular prognostic signatures (15–17).
In particular, the use of high-throughput sequencing technology
coupled with bioinformatics has led to a comprehensive genetic and
molecular characterization of EC by The Cancer Genome Atlas (TCGA)
research network (18). As part of
this characterization, four EC molecular subtypes have been
identified with distinctive molecular and clinicopathological
features (DNA polymerase ε, microsatellite instability, copy number
(CN) Low and CN High) (18).
Despite its power as a prognostic tool, TCGA classification
involves evaluations with a set of techniques (genomics,
transcriptomics, proteomics and somatic CN alterations assessment)
that require great professional expertise and sophisticated
equipment, and thus elevated costs, making its implementation
difficult in clinical services worldwide.
To gain further insight into EC biology and the
identification of prognostic biomarkers, the present study was
conducted to search for differentially expressed genes (DEGs) in EC
tissues. These genes were prioritized after comparison with a
reference list of EC-related genes gathered from the DisGeNET
database. Subsequently, the prioritized genes were subjected to
further hierarchical clustering analysis in a different EC cohort.
Then, an enrichment analysis of DEGs with information from pathway
and/or Gene Ontology databases was performed. In addition, an
evaluation was carried out to assess whether DEG-encoded proteins
physically interact within the cell or are part of protein
molecular networks. A set of genes were further subjected to
association analysis with EC clinicopathological parameters and
survival analysis. Finally, an expression analysis of one candidate
biomarker was conducted using a cell model of EC aggressiveness and
a pilot validation study was performed using samples obtained from
patients with EC.
Materials and methods
Bioinformatics approaches
Survey of EC-associated genes
To survey current knowledge on EC-related genes, the
DisGeNET gene-disease associations database was used (19,20).
DisGeNET version 5.0 (online version), containing >500,000
associations between >17,000 genes and 20,000 diseases, was used
for this study. DisGeNET uses a vocabulary for diseases given by
the Concept Unique Identifiers from the Unified Medical Language
System® (UMLS) Metathesaurus® (version UMLS
2018AA) (21). Specifically, genes
associated with the following EC disease terms were collected:
‘Endometrial neoplasms’, ‘Endometrial carcinoma’, ‘Stage
endometrial cancer’, ‘Recurrent endometrial cancer’, ‘Serous
endometrial intraepithelial carcinoma’, ‘Endometrial Squamous Cell
Carcinoma’, ‘Endometrial endometrioid adenocarcinoma’, ‘Endometrial
intraepithelial neoplasia’, ‘Endometrial serous adenocarcinoma’,
‘Endometrial adenocarcinoma’, ‘Endometrial stromal sarcoma’, ‘Low
grade endometrial stromal sarcoma’, ‘Endometrial stromal tumors’
and ‘Malignant neoplasm of endometrium’. To obtain a complete
repertoire of EC-associated genes, a search including all
identified terms referring to EC was performed and results were
compiled in one list.
Analysis of EC DEGs
Affymetrix microarray data from the GSE17025 dataset
[n=103 samples; control (atrophic endometrium), n=12; tumor, n=91]
(22), was obtained from the Gene
Expression Omnibus (GEO; http://www.ncbi.nlm.nih.gov/geo/) database. The
clinicopathological characteristics of the patients included in
this cohort are detailed in Table
SI. Microarray data were analyzed using GPL570 platform
(Affymetrix Human Genome U133 Plus 2.0 Array; Affymetrix; Thermo
Fisher Scientific, Inc.). DEGs between non-tumor and tumor samples
were identified using GEO2R (https://www.ncbi.nlm.nih.gov/geo/geo2r/), where genes
with adjusted P<0.05 and |log[fold-change (FC)]|>0.5 were
defined as DEGs. Multiple testing corrections were performed
through Benjamini-Hochberg False Discovery Rate (FDR)<0.05. In
addition, RNAseq (Illumina GA platform; Illumina, Inc.) and
clinical data from TCGA Uterine Corpus Endometrioid Cancer (UCEC;
n=333 samples; mean age, 63.2 years; age range, 33–90 years;
Table SII) dataset was retrieved
from the UCSC Xena portal (https://xena.ucsc.edu) in order to address the
prognostic potential of EC candidate genes.
Gene prioritization
Gene prioritization and functional enrichment [Gene
Ontology (GO) and Kyoto Encyclopedia of Genes and Genomes (KEGG)
pathways] analyses of DEGs were performed using ToppGene Suite
(http://toppgene.cchmc.org) (23). ToppGene Suite is a portal that
allows functional enrichment, prioritization of candidate genes
using functional annotations and/or analysis of interaction
networks, leading to identification of disease candidate genes.
Gene prioritization analysis was carried out considering the
following parameters: GO (molecular function, biological process
and cellular component), Human phenotype, Mouse phenotype, Pathway,
Pubmed, Interaction, Co-expression, Co-expression Atlas and
Disease. In all cases, the standard method used to determine
statistical significance (P<0.05) was the Hypergeometric
probability distribution with Benjamini-Hochberg FDR
correction.
Identification of DEGs among tumors of
histological grade 1 and 3
To identify a subset of DEGs among tumors of
histological grade 1 and 3 among the 3,976 prioritized genes using
TCGA UCEC RNAseq data, the unpaired Student's t-test between
subjects assuming equal variances was applied (P<0.01). To
define sample and gene clusters, non-supervised hierarchical
clustering was performed. For all these analyses the MeV software
(http://mev.tm4.org/) was used. Functional
enrichment analysis of each gene cluster was performed in ENRICHR
(http://amp.pharm.mssm.edu/Enrichr/).
The ggplot2 R (https://github.com/tidyverse/ggplot2) package was used
to create heatmap plots.
Protein-protein interaction (PPI) network
analysis construction
A PPI network was built using the Search Tool for
the Retrieval of Interacting Genes (STRING) database (https://string-db.org/). In addition, identification
of hub genes was conducted using the cytoHubba application in
Cytoscape (24).
In silico analysis of TPX2 post-translational
modifications
Prediction of the content of potential glycosylation
(N and O-glycosylation), as well as phosphorylation sites in the
TPX2 protein sequence (NP_036244.2) was performed. For this
purpose, glycosylation sites were predicted using the NetNGlyc 1.0
Server (http://www.cbs.dtu.dk/services/NetNGlyc/) and the
NetOGlyc 4.0 Server (http://www.cbs.dtu.dk/services/NetOGlyc/) (N and
O-glycosylation sites, respectively), and putative phosphorylation
sites were predicted using the NetPhos 3.1 Server (http://www.cbs.dtu.dk/services/NetPhos/).
Experimental approaches
Patient samples
Endometrial tissue samples were obtained from
patients with EC who underwent surgery before receiving hormonal
and/or chemotherapy treatment at Vall d'Hebron Hospital (Barcelona,
Spain) between January 2006 and December 2015 (mean age, 66.5
years; age range, 40–82 years). The Institutional Review Boards
from Vall d'Hebron Hospital and from IBYME approved the protocol,
and written informed consent was provided by all patients
participating in the study (approval no. SAF-20083997; CE001/2013).
Samples were classified based on the 2009 FIGO staging system.
Sample collection and handling was done as previously described
(25). Table SIII shows patient samples clinical
information.
Cell culture
Hec1a and Ishikawa EC commercial cell lines, as well
as Hec1a and Ishikawa cells stably transfected with the human ETS
variant transcription factor 5 (ETV5) sequence (Hec1a-ETV5
and Ishikawa-ETV5, respectively) were kindly provided by Dr
Reventos and co-workers (Biomedical Research Group in Gynecology at
Vall d'Hebron Research Institute, Barcelona, Spain).
ETV5-overexpressing Hec1a and Ishikawa cells were generated
by stable transfection with the pEGFP-C2 vector (BD Biosciences)
containing the human ETV5 coding sequence, as previously
reported (26). Hec1a and
Hec1a-ETV5 cells were cultured in McCoy's 5A, while parental and
ETV5-transfected Ishikawa cells were cultured in DMEM:F12,
all supplemented with 10% fetal bovine serum, and handled as
described (26). Cell lines were
morphologically and genetically authenticated and tested for
mycoplasma in accordance with American Association for Cancer
Research guidelines as previously reported (27). The mRNA expression levels of
ETV5 were monitored in Hec1a, Ishikawa, Hec1a-ETV5 and
Ishikawa-ETV5 cells, by means of reverse transcription-quantitative
PCR (RT-qPCR) (Fig. S1).
RNA extraction, cDNA synthesis and qPCR
Procedures were performed as previously reported
(28). Briefly, total RNA was
extracted from cell lines and tissue samples with
TRIzol® (Invitrogen; Thermo Fisher Scientific, Inc.),
according to standard protocols. cDNA synthesis was performed with
1–2 µg total RNA using the SuperScript™ III reverse transcriptase
enzyme at 50°C (Thermo Fisher Scientific, Inc.). Negative controls
omitting RNA or reverse transcriptase were included and tested in
the PCR procedure. Quantitative evaluation of mRNA levels was
performed by qPCR using SYBR-Green® PCR Master Mix
(Thermo Fisher Scientific, Inc.) with the CFX96 Touch™ unit
(Bio-Rad Laboratories, Inc.). Thermocycling conditions were as
follows: Stage 1, 2 min at 50°C; stage 2, 10 min at 95°C; stage 3,
15 sec at 95°C; stage 4, 1 min at 60°C; stages 3–4 were repeated 40
times. All samples were run in triplicate; negative controls (the
two aforementioned controls of the RT assay and a PCR control where
the DNA template was omitted) were tested in all cases. Transcript
expression levels were determined as follows:
2−ΔCq, where: DCq=Cq gene under study-Cq
housekeeping gene (GAPDH) (29). PCR primers sequences were as
follows: Targeting protein for Xklp2 (TPX2), forward
5′-GCGCTCTGATTGGTGCATTC-3′, reverse 5′-TTCTTCCCACGGCTCACCTA-3′ (PCR
fragment size, 131 bp); GAPDH, forward
5′-TGCACCACCAACTGCTTAGC-3′ and reverse 5′-GGCATGGACTGTGGTCATGAG-3′
(PCR fragment size, 88 bp); ETV5, forward
5′-TGCTTCAGCTAACCAAGCCT-3′, reverse 5′-ATGGTCCCAGGGAAATCTCG-3′ (PCR
fragment size, 150 bp).
Fluorescence immunocytochemistry
Cell monolayers were fixed with 4% paraformaldehyde
for 10 min, treated with 0.1% Triton X-100 for 10 min and blocked
with 4% bovine serum albumin (Sigma-Aldrich; Merck KGaA) in PBS for
45 min; all of these procedures were performed at room temperature.
Subsequently, cells were incubated for 1 h at 37°C with 2 µg/ml
anti-TPX2 antibody (1:50; mouse monoclonal, epitope mapping amino
acids 635–675 near C-terminus; cat. no. sc-376812; Santa Cruz
Biotechnologies, Inc.), followed by a 1-h incubation at room
temperature with a fluorescent secondary antibody (1:500; goat
anti-mouse IgG-Cy3 conjugate; cat. no. A10521; Invitrogen; Thermo
Fisher Scientific, Inc.). Negative controls were run using the same
concentration of purified IgG (cat. no. I5381; Sigma-Aldrich; Merck
KGaA) from the same species as the primary antibody. Nuclear cell
staining was done with Hoechst 33342 (Sigma-Aldrich; Merck KGaA).
Cell preparations were analyzed using a Nikon C1 confocal laser
microscope (Nikon Corporation).
Sample preparation, SDS-PAGE and western
immunoblotting
Cell lysates were prepared in RIPA buffer [20 mM
Tris-HCl (pH 7.5), 150 mM NaCl, 1% NP-40, 1% sodium deoxycholate]
supplemented with a cocktail of protease inhibitors (2 mM
p-aminobenzamidine, 1 mM PMSF, 10 µg/ml aprotinin and 10 µg/ml
leupeptin). Protein concentration was determined using the Bradford
method (Bio-Rad Laboratories, Inc.). Protein extracts (30 µg) from
EC cell lines were separated by SDS-PAGE on 10% gels and were
electrotransferred to nitrocellulose membranes (Amersham Hybond
ECL; GE Healthcare). Membranes were blocked in PBS containing 5%
nonfat milk for 1 h at room temperature incubated overnight at 4°C
with 2 µg/ml anti-TPX2 antibody (1:100; cat. no. sc-376812; Santa
Cruz Biotechnology, Inc.) diluted in blocking solution, and for 1 h
at room temperature with secondary antibody [horseradish peroxidase
(HRP)-conjugated anti-mouse IgGs; 1:1,000; cat. no. 32430; Thermo
Fisher Scientific, Inc.] in blocking solution. Assays were
developed with ECL Western Blotting Detection kit (GE Healthcare)
chemiluminescence system. Negative controls run using the same
concentration of purified IgG from the same species as the primary
antibody were included in all cases.
Statistical analysis
In order to determine whether the data followed a
Gaussian distribution, the D'Agostino-Pearson test was used.
Comparisons involving two groups of samples were analyzed using
unpaired Student's t-test or Mann-Whitney test, as shown in each
case. For studies involving more than two experimental groups, the
Kruskal Wallis test followed by Dunn's post hoc test was
applied.
To define gene expression cut-off values, the Cutoff
Finder web tool (http://molpath.charite.de/cutoff/) (30) was used (method ‘survival’), and
subsequent analysis between categorical variables was performed
using the Fisher's Exact Test. Specifically, samples were
classified, according to the expression level of each gene included
in the analysis, as ‘low’ or ‘high’ expression categories,
according to the cut-off value determined by applying the
‘survival’ method in Cutoff Finder. In addition, Receiver Operating
Characteristic (ROC) curves were used to determine diagnostic
accuracy of selected genes.
For survival analysis, Kaplan-Meier curves were
constructed and the differences between them were analyzed by the
log-rank test. Additionally, Cox proportional hazards model was
used to identify independent survival predictor variables. Analyses
were performed on GraphPad Prism version 5 (GraphPad Software,
Inc.) and R (version 3.4.4; http://www.r-project.org/). The workflow used in the
present study is shown in Fig.
1.
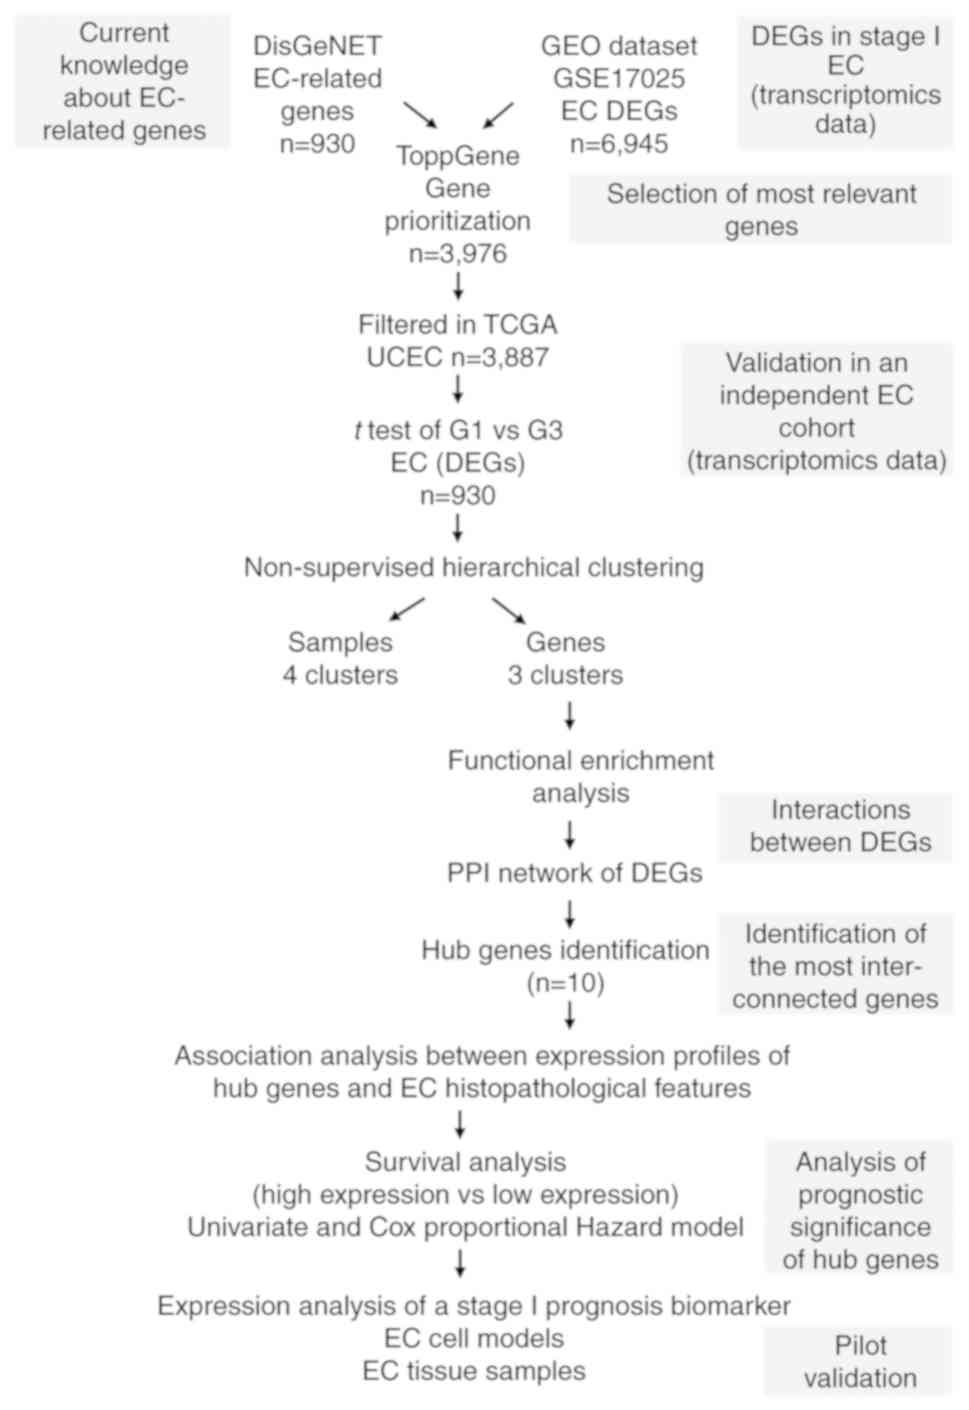 | Figure 1.Workflow diagram of text and data
mining tools used for the identification of prognostic EC
biomarkers. Genes associated with the entire repertoire of
EC-related disease terms were gathered from DisGeNET in order to
cover a higher spectrum of genes with potential prognostic value in
EC. These genes were used as a reference for further selection and
prioritization of EC-DEGs retrieved from the GEO microarray dataset
GSE17025. The prioritized genes were then subjected to hierarchical
clustering analysis using TGCA UCEC RNAseq dataset, which led to
the identification of a set of DEGs able to generate sample and
gene clusters. Since sample cluster segregation has a lack of
prognostic significance, gene clusters were further analyzed. To
determine if DEGs belonged to the same pathways, enrichment
analysis and PPI network analysis were carried out. A set of ‘hub
genes’ were identified, and statistical association analysis with
EC clinicopathological parameters and survival analysis was
performed. Finally, pilot validation studies were performed using
EC cell models and tissue specimens. EC, endometrial cancer; DEGs,
differentially expressed genes; GEO, Gene Expression Omnibus; TCGA,
The Cancer Genome Atlas; UCEC, Uterine Corpus Endometrioid Cancer;
PPI, protein-protein interaction. |
Results
Survey of EC-associated genes using
the DisGeNET database
A search on DisGeNET was conducted using different
EC-related terms to obtain a spectrum of genes associated with EC.
The scientific literature shows inconsistencies regarding the terms
used when reporting findings, and terms are sometimes not the same
to describe a specific phenomenon or variable studied.
Consequently, the different source databases that are integrated
into DisGeNET annotate the genes associated with EC to different
terms present in the controlled vocabularies. While only 10 genes
were found to be associated to the disease term ‘endometrial cancer
recurrent’, a higher number of genes with potential prognostic
significance in EC have been described in the literature, and
several of these genes have not been annotated to the term
‘endometrial cancer recurrent’. The spectrum of disease terms
related to EC was expanded to retrieve all of the associated genes
that could have potential prognostic value in EC. All of these
genes were surveyed and compiled in a list. A total of 930
EC-associated genes are listed in Table SIV.
Analysis of EC-DEGs and gene
prioritization
Microarray data from the GSE17025 study (GEO
repository) was used to identify DEGs between non-tumoral atrophic
endometria from postmenopausal women and tumor endometrial samples
with the GEO2R tool, resulting in a total of 6,945 DEGs
(P<0.05). In order to prioritize these genes according to their
relevance for the EC phenotype, the ToppGene tool was used.
Specifically, a comparison was done between the list of
EC-associated genes retrieved from the DisGeNET database (‘training
set’) and the gene list gathered from the GSE17025 dataset (‘test
set’). As a result, a list of 3,976 genes associated with the
disease was obtained (P<0.05) (data not shown).
Gene expression profiles of candidate
genes
To determine the relevance of genes identified in
the gene prioritization analysis, their gene expression profiles
were evaluated using RNAseq data from TCGA UCEC study. Gene
expression profiles of the prioritized genes were analyzed only in
tumor samples (n=333). Considering that histological grade has been
reported to have a significant impact on recurrence-free survival
(RFS) in patients with stage I EC (31), the expression profile of the
prioritized genes in tumor tissues was evaluated according to
histological grades 1 and 3 (Student's t-test; P<0.05). First,
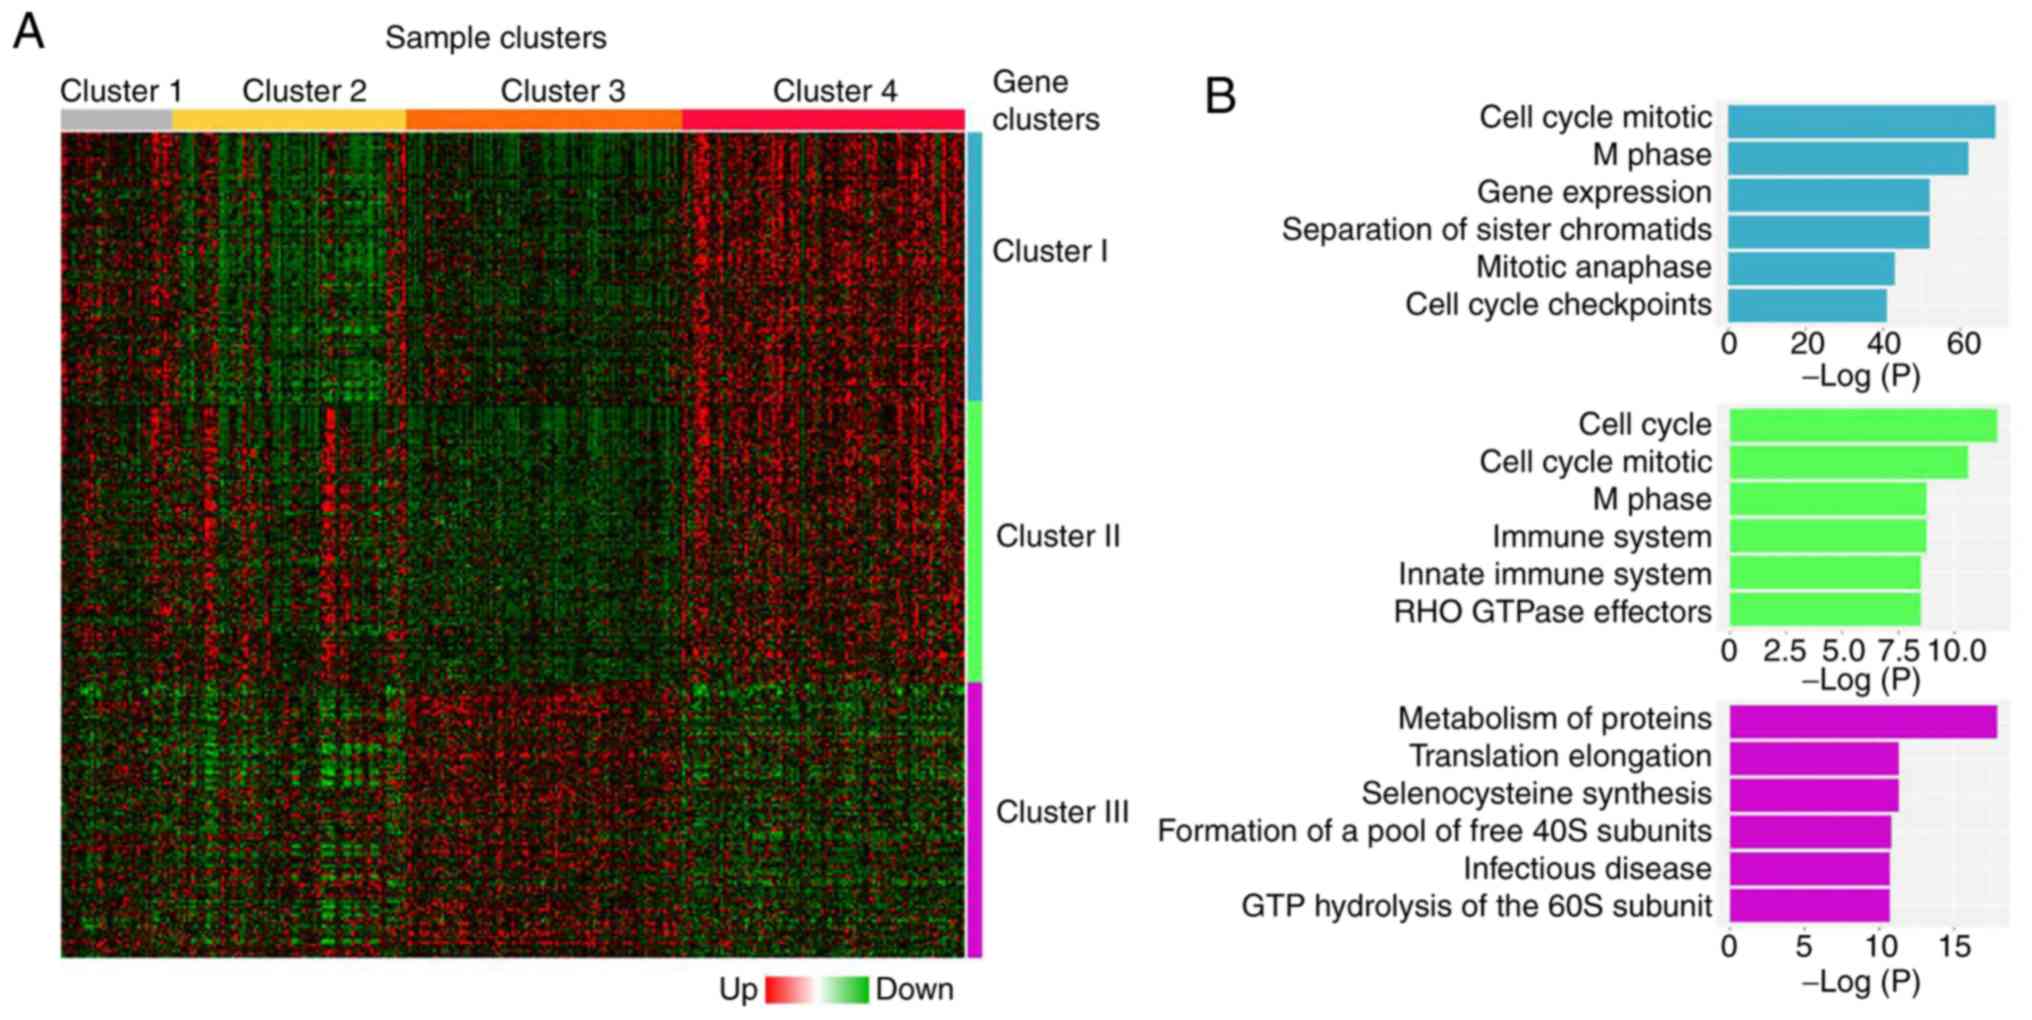
four clusters were identified among tumor samples, clusters 1
(n=41), 2 (n=86), 3 (n=102) and 4 (n=104) (Fig. 2A). A significant association was
found between the number of samples in each cluster and tumor
histology, stage, grade and molecular subtype (Table SV). Cluster 4 depicted the highest
number of serous carcinomas, as well as the highest number of
advanced stage (III and IV), grade 3 and CN High subtype
carcinomas, although only 13.46 % (14/104) cases showed all four
negative prognostic factors. Clusters 1–4 were associated with a
significant segregation of endometrial tumors according to their
clinicopathological characteristics. However, this segregation was
not related to EC patient prognosis, since no significant
differences were observed in RFS and overall survival (OS) curves
in the cohort studied (RFS, P=0.2465; OS, P=0.6361; Fig. S2). However, the comparison of DEGs
between grade 1 and grade 3 tumors revealed the segregation of
three distinctive gene clusters (clusters I, II and III; Fig. 2A). Clusters I and II (448 and 293
genes, respectively) contained genes with increased expression in
grade 3 tumors compared with grade 1 tumors, whereas cluster III
(189 genes) contained genes with a diminished expression in grade 3
tumors compared with grade 1 tumors. Functional enrichment analysis
of the genes included in each cluster indicated that genes from
clusters I and II were mainly associated with cell cycle
regulation, whereas genes from cluster III were related to protein
metabolism and regulation of translation (Fig. 2B). Table
I lists the most representative functional annotations of each
cluster.
 | Table I.Functional enrichment analysis of
gene clusters I–III. |
Table I.
Functional enrichment analysis of
gene clusters I–III.
| A, Cluster I |
|---|
|
|---|
| GO term | Adjusted
P-value | Genes |
|---|
| Cell Cycle_Homo
sapiens_R-HSA-1640170 |
9.9122×10⁻²² | TOP2A; AHCTF1;
HSP90AB1; ZWILCH; MCM10; RSF1; SMC4; CDC20; NIPBL; CDC23; EXO1;
NUF2; NEK2; KNTC1; YWHAG; RAB2A; HUS1; KIF23; TERF1; MASTL; SMC1A;
CKAP5; YWHAZ; CDC25A; PSMA6; TFDP1; PSMA1; NUP50; PSME4; UBE2V2;
DNA2; MAPRE1; PSMD12; SEH1L; PSMD11; PSMD14; PKMYT1; CENPA; SKA2;
CCNB2; BRIP1; PSMB2; RBBP4; RAD21; E2F3; BUB3; CENPW; RRM2; UBE2C;
GINS4; NUP153; TPX2; CENPF; PSMC1; PSMC2; CDK1; TUBGCP3; RAD1;
LPIN2; NUP37 |
| Cell Cycle,
Mitotic_Homo sapiens_R-HSA-69278 |
2.4984×10⁻¹⁹ | TOP2A; AHCTF1;
HSP90AB1; ZWILCH; MCM10; SMC4; CDC20; NIPBL; CDC23; NUF2; NEK2;
KNTC1; YWHAG; RAB2A; KIF23; MASTL; SMC1A; CKAP5; CDC25A; PSMA6;
TFDP1; PSMA1; NUP50; PSME4; DNA2; MAPRE1; PSMD12; SEH1L; PSMD11;
PSMD14; PKMYT1; CENPA; SKA2; CCNB2; PSMB2; RBBP4; RAD21; E2F3;
BUB3; RRM2; UBE2C; GINS4; NUP153; TPX2; CENPF; PSMC1; PSMC2; CDK1;
TUBGCP3; CENPO; LPIN2; NUP37 |
| M Phase_Homo
sapiens_ R-HSA-68886 |
1.7904×10⁻¹⁶ | AHCTF1; PSMD12;
PSMD11; SEH1L; PSMD14; ZWILCH; SMC4; CENPA; SKA2; CDC20; CCNB2;
NIPBL; CDC23; PSMB2; RAD21; NUF2; KNTC1; BUB3; RAB2A; UBE2C;
NUP153; KIF23; MASTL; SMC1A; CKAP5; PSMA6; CENPF; PSMA1; PSMC1;
NUP50; PSMC2; PSME4; CDK1; CENPO; MAPRE1; LPIN2; NUP37 |
| Gene
Expression_Homo sapiens_R-HSA-74160 |
1.7904×10⁻¹⁶ | ZNF496; TDRKH;
GSK3B; SMG1; HNRNPU; ZC3H8; ADAR; EPRS; GLS; MED14; MED13; CASP10;
EXO1; XPO5; RIOK1; YWHAG; ZIK1; SUPT16H; TBP; PDPK1; NCBP2; HUS1;
BAZ1B; YWHAZ; SRRM1; SAP30; PSMA6; TFDP1; PSMA1; XRN1; TBL1XR1;
NUP50; PSME4; TET3; RRAGD; POLR1E; DNA2; FYTTD1; ZNF274; PSMD12;
SEH1L; PSMD11; RBM8A; PSMD14; RPN2; DDX21; TARS; BAZ2A; RNPC3;
GTF2E1; BRIP1; MED30; PDCD11; PSMB2; RBBP4; PLAGL1; TRA2B; BMS1;
ZKSCAN3; EIF4H; TP53BP2; IARS2; RPP14; EXOSC3; SKIL; EIF4B; POLR2K;
DCAF13; ZNF420; WWTR1; WTAP; CBX3; UTP3; TAF11; CDC5L; NUP153;
LSM4; GATAD2B; LSM3; TPX2; PHF5A; NR6A1; EIF5; POLR3B; PSMC1;
PSMC2; CDK1; TAF4B; RAD1; CDK12; DCP1A; TAF2; RAN; FARSB; NUP37;
EIF4G1 |
| Separation of
Sister |
3.424×10⁻¹⁶ | PSMD12; AHCTF1;
PSMD11; SEH1L; PSMD14; ZWILCH; CENPA; |
| Chromatids_Homo
sapiens_R-HSA-2467813 |
| SKA2; CDC20; CDC23;
PSMB2; RAD21; NUF2; KNTC1; BUB3; UBE2C; SMC1A; CKAP5; PSMA6; CENPF;
PSMA1; PSMC1; PSMC2; PSME4; CENPO; MAPRE1; NUP37 |
|
| B, Cluster
II |
|
| GO term | Adjusted
P-value | Genes |
|
| Cell Cycle_Homo
sapiens_R-HSA-1640170 | 0.00026303 | DIDO1; ANKLE2;
YWHAB; CDCA5; CDCA8; FOXM1; PSMA7; LMNA; E2F1; NUP88; PSMF1; PCNT;
CSNK2A1; NCAPH2; TUBB; TOP3A; RANGAP1; LEMD2; POLA2; PSMC4; DKC1;
MCM3; MCM4; KIF2C; SPC24; LPIN3 |
| Cell Cycle,
Mitotic_Homo sapiens_R-HSA-69278 | 0.00061651 | ANKLE2; CSNK2A1;
NCAPH2; CDCA5; TUBB; CDCA8; FOXM1; RANGAP1; LEMD2; PSMA7; POLA2;
PSMC4; LMNA; MCM3; E2F1; MCM4; NUP88; KIF2C; PSMF1; PCNT; SPC24;
LPIN3 |
| Axon guidance_Homo
sapiens_R-HSA-422475 | 0.00231835 | BRAP; EPHB6; ROBO3;
CSNK2A1; YWHAB; LIMK1; ARAF; FN1; PHB; PSMA7; DNM2; ARPC2; PSMC4;
CFL1; GRB2; PSMF1; COL9A2; JAK3; EPHB1; SPTAN1; MYH10; CAMK2G |
| M Phase_Homo
sapiens_R-HSA-68886 | 0.00231835 | ANKLE2; CSNK2A1;
NCAPH2; CDCA5; CDCA8; RANGAP1; LEMD2; PSMA7; PSMC4; LMNA; NUP88;
KIF2C; PSMF1; SPC24; LPIN3 |
| Immune System_Homo
sapiens_R-HSA-168256 | 0.00274532 | DCTN5; CUL7; YWHAB;
MAPKAP1; ARAF; ICAM5; PHB; UBE2Z; ECSIT; UBE2J2; ELK1; PLD3; PSMA7;
ICAM1; ADCY5; RNF216; IRAK1; CFL1; KIF5A; ATP6V0A2; NUP88; PSMF1;
JAK3; SPTAN1; CAMK2G; POLR2L; CTSA; BRAP; IL11RA; LIMK1; FN1; DNM2;
MAVS; ARPC2; TRIM39; PSMC4; TRAF3; POLR3E; GRB2; UBA1; KIF2C; CRK;
RAPGEF3; ATP6V1B1 |
|
| C, Cluster
III |
|
| GO term | Adjusted
P-value | Genes |
|
| Metabolism of
proteins_Homo sapiens_R-HSA-392499 |
4.165×10⁻⁶ | TSTA3; COX19; ARF1;
L3MBTL2; DCTN1; RPL31; POMT1; PARN; PIGV; ZDHHC2; RPS14; POFUT2;
EXOSC4; RPL18A; FBXO4; RPL15; EXTL3; RPS10; MPDU1; PIAS4; SEC16B;
NFYC; H3F3A; DYNC1LI2; RPS28; CCNE2; EEF1D; EIF3G; PDCL; EXOC3;
RPL29; PFDN5 |
| Eukaryotic
Translation Elongation_Homo sapiens_R-HSA-156842 | 0.00039761 | RPS14; RPS28;
RPL18A; EEF1D; RPL31; RPL15RPL29; RPS10 |
| Selenocysteine
synthesis_Homo sapiens_R-HSA-2408557 | 0.00039761 | RPS14; RPS28;
RPL18A; RPL31; SECISBP2; RPL15; RPL29; RPS10 |
| Formation of a pool
of free 40S subunits_Homo sapiens_R-HSA-72689 | 0.00052927 | RPS14; RPS28;
RPL18A; RPL31; EIF3G; RPL15; RPL29; RPS10 |
| Infectious
disease_Homo sapiens_R-HSA-5663205 | 0.0005955 | ARF1; RPL31;
GTF2F1; RPS14; RPS28; CDK7; PSMB5; PSMC3; RPL18A; RPL15; RPL29;
RPS10; VPS28; AP1M1 |
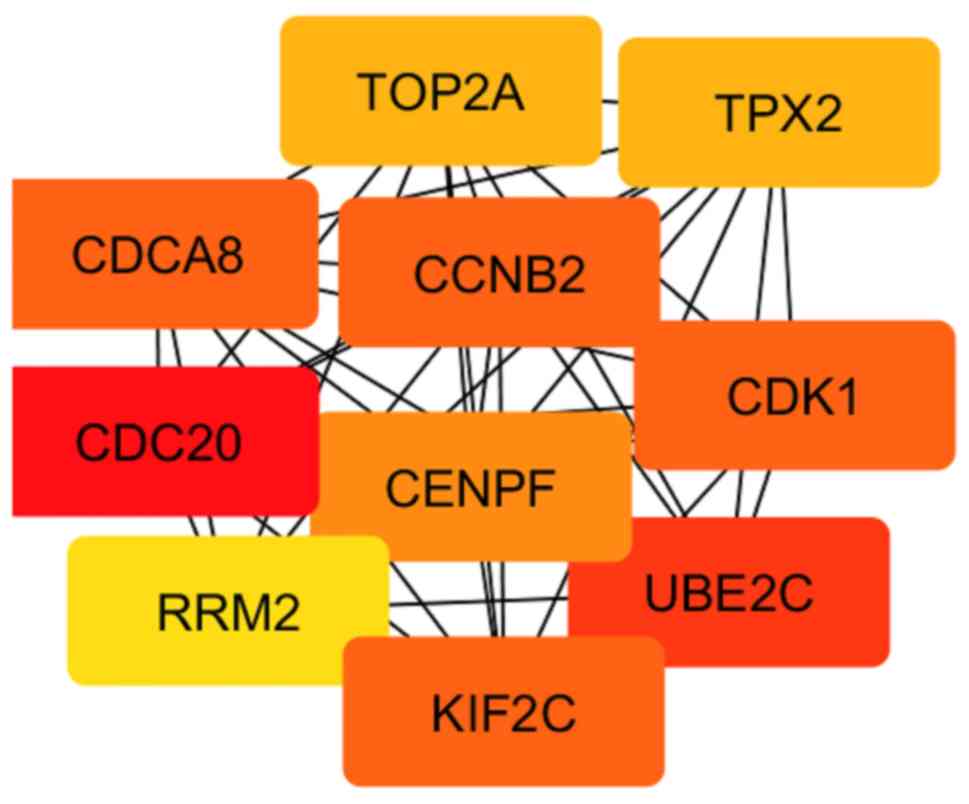
PPI network analysis and
identification of hub genes
In order to evaluate the interactions between DEGs
obtained as a result of the comparison between grade 1 and 3 EC, a
PPI network was constructed using the STRING database. The
resulting network contained a total of 930 nodes and 9,392 edges.
Subsequently, the network hub genes were identified using the
cytoHubba application in Cytoscape. The top 10 genes with the
highest degree of connectivity were defined as the hub genes:
CCNB2, CDCA8, CDC20, CDK1, CENPF, KIF2C, RRM2, UBE2C, TOP2A
and TPX2 (Fig. 3; Table II). Since these genes were also
differentially expressed between EC and control samples, to
determine their diagnostic potential, a ROC curve analysis was
performed using RNAseq data from TCGA UCEC cohort. As a result, all
hub genes significantly distinguished patients with EC from control
patients (CCNB2, AUC=0.9834; CDCA8, AUC=0.9832;
CDC20, AUC=0.9885; CDK1, AUC=0.9486; CENPF,
AUC=0.9727; KIF2C, AUC=0.9807; RRM2, AUC=0.9720;
UBE2C, AUC=0.9762; TOP2A, AUC=0.9640; TPX2,
AUC=0.9775; P<0.0001 for all genes; Fig. S3). Subsequently, the association
between the expression levels of hub genes and clinicopathological
parameters was evaluated. Firstly, a higher expression of all hub
genes was confirmed in grade 3 compared with grade 1–2 tumors.
Moreover, CCNB2, CDCA8, CDC20, CENPF, KIF2C, UBE2C, TOP2A
and TPX2 expression was significantly associated with tumor
histology, with highest mRNA levels in NEEC cases. In addition,
CDCA8, CDK1, CENPF, UBE2C and TPX2 transcript levels
were higher in stage III–IV than in stage I–II tumors. Finally,
CDCA8, CDK1, UBE2C and TPX2 expression levels were
higher in tumors with deep myometrial invasion (MI) (Table III).
| Table II.Functional enrichment analysis of hub
genes. |
Table II.
Functional enrichment analysis of hub
genes.
| A, Biological
process (GO) |
|---|
|
|---|
| Term/pathway | Description | False discovery
rate |
|---|
| GO:1903047 | Mitotic cell cycle
process |
2.92×10⁻¹³ |
| GO:0051301 | Cell division |
8.13×10⁻¹² |
| GO:0000280 | Nuclear
division |
1.59×10⁻⁷ |
| GO:0140014 | Mitotic nuclear
division |
3.70×10⁻⁷ |
| GO:0051726 | Regulation of cell
cycle |
3.82×10⁻⁷ |
|
| B, Molecular
function (GO) |
|
|
Term/pathway |
Description | False discovery
rate |
|
| GO:0008022 | Protein C-terminus
binding | 0.0122 |
| GO:0005524 | ATP binding | 0.0122 |
| GO:0004693 | Cyclin-dependent
protein serine/threonine kinase activity | 0.0122 |
| GO:0042826 | Histone deacetylase
binding | 0.0153 |
| GO:0003682 | Chromatin
binding | 0.0153 |
|
| C, Cellular
component (GO) |
|
|
Term/pathway |
Description | False discovery
rate |
|
| GO:0015630 | Microtubule
cytoskeleton |
2.43×10⁻⁵ |
| GO:0005819 | Spindle |
2.43×10⁻⁵ |
| GO:0044430 | Cytoskeletal
part |
7.34×10⁻⁵ |
| GO:0005815 | Microtubule
organizing center | 0.00033 |
| GO:0005829 | Cytosol | 0.00065 |
|
| D, KEGG
pathways |
|
|
Term/pathway |
Description | False discovery
rate |
|
| hsa04115 | p53 signaling
pathway |
9.70×10⁻⁵ |
| hsa04114 | Oocyte meiosis | 0.00023 |
| hsa04110 | Cell cycle | 0.00023 |
| hsa04914 |
Progesterone-mediated oocyte
maturation | 0.0047 |
| hsa04120 | Ubiquitin mediated
proteolysis | 0.0075 |
| Table III.Association analysis between mRNA
expression of hub genes and clinicopathological parameters. |
Table III.
Association analysis between mRNA
expression of hub genes and clinicopathological parameters.
|
| Histology |
| Stage |
| MI |
| Grade |
|
|---|
|
|
|
|
|
|
|
|
|
|
|---|
| Gene | NEEC | EEC | P-value | III/IV | I/II | P-value | MI>50% | MI<50% | P-value | Grade 3 | Grade 1/2 | P-value |
|---|
| RRM2 |
|
| 0.2247 |
|
| 0.1653 |
|
| 0.2912 |
|
| 0.0003a |
|
High | 12 | 24 |
| 13 | 23 |
| 18 | 18 |
| 31 | 5 |
|
|
Low | 104 | 336 |
| 110 | 330 |
| 177 | 263 |
| 243 | 197 |
|
| CDC20 |
|
|
<0.0001a |
|
| 0.1928 |
|
| 0.1579 |
|
|
<0.0001a |
|
High | 33 | 41 |
| 24 | 50 |
| 36 | 38 |
| 66 | 8 |
|
|
Low | 83 | 319 |
| 99 | 303 |
| 159 | 243 |
| 208 | 194 |
|
| TOP2A |
|
| 0.0032b |
|
| 0.0636 |
|
| 0.0996 |
|
| 0.0008a |
|
High | 13 | 13 |
| 11 | 15 |
| 15 | 11 |
| 23 | 3 |
|
|
Low | 103 | 347 |
| 112 | 338 |
| 180 | 270 |
| 251 | 199 |
|
| CDCA8 |
|
| 0.0001a |
|
| 0.0426c |
|
| 0.0099b |
|
|
<0.0001a |
|
High | 32 | 41 |
| 26 | 47 |
| 40 | 33 |
| 66 | 7 |
|
|
Low | 84 | 319 |
| 97 | 306 |
| 155 | 248 |
| 208 | 195 |
|
| UBE2C |
|
|
<0.0001a |
|
| 0.0257c |
|
| 0.0011b |
|
|
<0.0001a |
|
High | 68 | 89 |
| 51 | 106 |
| 81 | 76 |
| 128 | 29 |
|
|
Low | 48 | 271 |
| 72 | 247 |
| 114 | 205 |
| 146 | 173 |
|
| TPX2 |
|
|
<0.0001a |
|
| 0.0005a |
|
| 0.0002a |
|
|
<0.0001a |
|
High | 68 | 40 |
| 42 | 66 |
| 61 | 47 |
| 102 | 6 |
|
|
Low | 48 | 320 |
| 81 | 287 |
| 134 | 234 |
| 172 | 196 |
|
| CDK1 |
|
| 0.1159 |
|
| 0.0419c |
|
| 0.0103c |
|
| 0.0022b |
|
High | 17 | 99 |
| 19 | 31 |
| 29 | 21 |
| 39 | 11 |
|
|
Low | 33 | 327 |
| 104 | 322 |
| 166 | 260 |
| 235 | 191 |
|
| CCNB2 |
|
| 0.0281c |
|
| 0.06326 |
|
| 0.0733 |
|
|
<0.0001a |
|
High | 26 | 49 |
| 26 | 49 |
| 38 | 37 |
| 63 | 12 |
|
|
Low | 90 | 311 |
| 97 | 304 |
| 157 | 244 |
| 211 | 190 |
|
| KIF2C |
|
| 0.0079b |
|
| 0.1460 |
|
| 0.0843 |
|
|
<0.0001a |
|
High | 22 | 34 |
| 19 | 37 |
| 29 | 27 |
| 53 | 3 |
|
|
Low | 94 | 326 |
| 104 | 316 |
| 166 | 254 |
| 221 | 199 |
|
| CENPF |
|
| 0.0001a |
|
| 0.0308c |
|
| 0.0816 |
|
| 0.0004a |
|
High | 22 | 23 |
| 18 | 27 |
| 24 | 21 |
| 37 | 8 |
|
|
Low | 94 | 337 |
| 105 | 326 |
| 171 | 260 |
| 237 | 194 |
|
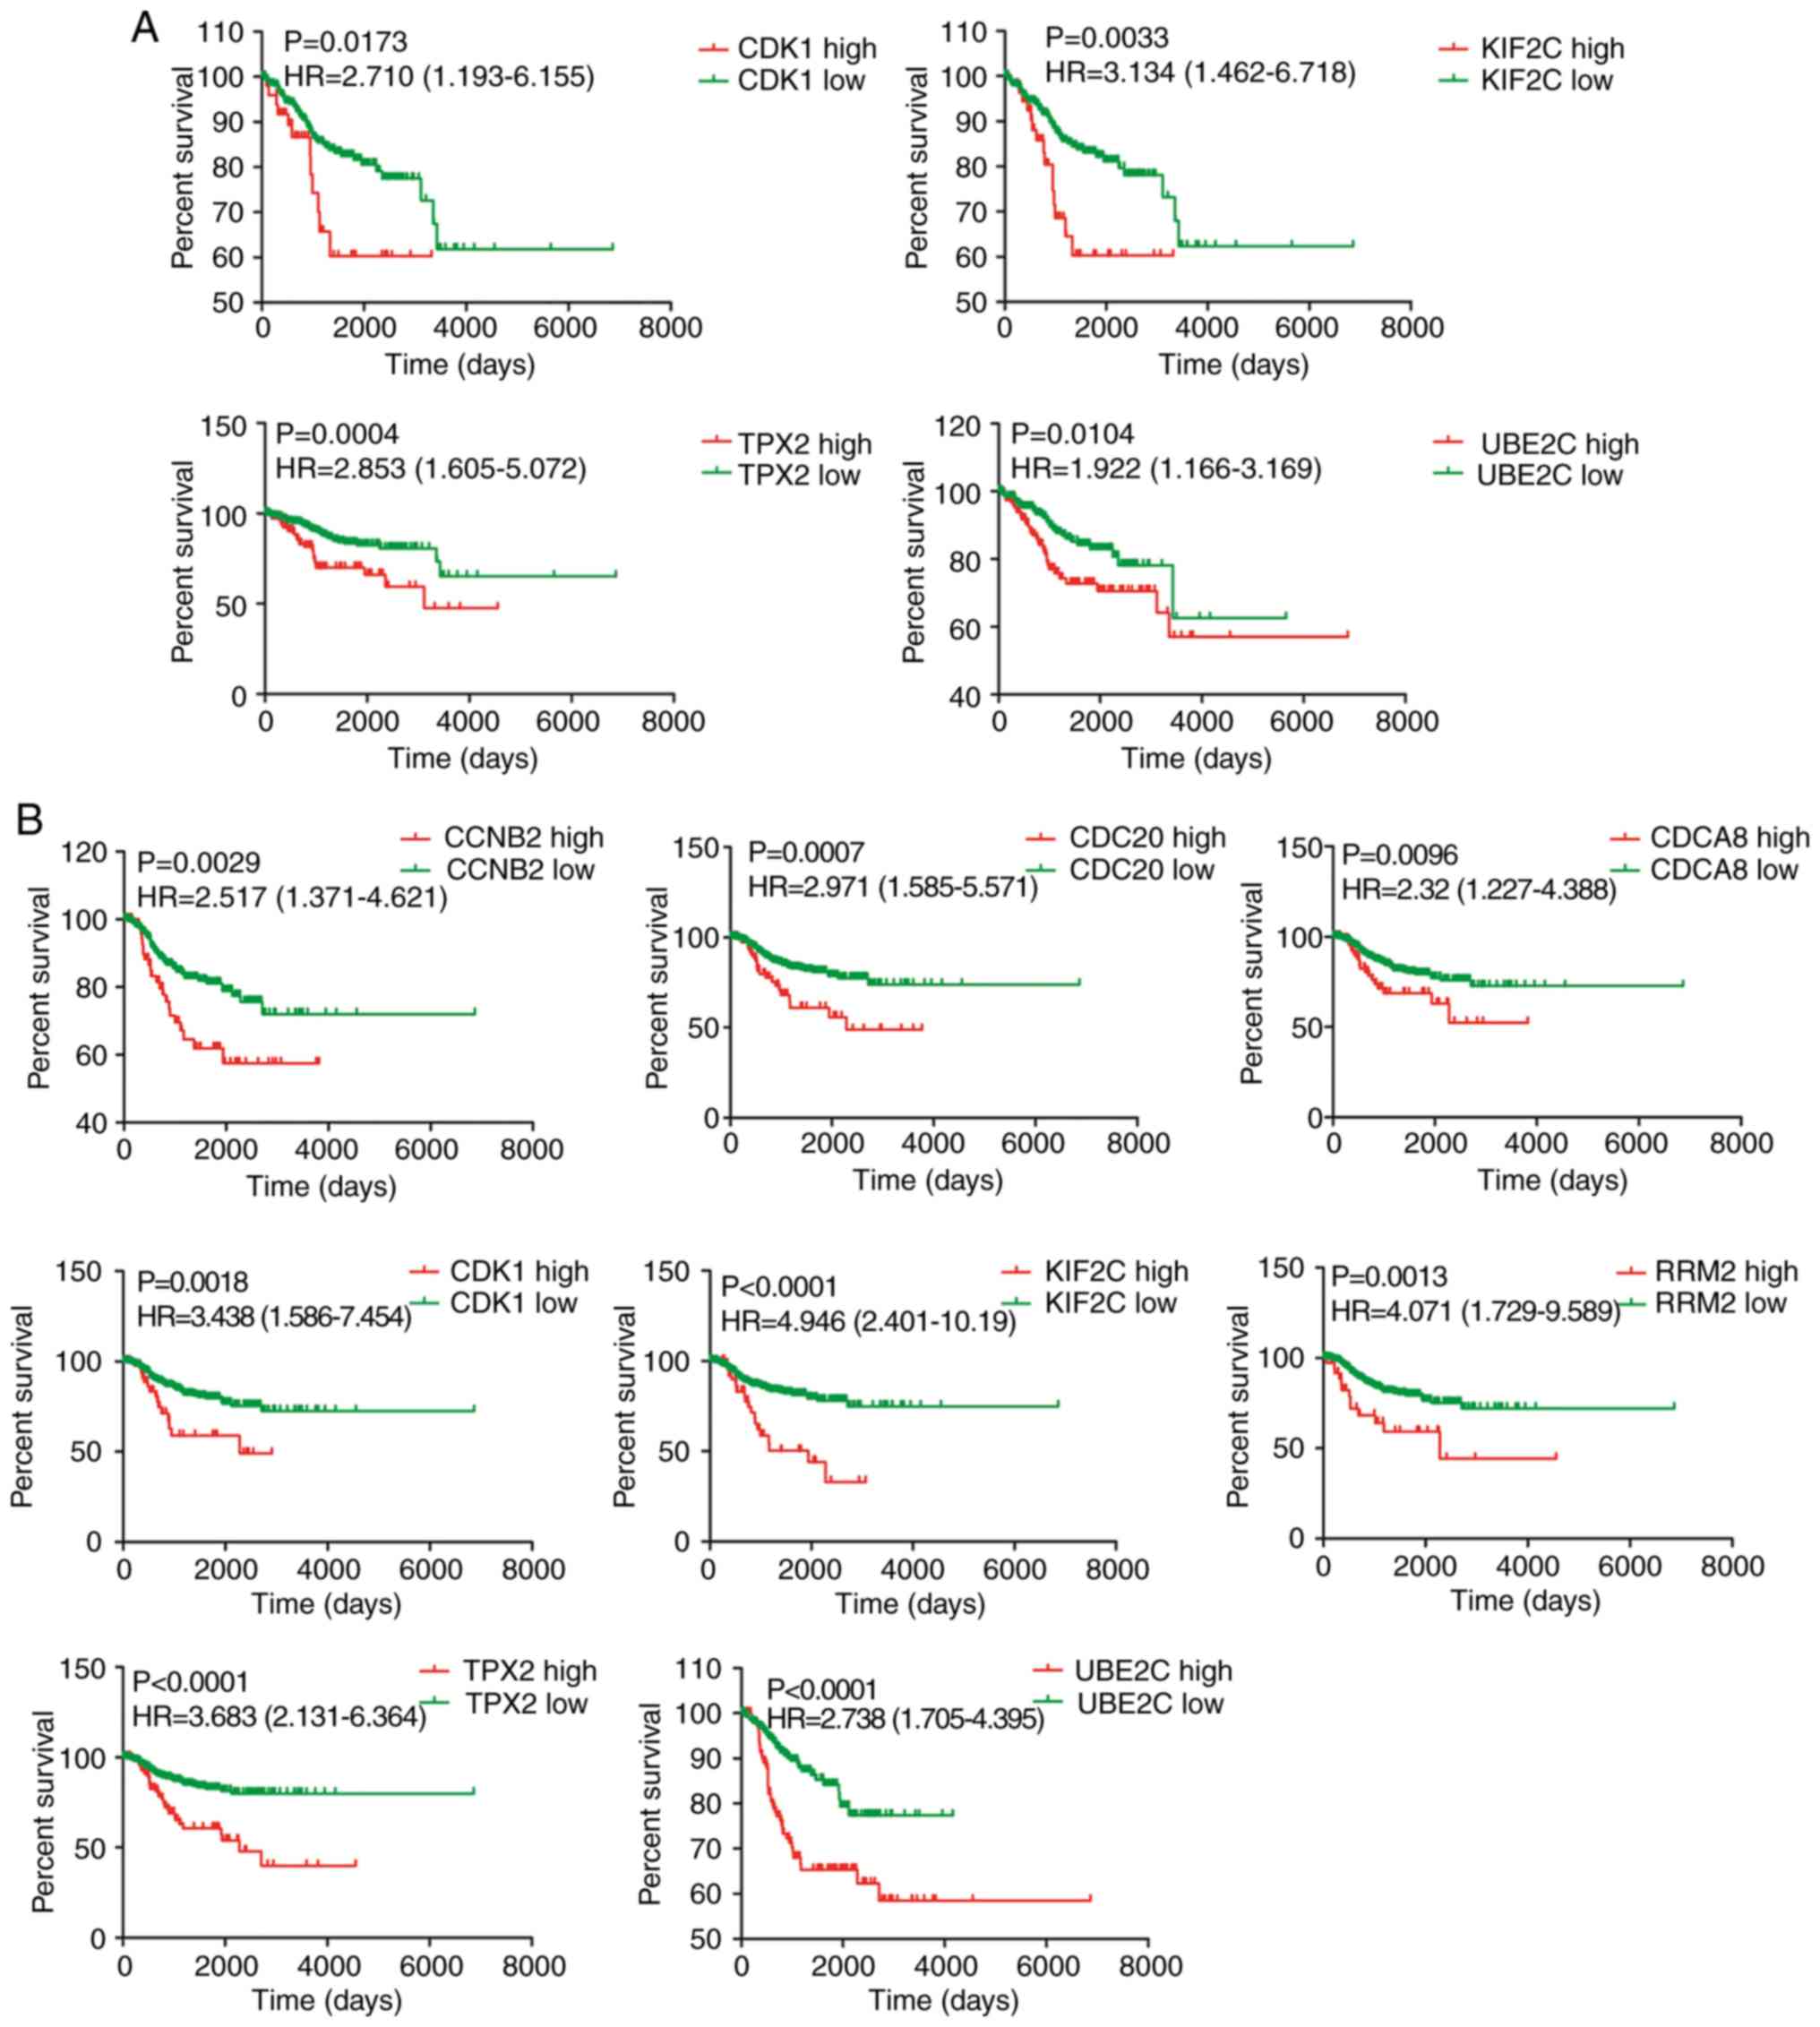
Next, the relationship between expression of the 10
hub genes and prognosis of patients with EC was assessed in TCGA
cohort. A higher expression of CDK1, KIF2C, UBE2C and
TPX2 was significantly associated with shorter OS (Fig. 4A), whereas no associations were
found for the other hub genes (data not shown). Moreover, CCNB2,
CDCA8, CDC20, CDK1, KIF2C, RRM2, UBE2C and TPX2 were
significantly associated with RFS (Fig.
4B). No association was found between CENPF and
TOP2A genes and RFS (data not shown).
Cox proportional hazards regression analysis was
performed using histology, FIGO stage, grade, MI and expression of
the 10 hub genes (data not shown). As a result, histology, grade
and MI were the only independent OS predictors (histology: P=0.027,
hazard ratio: 1.824; grade: P=0.042, hazard ratio: 2.062; MI:
P<0.0001, hazard ratio: 3.729). On the other hand, stage, grade
and UB2C were the only RFS predictors (stage: P<0.0001,
hazard ratio: 2.571; grade: P=0.0055, hazard ratio: 1.730;
UB2C: P=0.005, hazard ratio: 1.955). A similar analysis done
for stage I tumors identified UB2C, TPX2, KIF2C and MI as
only OS predictors (UB2C: P=0.025, hazard ratio: 0.187;
TPX2: P=0.066, hazard ratio: 3.776; KIF2C: P=0.013,
hazard ratio: 5.647; MI: P<0.0001, hazard ratio: 5.748). In the
case of RFS, TPX2, KIF2C and histology were the only
predictors (TPX2: P=0.014, hazard ratio: 3.557;
KIF2C: P=0.047, hazard ratio: 2.659; histology: P=0.091,
hazard ratio: 0.388).
TPX2 expression analysis in EC cell
models and patient samples
Since TPX2 was identified as the best
independent RFS predictor in stage I EC, a set of experiments was
performed to assess its expression in EC cell models and patient
samples.
Firstly, TPX2 mRNA and protein expression
analysis was conducted in EC cell models depicting different
degrees of aggressiveness. For this purpose, Hec1a and Ishikawa
parental cells and ETV5 stable transfectants of both cell
lines (Hec1a-ETV5 and Ishikawa-ETV5, respectively) were evaluated.
As a result, an increase of 20–25 times in TPX2 transcript
expression was detected in cells overexpressing ETV5
compared with parental cells (Fig.
5A). In agreement with these results, an increased expression
of TPX2 protein was detected by western blotting (Fig. 5B) and fluorescence
immunocytochemistry (Fig. 5C) in
Hec1a-ETV5 and Ishikawa-ETV5 when compared with Hec1a and Ishikawa
cells, respectively.
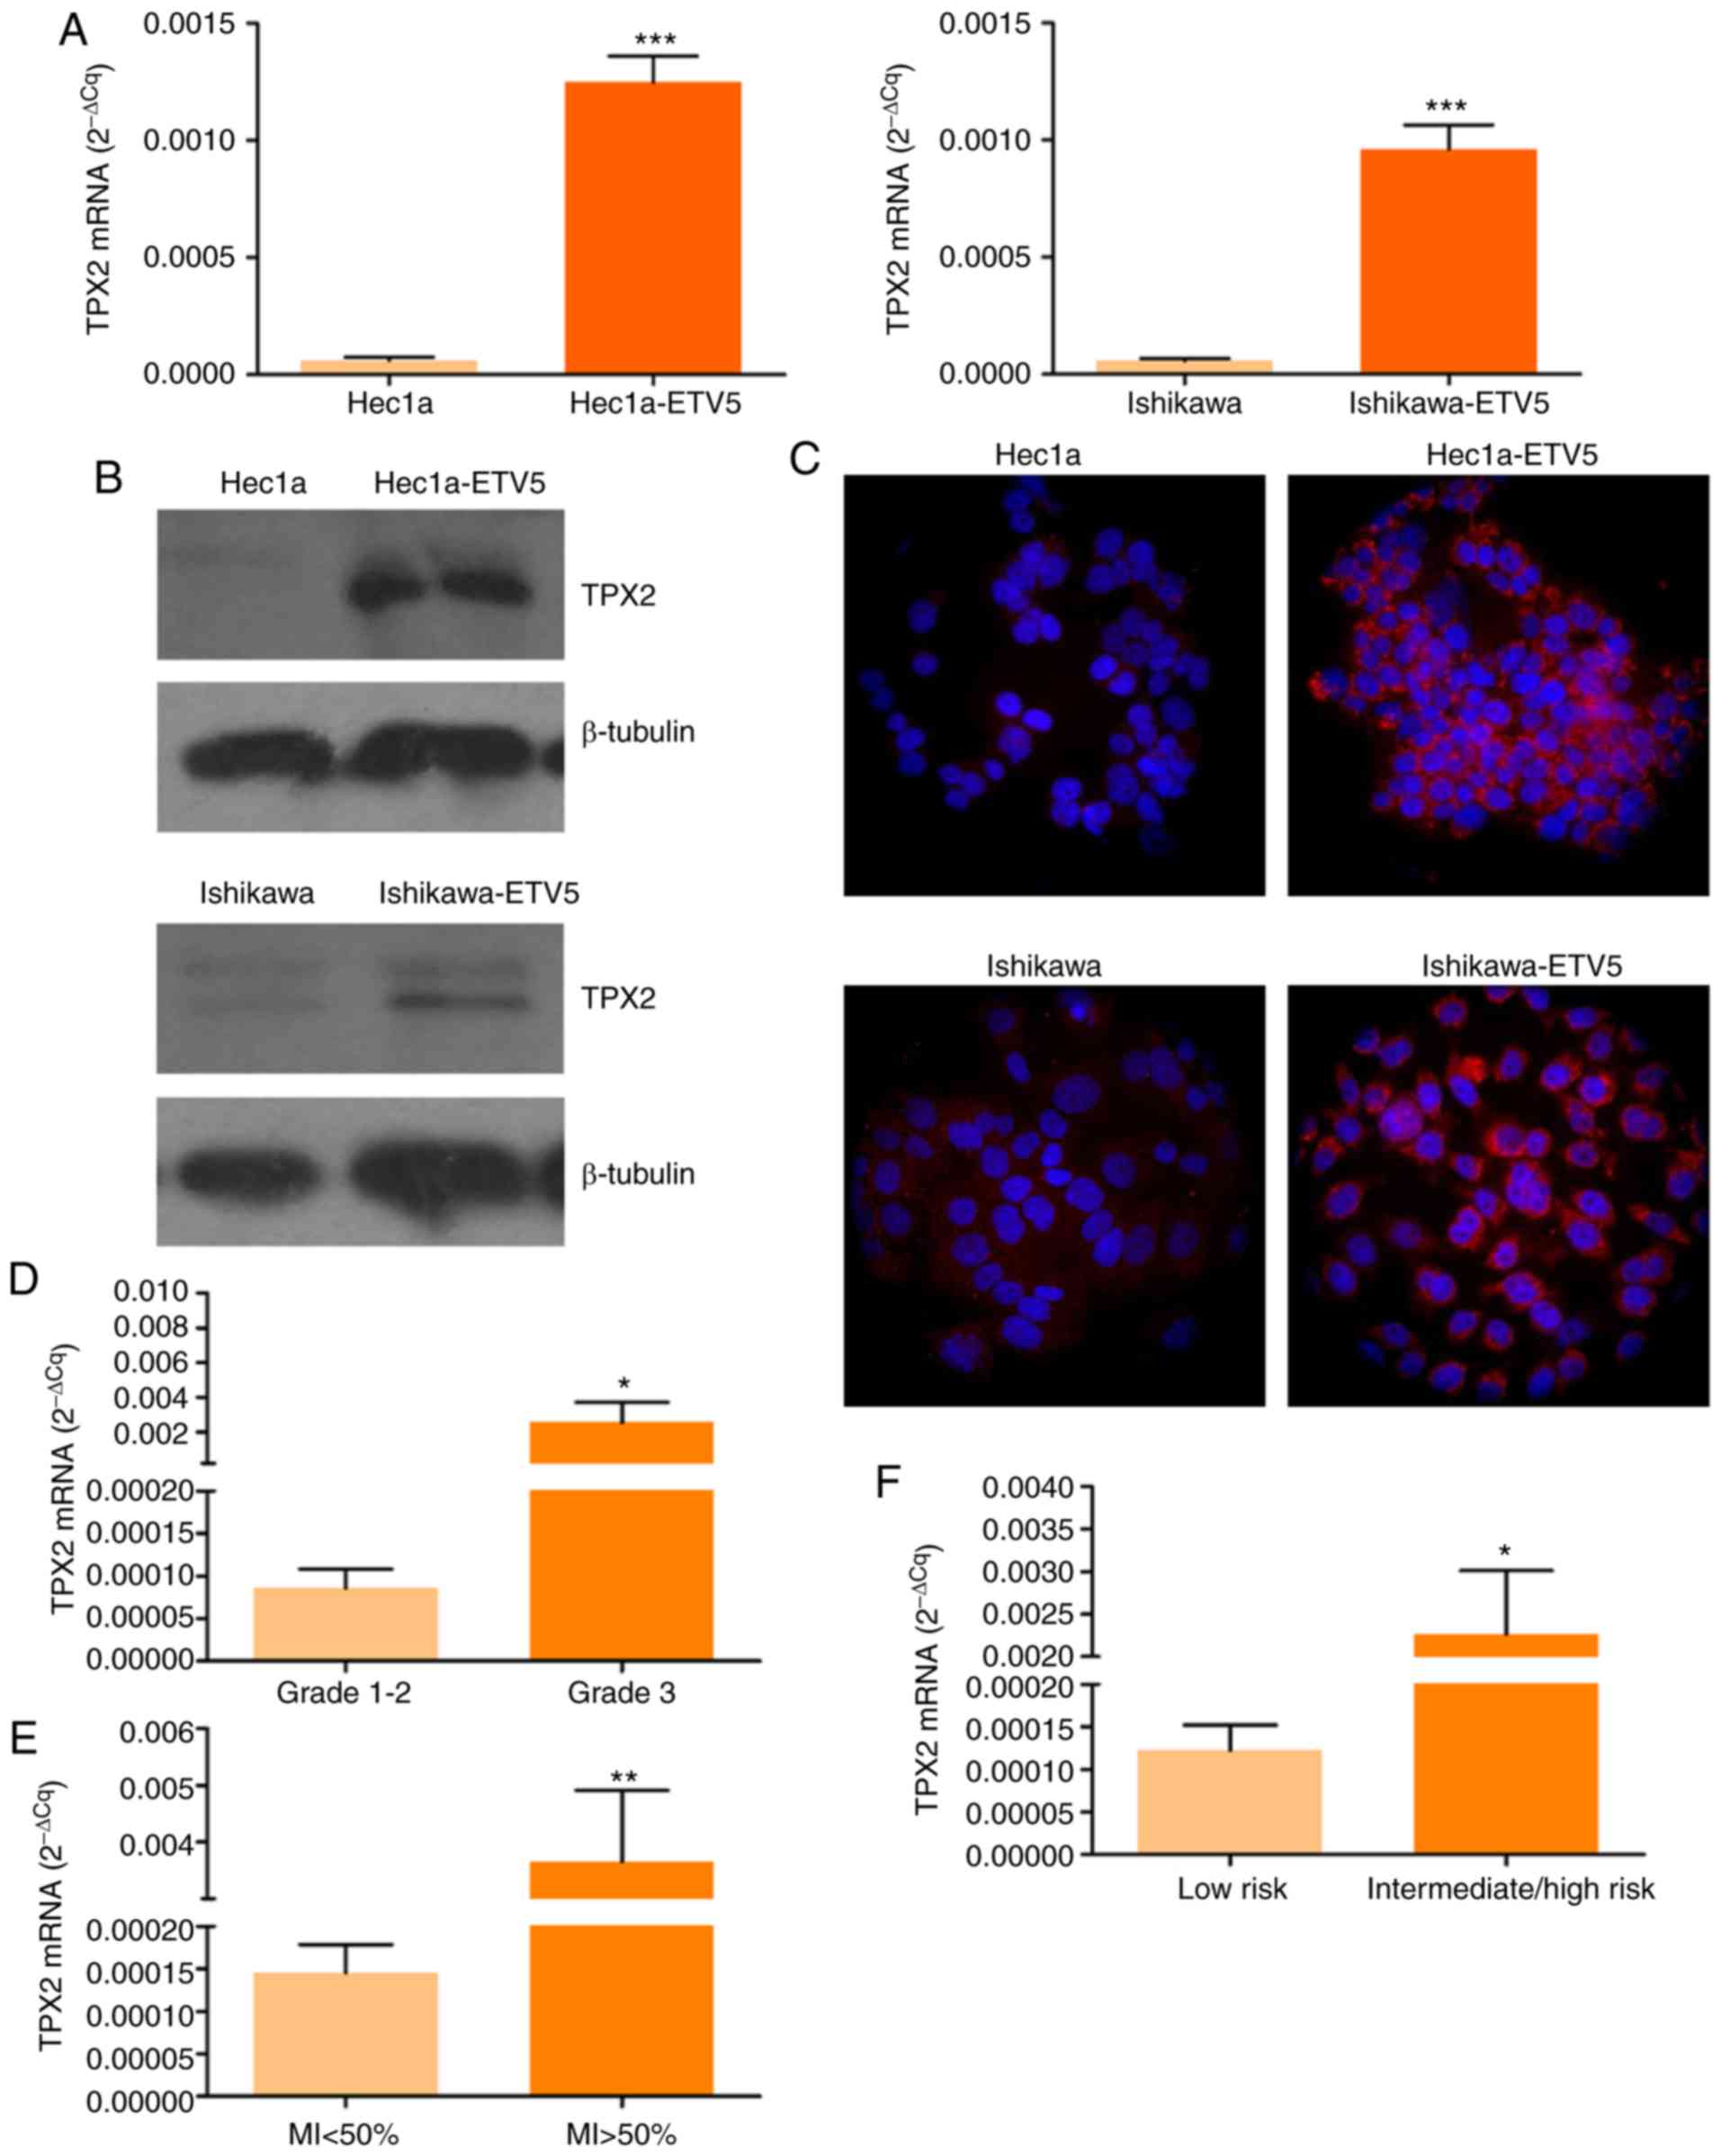 | Figure 5.TPX2 expression analysis in EC
cell lines and patient tumors. (A) RT-qPCR analysis of TPX2
in parental and ETV5 stable transfectants of Hec1a (left)
and Ishikawa (right) EC cell lines (***P<0.001; Student's
t-test). (B) Western immunoblotting of TPX2 in total protein
extracts of Hec1a and Hec1a-ETV5, Ishikawa and Ishikawa-ETV5 cells.
(C) Fluorescent immunocytochemistry of TPX2 in Hec1a and
Hec1a-ETV5, Ishikawa and Ishikawa-ETV5 cells. Nuclear staining was
done with Hoechst 33342. Magnification, ×600. RT-qPCR analysis of
TPX2 mRNA levels in (D) grade 1–2 (n=13) and 3 (n=14) tumors
(*P=0.0494; Mann-Whitney U test), E) MI<50% (n=15) and MI>50%
(n=11) tumors (**P=0.0051; Mann-Whitney U test), and (F) Low (n=11)
and intermediate/high (n=22) risk tumors (*P=0.0374; Mann-Whitney U
test). EC, endometrial cancer; RT-qPCR, reverse
transcription-quantitative PCR; TPX2, targeting protein for Xklp2;
ETV5, ETS variant transcription factor 5; MI, myometrial
invasion. |
Next, TPX2 mRNA levels were determined in EC
tissue biopsies. Firstly, grade 3 tumor samples exhibited higher
TPX2 levels than grade 1–2 tumors (Fig. 5D; P<0.05), confirming results
from the in silico analysis (Fig. 3; Table
II). In addition, a higher expression of TPX2 was
detected in samples with deep MI (Fig.
5E; P<0.01). Finally, TPX2 mRNA levels were higher in
intermediate-high recurrence risk tumors compared with low risk
tumors, classified following guidelines previously established
(32) (Fig. 5F; P<0.05).
Discussion
EC risk stratification is currently performed using
clinicopathological data (stage, grade, MI and lymphovascular
invasion), which are not always representative of the tumor biology
(32) and show discrepancies in the
final diagnosis (33–35). Therefore, there is a need to
identify EC biomarkers that contribute to the prediction of the
early evolution of tumors, particularly in stage I tumors that may
relapse, with the aim to optimize preoperative disease management
and follow-up.
Considering the relevance that bioinformatics has
gained in translational medicine, several algorithms have been
implemented in recent years for the identification of biomarkers
with prognostic value in several types of cancer. As an example,
gene expression profile analysis performed using genomic and
clinical data stored in public repositories has led to the
identification of biomarkers with potential prognostic value in
prostate (36) and breast (37) cancer, among others.
DisGeNET has been used in several studies, including
for a survey analysis of disease-associated genes (38), prediction of associations between
diseases and genes and non-coding sequences (39,40),
and associations between diseases (41,42).
In the present study, DisGeNET analysis quickly and systematically
yielded a total of 930 EC-related genes. This set of genes was used
as a ‘training set’ in ToppGene analysis to prioritize the 6,945 EC
DEGs retrieved from GEO. Using TCGA UCEC cohort, gene expression
profile analysis of the prioritized genes (3,976 genes) identified
930 DEGs in tumors according to histological grade, a
clinicopathological parameter significantly associated with EC
relapse (31). Gene expression
profiles revealed three distinctive gene clusters, with genes
upregulated (clusters I and II) or downregulated (cluster III) in
grade 3 tumors in comparison to grade 1 tumors. These results are
in line with a recent study reporting the identification of genes
and microRNAs (miRs) differentially expressed in grade 3 EC and
functionally associated with cell cycle regulation (43).
To determine whether the resulting DEGs were
associated with a common cellular pathway, two approaches were
used. First, an enrichment analysis of DEGs with information from
pathway databases and/or the GO was done. A second approach aimed
at evaluating whether DEG-encoded proteins may physically interact
within the cell or are part of protein molecular networks. These
two approaches are complementary; current pathway-curated databases
do not capture all the genes in the human genome and consequently
several DEGs may not be annotated to any pathway in these
databases. The human interactome map has a higher coverage on
proteins encoded by human genes; therefore, it can provide
additional insights than those based only on pathway databases.
Moreover, PPI networks have been used to infer candidate genes for
different types of cancer (44–48).
These networks are sensitive to disruption of high degree proteins
(proteins with numerous interaction partners, also named hub genes)
(49,50) since protein degree correlates with
its gene essentiality for phenotype survival. PPI network analysis
using the STRING database in combination with the cytoHubba
application led to the identification of the following hub genes:
CCNB2, CDCA8, CDC20, CDK1, CENPF, KIF2C, RRM2, UBE2C, TOP2A
and TPX2.
From the ROC curve analysis, it was revealed that
all hub genes significantly distinguished EC from control patients,
suggesting their diagnostic potential. Further evaluations
strengthen the relevance of the identified hub genes in EC, as
evidenced by the significant associations found between their
expression and tumor grade, stage, histology and MI. Finally, the
survival analysis revealed a negative impact of an increased
expression of some hub genes on OS and RFS. Among them, TPX2
was found as an independent negative prognostic predictor of RFS
and OS in stage I tumors. In line with these observations,
increased TPX2 expression (mRNA and protein) was detected in
Hec1a and Ishikawa human endometrial adenocarcinoma cell lines
overexpressing ETV5. This transcription factor has been
found to be overexpressed in EEC tissues, particularly in stage IB
tumors (51). Moreover, a higher
ETV5 expression has been detected at the invasive front of
EC tissues when compared with matched-superficial tumor areas, and
has been found to serve a role in MI. In line with these findings,
previous studies revealed epithelial to mesenchymal transition
molecular changes, as well as a more migratory and invasive
phenotype in Hec1a and Ishikawa cells overexpressing ETV5
than parental cell lines (52);
since they have been proposed as a model of early stage EC
aggressiveness, these cell lines were considered useful for the
present study. In line with these findings, TPX2 transcript
levels were higher in endometrial tumors with features associated
with intermediate-high risk of recurrence. It is worth noting that
Ishikawa-ETV5 cells TPX2 Western blot analysis revealed the
presence of two protein forms. In this regard, a bioinformatics
analysis identified four potential N-glycosylation sites (NetNGlyc
1.0 Server), 75 potential O-glycosylation sites (NetOGlyc 4.0
Server) and ≥50 potential phosphorylation sites (NetPhos 3.1
Server) for TPX2 (data not shown). Regarding the latter, evidence
of TPX2 phosphorylation has been reported (53,54).
TPX2 is a key factor for the assembly of the
mitotic spindle and of microtubules during apoptosis. It activates
Aurora kinase A during mitosis and directs its activity to the
mitotic spindle, serving an important role in mitosis. In recent
years, it has been shown that both proteins can generate a
functional unit with oncogenic properties (55). Increased expression of TPX2
has been associated with the progression of different types of
cancer (56). Recent studies have
linked TPX2 expression with EC; in particular, two
bioinformatics studies have related TPX2 with EC
pathogenesis (57,58). In addition, TPX2 was
identified as a target of miR-29a-5p, following a mechanism
that would regulate EC cell proliferation, invasion and apoptosis
(59). In line with these findings,
the Aurora kinase gene has been recently identified as one of 13
principal genes involved in the carcinogenesis of poorly
differentiated endometrial tumors (60).
Studies based on bioinformatics approaches may have
some limitations, mainly due to incomplete knowledge of protein
interaction maps in humans, although it has already been
demonstrated that even with this incomplete knowledge, it is
possible to gain insight on disease-associated modules (61). In addition, they may bias the
knowledge on genes associated with diseases, since for many human
diseases, the complete catalog of genes and sequence variants is
not available, and the information is scattered across different
databases and the literature. Moreover, different databases have
their own annotation criteria with regards to the use of controlled
vocabularies and ontologies. Furthermore, the information that can
be found in the literature is often not expressed using controlled
vocabularies. This challenge was addressed by using DisGeNET, which
is one of the most complete databases publicly available that also
includes data text mined from the literature. To overcome the
limitation posed by the use of different terms, a broad set of
terms to interrogate the database was used. Nevertheless, the
information obtained might not be complete due to inherent
limitations of the database (update cycle and/or incorrect capture
of all the data present in publications). With regard to data
mining tools, there is a limited availability of EC transcriptomics
datasets, which constitutes an additional limitation, since it
makes it difficult to validate candidate genes in independent
datasets, which is feasible in other tumor types in which there is
larger number of studies. Finally, while PPI networks are a useful
tool for the integration of information from text/data mining and
pathway databases, the selection of a small set of hub genes in
network analysis may have excluded genes/proteins within the
network that could be potentially important for the phenotype of
interest. However, due to the amount of DEGs and the complexity of
the generated PPI, it was necessary to use a computer approach to
select a small set of genes of interest. While the selected hub
genes depicted a potential diagnostic/prognostic value for EC,
further network analysis could be performed to assess the relevance
of other modules and sub-networks within the PPI presented as part
of this work.
In conclusion, the use of an algorithm that combines
a set of bioinformatics tools led to the identification of 10
genes, CCNB2, CDCA8, CDC20, CDK1, CENPF, KIF2C, RRM2, UBE2C,
TOP2A and TPX2, associated with EC progression. In
particular, to the best of our knowledge, this study was the first
to identify TPX2 as an independent prognostic biomarker in
stage I EC. Further validation studies in larger and independent EC
cohorts will contribute to confirm the prognostic value of
TPX2 with the ultimate goal of proposing its use as a
complement to current EC management.
Supplementary Material
Supporting Data
Acknowledgements
Authors would like to thank Dr Cristian Moiola for
his technical assistance.
Funding
Preparation of this manuscript was done with the
support of grants from the Agencia Nacional de Promoción Científica
y Tecnológica de Argentina (grant no. PICTSU-1072), the Consejo
Nacional de Investigaciones Científicas y Técnicas (CONICET; grant
no. PIP887), the Instituto Nacional del Cáncer (grant no. INC
2016-2017), Fundación R. Barón (donation) and Fundación Williams
(donation) to IBYME (MHVL); [Marie Curie Actions-International
Research Staff Exchange Scheme (IRSES); FP7-PEOPLE-2010-IRSES;
PROT*BIO*FLUID; grant #269285] funds, provided to JR and MHVL,
supported travel expenses.
Availability of data and materials
The datasets generated and/or analyzed during the
current study are available in the GEO repository (GSE17025,
http://www.ncbi.nlm.nih.gov/geo/query/acc.cgi?acc=GSE17025)
and UCSC Xena browser (TCGA Endometrioid cancer, UCEC dataset;
http://xenabrowser.net/datapages/?cohort=TCGA%20Endometrioid%20Cancer%20(UCEC)&removeHub=https%3A%2F%2Fxena.treehouse.gi.ucsc.edu%3A443).
Authors' contributions
MJB and MHVL were involved in conceptualization of
the study. MJB, EL, LIF, RB and MHVL contributed to experimental
design. MJB, LM, MCA, EC, AGM, JR, and MHVL collected data from
bioinformatics analysis and/or conducted laboratory experiments;
MJB, EL, MA, LF, RB and MHVL analyzed data. MJB, EL, LF and MHVL
interpreted results. MJB, LIF and MHVL wrote the original draft.
MHVL and JR acquired funds. MHVL supervised the entire project. All
authors read and approved the final version of the manuscript.
Ethics approval and consent to
participate
The Institutional Review Board of Vall d'Hebron
Hospital and IBYME approved the protocol, and written informed
consent was provided by all patients participating in the
study.
Patient consent for publication
Not applicable.
Competing interests
The authors declare that they have no competing
interests.
References
|
1
|
Globocan 2018, . International Agency for
Research on Cancer 2018. Available from
https://www.uicc.org/new-global-cancer-data-globocan-2018.
|
|
2
|
Bokhman JV: Two pathogenetic types of
endometrial carcinoma. Gynecol Oncol. 15:10–17. 1983. View Article : Google Scholar : PubMed/NCBI
|
|
3
|
Creasman W: Revised FIGO staging for
carcinoma of the endometrium. Int J Gynecol Obstet. 105:1092009.
View Article : Google Scholar
|
|
4
|
Creasman WT, Odicino F, Maisonneuve P,
Quinn MA, Beller U, Benedet JL, Heintz AP, Ngan HY and Pecorelli S:
Carcinoma of the corpus uteri. FIGO 26th Annual report on the
results of treatment in gynecological cancer. Int J Gynecol Obstet.
95 (Suppl 1):S105–S143. 2006. View Article : Google Scholar
|
|
5
|
Morice P, Leary A, Creutzberg C,
Abu-Rustum N and Darai E: Endometrial cancer. Lancet.
387:1094–1108. 2016. View Article : Google Scholar : PubMed/NCBI
|
|
6
|
Siegel RL, Miller KD and Jemal A: Cancer
statistics. CA Cancer J Clin. 68:7–30. 2018. View Article : Google Scholar : PubMed/NCBI
|
|
7
|
Kitchener HC and Trimble EL; Endometrial
Cancer Working Group of the Gynecologic Cancer Intergroup, :
Endometrial cancer state of the science meeting. Int J Gynecol
Cancer. 19:134–140. 2009. View Article : Google Scholar : PubMed/NCBI
|
|
8
|
DeSantis CE, Siegel RL, Sauer AG, Miller
KD, Fedewa SA, Alcaraz KI and Jemal A: Cancer statistics for
African Americans, 2016: Progress and opportunities in reducing
racial disparities. CA Cancer J Clin. 66:290–308. 2016. View Article : Google Scholar : PubMed/NCBI
|
|
9
|
Lheureux S, Wilson M and Mackay HJ: Recent
and current Phase II clinical trials in endometrial cancer: Review
of the state of art. Expert Opin Investig Drugs. 23:773–792. 2014.
View Article : Google Scholar : PubMed/NCBI
|
|
10
|
Miller KD, Siegel RL, Lin CC, Mariotto AB,
Kramer JL, Rowland JH, Stein KD, Alteri R and Jemal A: Cancer
treatment and survivorship statistics, 2016. CA Cancer J Clin.
66:271–289. 2016. View Article : Google Scholar : PubMed/NCBI
|
|
11
|
Xu Y, Burmeister C, Hanna RK, Munkarah A
and Elshaikh MA: Predictors of survival after recurrence in women
with early-stage endometrial carcinoma. Int J Gynecol Cancer.
26:1137–1142. 2016. View Article : Google Scholar : PubMed/NCBI
|
|
12
|
Connor EV and Rose PG: Management
strategies for recurrent endometrial cancer. Expert Rev Anticancer
Ther. 18:873–885. 2018. View Article : Google Scholar : PubMed/NCBI
|
|
13
|
Jongen V, Briët J, de Jong R, ten Hoor K,
Boezen M, van der Zee A, Nijman H and Hollema H: Expression of
estrogen receptor-alpha and -beta and progesterone receptor-A and
-B in a large cohort of patients with endometrioid endometrial
cancer. Gynecol Oncol. 112:537–542. 2009. View Article : Google Scholar : PubMed/NCBI
|
|
14
|
Werner HM and Salvesen HB: Current status
of molecular biomarkers in endometrial cancer. Curr Oncol Rep.
16:4032014. View Article : Google Scholar : PubMed/NCBI
|
|
15
|
Catasus L, D'Angelo E, Pons C, Espinosa I
and Prat J: Expression profiling of 22 genes involved in the
PI3K-AKT pathway identifies two subgroups of high-grade endometrial
carcinomas with different molecular alterations. Mod Pathol.
23:694–702. 2010. View Article : Google Scholar : PubMed/NCBI
|
|
16
|
O'Mara TA, Zhao M and Spurdle AB:
Meta-analysis of gene expression studies in endometrial cancer
identifies gene expression profiles associated with aggressive
disease and patient outcome. Sci Rep. 6:366772016. View Article : Google Scholar : PubMed/NCBI
|
|
17
|
Sun Y, Zou X, He J and Mao Y:
Identification of long non-coding RNAs biomarkers associated with
progression of endometrial carcinoma and patient outcomes.
Oncotarget. 8:52604–52613. 2016. View Article : Google Scholar
|
|
18
|
Cancer Genome Atlas Research Network, .
Kandoth C, Schultz N, Cherniack AD, Akbani R, Liu Y, Shen H,
Robertson AG, Pashtan I, Shen R, et al: Integrated genomic
characterization of endometrial carcinoma. Nature. 497:67–73. 2013.
View Article : Google Scholar : PubMed/NCBI
|
|
19
|
Bauer-Mehren A, Rautschka M, Sanz F and
Furlong LI: DisGeNET: A Cytoscape plugin to visualize, integrate,
search and analyze gene-disease networks. Bioinformatics.
26:2924–2926. 2010. View Article : Google Scholar : PubMed/NCBI
|
|
20
|
Piñero J, Queralt-Rosinach N, Bravo À,
Deu-Pons J, Bauer-Mehren A, Baron M, Sanz F and Furlong LI:
DisGeNET: A discovery platform for the dynamical exploration of
human diseases and their genes. Database (Oxford). 2015:bav0282015.
View Article : Google Scholar : PubMed/NCBI
|
|
21
|
Bodenreider O: The Unified Medical
Language System (UMLS): Integrating biomedical terminology. Nucleic
Acids Res. 32((Database Issue)): D267–D270. 2004. View Article : Google Scholar : PubMed/NCBI
|
|
22
|
Day RS, McDade KK, Chandran UR, Lisovich
A, Conrads TP, Hood BL, Kolli VS, Kirchner D, Litzi T and Maxwell
GL: Identifier mapping performance for integrating transcriptomics
and proteomics experimental results. BMC Bioinformatics.
12:2132011. View Article : Google Scholar : PubMed/NCBI
|
|
23
|
Chen J, Bardes EE, Aronow BJ and Jegga AG:
ToppGene Suite for gene list enrichment analysis and candidate gene
prioritization. Nucleic Acids Res. 37:(Web Server issue).
W305–W311. 2009. View Article : Google Scholar : PubMed/NCBI
|
|
24
|
Chin CH, Chen SH, Wu HH, Ho CW, Ko MT and
Lin CY: CytoHubba: Identifying hub objects and sub-networks from
complex interactome. BMC Syst Biol. 8 (Suppl 4):S112014. View Article : Google Scholar : PubMed/NCBI
|
|
25
|
Colas E, Perez C, Cabrera S, Pedrola N,
Monge M, Castellvi J, Eyzaguirre F, Gregorio J, Ruiz A, Llaurado M,
et al: Molecular markers of endometrial carcinoma detected in
uterine aspirates. Int J Cancer. 129:2435–2444. 2011. View Article : Google Scholar : PubMed/NCBI
|
|
26
|
Monge M, Colas E, Doll A, Gonzalez M,
Gil-Moreno A, Planaguma J, Quiles M, Arbos MA, Garcia A, Castellvi
J, et al: ERM/ETV5 up-regulation plays a role during myometrial
infiltration through matrix metalloproteinase-2 activation in
endometrial cancer. Cancer Res. 67:6753–6759. 2007. View Article : Google Scholar : PubMed/NCBI
|
|
27
|
Altadill T, Dowdy TM, Gill K, Reques A,
Menon SS, Moiola CP, Lopez-Gil C, Coll E, Matias-Guiu X, Cabrera S,
et al: Metabolomic and lipidomic profiling identifies the role of
the RNA editing pathway in endometrial carcinogenesis. Sci Rep.
7:88032017. View Article : Google Scholar : PubMed/NCBI
|
|
28
|
Lapyckyj L, Castillo LF, Matos ML,
Gabrielli NM, Lüthy IA and Vazquez-Levin MH: Expression analysis of
epithelial cadherin and related proteins in IBH-6 and IBH-4 human
breast cancer cell lines. J Cell Physiol. 222:596–605.
2010.PubMed/NCBI
|
|
29
|
Livak KJ and Schmittgen TD: Analysis of
relative gene expression data using real-time quantitative PCR and
the 2(-Delta Delta C(T)) method. Methods. 25:402–408. 2001.
View Article : Google Scholar : PubMed/NCBI
|
|
30
|
Budczies J, Klauschen F, Sinn BV, Győrffy
B, Schmitt WD, Darb-Esfahani S and Denkert C: Cutoff Finder: A
comprehensive and straight forward Web application enabling rapid
biomarker cut off optimization. PLoS One. 7:e518622012. View Article : Google Scholar : PubMed/NCBI
|
|
31
|
Yen MS, Chen TH, Ke YM, Hsu KF, Chen JR,
Yu MH, Fu HC, Huang CY, Chiang AJ, Chen CY, et al:
Clinicopathologic features and treatment outcomes in patients with
stage I, high-risk histology or high-grade endometrial cancer after
primary staging surgery: A Taiwanese Gynecologic Oncology group
study. J Clin Med. 7:2542018. View Article : Google Scholar
|
|
32
|
Colombo N, Preti E, Landoni F, Carinelli
S, Colombo A, Marini C and Sessa C; ESMO Guidelines Working Group,
: Endometrial cancer: ESMO Clinical Practice Guidelines for
diagnosis, treatment and follow-up. Ann Oncol. 22 (Suppl
6):vi35–vi39. 2011. View Article : Google Scholar : PubMed/NCBI
|
|
33
|
Frumovitz M, Singh D, Meyer L, Smith DH,
Wertheim I, Resnik E and Bodurka DC: Predictors of final histology
in patients with endometrial cancer. Gynecol Oncol. 95:463–468.
2004. View Article : Google Scholar : PubMed/NCBI
|
|
34
|
Neubauer NL, Havrilesky LJ, Calingaert B,
Bulusu A, Bernardini MQ, Fleming ND, Bland AE and Secord AA: The
role of lymphadenectomy in the management of preoperative grade 1
endometrial carcinoma. Gynecol Oncol. 112:511–516. 2009. View Article : Google Scholar : PubMed/NCBI
|
|
35
|
Body N, Lavoué V, De Kerdaniel O, Foucher
F, Henno S, Cauchois A, Laviolle B, Leblanc M and Levêque J: Are
preoperative histology and MRI useful for classification of
endometrial cancer risk? BMC Cancer. 16:4982016. View Article : Google Scholar : PubMed/NCBI
|
|
36
|
Rounbehler RJ, Berglund AE, Gerke T,
Takhar MM, Awasthi S, Li W, Davicioni E, Erho NG, Ross AE,
Schaeffer EM, et al: Tristetraprolin is a prognostic biomarker for
poor outcomes among patients with low-grade prostate cancer. Cancer
Epidemiol Biomarkers Prev. 27:1376–1383. 2018. View Article : Google Scholar : PubMed/NCBI
|
|
37
|
Chen XH, Zhang WW, Wang J, Sun JY, Li FY,
He ZY and Wu SG: 21-gene recurrence score and adjuvant chemotherapy
decisions in patients with invasive lobular breast cancer. Biomark
Med. 13:83–93. 2019. View Article : Google Scholar : PubMed/NCBI
|
|
38
|
Abascal MF, Besso MJ, Rosso M, Mencucci
MV, Aparicio E, Szapiro G, Furlong LI and Vazquez-Levin MH:
CDH1/E-cadherin and solid tumors. An updated gene-disease
association analysis using bioinformatics tools. Comput Biol Chem.
60:9–20. 2016. View Article : Google Scholar : PubMed/NCBI
|
|
39
|
Dalleau K, Marzougui Y, Da Silva S, Ringot
P, Ndiaye NC and Coulet A: Learning from biomedical linked data to
suggest valid pharmacogenes. J Biomed Semantics. 8:162017.
View Article : Google Scholar : PubMed/NCBI
|
|
40
|
Eguchi R, Karim MB, Hu P, Sato T, Ono N,
Kanaya S and Altaf-Ul-Amin M: An integrative network-based approach
to identify novel disease genes and pathways: A case study in the
context of inflammatory bowel disease. BMC Bioinformatics.
19:2642018. View Article : Google Scholar : PubMed/NCBI
|
|
41
|
Gomez-Rubio P, Piñero J, Molina-Montes E,
Gutiérrez-Sacristán A, Marquez M, Rava M, Michalski CW, Farré A,
Molero X, Löhr M, et al: Pancreatic cancer and autoimmune diseases:
An association sustained by computational and epidemiological
case-control approaches. Int J Cancer. 144:1540–1549. 2019.
View Article : Google Scholar : PubMed/NCBI
|
|
42
|
Santiago JA and Potashkin JA: System-based
approaches to decode the molecular links in Parkinson's disease and
diabetes. Neurobiol Dis. 72:84–91. 2014. View Article : Google Scholar : PubMed/NCBI
|
|
43
|
Zang Y, Dong M, Zhang K, Tian W, Wang Y
and Xue F: Bioinformatics analysis of key differentially expressed
genes in well and poorly differentiated endometrial carcinoma. Mol
Med Rep. 18:467–476. 2018.PubMed/NCBI
|
|
44
|
Lin G, Yin G, Yan Y and Lin B:
Identification of prognostic biomarkers for malignant melanoma
using microarray datasets. Oncol Lett. 18:5243–5254.
2019.PubMed/NCBI
|
|
45
|
Liu J, Yu Z, Sun M, Liu Q, Wei M and Gao
H: Identification of cancer/testis antigen 2 gene as a potential
hepatocellular carcinoma therapeutic target by hub gene screening
with topological analysis. Oncol Lett. 18:4778–4788.
2019.PubMed/NCBI
|
|
46
|
Shi J, Zhang P, Liu L, Min X and Xiao Y:
Weighted gene coexpression network analysis identifies a new
biomarker of CENPF for prediction disease prognosis and progression
in nonmuscle invasive bladder cancer. Mol Genet Genomic Med.
7:e9822019. View Article : Google Scholar : PubMed/NCBI
|
|
47
|
Zhang B, Wu Q, Xu R, Hu X, Sun Y, Wang Q,
Ju F, Ren S, Zhang C, Qi F, et al: The promising novel biomarkers
and candidate small molecule drugs in lower-grade glioma: Evidence
from bioinformatics analysis of high-throughput data. J Cell
Biochem. 120:15106–15118. 2019. View Article : Google Scholar : PubMed/NCBI
|
|
48
|
Zhou M, Zhu Y, Hou R, Mou X and Tan J:
Identification of candidate genes for the diagnosis and treatment
of cholangiocarcinoma using a bioinformatics approach. Oncol Lett.
18:5459–5467. 2019.PubMed/NCBI
|
|
49
|
Callaway DS, Newman ME, Strogatz SH and
Watts DJ: Network robustness and fragility: Percolation on random
graphs. Phys Rev Lett. 85:5468–5471. 2000. View Article : Google Scholar : PubMed/NCBI
|
|
50
|
Cohen R, Erez K, ben-Avraham D and Havlin
S: Resilience of the internet to random breakdowns. Phys Rev Lett.
85:4626–4628. 2000. View Article : Google Scholar : PubMed/NCBI
|
|
51
|
Planagumà J, Abal M, Gil-Moreno A,
Díaz-Fuertes M, Monge M, García A, Baró T, Xercavins J, Reventós J
and Alameda F: Up-regulation of ERM/ETV5 correlates with the degree
of myometrial infiltration in endometrioid endometrial carcinoma. J
Pathol. 207:422–429. 2005. View Article : Google Scholar : PubMed/NCBI
|
|
52
|
Colas E, Muinelo-Romay L, Alonso-Alconada
L, Llaurado M, Monge M, Barbazan J, Gonzalez M, Schoumacher M,
Pedrola N, Ertekin T, et al: ETV5 cooperates with LPP as a sensor
of extracellular signals and promotes EMT in endometrial
carcinomas. Oncogene. 31:4778–4788. 2012. View Article : Google Scholar : PubMed/NCBI
|
|
53
|
Fu J, Bian M, Xin G, Deng Z, Luo J, Guo X,
Chen H, Wang Y, Jiang Q and Zhang C: TPX2 phosphorylation maintains
metaphase spindle length by regulating microtubule flux. J Cell
Biol. 210:373–383. 2015. View Article : Google Scholar : PubMed/NCBI
|
|
54
|
Shim SY, Perez de Castro I, Neumayer G,
Wang J, Park SK, Sanada K and Nguyen MD: Phosphorylation of
targeting protein for Xenopus kinesin-like protein 2 (TPX2) at
threonine 72 in spindle assembly. J Biol Chem. 290:9122–9134. 2015.
View Article : Google Scholar : PubMed/NCBI
|
|
55
|
Asteriti IA, Rensen WM, Lindon C, Lavia P
and Guarguaglini G: The Aurora-A/TPX2 complex: A novel oncogenic
holoenzyme? Biochim Biophys Acta. 1806:230–239. 2010.PubMed/NCBI
|
|
56
|
Neumayer G, Belzil C, Gruss OJ and Nguyen
MD: TPX2: Of spindle assembly, DNA damage response, and cancer.
Cell Mol Life Sci. 71:3027–3047. 2014. View Article : Google Scholar : PubMed/NCBI
|
|
57
|
Shen L, Liu M, Liu W, Cui J and Li C:
Bioinformatics analysis of RNA sequencing data reveals multiple key
genes in uterine corpus endometrial carcinoma. Oncol Lett.
15:205–212. 2018.PubMed/NCBI
|
|
58
|
Liu Y, Hua T, Chi S and Wang H:
Identification of key pathways and genes in endometrial cancer
using bioinformatics analyses. Oncol Lett. 17:897–906.
2019.PubMed/NCBI
|
|
59
|
Jiang T, Sui D, You D, Yao S, Zhang L,
Wang Y, Zhao J and Zhang Y: MiR-29a-5p inhibits proliferation and
invasion and induces apoptosis in endometrial carcinoma via
targeting TPX2. Cell Cycle. 17:1268–1278. 2018. View Article : Google Scholar : PubMed/NCBI
|
|
60
|
Zhang K, Li H, Yan Y, Zang Y, Li K, Wang Y
and Xue F: Identification of key genes and pathways between type I
and type II endometrial cancer using bioinformatics analysis. Oncol
Lett. 18:2464–2476. 2019.PubMed/NCBI
|
|
61
|
Menche J, Sharma A, Kitsak M, Ghiassian
SD, Vidal M, Loscalzo J and Barabási AL: Disease networks.
Uncovering disease-disease relationships through the incomplete
interactome. Science. 347:12576012015. View Article : Google Scholar : PubMed/NCBI
|