Introduction
Breast cancer liver metastasis (BCLM) is the most
common metastatic event associated with breast cancer, with a
median overall survival rate of 4.8-9.2 months and a 5-year
survival rate of 23% (1,2). Nearly 40–50% of women with metastatic
breast cancer (MBC) are diagnosed with liver metastasis (3). Current treatments for BCLM include
systemic therapy such as endocrine therapy, targeted therapy,
chemotherapy, and local therapy such as radioembolization,
chemoembolization, microwave ablation and stereotactic body
radiotherapy (4–6). Despite routine comprehensive
treatments, BCLM is still incurable and carries a poor prognosis,
especially for patients who exhibit poor response to chemotherapy
or who have estrogen receptor (ER)-negative disease. Therefore,
accurate diagnosis of BCLM is considerably important for improving
the prognosis of BCLM. In addition, the ability to distinguish
between newly diagnosed and recurrent BCLM has significant
diagnostic and prognostic value (7,8).
Current diagnostic methods for BCLM are mostly based on abnormal
liver function tests, imaging examination such as ultrasound,
computed tomography (CT), and magnetic resonance imaging (MRI).
These methods have limitations in distinguishing between newly
diagnosed and recurrent BCLM, as recurrent metastatic foci have
distinct morphology and a large number of genomic alterations,
neither of which are detected by the above diagnostic methods. To
ensure early site-specific BCLM detection as well as distinguish
between newly diagnosed and recurrent BCLM, metastatic niche cells
must be characterized by alterations in gene expression (9), deposition of tissue homeostasis
(10,11), and infiltration of numerous immune
cell populations (12,13).
Genome sequencing-based molecular analysis has
proven to be a strong approach for the diagnosis of heterogeneous
monogenetic BCLM, with the ability to characterize copy number
variations (CNVs), loss of heterozygosity, and analyze somatic
mutations (14–16). Profiling of CNVs has been an
accretive and reliable analytical tool in distinguishing between
newly diagnosed and recurrent metastases and uses an ultra-low
input of blood- or tissue-derived DNA (15). In comparison with traditional BCLM
detection methods, measuring genome-wide CNVs is a more sensitive
and cost-effective analytical method that detects the CNV profile
without depleting the sample resource (5,17).
Furthermore, this type of molecular analysis has been proven to be
a prospective approach for the clinical diagnosis of other
heterogeneous monogenetic types of MBC, and is a step toward
genetic counseling and potential gene replacement therapy (5,18).
It is well established that enumeration and
monitoring of circulating tumor cells (CTCs) are useful for the
diagnosis and prognostic prediction of many cancer types, such as
breast (19–21), prostate (22), and lung cancer (23). CTCs are routinely detectable in the
blood stream of cancer patients with both early and late stage
cancer (20). Although the analysis
of CTCs requires significant technical skill, laboratory resources,
and instrumentation, it is an assay that is frequently established
in specialized medical centers. Notably, the genome-wide copy
number analysis of CTCs provides a promising diagnostic and
prognostic biomarker for survival in metastatic patients. The
molecular characterization and monitoring of CTCs by utilizing
high-sensitivity and high-throughput technologies guarantees a
promising platform for capturing and determining the organotropism
of metastatic niche cells (20).
Many recent studies have attempted to determine
whether genome-wide CNVs of CTCs may be a diagnostic and prognostic
factor for survival in breast cancer patients (20,21,24).
However, studies on the clinical efficiency of whole genome
sequencing (WGS) for profiling CNVs are often challenging and their
findings, contentious. In addition, only a few investigations have
proposed that CNVs of CTCs can help to distinguish between newly
diagnosed and recurrent metastases (25).
Here, for the first time, we conducted a prospective
clinical investigation to confirm the diagnostic value of
genome-wide CNVs in BCLM. We compared the consistency and
efficiency of genome-wide CNVs with other comment methods used for
the detection of BCLM. Furthermore, we developed a higher
efficiency WGS technique using CNV profiling to distinguish between
newly diagnosed and recurrent BCLM. This may provide a potentially
valuable approach for the genetic characterization of BCLM.
Materials and methods
Patient population and clinical
assessment
All patients with invasive ductal carcinoma of the
breast were preliminarily selected for this prospective study at
the Affiliated Hospital of Southwest Medical University, Luzhou,
Sichuan from March 2019 to December 2019. Totally 43 patients were
selected according to the inclusion criteria and subdivided. The
mean age of the patients was 49.87 years (range, 39–57 years). The
patients were suspected to have newly diagnosed or postoperative
recurrent liver metastasis as assessed by
fluorine-18-fluorodeoxyglucose positron emission
tomography/computed tomography (18F-FDG PET/CT) imaging.
The breast tumors were reviewed and liver metastases were confirmed
by two expert pathologists (ZeL and LG). The patients were excluded
if the liver nodules were benign lesions, primary liver tumors, or
metastases of other organs besides the breast. Next, the
demographic information and detailed history of the included
patients were documented according to an interviewer-administered
questionnaire. Laboratory tests including blood routine, liver
function tests [aspartate aminotransferase (AST), alanine
aminotransferase (ALT), alkaline phosphatase (ALP), prothrombin
time (PT), albumin, and bilirubin] and a 18F-FDG PET/CT
were performed. All participants received different systematic and
local therapies at the Department of Oncology, The Affiliated
Hospital of Southwest Medical University (Luzhou, Sichuan).
Study design
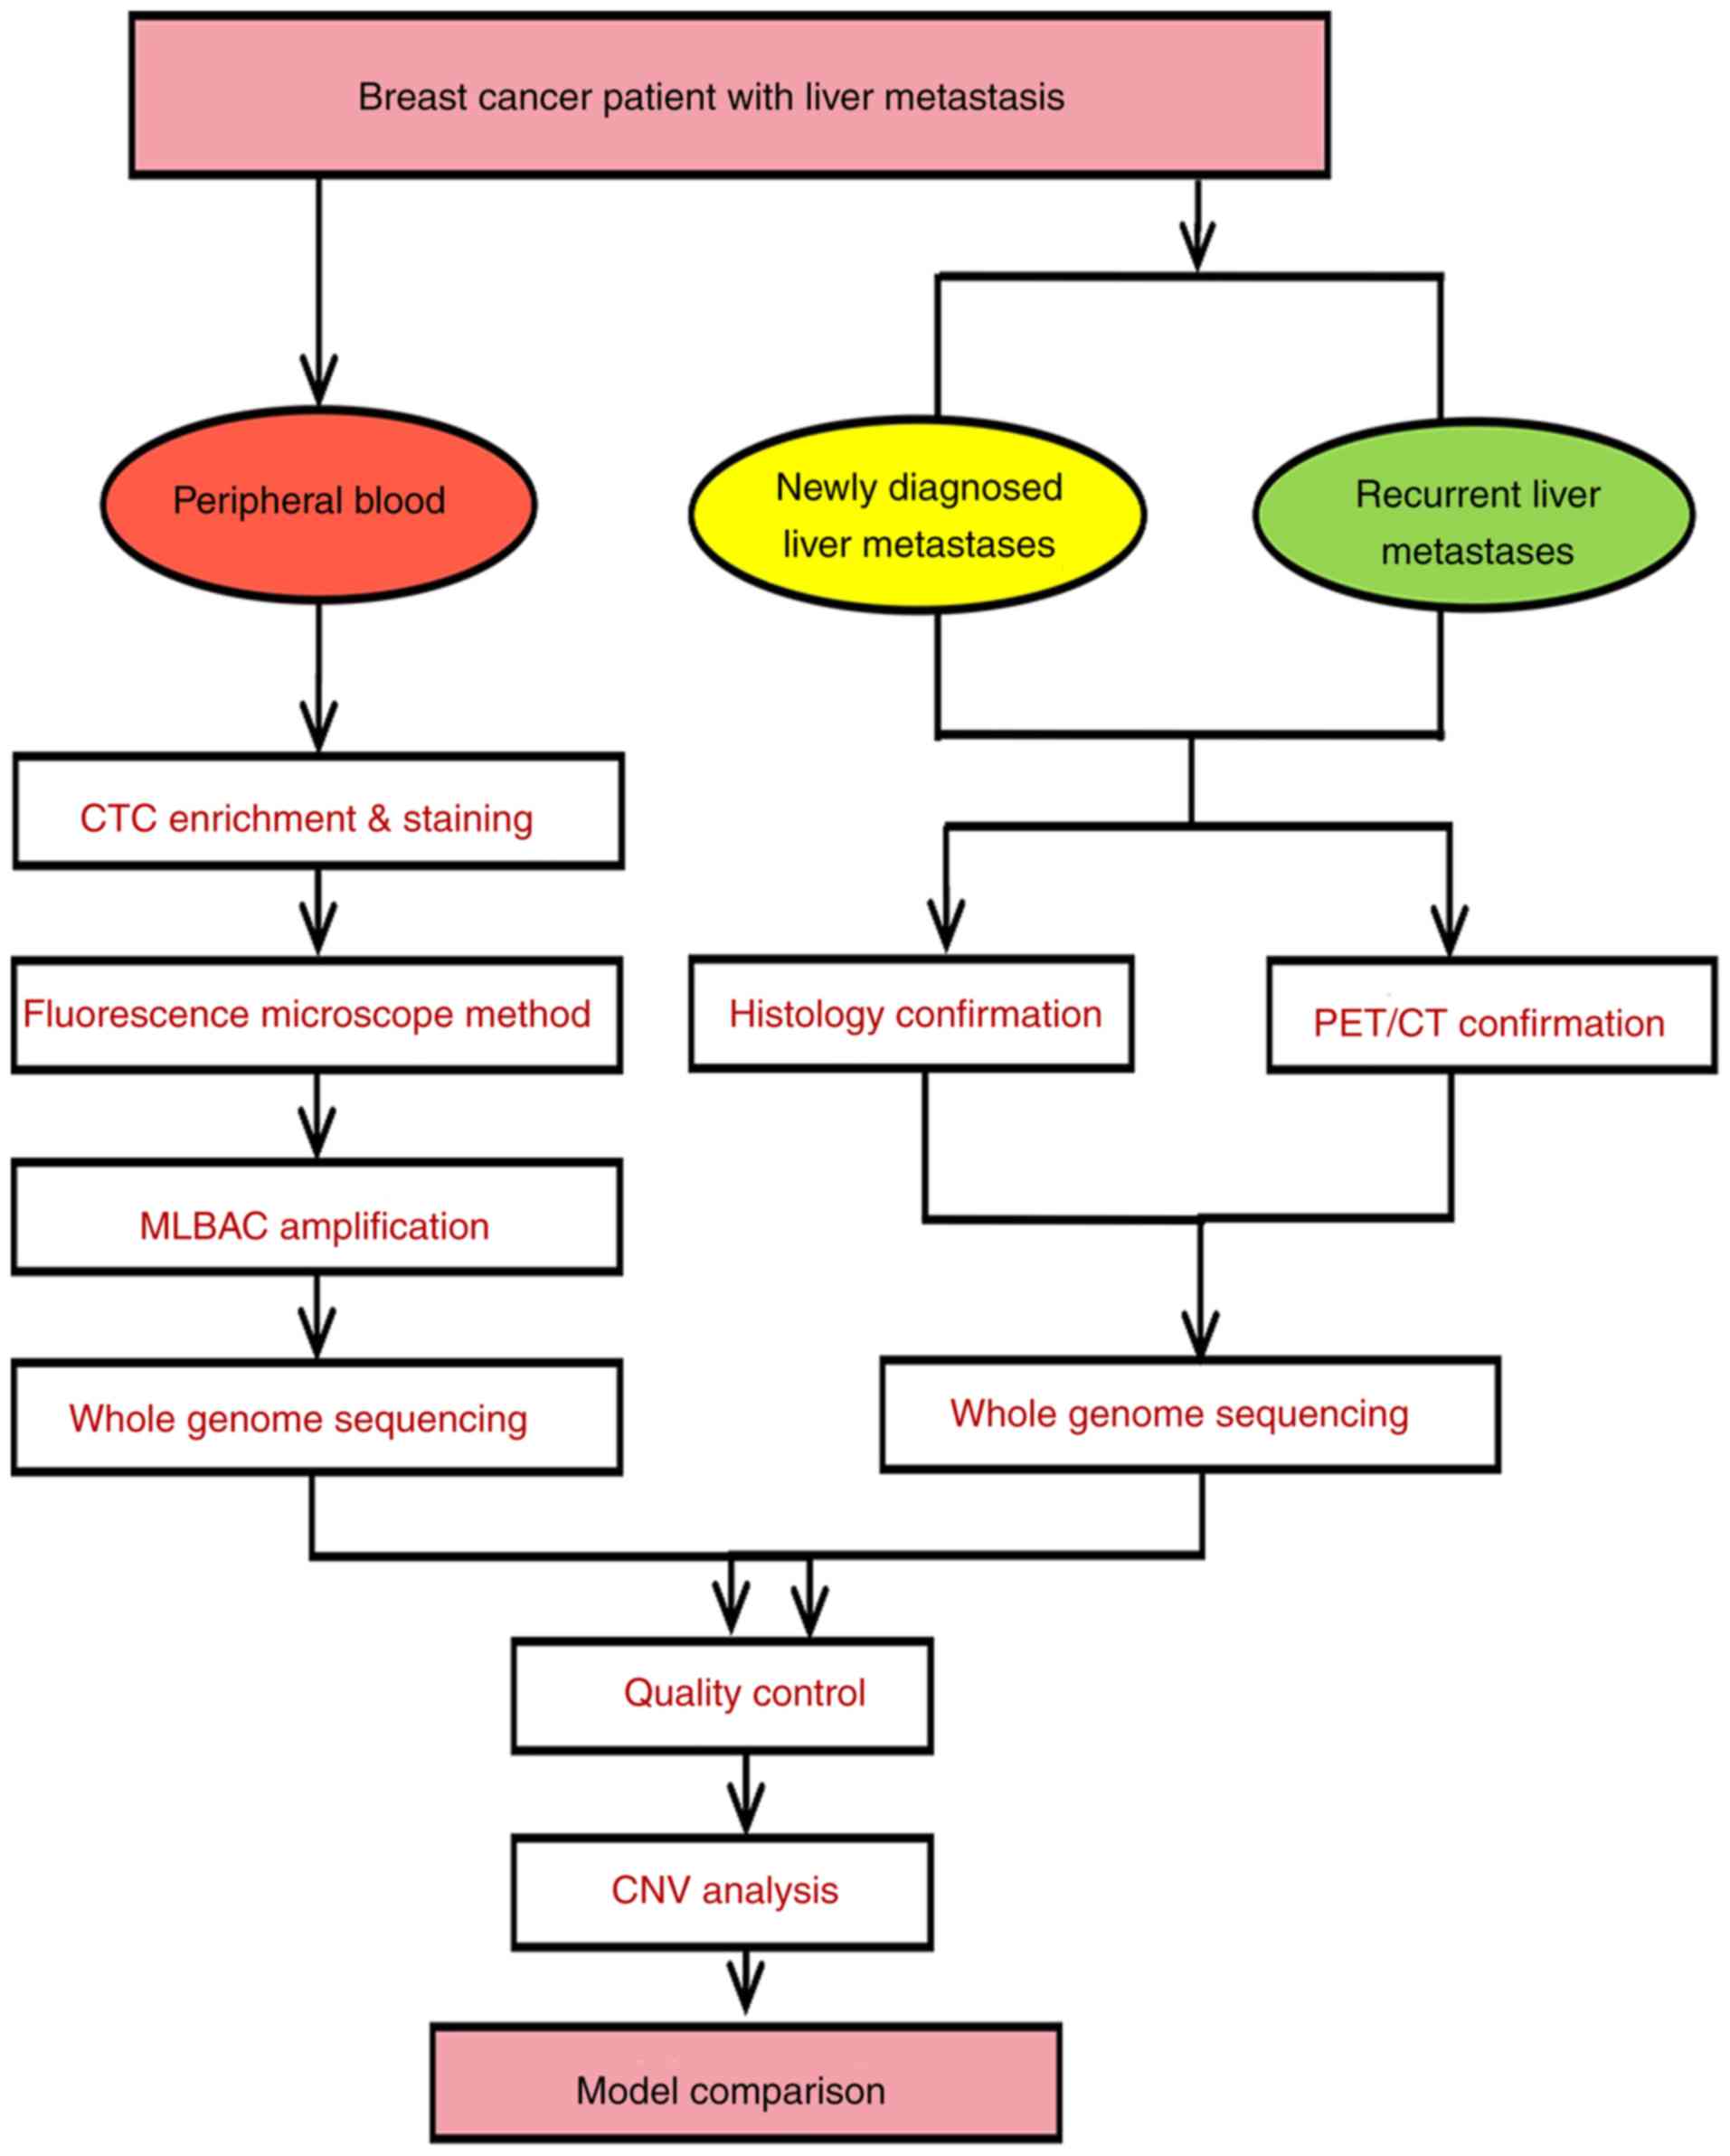
Fig. 1 shows the
present study model in detail. Firstly, a suspected malignant liver
nodule was identified by 18F-FDG PET/CT scan in all
patients, which was then confirmed by pathology within a week.
Next, CTCs from each selected BCLM patient were captured with the
CellSearch platform using antibody enrichment, and were further
isolated under a fluorescence microscope with 94% specificity.
Then, genomic DNA (gDNA) of single a CTC was amplified using the
multiple annealing and looping based amplification cycle (MALBAC)
method. WGS was planned for CTCs as well as newly diagnosed or
recurrent liver metastases samples from each CTC positive patient.
Furthermore, we analyzed genome-wide CNVs in these cases to
introduce the major genomic variations that are specific to and
reproducible in BCLM. Finally, noninvasive CTC-based BCLM
diagnostics were compared with 18F-FDG PET/CT and
histological findings.
Sample preparation
All tissue samples were fixed and embedded in Tissue
Tek II OCT (Miles Scientific), frozen 15 min in isopentane,
precooled in liquid nitrogen, and then stored at −80°C for future
pathology assays. Next, the best frozen sample was oriented and cut
as 5-µm-thick cryostat sections for hematoxylin and eosin (H&E)
analysis and histological conformation. Microscopic analysis of all
slides was performed using light microscopy (Olympus Corp.) linked
to a computerized imaging system (Image-Pro Plus V6.0; Media
Cybernetics, Inc.). The cases were coded and measurements were made
in a blinded manner by two expert pathologists (LiZ and SI).
Subsequently, from each patient, 7.5 ml fresh blood was collected
in a Cell Save blood collection tube (Immunicon Inc.) and stored at
15–20°C for CTC enumeration within 3 days after collection and 10
ml was collected for gDNA extraction. The gDNA was extracted from
fresh peripheral blood leukocytes, using the Qiagen DNA extraction
kit (Qiagen). Primary tumor and liver metastasis tissues were
obtained by standard core needle methods.
18F-FDG PET/CT imaging
18F-FDG PET/CT imaging was provided by
the Department of Nuclear Medicine, The Affiliated Hospital of
Southwest Medical University, Luzhou, Sichuan, China. Before
scanning, all patients had fasted for at least 6 h and their blood
glucose levels were measured to be within the normal range prior to
intravenous injection of 370 MBq of 18F-FDG. The PET/CT
parameters were 120 KV, 80 mAs, 3 min/bed, 0.813 pitch, and a 3.8
mm reconstruction of layer thickness. Immediately after CT
scanning, a PET emission scan that covered the identical transverse
field of view was acquired in 3-min acquisition time per bed
position. Data were reconstructed using an iterative reconstruction
technique and attenuation correction derived from the CT data. The
CT, PET and fused PET/CT images were transmitted to an Extended
Brilliance Philips workstation version 4.1 (Philips Healthcare).
The PET images were evaluated qualitatively for regions of focally
increased metabolism. An appreciably increased uptake level in
comparison to surrounding tissue was considered as malignant
lesions. Semi-quantitative analysis using the standardized uptake
value (SUV) and the mean ± SD of maximum-pixel SUV (SUVmax) of the
lesions was calculated. All the PET/CT scans were evaluated by the
unit of nuclear radiologists and two nuclear radiologists (SI and
QW).
CTC isolation and capture
CTCs from 7.5 ml blood sample were captured with the
CellSearch Circulating Tumor Cell Kit (cat. no. K062013; Veridex,
LLC) for 1 h at room temperature. This kit is a high-throughput
isolation kit that is mostly used for enumeration and isolation of
CTCs using magnetic beads conjugated to anti-epithelial cell
adhesion molecule (EpCAM) antibodies (26,27).
EpCAM-positive cells were immediately isolated using a magnetic
field. To distinguish cancer cells from leukocytes, 1 ml PBS and
isolated CTCs were stained with 10 µl DAPI for 15 min in the dark,
200 µl anti-CK-8 (8)-phycoerythrin
antibodies for 30 min and 20 µl anti-CD45-allophycocyanin
antibodies for 60 min. The cancer cells stained DAPI+,
anti-CD45−, and CK-8+, while leukocytes
stained DAPI+, anti-CD45+, and
anti-CK-8−. Following immunostaining, the enriched CTCs
were re-suspended with PBS and were then manually counted under a
fluorescence microscope (10× lens, Axio Imager A2; Carl Zeiss). We
obtained full coverage of all the stained CTCs using micropipetting
within 5 min. For high-ratio CTC enumeration, UV-exposed water was
used to wash the isolated single CTCs repeatedly to minimize DNA
contamination. The isolated single CTCs were used for further
genome amplification. The identification of all CTCs was performed
by an expert pathologist who is specialized in the pathological
diagnosis of metastasis (LiZ, SI and QW).
Whole genome amplification of single
CTCs
Whole genome amplification (WGA) of an isolated
single CTC was performed using MALBAC Single Cell Whole genome
amplification Kit (cat. no. YK001A; Yikon Genomics, Inc.). The
amplified DNA was purified by the DNA clean-up kit (cat. no.
CW2301; CWbio) and the fragment size generated by WGA was between
300–2,000 bp, as determined by gel electrophoresis. Quantitative
PCR (qPCR) was performed on seven randomly selected loci in the
genome to check the integrity of amplification. All seven loci were
amplified with reasonable Ct number and a deep average ‘unique
mapped of raw’. The 10× WGS analyses were performed in CTC
specimens of newly diagnosed BCLM patients with a high CTCs and
also in CTC specimens of recurrent BCLM patients with low CTCs.
CTCs were regularly amplified with an average amplified gDNA of 900
ng/cell. Then, we applied 30× WGS sequencing of liver metastases to
both newly diagnosed and recurrent BCLM.
Whole genome library preparation and
sequencing
The design of whole genome library and sequencing
were detected using Illumina paired-end libraries (Illumina, Inc.)
methods as previously described (28). Briefly, 900 ng to 1 µg of extracted
DNA from the amplification products of CTCs by MALBAC or from tumor
tissues was sheared into fragments of approximately 300 bp using a
Covaris E220 system (Covaris Inc.). The adaptor-ligated DNA was
prepared, and enrichment q;PCR was performed on an aliquot of
adaptor-ligated DNA to complete the adaptor for Illumina PE
sequencing. A total of 600 ng of pooled-DNA from four barcoded
libraries was used for hybridization and post-hybridization
amplification following the manufacturer's protocol (SureSelectXT
Target Enrichment System for Illumina Paired-End Sequencing
Library; Illumina, Inc.). Then, the result of the PCR amplification
of single CTCs were quality checked and WGS was performed with the
Illumina HiSeq 2000 (Illumina, Inc.). to achieve an average of ~10×
and ~30× coverage depth, respectively.
Genomic CNVs and gene set enrichment
analysis (GSEA)
Here, we used the standard probe to determine
genomic CNVs in single CTCs that was established by Zong et
al (29). In brief, paired-end
sequencing reads of each CTC and tumor sample were aligned with the
human hg19 reference genome using Burrows-Wheeler Aligner v0.6.1
(30) and the available public
online University of Santa Cruz (UCSC) database (http://genome.ucsc.edu/) (30). The Firehose pipeline (level 4) was
used to manage input and output files and submit analyses for
execution (31). Genome-wide
detection of single-nucleotide and CNVs of a single human cell was
performed using ControlFreeC (32).
A binary array, which indicates whether a single cancer cell has
higher coverage than normal leukocytes, was taken as output in
Hidden Markov Models-based calling algorithms (HMMs) (33,34).
The copy number analysis was performed by applying data on the
Ginkgo dataset (http://qb.cshl.edu/ginkgo) and two R packages (HMM
copy and DNA copy), with hg19 as the reference genome. Enrichment
tests were conducted at the arm level to identify significantly
gained and lost chromosome arms. In addition, Gene Set Enrichment
Analysis (GSEA) was used for a functional assessment of the
recognized disease pathways among different CTC-shared CNVs
(35,36). Accordingly, we used pathway analyses
to find the potential biological functional assessment of
CTC-shared CNVs via R software (v3.3.1) (37,38).
Statistical analysis
According to the CellSearch machine-default,
patients with at least five CTCs/7.5 ml were considered
CTC-positive. In this study, comparison of group differences was
carried out with a one-way analysis of variance (ANOVA) test and
then Turkey multiple comparison post-hoc analysis. All statistical
analyses were performed using SPSS software v21.0 (IBM, Corp.). All
tests were repeated three times or more. Data are presented as
means ± standard deviation (SD) or median (range). A linear
regression analysis was carried out to determine independent
factors for the diagnosis of CTCs. For data not distributed
normally, comparisons between three groups were made using a
Kruskal-Wallis one-way analysis of variance, followed by a post-hoc
Dunn's test. For all tests, two-sided P-values and adjusted
P-values of <0.05 were considered statistically significant. All
charts were designed using GraphPad Prism v5.0 (GraphPad Software,
Inc.).
Results
Demographic and clinicopathological
findings
The demographics and clinicopathological
characteristics of the 43 selected patients are detailed in
Table I. After considering all
exclusion/inclusion criteria, 43 BCLM patients were included in
this study. As of now, there is no established cut-off value for a
prognostic number of CTCs in BCLM. During this study, we divided
our patients by their CTC counts as either lower than, equal to, or
higher than the median number of CTCs (5–15 CTCs/7.5 ml blood) to
determine any possible correlation with clinicopathological
features. Using these criteria, 60% (26 of 43 patients) of patients
were categorized as positive-CTCs (≥5 CTCs/7.5 ml blood) and 40%
(17 of 43 patients) of patients were categorized as negative-CTCs
(<5 CTCs/7.5 ml blood). Meanwhile, almost 46% (12 of 26
patients) of patients were categorized as high-CTCs (>15
CTCs/7.5 ml blood) and 54% (14 of 26 patients) of patients were
categorized as low-CTCs (≥15 CTCs/7.5 ml blood). Comparison of
patients with positive/negative CTCs and those with high/low CTCs
showed similar age, body mass index (BMI), disease duration, and
SUVmax of PET/CT scan. However, there were more patients with
low-CTCs than those with high-CTCs in both the newly diagnosed and
the recurrent metastasis groups (P=0.04). Histologically, more than
65% of all samples were hormone receptor positive, either ER- or
PR-positive (30 of 43 patients), and HER2-negative (26 of 43
patients). Metastases to the bone, lung, and brain were
sufficiently frequent for statistical analysis. Sites of
involvement in the 43 patients were: Liver + bone (12 patients),
liver + lung (21 patients), liver + lung + bone (3 patients), and
liver + lung + brain (2 patients). The calculated detection
efficiency of CTCs was >61% when 6–24 tumor cells were present
per 7.5 ml peripheral blood (26 of 43 patients), and there was a
100% success rate in the detection of histopathological variables
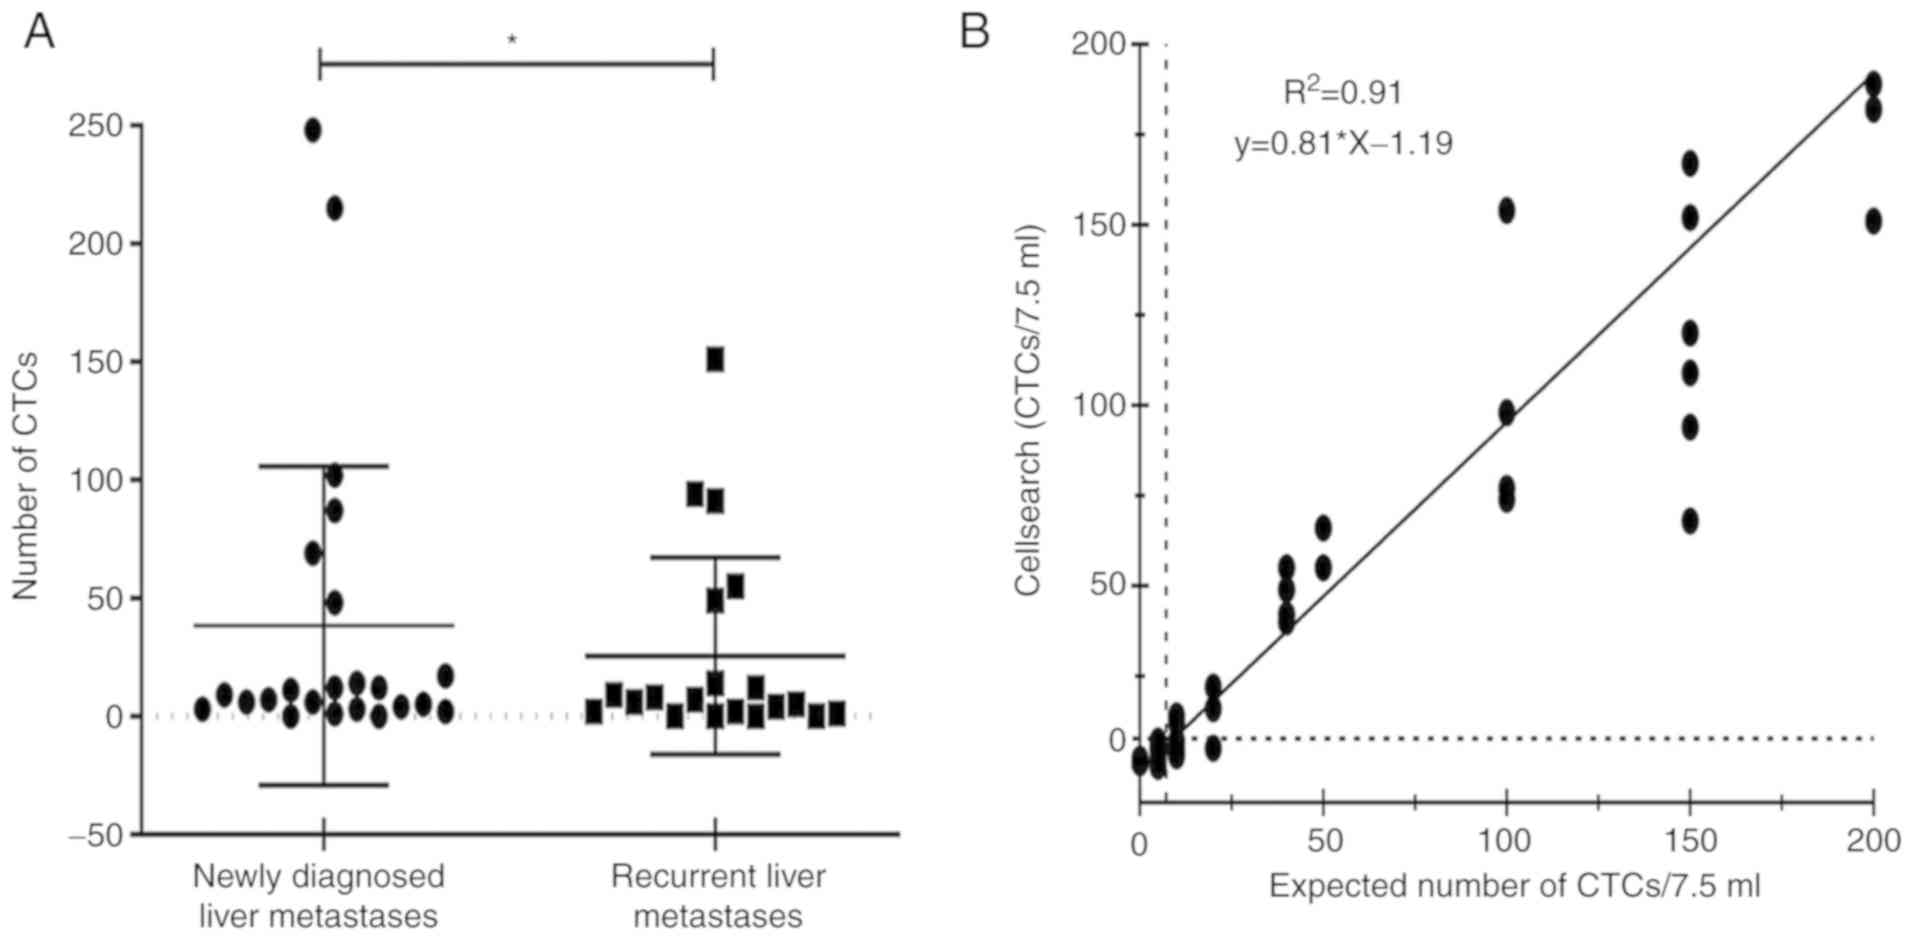
from captured tumor cells. In this study, the median CTCs was 32.35
per 7.5 ml (interquartile range 0–248). Interestingly, newly
diagnosed metastatic patients had a higher number of CTCs than
recurrent metastatic patients (Fig.
2A, mean CTC count 38.30 vs. 25.50; P=0.032).
 | Table I.Demographic and baseline
clinicopathological characteristics of the BCLM patients. |
Table I.
Demographic and baseline
clinicopathological characteristics of the BCLM patients.
|
| All patients
(N=43) | CTCs/7.5 ml of
blood |
|---|
|
|
|
|
|---|
| Variable | CTC-negative |
CTC-positivea |
P-valueb | Low-CTCs (≤5) | High CTCs
(>5) |
P-valuec |
|---|
| A, Demographic
variables |
|---|
|
|---|
| Subjects, n
(%) | 17 (39.5) | 26 (60.5) | 0.421 | 14 (53.9) | 12 (46.1) | 0.347 |
| Age (years) | 48.51±3.01 | 51.23±3.73 | 0.278 | 49.27±3.42 | 52.05±2.47 | 0.491 |
| BMI
(kg/m2) | 23.01±3.03 | 21.97±2.43 | 0.602 | 22.03±3.47 | 22.93±3.25 | 0.204 |
| Disease duration
(years) | 3.12±0.97 | 2.54±1.01 | 0.487 | 2.87±1.07 | 3.23±0.93 | 0.562 |
| PET/CT
(SUVmax) | 6.12±3.44 | 5.97±2.82 | 0.395 | 4.59±3.27 | 4.96±2.73 | 0.762 |
|
| B,
Histopathology variables, n (%) |
|
| Initial disease
stage |
|
|
|
|
| 0.041 |
| II | 3 (6.9) | 3 (6.9) | 0.382 | 2 (7.6) | 1 (3.8) |
|
|
III | 6 (13.9) | 8 (18.7) |
| 4 (15.4) | 4 (15.4) |
|
| IV | 8 (18.7) | 15 (34.9) |
| 8 (30.8) | 7 (27) |
|
| Invasive
ductal | 17 (39.5) | 26 (60.5) | – | 14 (32.6) | 12 (27.9) | – |
| ER status |
|
|
|
|
| 0.582 |
|
Negative | 6 (14) | 9 (20.9) | 0.071 | 3 (11.5) | 6 (23.1) |
|
|
Positive | 11 (25.6) | 17 (39.5) |
| 11 (42.3) | 6 (23.1) |
|
| PR statue |
|
|
|
|
| 0.231 |
|
Negative | 5 (11.6) | 9 (20.9) | 0.542 | 3 (11.5) | 6 (23.1) |
|
|
Positive | 12 (28) | 17 (39.5) |
| 11 (42.3) | 6 (23.1) |
|
| HER2 status |
|
|
|
|
| 0.074 |
|
Negative | 10 (23.2) | 16 (37.3) | 0.265 | 9 (34.6) | 7 (27) |
|
|
Positive | 7 (16.3) | 10 (23.2) |
| 5 (19.2) | 5 (19.2) |
|
| C, Metastatic
variables, n (%) |
|
| Metastatic
site |
|
|
|
|
| 0.304 |
| Liver +
bone | 8 (21) | 4 (10.5) | 0.032 | 4 (19) | 0 |
|
| Liver +
lung | 8 (21) | 13 (34.2) |
| 7 (33.4) | 6 (28.6) |
|
| Liver +
lung + bone | – | 3 (7.9) |
| – | 3 (14.3) |
|
| Liver +
lung + brain | 1 (2.7) | 1 (2.7) |
| – | 1 (4.7) |
|
| Metastatic tumor
size (cm) |
|
|
|
|
| 0.295 |
|
0-1.0 | 4 (9.3) | 8 (18.6) | 0.341 | 6 (23.1) | 2 (7.7) |
|
|
1.1–3.0 | 4 (9.3) | 7 (16.3) |
| 3 (11.4) | 4 (15.4) |
|
|
>3.0 | 9 (20.9) | 11 (25.6) |
| 5 (19.2) | 6 (23.1) |
|
| Metastatic tumor
number |
|
|
|
|
| 0.121 |
| 1 | 3 (7) | 5 (11.6) | 0.027 | 3 (11.4) | 2 (7.8) |
|
|
2-3 | 5 (11.6) | 4 (9.4) |
| 3 (11.4) | 1 (3.9) |
|
|
>3 | 9 (20.9) | 17 (39.5) |
| 8 (30.9) | 9 (34.6) |
|
We performed a linear logistic regression analysis
to predict the accuracy of CTC detection and characteristic of
BCLM. Fig. 2B shows that the
average recovery was calculated to be 81%
(R2=0.91). We assessed possible sources of cell
loss and found that nearly 10% of cells were in the waste from cell
isolation and sampling, and another 9% of cells died in the
magnetic tubing. Therefore, counting of CTCs may not identify
patients with a high risk of postoperative recurrence but could be
a more precise indication for the diagnosis for BCLM.
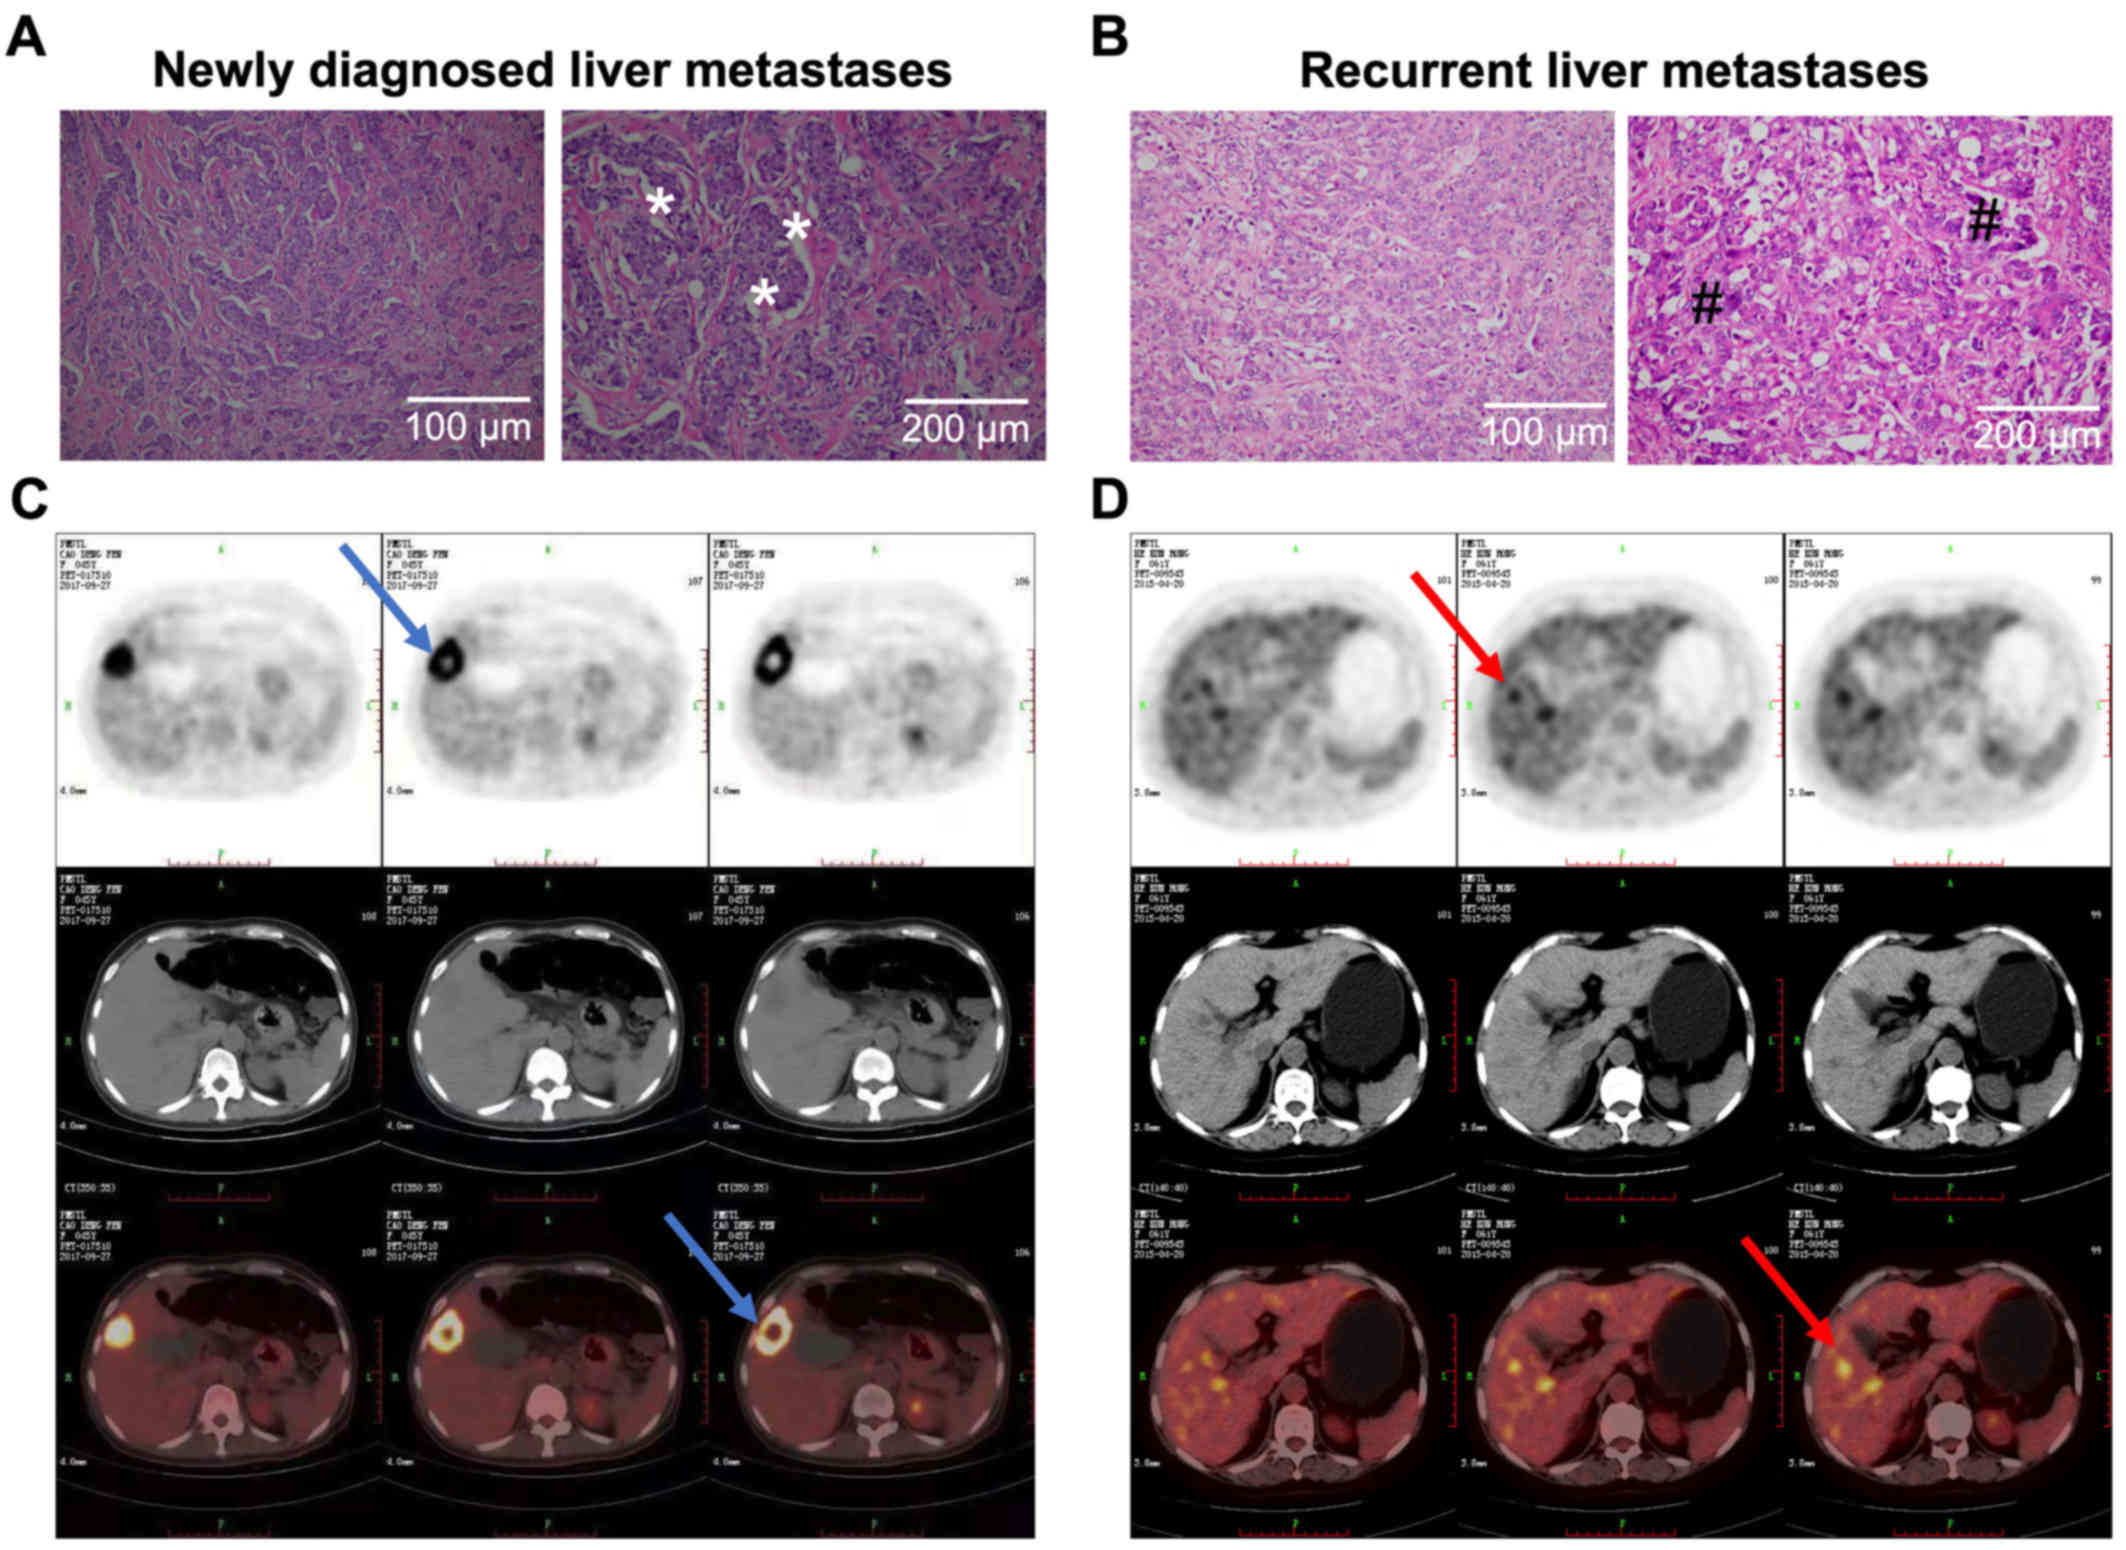
Clinicopathological confirmation of
newly diagnosed and recurrent liver metastases
To confirm liver metastases of newly diagnosed and
recurrent MBC, 18F-FDG PET/CT scan was conducted. Serial
biopsy sections from paraffin blocks of different regions of
resected or punctured tumor samples were examined by H&E
staining. Pathologically, all breast cancer samples were identified
as invasive ducal carcinoma samples. Of the 43 patients, 23 newly
diagnosed and 20 postoperative recurrent liver metastases were
found by 18F-FDG PET/CT. The SUVmax of PET/CT between
the the negative-CTC group was not significantly different than
that of the positive-CTC group (6.12±3.44 vs. 5.97±2.82; P=0.39).
Similarly, no significant difference was seen in the SUVmax between
the low-CTC and high-CTC groups (4.59±3.27 vs. 4.96±2.73; P=0.76)
(Table I). Representative H&E
staining and 18F-FDG PET/CT images of typical newly
diagnosed MBC patient no. 13 (BCLM13H, Table SI) showed this patient to be in the
high-CTC group while recurrent MBC patient no. 3 (BCLM03L, Table SI) belonged to the low-CTC group.
There was high proliferation of bile duct cells and infiltrating
inflammatory cells in newly diagnosed liver metastases (Fig. 3A). Large necrotic, dense lymphocytic
infiltrate and desmoplastic rim are the main structural
depolarization in recurrent liver metastases (Fig. 3B). A significant increase in the
number of hepatocytes and significant diffuse infiltration by
poorly differentiated carcinoma cells were evident in connective
tissues from both newly diagnosed and recurrent liver metastatic
groups. The 18F-FDG PET/CT images clearly show that
newly diagnosed liver metastases (Fig.
3C) and the recurrent liver metastases (Fig. 3D) have similar imaging
characteristics and SUVmax value. A meaningful increase in necrotic
area in metastatic hepatic lesions on the right lobe of the liver
was a prominent feature in recurrent liver metastases.
CTC isolation and morphological
characterization
The 7.5 ml blood samples from BCLM patients were
used for CTC isolation using high efficiency Cell Search
technology. We evaluated the quality of the blood samples before
CTC isolation and none of the samples showed hemolysis. The stored
CTC suspension was placed under a fluorescence microscope to select
individual CTCs. Physical and three-color immunofluorescent
characterization of CTCs isolated from patients with BCLM are shown
in Fig. 4. There was a large number
of cell debris under fluorescence microscope (>75%) and few
cells with intact morphology (>11%). The basis for
affinity-binding systems used for CTC enrichment and identification
is the selection of specific tissue-type and cancer-specific
markers, such as leukocyte (WBC)-expressed cell membrane CD45 (a
tyrosine phosphatase) and epithelial cell (EPC)-expressed
cytoplasmic CK-8, as well as DAPI nuclear staining. Then, we
further distinguished the EPCs from CTCs by size, where the cutoff
was a cellular diameter <8 µm for CTCs and a diameter >8 µm
for EPCs (27,39,40).
Morphologically, CTCs from BCLM patients were recognizable with
typical deformations of a neoplastic cell: Hyperchromatic nuclei by
fluorescence microscopy with an irregular shape, high
nuclear-to-cytoplasmic ratio, as described by Krebs et al
(41). Enriched CTCs can be
isolated based on their distinct physical (size or deformability)
or fluorescence properties from EPCs and WBCs (Fig. 4). The CTC sample appears as
CD45−/Nucleus+/CK8+, while WBCs
appear as CD45+/Nucleus+/CK8−.
Cells that stain
CD45−/Nucleus+/CK8+ with larger
diameter <8 µm were identified as EPCs. Furthermore, the dead
cell mass sample shows cytoplasmic CK8+. Obviously, the
triple-immunostaining method is slightly limited by the specificity
and availability of antibodies. Of a total of 2,081 captured cells
from all samples, 1,359 (65.3%) of the tumor cells were identified
as CTCs, 430 (20.7%) as WBCs, and 292 (14.1%) as EPCs. The details
of the CTC count from each BCLM patient are shown in the Table S1.
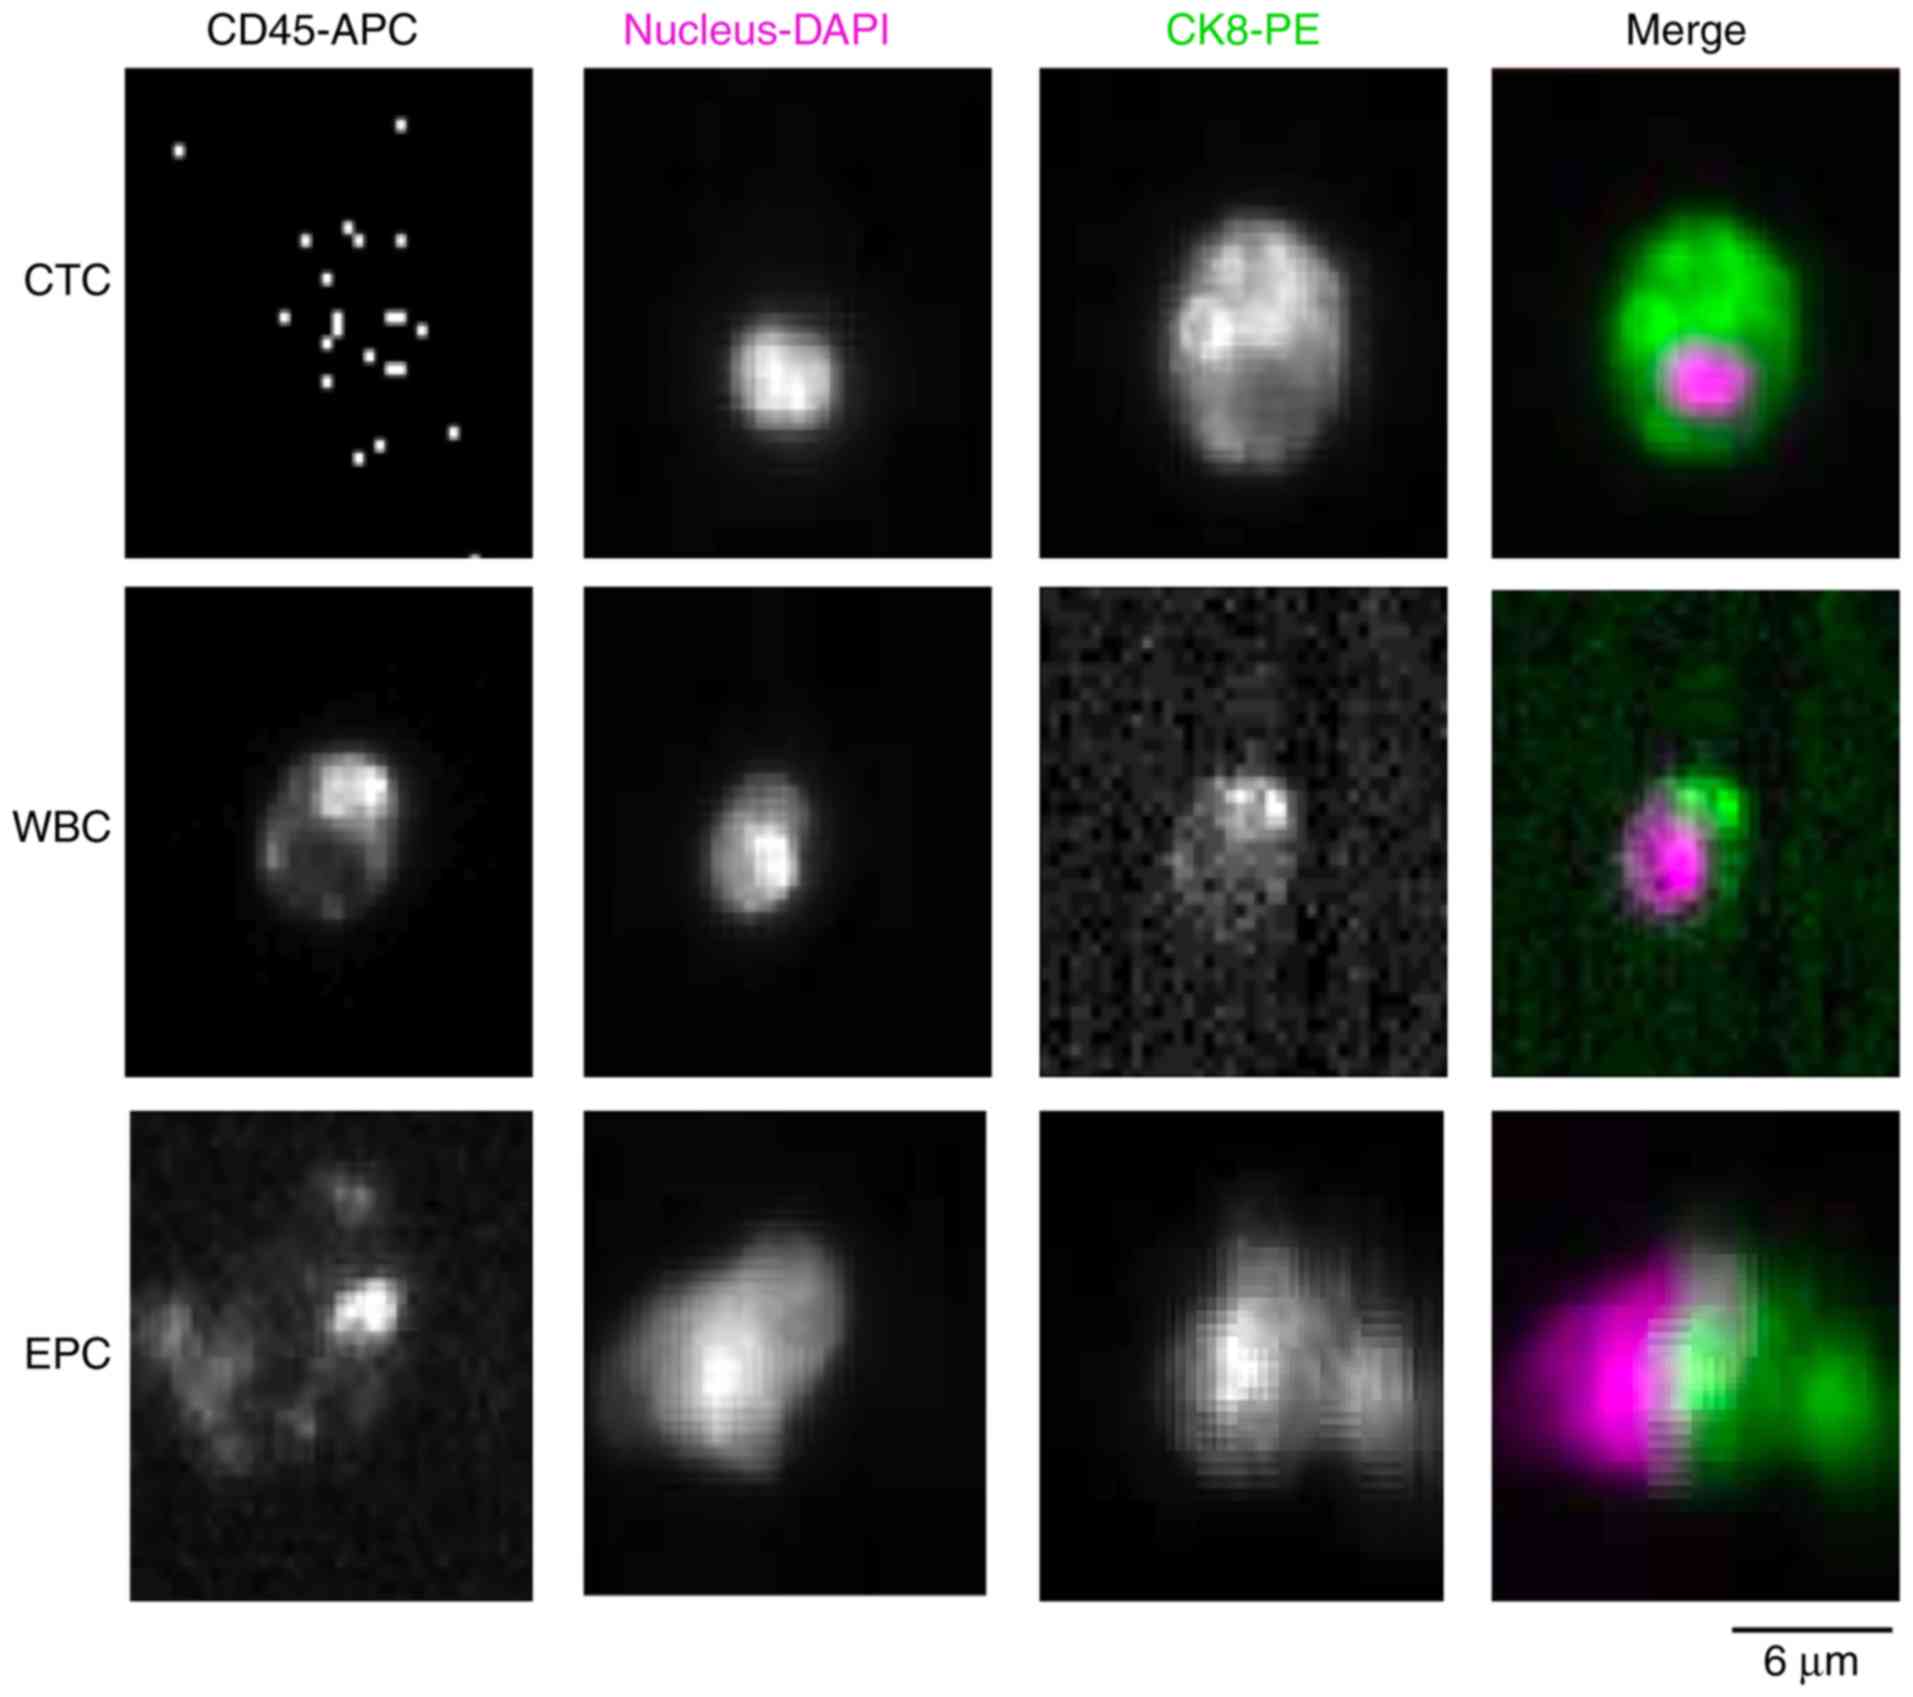 | Figure 4.Gallery of fluorescent immunostaining
of CTCs, EPCs and leukocytes (WBCs) from patients with BCLM. Cells
were stained by anti-CD45-APC antibody,
4′,6-diamidino-2-phenylindole (DAPI, nuclear staining; pink color),
anti-CK8-PE (green color). The CTC sample is characterized by a
CD45−/Nucleus+/CK8+ of a diameter
<8 µm, while
CD45+/Nucleus+/CK8− are identified
as WBCs. Cells that stain
CD45−/Nucleus+/CK8+ are identified
as EPCs with a diameter <8 µm (magnification 200 µm). BCLM,
breast cancer liver metastasis; CTCs, circulating tumor cells; CK,
cytokeratin; EPCs, epithelial cells; WBCs, white blood cells. |
Correlation of CTCs and
clinicopathological characteristics
By comparing the negative- and positive-CTC groups,
the initial disease stage and HER2 status were strongly correlated
with the presence of CTCs (R=0.75, P=0.04 and R=0.72, P=0.032,
respectively). These findings suggest that the CTC count may be a
prognostic factor for survival of BCLM patients. Strikingly, by
comparing the low- and high-CTC groups, it was found that the CTC
number was significantly correlated with the size of metastasis and
metastatic tumor number (R=0.81, P=0.03 and R=0.77, P=0.03,
respectively). These data indicate that CTC counting could be a
viable method by which to monitor distant metastasis. Additionally,
we did not find any significant correlation between CTC presence or
number and hormone receptor in the multivariate analysis model
(Table II). In general, high CTC
frequencies were correlated with disease severity and metastatic
progression, which also suggests an effective value for CTCs in
predicting the prognosis of BCLM.
| Table II.Correlation between CTC count and
clinicopathological features of the BCLM patients. |
Table II.
Correlation between CTC count and
clinicopathological features of the BCLM patients.
|
| CTC-negative and
-positive | Low and high
CTCs |
|---|
|
|
|
|
|---|
| Variable | R | P-value | R | P-value |
|---|
| Subjects, n
(%) | 0.70 | 0.507 | 0.31 | 0.421 |
| Age (years) | 0.34 | 0.491 | 0.45 | 0.278 |
| BMI
(kg/m2) | 0.28 | 0.204 | 0.67 | 0.602 |
| Disease durations
(years) | 0.34 | 0.562 | 0.32 | 0.487 |
| PET/CT
(SUVmax) | 0.28 | 0.762 | 0.44 | 0.395 |
| Initial disease
stage | 0.75 | 0.041 | 0.72 | 0.382 |
| ER status | 0.66 | 0.582 | 0.40 | 0.071 |
| PR status | 0.28 | 0.231 | 0.37 | 0.542 |
| HER2 status | 0.72 | 0.032 | 0.64 | 0.265 |
| Metastatic
site | 0.75 | 0.304 | 0.62 | 0.341 |
| Metastatic tumor
size (cm) | 0.59 | 0.295 | 0.81 | 0.032 |
| Metastatic tumor
number | 0.39 | 0.121 | 0.77 | 0.027 |
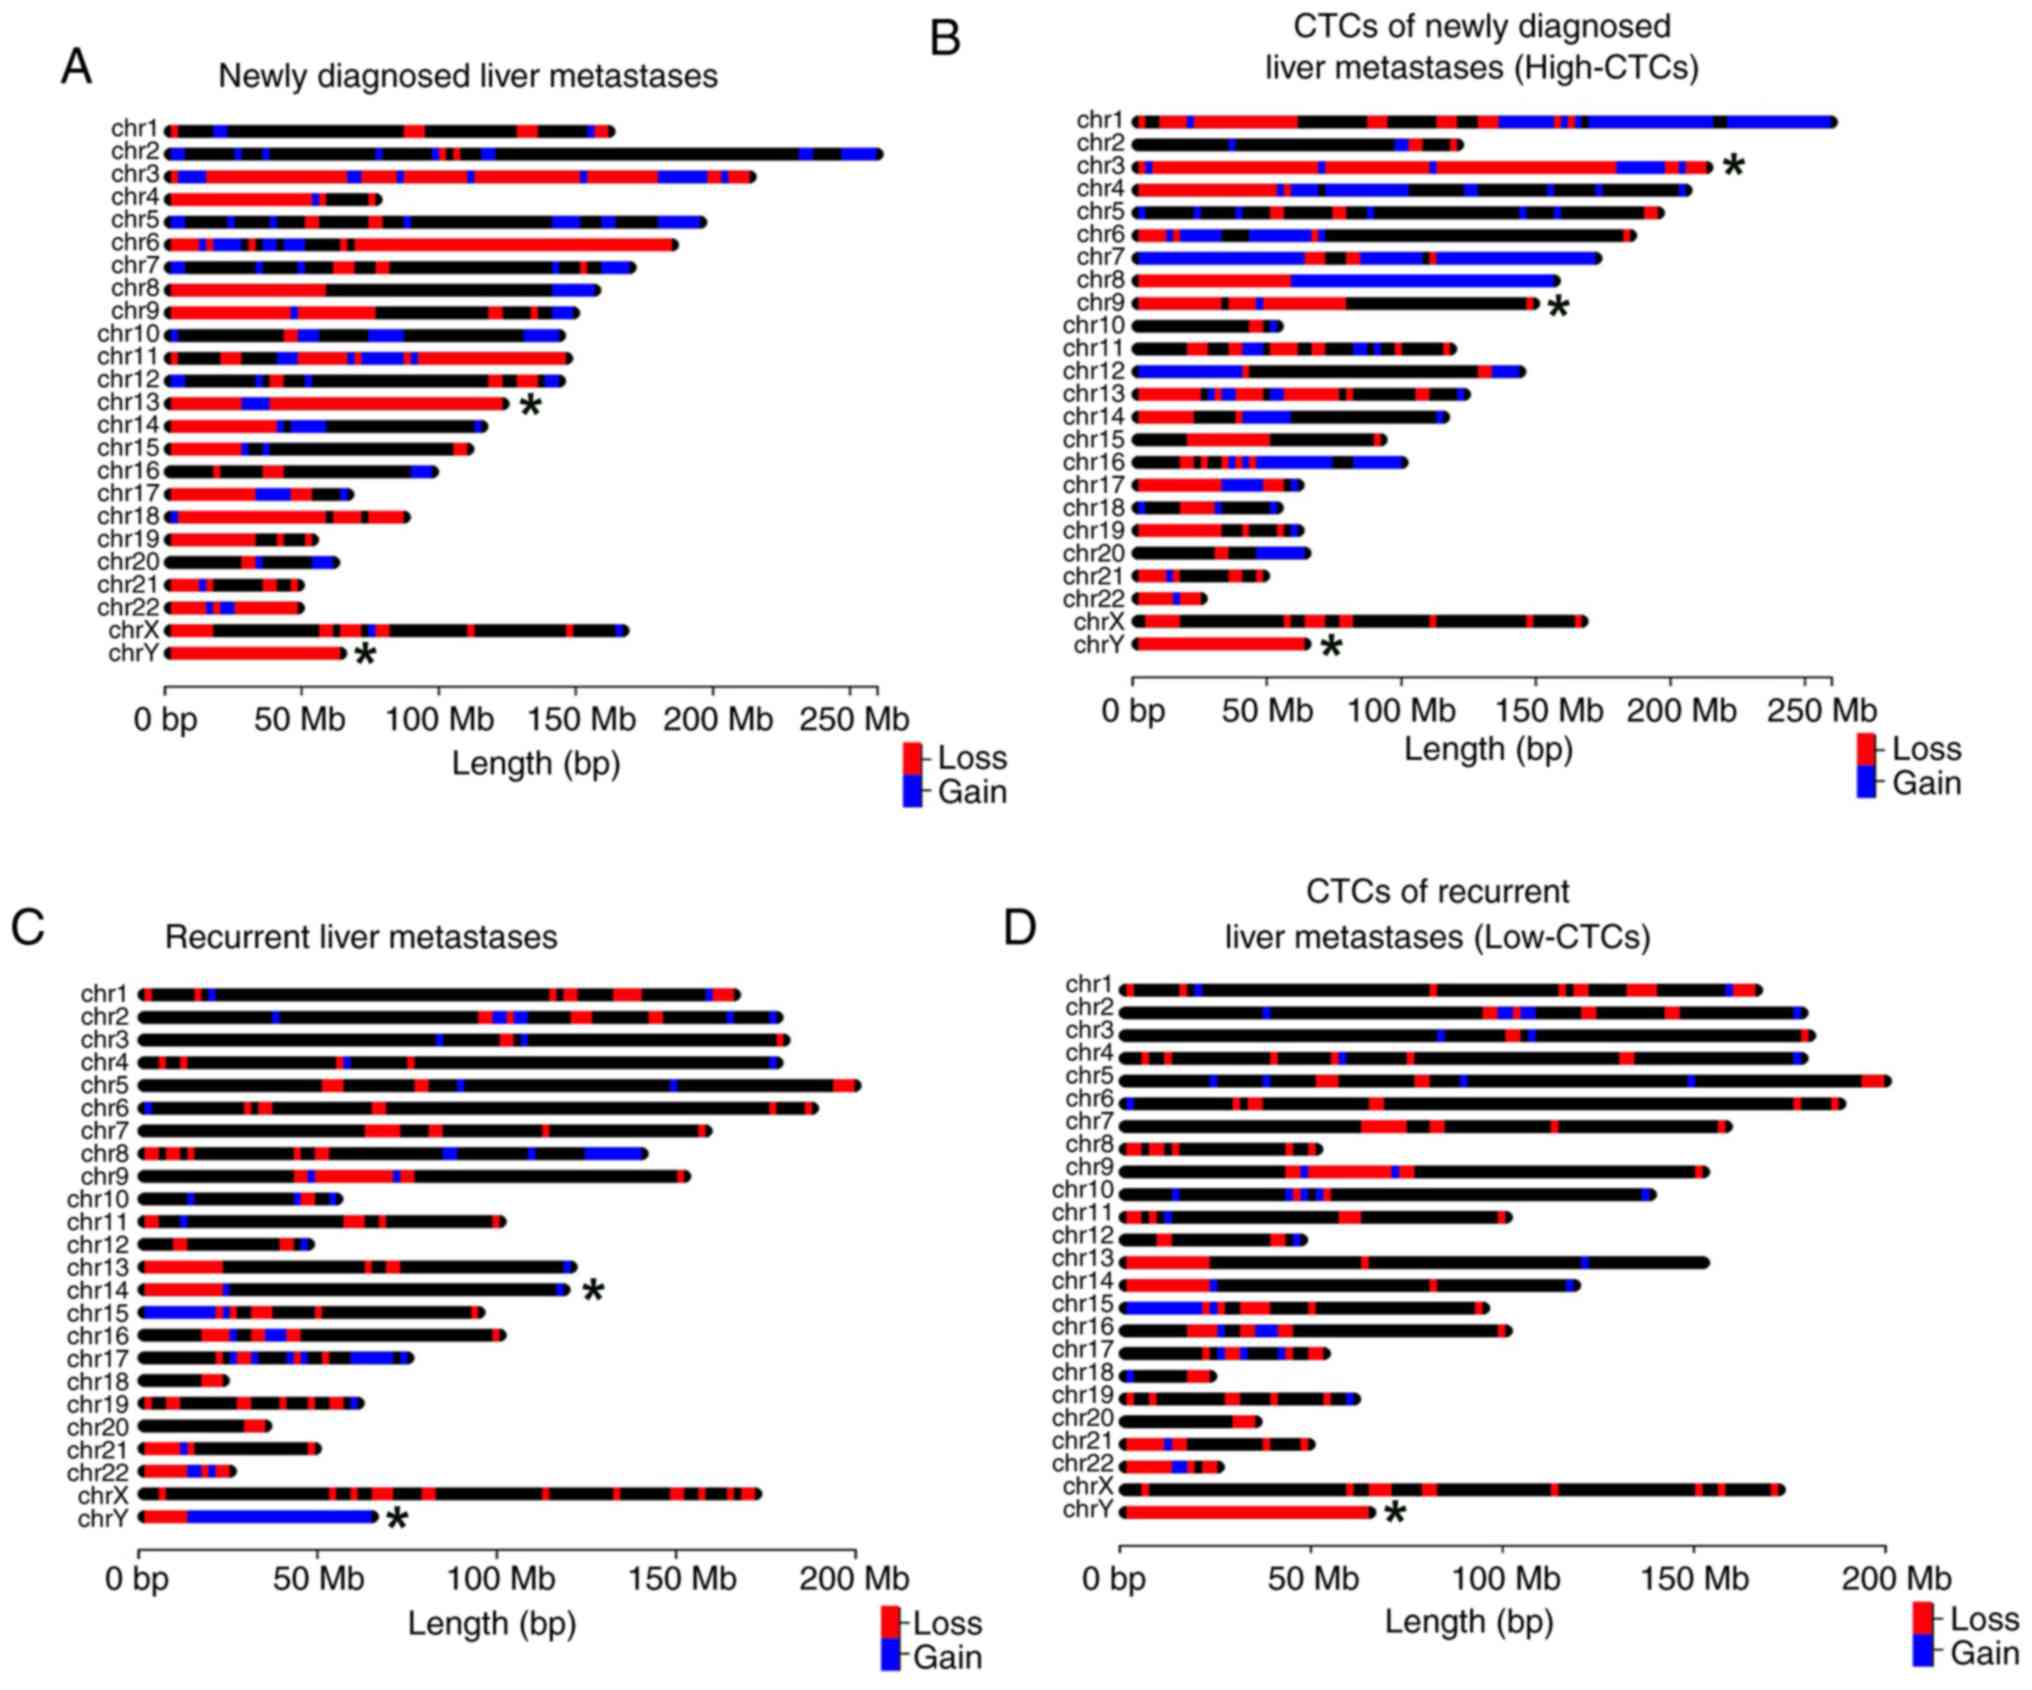
Genome-wide CNVs of newly diagnosed
and recurrent BCLM
Visualization of 10× genome-wide gene copy numbers
was performed in CTC specimens of the newly diagnosed MBC patient
no. 13 (no. BCLM13H, Table S1) and
CNVs of recurrent MBC patient no 3 (no. BCLM03L, Table S1). We then applied 30× WGS
sequencing of liver metastases from these two patients. Our primary
finding showed that the average ‘unique mapped of raw’ of the
single cell genome sequencing products was 79.58% (78.74-80.17%),
which further implies that uniform amplification of a single cell
genome can be used for genomic copy number analysis. As shown in
Fig. 5, the CNV pattern of CTCs and
liver metastases in newly diagnosed and recurrent MBC patients were
significantly different. A few CNVs were found in either the newly
diagnosed liver metastases (Fig.
5A) or the recurrent liver metastases (Fig. 5C), in which gain and loss regions
accounted for ~7.4 and ~0.26% of their entire genomes,
respectively. Remarkably, the region of 0–22,800 kbp of chromosome
13 and 0–22,750 kbp of chromosome 14 were the most significant CNVs
in newly diagnosed and recurrent liver metastases, respectively. In
comparison with CTCs of recurrent BCLM, there are nearly ~45% gain
and ~4.7% loss regions in the CTCs isolated from the newly
diagnosed metastases group (Fig. 5B and
D).
In the CTCs of recurrent BCLM, the copy number
slightly increases in most CNV regions with 1 copy as the lower
limit and 3 copies as the upper limit (Fig. 5D). In addition, we also found a few
regions with copy number between 3–5 copies located on chromosomes
9,8,11,13,14,15, and 22 (Fig. 5D).
Other regions with copy numbers between 5–9 on these chromosomes
accounted for ~2.4 and ~2.1% of the entire genome (Fig. 5C). Nearly all CNVs that arise in
newly diagnosed liver metastases (Fig.
5A) were found in CTCs of newly diagnosed BCLM (Fig. 5B), but there are many more CNVs in
newly diagnosed liver metastases. Furthermore, in CTCs of newly
diagnosed liver metastases, chromosomes 3, 9 and Y had significant
CNVs (Fig. 5B). In contrast, the
CNV pattern of isolated CTCs of recurrent BCLM patient (Fig. 5C) was similar to recurrent liver
metastases (Fig. 5D) (nearly 82% of
the gain/loss regions). The CNVs on the remaining chromosomes
showed some similarity between CTCs of recurrent BCLM and recurrent
liver metastases.
Functional enrichment analysis of CNVs
in newly diagnosed and recurrent BCLM
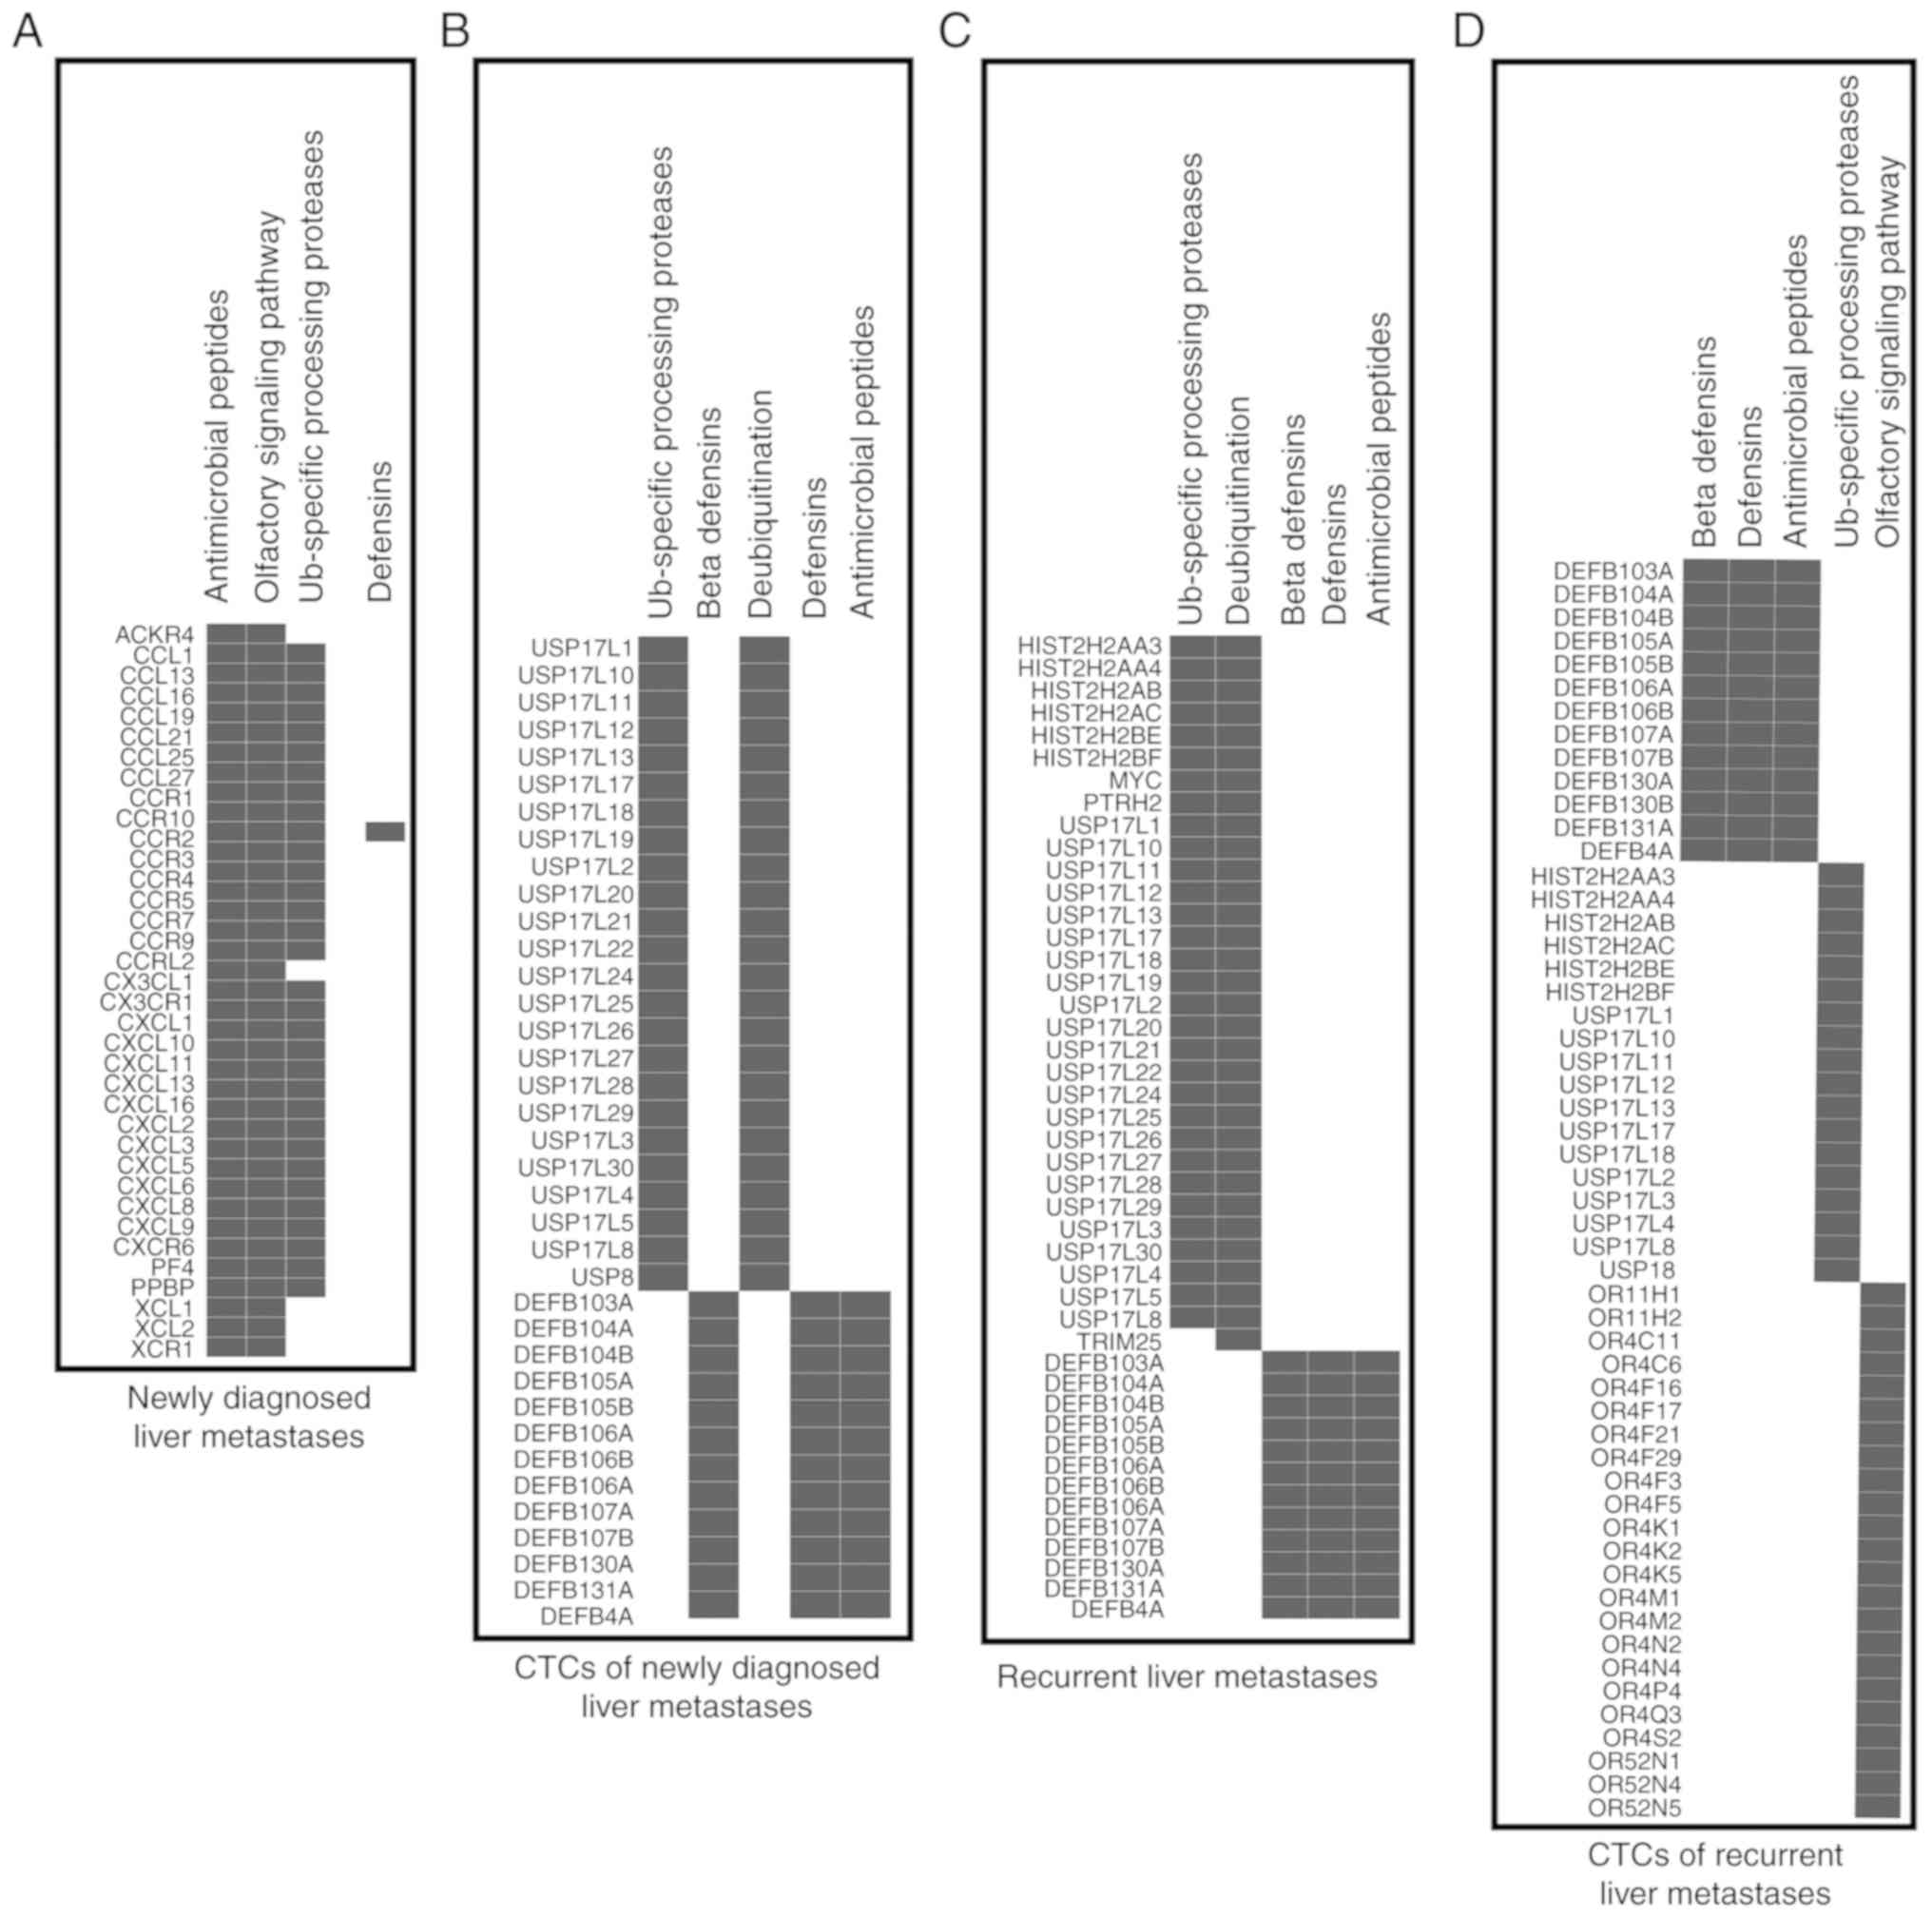
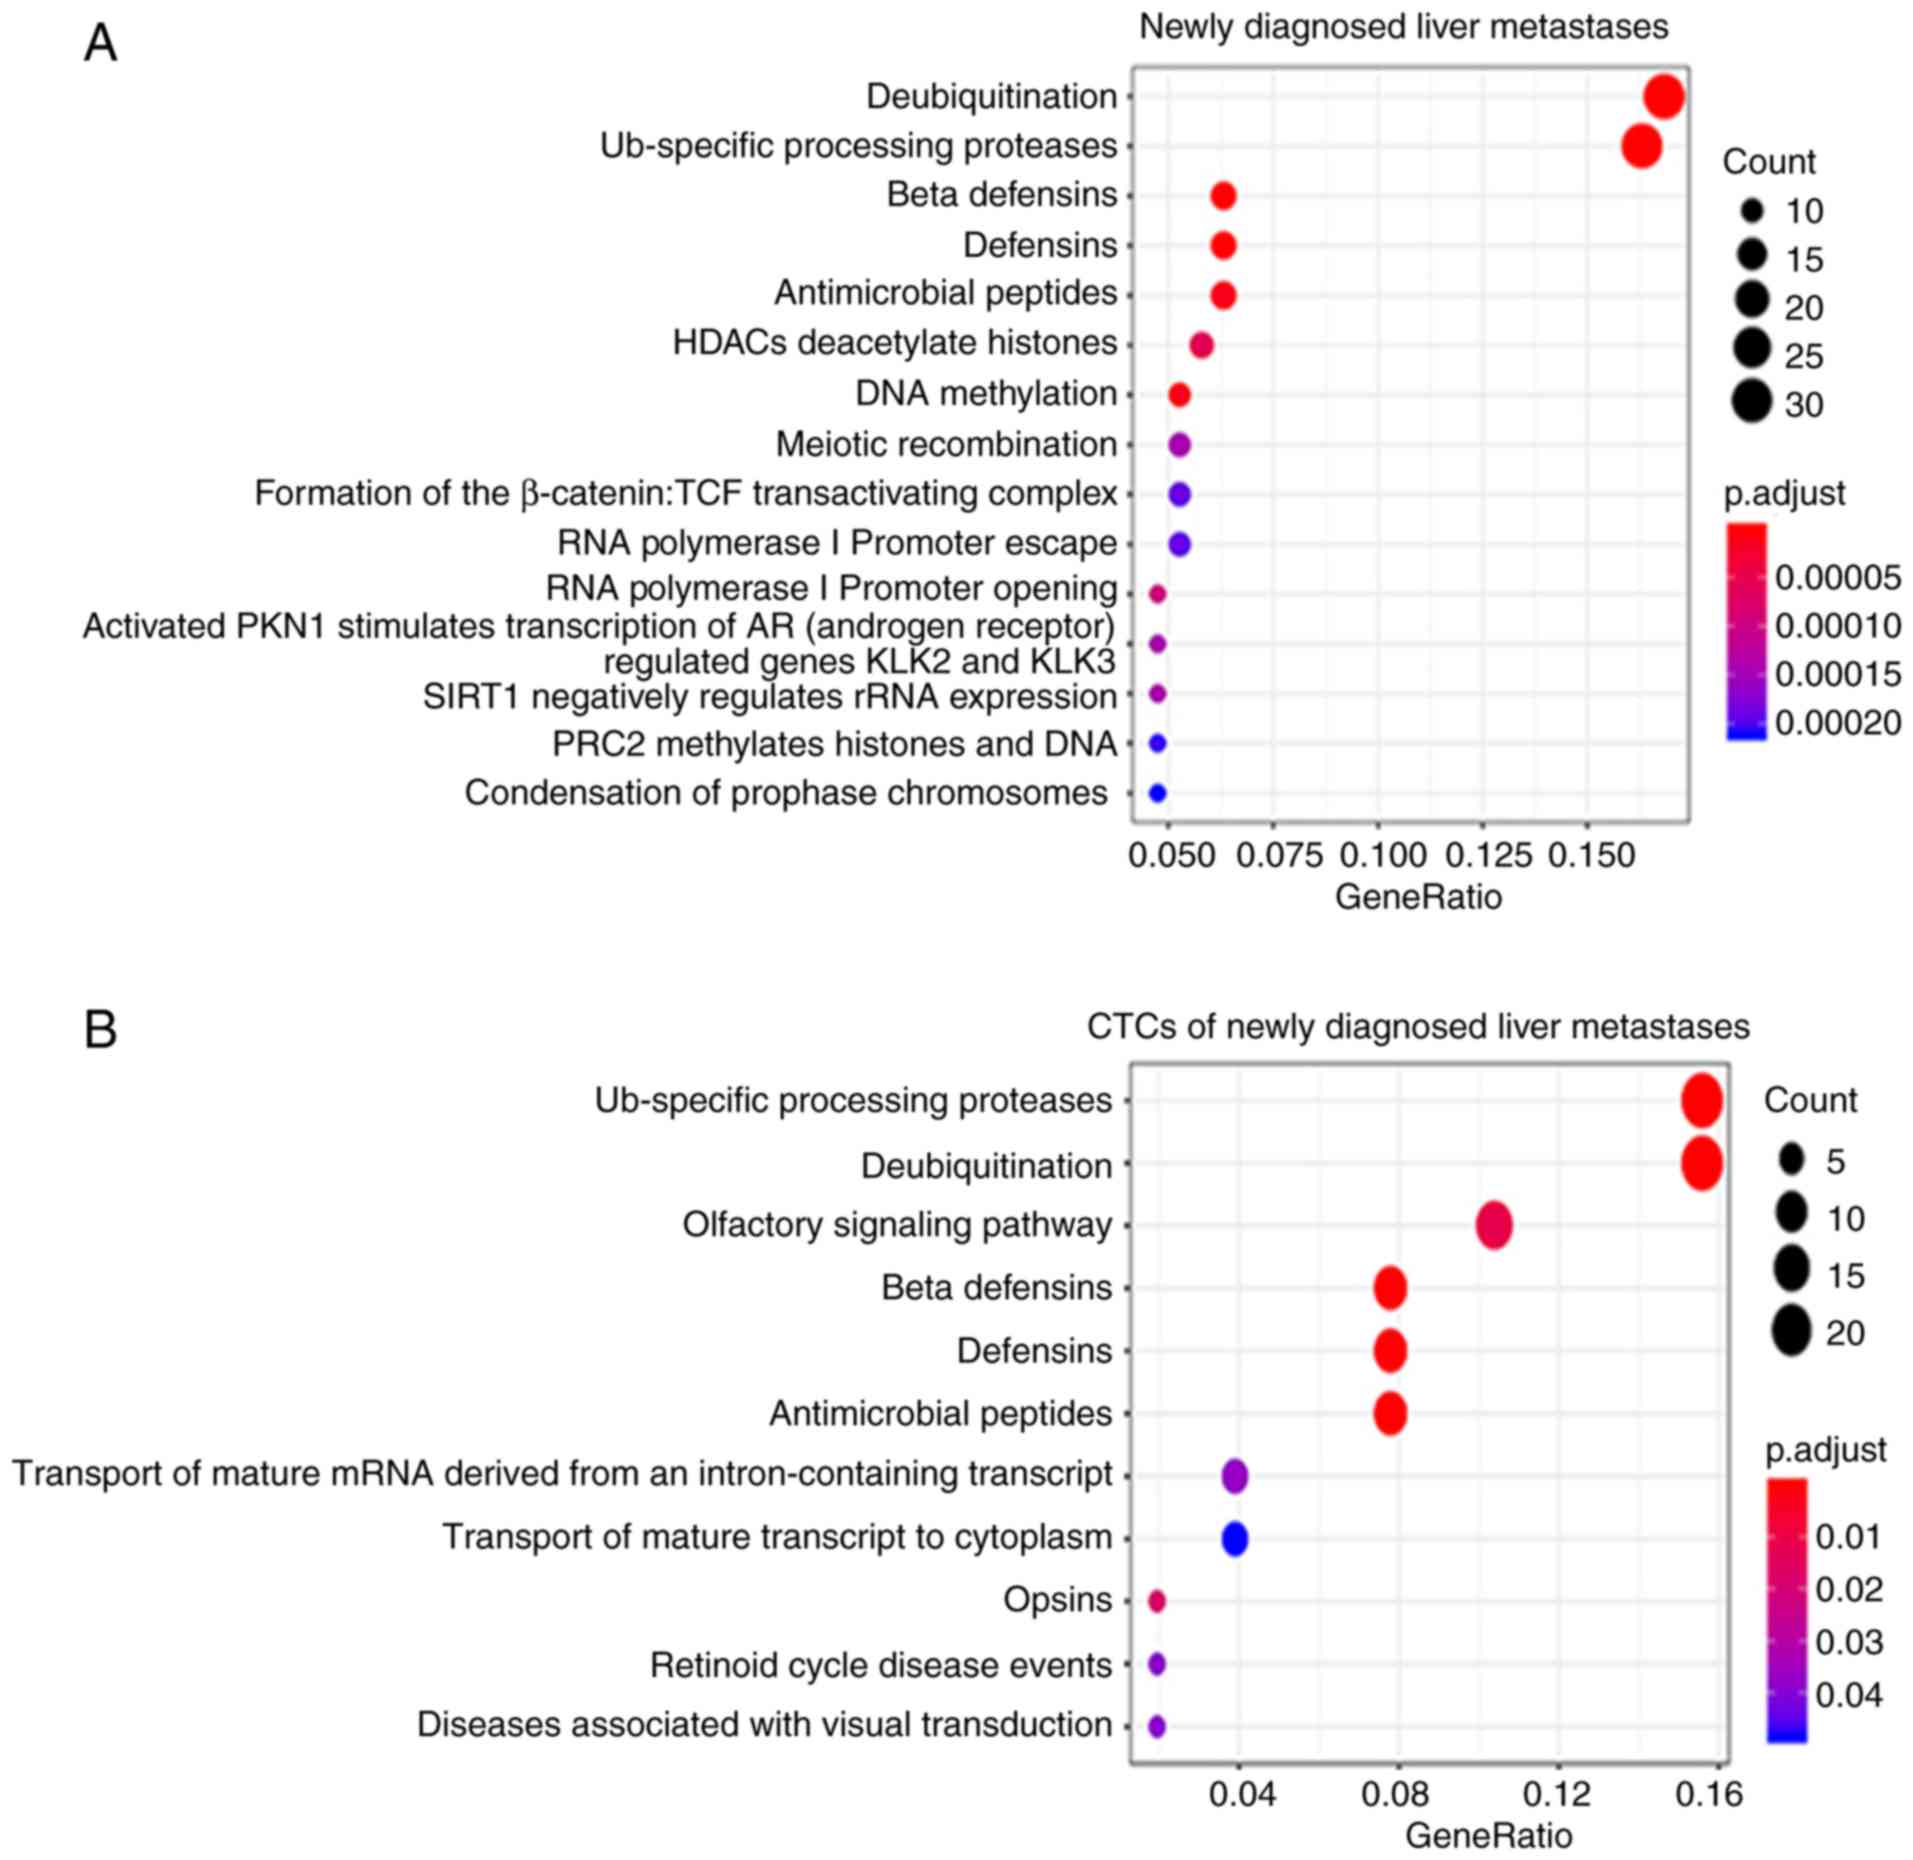
GSEA analysis was performed for a functional
assessment of the genes involved in specific CTC-shared CNVs. The
significant biological pathways are sorted in Table III and Fig. 6. We found four common target
pathways: β-defensins (hBDs), defensins, antimicrobial peptides,
and Ub-specific processing proteases between newly diagnosed liver
metastases (Fig. 6A), recurrent
liver metastases (Fig. 6C),
CTC-shared CNVs of newly diagnosed BCLM (Fig. 6B), and CTC-shared CNVs of recurrent
BCLM (Fig. 6D). High expression of
genes involved in defensin and hBD functions were enriched in all
four groups. Moreover, we found chemokine receptors bind
chemokines, GPCR ligand binding, G alpha (i) signaling events, and
class C/3 (metabotropic glutamate/pheromone receptors) pathways
with their response genes were higher in the CNVs of newly
diagnosed liver metastases compared with CNVs of recurrent liver
metastases; which may partly account for the poor prognosis in
newly diagnosed BCLM patients (Fig.
6).
| Table III.Results of the gene set enrichment
analysis (GSEA). |
Table III.
Results of the gene set enrichment
analysis (GSEA).
| Groupa | Pathway biological
function | Genes | Adjusted
P-value |
|---|
| Low- CTC | β-defensins | DEFB131A,
DEFB104B, DEFB106B, DEFB105B, DEFB107B, DEFB107A, DEFB105A,
DEFB106A, DEFB104A, DEFB103A, DEFB4A, DEFB130B, DEFB130A | 2.64e-12 |
|
| Defensins | DEFB131A,
DEFB104B, DEFB106B, DEFB105B, DEFB107B, DEFB107A, DEFB105A,
DEFB106A, DEFB104A, DEFB103A, DEFB4A, DEFB130B, DEFB130A | 2.92e-11 |
|
| Antimicrobial
peptides | DEFB131A,
DEFB104B, DEFB106B, DEFB105B, DEFB107B, DEFB107A, DEFB105A,
DEFB106A, DEFB104A, DEFB103A, DEFB4A, DEFB130B, DEFB130A | 8.39e-08 |
|
| Ub-specific
processing proteases | HIST2H2BF,
HIST2H2AA3, HIST2H2AA4, HIST2H2BE, HIST2H2AC, HIST2H2AB, USP18,
USP17L10, USP17L11, USP17L12, USP17L13, USP17L17, USP17L18,
USP17L1, USP17L4, USP17L8, USP17L3, USP17L2 | 1.15e-07 |
|
| Olfactory signaling
pathway | OR4F5, OR4F29,
OR4F16, OR52N4, OR52N5, OR52N1, OR4C11, OR4P4, OR4S2, OR4C6,
OR11H2, OR4N2, OR4Q3, OR4M1, OR4K2, OR4K5, OR4K1, OR4M2, OR4N4,
OR4F17, OR11H1, OR4F3, OR4F21 | 2.96e-07 |
| Primary tumor | Ub-specific
processing proteases | HIST2H2BF,
HIST2H2AA3, HIST2H2AA4, HIST2H2BE, HIST2H2AC, HIST2H2AB, PTRH2,
USP17L10, USP17L11, USP17L12, USP17L13, USP17L17, USP17L18,
USP17L19, USP17L20, USP17L21, USP17L22, USP17L24, USP17L25,
USP17L26, USP17L5, USP17L27, USP17L28, USP17L29, USP17L30, USP17L1,
USP17L4, USP17L8, USP17L3, USP17L2, MYC | 8.99e-17 |
|
|
Deubiquitination | HIST2H2BF,
HIST2H2AA3, HIST2H2AA4, HIST2H2BE, HIST2H2AC, HIST2H2AB, TRIM25,
PTRH2, USP17L10, USP17L11, USP17L12, USP17L13, USP17L17, USP17L18,
USP17L19, USP17L20, USP17L21, USP17L22, USP17L24, USP17L25,
USP17L26, USP17L5, USP17L27, USP17L28, USP17L29, USP17L30, USP17L1,
USP17L4,USP17L8, USP17L3, USP17L2, MYC | 3.67e-14 |
|
| β-defensins | DEFB131A,
DEFB104B, DEFB106B, DEFB105B, DEFB107B, DEFB107A,
DEFB105A,DEFB106A, DEFB104A, DEFB103A, DEFB4A, DEFB130A | 8.82e-10 |
|
| Defensins | DEFB131A,
DEFB104B, DEFB106B, DEFB105B, DEFB107B, DEFB107A, DEFB105A,
DEFB106A, DEFB104A, DEFB103A, DEFB4A, DEFB130A | 1.06e-08 |
|
| Antimicrobial
peptides | DEFB131A,
DEFB104B, DEFB106B, DEFB105B, DEFB107B, DEFB107A, DEFB105A,
DEFB106A, DEFB104A, DEFB103A, DEFB4A, DEFB130A | 1.45e-05 |
| Liver metastatic
bind chemokines | Chemokine
receptors | XCL2, XCL1,
CX3CL1, CXCL16, CCL13, CCL1, CCL16, CCR7, CCR10, CCL25, CCR4,
CX3CR1, CCR8, CCR9, CXCR6, XCR1, CCR3, CCR1, CCR2, CCR5, CCRL2,
ACKR4, CXCL8, CXCL6,CXCL1, PF4, PPBP, CXCL5, CXCL3, CXCL2, CXCL9,
CXCL10, CXCL11, CXCL13, CCL27, CCL19, CCL21 | 6.57e-06 |
|
| GPCR ligand
binding | UTS2, CORT,
TAS1R2, HTR6, ECE1, WNT4, HTR1D, CNR2, PTAFR, OPRD1, HCRTR1, EDN2,
PTCH2, GNG5, LPAR3, ACKR1, XCL2, XCL1, CD55, WNT9A, WNT3A, AGT,
GNG4, CHRM3, NPY4R2, CHRM4, F2, GNG3, CHRM1, TAS2R7, TAS2R8,
TAS2R9, TAS2R10, TAS2R13,TAS2R14, TAS2R50, TAS2R20, TAS2R19,
TAS2R31, TAS2R46, TAS2R43, TAS2R30, HEBP1, IAPP, PTHLH, HCAR2,
HCAR3, HCAR1, FZD10, RXFP2, LPAR6, CYSLTR2, MLNR, GPR18, GPR183,
SSTR1, GNG2, PTGDR, CHRM5, CX3CL1, MC1R, CXCL16, GLP2R, ADORA2B,
CCL13, CCL1, CCL16, CCL23, CCR7, HCRT | 0.0106 |
|
| GPCR ligand
binding | CCR10, RAMP2,
PPY, PYY, FZD2, LINC02210-CRHR1, CRHR1, WNT3, WNT9B,ADCYAP1, HRH4,
PLPPR3, KISS1R, GNG7, S1PR4, TBXA2R, C3, ADGRE1, CCL25, P2RY11,
S1PR2,S1PR5, PLPPR2, RLN3, ADGRE5, PTGER1, ADGRE3, ADGRE2,
LPAR2,MC3R, GRM7, OXTR, GHRL, HRH1, WNT7A, CCR4, CX3CR1, CCR8, CCK,
VIPR1, CCR9, CXCR6, XCR1, CCR3, CCR1, CCR2, CCR5, CCRL2, PTH1R,
UCN2, GRM2, WNT5A, PROK2, HTR1F, DRD3, CASR, RHO, TRH, ACKR4,
AGTR1, P2RY14, P2RY13, P2RY12, SUCNR1, P2RY1, GHSR, GNB4, ECE2,
KNG1, SST, UTS2B, ADRA2C, DRD5, CCKAR, NMU, NPFFR2, CXCL8, CXCL6,
CXCL1, PF4, PPBP, CXCL5, CXCL3, CXCL2,CXCL9, CXCL10, CXCL11,
CXCL13, EDN1, GLP1R, OPN5,HCRTR2, GPER1, NPY, CRHR2, GHRHR,
ADCYAP1R1, NPSR1, RAMP3, GRM3, FZD1, CALCR, GNGT1, GNG11,TAC1,
WNT2, WNT16, TAS2R16, GPR37, GRM8, CHRM2, TAS2R3, TAS2R4, TAS2R5,
TAS2R38, KEL, TAS2R39, TAS2R40, TAS2R60, TAS2R41, HTR5A, SHH,
VIPR2, GNRH1,ADRA1A, PNOC, FZD3, ADRB3, NPBWR1, OPRK1, PENK, FZD6,
TRHR, RLN2, CCL27,CCL19, CCL21, GPR143, OPN1MW | 0.0106 |
|
| G alpha (i)
signaling events | CORT, DHRS3,
TAS1R2, HSPG2, HTR1D, CNR2, OPRD1, SDC3, LRP8, PRKACB, GNG5, LPAR3,
RGS4, RGS5, RGSL1, RGS16, RGS8, PLA2G4A, RGS18, RGS21, RGS1, RGS13,
AGT, GNG4, RGS7, NPY4R2, CHRM4, GNG3, MYO7A, TAS2R7, TAS2R8,
TAS2R9, TAS2R10, TAS2R13, TAS2R14, TAS2R50,TAS2R20, TAS2R19,
TAS2R31, TAS2R46, TAS2R43, TAS2R30, HEBP1, ITPR2, CAMKK2, HCAR2,
HCAR3, HCAR1, GPR18, GPR183, SSTR1, GNG2, ADCY7, GNAO1, CX3CL1,
CNGB1, BCO1, CAMKK1, CXCL16, GUCY2D, RCVRN, CCL13, CCL1, CCL16,
CCL23, CCL4, CCL4L2, PPP1R1B, CCR7,HSD17B1, CCR10, PPY, PYY, NMT1,
HRH4, GNG7, S1PR4, C3, PCP2, CCL25, RDH8, S1PR2, PDE4A, S1PR5,
LDLR, RLN3, PRKACA, LPAR2, SDC4, ITPR1, GRM7, CCR4, CX3CR1,CCR8,
CCR9, CXCR6, CCR3, CCR1, CCR2, CCR5, PRKAR2A, GNAT1, GNAI2, GRM2,
PRKCD, HTR1F, DRD3, CASR, ADCY5, RHO, RBP2, RBP1, GRK7, P2RY14,
P2RY13, P2RY12, SUCNR1, GNB4, KNG1, SST, PDE6B, GRK4, RGS12,
ADRA2C, CNGA1, NMU, CXCL8, CXCL6, CXCL1, PF4, PPBP, CXCL5, CXCL3,
CXCL2, CXCL9, CXCL10, CXCL11, CXCL13, CAMK2D, OPN5, PRKAR1B, GPER1,
NPY, PDE1C, CAMK2B, ADCY1, GNAI1, GNAT3, GRM3, GNGT1, GNG11,
NAPEPLD, PRKAR2B, TAS2R16, GPR37, GRM8, AKR1B10, CHRM2, TAS2R3,
TAS2R4, TAS2R5, TAS2R38, TAS2R39, TAS2R40, TAS2R60, TAS2R41, CDK5,
HTR5A, LPL, PPP3CC, PNOC, PPP2CB, FNTA, NPBWR1, OPRK1, RGS20, PENK,
RDH10, SDC2, RGS22, LRP12, ADCY8, GPIHBP1, CCL27, CCL19, CCL21,
PRKACG, OPN1MW, OPN1MW2, OPN1MW3 | 0.0006 |
|
| Class C/3
(Metabotropic glutamate/pheromone receptors) | TAS1R2, TAS2R7,
TAS2R8, TAS2R9, TAS2R10, TAS2R13, TAS2R14, TAS2R50, TAS2R20,
TAS2R19, TAS2R31, TAS2R46, TAS2R43, TAS2R30, GRM7, GRM2, CASR,
GRM3, TAS2R16, GRM8, TAS2R3, TAS2R4, TAS2R5, TAS2R38, TAS2R39,
TAS2R40, TAS2R60, TAS2R41 | 0.0006 |
|
| Defensins | CCR2, DEFB131A,
TLR1, DEFB133, DEFB114, DEFB113, DEFB110, DEFB112, PRSS2, DEFB1,
DEFA6, DEFA4, DEFA1, DEFA1B, DEFA3, DEFA5, DEFB4B, DEFB103B,
DEFB104B, DEFB106B, DEFB105B, DEFB107B, DEFB107A, DEFB105A,
DEFB106A, DEFB104A, DEFB103A, DEFB4A, DEFB136, DEFB135, DEFB134,
DEFB130B, DEFB130A, PRSS3 | 0.0026 |
| High-CTC | Ub-specific
processing proteases | USP8, USP17L10,
USP17L11, USP17L12, USP17L13, USP17L17, USP17L18,
USP17L19,USP17L20, USP17L21, USP17L22, USP17L24, USP17L25,
USP17L26, USP17L5, USP17L27, USP17L28, USP17L29, USP17L30, USP17L1,
USP17L4, USP17L8, USP17L3, USP17L2 | 3.20e-12 |
|
| β-defensins | DEFB131A,
DEFB104B, DEFB106B, DEFB105B, DEFB107B, DEFB107A, DEFB105A,
DEFB106A, DEFB104A, DEFB103A, DEFB4A, DEFB130A | 8.42e-11 |
|
|
Deubiquitination | USP8, USP17L10,
USP17L11, USP17L12, USP17L13, USP17L17, USP17L18, USP17L19,
USP17L20, USP17L21, USP17L22, USP17L24, USP17L25, USP17L26,
USP17L5, USP17L27, USP17L28, USP17L29, USP17L30, USP17L1, USP17L4,
USP17L8, USP17L3, USP17L2 | 6.93e-10 |
|
| Defensins | DEFB131A,
DEFB104B, DEFB106B, DEFB105B, DEFB107B, DEFB107A, DEFB105A,
DEFB106A, DEFB104A, DEFB103A, DEFB4A, DEFB130A | 6.93e-10 |
|
| Antimicrobial
peptides | DEFB131A,
DEFB104B, DEFB106B, DEFB105B, DEFB107B, DEFB107A,
DEFB105A,DEFB106A, DEFB104A, DEFB103A, DEFB4A, DEFB130A | 1.09e-06 |
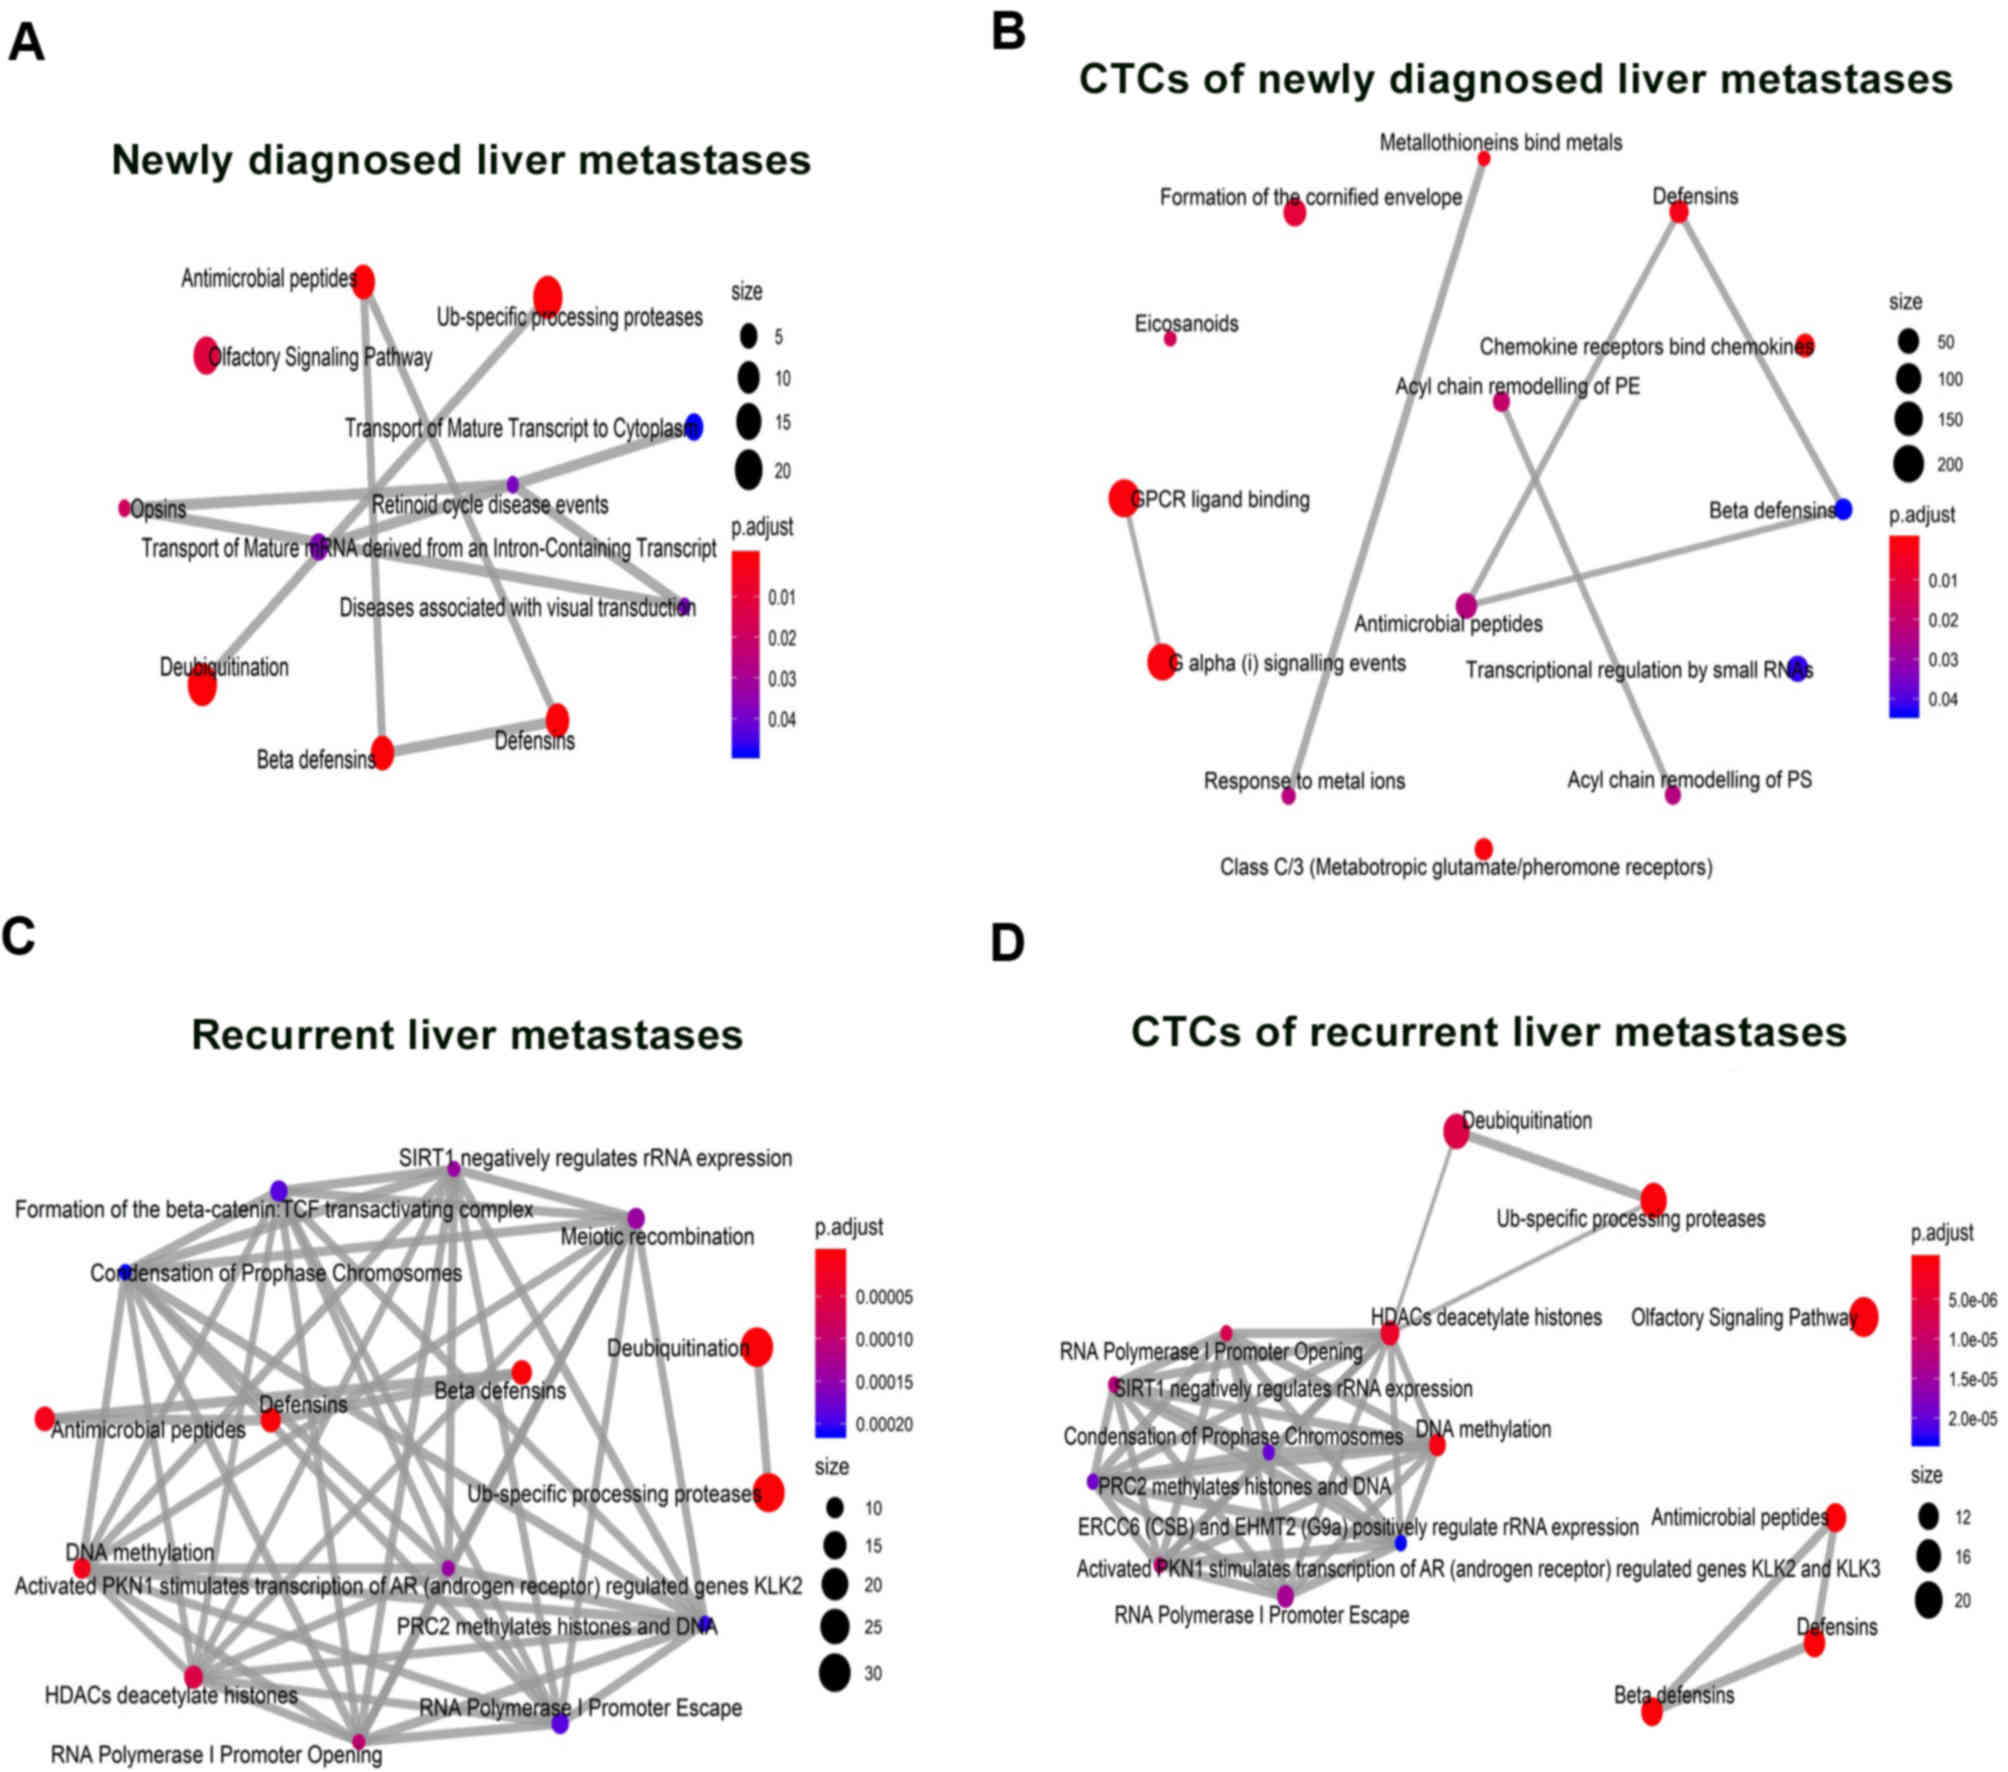
Protein-protein interaction network
analysis of CTC-shared CNVs
A pathway analysis and protein-protein interaction
(PPI) networks of commonly dysregulated genes are presented in
Figs. 7 and 8, receptively. Our findings show that GPCR
ligand binding, chemokine receptor binds chemokine, and G alpha
signaling events were enriched in patients with liver metastatic
phenotype, both newly diagnosed and recurrent (Fig. 7A and C). Whereas Ub-specific
processing protease, deubiquitinating, anti-microbial peptides,
defensins and hBDs pathway/biological function were enriched in
CTC-positive patients (Fig. 7B and
D). The emapplot (Fig. 8) and
cnetplot of PPI analysis (Fig. S1)
indicate that all these enriched pathways and genes may play
similar and critical roles in the development and progression of
liver metastasis. In addition, the enriched genes have previously
been reported to play critical roles in anti-angiogenesis,
immunomodulation, and cell growth. These findings show that these
genes are involved in: i) antitumor immunity with non-immunogenic
tumor antigens (anti-microbial peptide pathway enriched in the KEGG
pathway analysis); ii) suppression of cell growth, cell migration
via cell cycle arrest in G1/S checkpoint (hBDs and defensins are
enriched in the KEGG pathway analysis); iii) intravasation
competency through ECM remodeling and collagen catabolism
(defensins and GPCR ligand binding are enriched in the KEGG pathway
analysis).
Discussion
The present study, using a high-throughput whole
genome sequencing (WGS) technique, provides the first comprehensive
assessment of copy number variations (CNVs) among circulating tumor
cells (CTCs) in patients with breast cancer liver metastasis
(BCLM). In our analysis, which enrolled 43 breast cancer patients
who had newly diagnosed or postoperative liver metastasis, we found
that the presence of CTCs was associated with recurrence and a
shorter disease-free survival time in patients with BCLM. The
included cohort is the largest prospective study that counted CTCs
to detect newly diagnosed and recurrent liver metastasis.
Furthermore, we compared the consistency and efficiency of
genome-wide CNVs with other common methods to distinguish newly
diagnosed and recurrent BCLM. These findings highlight that higher
CTC frequencies are correlated with disease severity and liver
metastatic progression, thereby suggesting an effective value for
CTCs in the detection of BCLM in comparison with common detection
methods such as pathohistology and PET/CT imaging. Moreover, our
data confirm that a higher number of CTCs isolated from BCLM
patients is correlated with disease severity and metastatic
progression, and is an independent prognostic factor associated
with overall survival of BCLM patients. Analysis of biological
pathways suggests that genes of defensins and hBDs are
significantly associated with anti-angiogenesis, immunomodulation
and antitumor cell growth signaling pathways; which are relevant in
the development and progression of liver metastasis.
It is well established that CTC detection may be a
valuable clinical biomarker in cancer-related processes such as
angiogenesis, proliferation, differentiation, and metastasis
(25,42). Early detection of CTCs in cancerous
serum has been introduced as a potential biomarker for the
diagnosis of various types of cancer (25,43,44).
CTC detection in early stages of breast cancer can help identify
patients with a high risk of recurrence after surgery and help the
clinician to offer the best strategy for follow-up and treatment
(25,45). Recently, modern molecular biology
detection technologies such as WGS and whole exome sequencing are
among the most promising methods for the dissection of metastatic
organotropism (46,47). It has been widely accepted that
profiling of CNVs with WGS is an accretive and reliable analytical
tool that uses an ultra-low input of blood-derived DNA (29,42,48,49).
Likewise, CTC characterization by using genome-wide CNVs analysis
provides more rapid and less expensive data collection, high
diagnostic sensitivity and specificity, as well as advanced
analysis of molecular phenomena, including fluorescence in
situ hybridization for detection of tumor-specific genomic
changes (47). The clinical value
of CTC detection and enumeration in peripheral blood of cancer
patients is an attractive and significant part of cancer biomarker
research (50–52).
In the present study, the diagnostic value of
genome-wide CNVs in BCLM was successfully confirmed with
fluorescent-labeled antibodies that target tumor cell markers, and
staining and washing were found to have little or no effect on the
retention of tumor cells. In addition, we compared the consistency
and efficiency of genome-wide CNVs with other conventional
detection methods that distinguish between newly diagnosed and
recurrent BCLM. This may provide a potentially valuable approach
for the genetic characterization of newly diagnosed and recurrent
BCLM. Additionally, CTC characterization by genome-wide CNVs allows
tumor cells to be recovered for subsequent molecular analysis.
Strikingly, our finding indicates that CTC counting could be a
promising index for the monitoring of recurrent metastases. In
general, higher CTC frequencies are significantly correlated with
tumor severity and metastatic progression, which suggests the
clinical value of CTCs for a variety of initial disease staging of
BCLM patients.
We used the standard EpCAM method for isolating and
distinguishing of the CTCs between primary breast cancer and newly
diagnosed liver metastatic cancer. In the last decade, extensive
resources and several methods have been invested into developing
methods for detecting, enriching and characterizing of CTCs in
different diseases (27,53–55).
Methodologically, these techniques have many challenges that must
be remedied, such as the need to improve purity, throughput, cell
viability after recovery, and rates of enrichment.
EpCAM-independent method is the first and most-available method for
the detection of CTCs that has accelerated the development of
numerous isolation technologies based on physical approaches and
biological properties of CTCs (56,57).
On the other hand, non-EpCAM-based methods, such as
dielectrophoresis, immunoaffinity-based methods and microfiltration
are other isolation techniques with the advantage that they can
enrich CTCs without EpCAM expression. Unfortunately, our current
knowledge does not allow the possibility to identify, standardize
and classify CTCs in cancer cells at different stages (58–60).
Likewise, it would be desirable if these non-EpCAM-based methods or
markers were able to distinguish between metastatic and
non-metastatic CTCs. However, further improvements in
pre-enrichment steps will develop methods for the capture and
characterization of these cells. Surely, this information is most
vital for clinical use, determining the prognosis of disease,
making treatment decisions and evaluating the efficacy of BCLM
therapy.
In this prospective study, we found that the CNV
patterns across the genomes of recurrent liver metastases and their
CTCs were highly consistent, with nearly 82% of the gain/loss
regions shared among them, for an average of 72–16% of the whole
genome. The homology finding shows that β-defensins (hBDs) were
highly conserved and were predicted to be a globular domain that is
involved in anti-angiogenesis, immunomodulation, and antitumor cell
growth (61). In the CTC-shared
CNVs of newly diagnosed liver metastases and newly diagnosed liver
metastases, the CNVs were scattered across all chromosomes, but
most of them were located on chromosome 13 and 14 (62). Furthermore, functional enrichment
analysis of CTC-shared CNVs revealed that cell growth and cell
migration via cell cycle arrest were closely related to recurrent
and newly diagnosed metastases; which showed a similar phenotype
with KEGG analysis. Importantly, high expression of genes that are
involved in defensins and hBDs were enriched in all four groups.
Identifying such adaptations has increased our knowledge of the
role of hBDs in the process of metastasis of breast cancer
(61,63). Recently, studies have shown a
potential role for hBDs in the pathogenesis and prognosis of
different types of cancer such as cancers of the oral cavity,
esophagus, skin, kidney, prostate, thyroid, liver, lung, colon, and
cervix (64–68). In addition, hBDs play an important
role in promoting or inhibiting cancer cell proliferation/migration
depending on the origin and type of the cancer cell, and the
outcome may be associated with expression levels of hBDs in the
tumor (66,67). A literature review revealed that the
field is rife with inconsistent findings that make it difficult to
ascertain the role of hBDs in neoplasia and immunity associated
with BCLM (68,69). Still, this pilot study warrants a
larger analytical study at transcriptomic and post-transcriptomic
levels to confirm the findings. However, this warrants further
comprehensive investigation in the future with comprehensive in
vitro and in vivo studies on the mechanism of hBDs in
BCLM cell growth suppression. The present study had some
limitations, such as the small sample size, using a CTC isolation
method, and the lack of comprehensive gene expression profiling
between newly diagnosed and recurrent liver metastases cancer.
Therefore, these data should be substantiated by appropriate
prospective and comprehensive studies. Although the results provide
direct data to support the prognostic potential of CTC cluster
signatures in patients with BCLM, further genomic analysis of
single CTCs in comparison with WBCs is required to confirm the
findings.
In conclusion, we found similar clinicopathological
characteristics among low-CTC and high-CTC BCLM patients. A novel
finding from our study is that increased CTC numbers in BCLM
patients are more closely associated with newly diagnosed liver
metastasis. We also confirmed the CNV patterns of BCLM tumors with
those of histologically similar tumors. Importantly, the enriched
CTC-CNV pathways and genes showed a pattern comparable to newly
diagnosed liver metastases, but the mutation pattern of CTCs was
different from that of recurrent liver metastases. Future clinical
studies with reliable and reproducible sample collection with
standardized protocols are necessary to fully research the
prognostic potential of CTC cluster signatures in patients with
BCLM.
Supplementary Material
Supporting Data
Acknowledgements
The authors would like to express their appreciation
to the Department of Oncology, Affiliated Hospital of Southwest
Medical University, Luzhou, China, Tianjin Chase Sun Pharmaceutical
Co., Tianjin, China and Sichuan Provincial Center for Gynaecology
and Breast Disease, Luzhou, China for their financial support. The
authors thank patients who provided samples. We also wish to thank
the Nuclear Medicine, Pathology and Oncology department of
Southwest Medical University for their assistance in this project.
Part of the project's findings has been previously presented as a
poster in a conference of European Society for Medical Oncology
(ESMO)-Asia 2019 (Poster number; 42P). We also gratefully
acknowledge all authors and co-workers for their contributions.
Funding
The present study was supported in part by Major
Cultivation Projects of Achievement Transformation in Sichuan
Colleges and Universities (18CZ0043), Scientific Research
Foundation for Doctors of the Affiliated Hospital of Southwest
Medical University (20016), Natural Science Foundation of Tianjin
(19JCQNJC12500), Project funded by China Postdoctoral Science
Foundation (2019M661033) and Scientific Research Foundation for
Doctors of the Affiliated Hospital of Southwest Medical University
(18080).
Availability of data and materials
All the datasets generated and analyzed during the
present study are available from the corresponding author on
reasonable request.
Authors' contributions
LiZ and SI conceived the research idea and designed
the study. LiZ, LG, SL and JZ searched and collected the samples
and data. LeZ, QW and GC performed the radiology and pathology
analyses. SI, MM, and MDS implemented the WGS, omics-data and
bioinformatics analyses. LeZ and GC assisted in supervision of the
research. LiZ, SI, Lez and MDS were in charge of language revision.
All authors contributed to data discussion and analyses and revised
the manuscript as well as reviewed the manuscript. All authors read
and approved the manuscript and agree to be accountable for all
aspects of the research in ensuring that the accuracy or integrity
of any part of the work are appropriately investigated and
resolved.
Ethics approval and consent to
participate
The present study was approved by the Ethics
Committee/Institutional Review Board of the Department of Oncology,
Affiliated Hospital of Southwest Medical University (Luzhou,
Sichuan, China). Additionally, all patient-related procedures and
protocol were approved under the guidelines of the Declaration of
Helsinki. Prospective volunteers were informed in detail about the
purpose and procedure of the study and a written consent form was
collected from all participants before the study.
Patient consent for publication
Not applicable.
Competing interests
The authors declare that they have no competing
interests.
Glossary
Abbreviations
Abbreviations:
|
BCLM
|
breast cancer liver metastasis
|
|
MBC
|
metastatic breast cancer
|
|
CT
|
computed tomography
|
|
MRI
|
magnetic resonance imaging
|
|
PET
|
positron emission tomography
|
|
CNVs
|
copy number variations
|
|
WGS
|
whole genome sequencing
|
|
CTCs
|
circulating tumor cells
|
|
18F-FDG PET/CT
|
fluorine-18-fluorodeoxyglucose
positron emission tomography/computed tomography
|
|
CK
|
cytokeratin
|
|
MALBACs
|
multiple annealing and looping based
amplification cycles
|
|
AST
|
aspartate aminotransferase
|
|
ALT
|
alanine aminotransferase
|
|
ALP
|
alkaline phosphatase
|
|
PT
|
prothrombin time
|
|
EPCs
|
epithelial cells
|
|
gDNA
|
genomic DNA
|
|
SD
|
standard deviation
|
|
WGA
|
whole genome amplification
|
|
H&E
|
hematoxylin and eosin
|
|
SUV
|
standardized uptake value
|
|
HMMs
|
Hidden Markov Models
|
|
SUVmax
|
maximum-pixel SUV
|
|
qPCR
|
quantitative PCR
|
|
GSEA
|
gene set enrichment analysis
|
|
hBDs
|
human β-defensins
|
|
PPI
|
protein-protein interaction
|
References
|
1
|
Gerratana L, Fanotto V, Bonotto M,
Bolzonello S, Minisini AM, Fasola G and Puglisi F: Pattern of
metastasis and outcome in patients with breast cancer. Clin Exp
Metastasis. 32:125–133. 2015. View Article : Google Scholar : PubMed/NCBI
|
|
2
|
Bonotto M, Gerratana L, Poletto E, Driol
P, Giangreco M, Russo S, Minisini AM, Andreetta C, Mansutti M, Pisa
FE, et al: Measures of outcome in metastatic breast cancer:
Insights from a real-world scenario. Oncologist. 19:608–615. 2014.
View Article : Google Scholar : PubMed/NCBI
|
|
3
|
Bale R, Putzer D and Schullian P: Local
treatment of breast cancer liver metastasis. Cancers (Basel).
11:1–15. 2019. View Article : Google Scholar
|
|
4
|
Jung SY, Sereika SM, Linkov F, Brufsky A,
Weissfeld JL and Rosenzweig M: The effect of delays in treatment
for breast cancer metastasis on survival. Breast Cancer Res Treat.
130:953–964. 2011. View Article : Google Scholar : PubMed/NCBI
|
|
5
|
Ma R, Feng Y, Lin S, Chen J, Lin H, Liang
X, Zheng H and Cai X: Mechanisms involved in breast cancer liver
metastasis. J Transl Med. 13:642015. View Article : Google Scholar : PubMed/NCBI
|
|
6
|
Yoo B, Kavishwar A, Wang P, Ross A,
Pantazopoulos P, Dudley M, Moore A and Medarova Z: Therapy targeted
to the metastatic niche is effective in a model of stage IV breast
cancer. Sci Rep. 7:450602017. View Article : Google Scholar : PubMed/NCBI
|
|
7
|
Echeverria GV, Powell E, Seth S, Ge Z,
Carugo A, Bristow C, Peoples M, Robinson F, Qiu H, Shao J, et al:
High-resolution clonal mapping of multi-organ metastasis in triple
negative breast cancer. Nat Commun. 9:50792018. View Article : Google Scholar : PubMed/NCBI
|
|
8
|
Verma S, Kalita B, Bajaj S, Prakash H,
Singh AK and Gupta ML: A combination of podophyllotoxin and rutin
alleviates radiation-induced pneumonitis and fibrosis through
modulation of lung inflammation in mice. Front Immunol. 8:658–672.
2017. View Article : Google Scholar : PubMed/NCBI
|
|
9
|
Kimbung S, Loman N and Hedenfalk I:
Clinical and molecular complexity of breast cancer metastases.
Semin Cancer Biol. 35:85–95. 2015. View Article : Google Scholar : PubMed/NCBI
|
|
10
|
Liu ZJ, Semenza GL and Zhang HF:
Hypoxia-inducible factor 1 and breast cancer metastasis. J Zhejiang
Univ Sci B. 16:32–43. 2015. View Article : Google Scholar : PubMed/NCBI
|
|
11
|
Insua-Rodríguez J and Oskarsson T: The
extracellular matrix in breast cancer. Adv Drug Deliv Rev.
97:41–55. 2016. View Article : Google Scholar : PubMed/NCBI
|
|
12
|
Obeid E, Nanda R, Fu YX and Olopade OI:
The role of tumor-associated macrophages in breast cancer
progression (review). Int J Oncol. 43:5–12. 2013. View Article : Google Scholar : PubMed/NCBI
|
|
13
|
Irshad S, Flores-Borja F, Lawler K,
Monypenny J, Evans R, Male V, Gordon P, Cheung A, Gazinska P, Noor
F, et al: RORγt+ innate lymphoid cells promote lymph node
metastasis breast cancers. Cancer Res. 77:1083–1096. 2017.
View Article : Google Scholar : PubMed/NCBI
|
|
14
|
Silva S, Danson S, Teare D, Taylor F,
Bradford J, McDonagh AJG, Salawu A, Wells G, Burghel GJ, Brock I,
et al: Genome-wide analysis of circulating cell-free DNA copy
number detects active melanoma and predicts survival. Clin Chem.
64:1338–1346. 2018. View Article : Google Scholar : PubMed/NCBI
|
|
15
|
Gao Y, Ni X, Guo H, Su Z, Ba Y, Tong Z,
Guo Z, Yao X, Chen X, Yin J, et al: Single-cell sequencing
deciphers a convergent evolution of copy number alterations from
primary to circulating tumor cells. Genome Res. 27:1312–1322. 2017.
View Article : Google Scholar : PubMed/NCBI
|
|
16
|
Poell JB, Mendeville M, Sie D, Brink A,
Brakenhoff RH and Ylstra B: ACE: Absolute copy number estimation
from low-coverage whole-genome sequencing data. Bioinformatics.
35:2847–2849. 2019. View Article : Google Scholar : PubMed/NCBI
|
|
17
|
Xiao YB, Zhang B and Wu YL: Radiofrequency
ablation versus hepatic resection for breast cancer liver
metastasis: A systematic review and meta-analysis. J Zhejiang Univ
Sci B. 19:829–843. 2018. View Article : Google Scholar : PubMed/NCBI
|
|
18
|
Treska V, Cerna M, Kydlicek T and Treskova
I: Prognostic factors of breast cancer liver metastasis surgery.
Arch Med Sci. 11:683–685. 2015. View Article : Google Scholar : PubMed/NCBI
|
|
19
|
Mego M, Karaba M, Minarik G, Benca J,
Silvia J, Sedlackova T, Manasova D, Kalavska K, Pindak D,
Cristofanilli M, et al: Circulating tumor cells with
epithelial-to-mesenchymal transition phenotypes associated with
inferior outcomes in primary breast cancer. Anticancer Res.
39:1829–1837. 2019. View Article : Google Scholar : PubMed/NCBI
|
|
20
|
Arkadius P, Volkmar M, Jens H, Wolfgang J
and Tanja F: Circulating tumor cells in metastatic breast cancer:
Clinical relevance and biological potential. Curr Opin Obstet
Gynecol. 31:76–81. 2019. View Article : Google Scholar : PubMed/NCBI
|
|
21
|
Mansouri S, Mokhtari-Hesari P,
Naghavi-Al-Hosseini F, Majidzadeh-A K and Farahmand L: The
prognostic value of circulating tumor cells in primary breast
cancer prior to any systematic therapy: A systematic review. Curr
Stem Cell Res Ther. 14:519–529. 2019. View Article : Google Scholar : PubMed/NCBI
|
|
22
|
Loh J, Jovanovic L, Lehman M, Capp A,
Pryor D, Harris M, Nelson C and Martin J: Circulating tumor cell
detection in high-risk non-metastatic prostate cancer. J Cancer Res
Clin Oncol. 140:2157–2162. 2014. View Article : Google Scholar : PubMed/NCBI
|
|
23
|
Wang Y, Liu Y, Zhang L, Tong L, Gao Y, Hu
F, Lin PP, Li B and Zhang T: Vimentin expression in circulating
tumor cells (CTCs) associated with liver metastases predicts poor
progression-free survival in patients with advanced lung cancer. J
Cancer Res Clin Oncol. 145:2911–2920. 2019. View Article : Google Scholar : PubMed/NCBI
|
|
24
|
Duffy MJ, McDermott EW and Crown J:
Blood-based biomarkers in breast cancer: From proteins to
circulating tumor cells to circulating tumor DNA. Tumour Biol.
40:10104283187761692018. View Article : Google Scholar : PubMed/NCBI
|
|
25
|
Cristofanilli M, Pierga JY, Reuben J,
Rademaker A, Davis AA, Peeters DJ, Fehm T, Nolé F, Gisbert-Criado
R, Mavroudis D, et al: The clinical use of circulating tumor cells
(CTCs) enumeration for staging of metastatic breast cancer (MBC):
International expert consensus paper. Crit Rev Oncol Hematol.
134:39–45. 2019. View Article : Google Scholar : PubMed/NCBI
|
|
26
|
Bai L, Du Y, Peng J, Liu Y, Wang Y, Yang Y
and Wang C: Peptide-based isolation of circulating tumor cells by
magnetic nanoparticles. J Mater Chem B Mater Biol Med. 2:4080–4088.
2014. View Article : Google Scholar : PubMed/NCBI
|
|
27
|
Bailey PC and Martin SS: Insights on CTC
biology and clinical impact emerging from advances in capture
technology. Cells. 8:5532019. View Article : Google Scholar
|
|
28
|
Imani S, Cheng J, Mobasher-Jannat A, Wei
C, Fu S, Yang L, Jadidi K, Khosravi MH, Mohazzab-Torabi S,
Shasaltaneh MD, et al: Identification of a novel RPGRIP1 mutation
in an Iranian family with leber congenital amaurosis by exome
sequencing. J Cell Mol Med. 22:1733–1742. 2018. View Article : Google Scholar : PubMed/NCBI
|
|
29
|
Zong C, Lu S, Chapman AR and Xie XS:
Genome-wide detection of single-nucleotide and copy-number
variations of a single human cell. Science. 338:1622–1626. 2012.
View Article : Google Scholar : PubMed/NCBI
|
|
30
|
Kent WJ, Sugnet CW, Furey TS, Roskin KM,
Pringle TH, Zahler AM and Haussler D: The human genome browser at
UCSC. Genome Res. 12:996–1006. 2002. View Article : Google Scholar : PubMed/NCBI
|
|
31
|
Samur MK: RTCGAToolbox: A new tool for
exporting TCGA firehose data. PLoS One. 9:e1063972014. View Article : Google Scholar : PubMed/NCBI
|
|
32
|
Silva GO, Siegel MB, Mose LE, Parker JS,
Sun W, Perou CM and Chen M: SynthEx: A synthetic-normal-based DNA
sequencing tool for copy number alteration detection and tumor
heterogeneity profiling. Genome Biol. 18:662017. View Article : Google Scholar : PubMed/NCBI
|
|
33
|
Seiser EL and Innocenti F: Hidden markov
model-based CNV detection algorithms for illumina genotyping
microarrays. Cancer Inform. 13 (Suppl 7):77–83. 2015.PubMed/NCBI
|
|
34
|
Manzo A, Montanino A, Carillio G, Costanzo
R, Sandomenico C, Normanno N, Piccirillo MC, Daniele G, Perrone F,
Rocco G and Morabito A: Angiogenesis inhibitors in NSCLC. Int J Mol
Sci. 18:20212017. View Article : Google Scholar
|
|
35
|
Subramanian A, Tamayo P, Mootha VK,
Mukherjee S, Ebert BL, Gillette MA, Paulovich A, Pomeroy SL, Golub
TR, Lander ES and Mesirov JP: Gene set enrichment analysis: A
knowledge-based approach for interpreting genome-wide expression
profiles. Proc Natl Acad Sci USA. 102:15545–15550. 2005. View Article : Google Scholar : PubMed/NCBI
|
|
36
|
Mootha VK, Lindgren CM, Eriksson KF,
Subramanian A, Sihag S, Lehar J, Puigserver P, Carlsson E,
Ridderstråle M, Laurila E, et al: PGC-1alpha-responsive genes
involved in oxidative phosphorylation are coordinately
downregulated in human diabetes. Nat Genet. 34:267–273. 2003.
View Article : Google Scholar : PubMed/NCBI
|
|
37
|
Liu Y, Liu J, Lu J, Peng J, Juan L, Zhu X,
Li B and Wang Y: Joint detection of copy number variations in
parent-offspring trios. Bioinformatics. 32:1130–1137. 2016.
View Article : Google Scholar : PubMed/NCBI
|
|
38
|
Lu X, Ye K, Zou K and Chen J:
Identification of copy number variation-driven genes for liver
cancer via bioinformatics analysis. Oncol Rep. 32:1845–1852. 2014.
View Article : Google Scholar : PubMed/NCBI
|
|
39
|
Williams A, Balic M, Datar R and Cote R:
Size-based enrichment technologies for CTC detection and
characterization. Recent Results Cancer Res. 195:87–95. 2012.
View Article : Google Scholar : PubMed/NCBI
|
|
40
|
Che J, Yu V, Garon EB, Goldman JW and Di
Carlo D: Biophysical isolation and identification of circulating
tumor cells. Lab Chip. 17:1452–1461. 2017. View Article : Google Scholar : PubMed/NCBI
|
|
41
|
Krebs MG, Sloane R, Priest L, Lancashire
L, Hou JM, Greystoke A, Ward TH, Ferraldeschi R, Hughes A, Clack G,
et al: Evaluation and prognostic significance of circulating tumor
cells in patients with non-small-cell lung cancer. J Clin Oncol.
29:1556–1563. 2011. View Article : Google Scholar : PubMed/NCBI
|
|
42
|
van den Bos H, Bakker B, Spierings DCJ,
Lansdorp PM and Foijer F: Single-cell sequencing to quantify
genomic integrity in cancer. Int J Biochem Cell Biol. 94:146–150.
2018. View Article : Google Scholar : PubMed/NCBI
|
|
43
|
Khetrapal P, Lee MWL, Tan WS, Dong L, de
Winter P, Feber A and Kelly JD: The role of circulating tumour
cells and nucleic acids in blood for the detection of bladder
cancer: A systematic review. Cancer Treat Rev. 66:56–63. 2018.
View Article : Google Scholar : PubMed/NCBI
|
|
44
|
Payne K, Brooks J, Spruce R, Batis N,
Taylor G, Nankivell P and Mehanna H: Circulating tumour cell
biomarkers in head and neck cancer: Current progress and future
prospects. Cancers (Basel). 11:11152019. View Article : Google Scholar
|
|
45
|
Ortiz V and Yu M: Analyzing circulating
tumor cells one at a time. Trends Cell Biol. 28:764–775. 2018.
View Article : Google Scholar : PubMed/NCBI
|
|
46
|
Liu X, Wang J and Chen L: Whole-exome
sequencing reveals recurrent somatic mutation networks in cancer.
Cancer Lett. 340:270–276. 2013. View Article : Google Scholar : PubMed/NCBI
|
|
47
|
Ren T, Suo J, Liu S, Wang S, Shu S, Xiang
Y and Lang JH: Using low-coverage whole genome sequencing technique
to analyze the chromosomal copy number alterations in the
exfoliative cells of cervical cancer. J Gynecol Oncol. 29:e782018.
View Article : Google Scholar : PubMed/NCBI
|
|
48
|
Brouwer A, De Laere B, Peeters D, Peeters
M, Salgado R, Dirix L and Van Laere S: Evaluation and consequences
of heterogeneity in the circulating tumor cell compartment.
Oncotarget. 7:48625–48643. 2016. View Article : Google Scholar : PubMed/NCBI
|
|
49
|
Huang W, Skanderup AJ and Lee CG: Advances
in genomic hepatocellular carcinoma research. Gigascience. 7:1–13.
2018. View Article : Google Scholar
|
|
50
|
Scatena R, Bottoni P and Giardina B:
Circulating tumour cells and cancer stem cells: A role for
proteomics in defining the interrelationships between function,
phenotype and differentiation with potential clinical applications.
Biochim Biophys Acta. 1835:129–143. 2013.PubMed/NCBI
|
|
51
|
Salvianti F and Pinzani P: The diagnostic
potential of mutation detection from single circulating tumor cells
in cancer patients. Expert Rev Mol Diagn. 17:975–981. 2017.
View Article : Google Scholar : PubMed/NCBI
|
|
52
|
Salvianti F, Pazzagli M and Pinzani P:
Single circulating tumor cell sequencing as an advanced tool in
cancer management. Expert Rev Mol Diagn. 16:51–63. 2016. View Article : Google Scholar : PubMed/NCBI
|
|
53
|
Mohtar MA, Syafruddin SE, Nasir SN and Low
TY: Revisiting the roles of pro-metastatic EpCAM in cancer.
Biomolecules. 10:2552020. View Article : Google Scholar
|
|
54
|
de Wit S, van Dalum G, Lenferink AT, Tibbe
AG, Hiltermann TJ, Groen HJ, van Rijn CJ and Terstappen LW: The
detection of EpCAM(+) and EpCAM(−) circulating tumor cells. Sci
Rep. 5:122702015. View Article : Google Scholar : PubMed/NCBI
|
|
55
|
Adams DL, Martin SS, Alpaugh RK,
Charpentier M, Tsai S, Bergan RC, Ogden IM, Catalona W, Chumsri S,
Tang CM and Cristofanilli M: Circulating giant macrophages as a
potential biomarker of solid tumors. Proc Natl Acad Sci USA.
111:3514–3519. 2014. View Article : Google Scholar : PubMed/NCBI
|
|
56
|
Gires O and Stoecklein NH: Dynamic EpCAM
expression on circulating and disseminating tumor cells: Causes and
consequences. Cell Mol Life Sci. 71:4393–4402. 2014. View Article : Google Scholar : PubMed/NCBI
|
|
57
|
Grover PK, Cummins AG, Price TJ,
Roberts-Thomson IC and Hardingham JE: Circulating tumour cells: The
evolving concept and the inadequacy of their enrichment by
EpCAM-based methodology for basic and clinical cancer research. Ann
Oncol. 25:1506–1516. 2014. View Article : Google Scholar : PubMed/NCBI
|
|
58
|
Mikolajczyk SD, Millar LS, Tsinberg P,
Coutts SM, Zomorrodi M, Pham T, Bischoff FZ and Pircher TJ:
Detection of EpCAM-negative and cytokeratin-negative circulating
tumor cells in peripheral blood. J Oncol. 2011:2523612011.
View Article : Google Scholar : PubMed/NCBI
|
|
59
|
Yokobori T, Iinuma H, Shimamura T, Imoto
S, Sugimachi K, Ishii H, Iwatsuki M, Ota D, Ohkuma M, Iwaya T, et
al: Plastin3 is a novel marker for circulating tumor cells
undergoing the epithelial-mesenchymal transition and is associated
with colorectal cancer prognosis. Cancer Res. 73:2059–2069. 2013.
View Article : Google Scholar : PubMed/NCBI
|
|
60
|
Auman JT and McLeod HL: Colorectal cancer
cell lines lack the molecular heterogeneity of clinical colorectal
tumors. Clin Colorectal Cancer. 9:40–47. 2010. View Article : Google Scholar : PubMed/NCBI
|
|
61
|
Ghosh SK, McCormick TS and Weinberg A:
Human Beta defensins and cancer: Contradictions and common ground.
Front Oncol. 9:341–354. 2019. View Article : Google Scholar : PubMed/NCBI
|
|
62
|
Xu Z, Xu P, Fan W, Huang B, Cheng Q, Zhang
Z, Wang P and Yu M: The effect of an alternative chromosome 17
probe on fluorescence in situ hybridization for the assessment of
HER2 amplification in invasive breast cancer. Exp Ther Med.
18:2095–2103. 2019.PubMed/NCBI
|
|
63
|
Zubenko OS, Semeniuk DO, Starenka IO and
Pogribnyy PV: Effect of cytostatic agents on expression levels of
human beta-defensins-1-4 in A431 and MCF-7 cell lines. Exp Oncol.
40:79–81. 2018. View Article : Google Scholar : PubMed/NCBI
|
|
64
|
Shestakova T, Zhuravel E, Bolgova L,
Alekseenko O, Soldatkina M and Pogrebnoy P: Expression of human
beta-defensins-1, 2 and 4 mRNA in human lung tumor tissue: A pilot
study. Exp Oncol. 30:153–156. 2008.PubMed/NCBI
|
|
65
|
Joly S, Compton LM, Pujol C, Kurago ZB and
Guthmiller JM: Loss of human beta-defensin 1, 2, and 3 expression
in oral squamous cell carcinoma. Oral Microbiol Immunol.
24:353–360. 2009. View Article : Google Scholar : PubMed/NCBI
|
|
66
|
Prahl A, Pazgier M, Alexandratos J and
Lubkowski J: Human β-defensin 4 - defensin without the ‘twist’.
Postepy Biochem. 62:349–361. 2016.PubMed/NCBI
|
|
67
|
Markeeva N, Lisovskiy I, Lyzogubov V,
Usenko V, Soldatkina M, Merentsev S, Zaitsev S, Kondratskii Y,
Tofan A, Osinskiy S, et al: Expression of beta-defensin-2 in human
gastric tumors: A pilot study. Exp Oncol. 27:30–135. 2005.
|
|
68
|
Kida-Takaoka S, Yamaai T, Mizukawa N,
Murakami J and Iida S: Surrounding cells affect the gene expression
pattern of human beta-defensins in squamous cell carcinoma in
vitro. Anticancer Res. 34:6443–6449. 2014.PubMed/NCBI
|
|
69
|
Winter J, Kraus D, Reckenbeil J and
Probstmeier R: Oncogenic relevant defensins: Expression pattern and
proliferation characteristics of human tumor cell lines. Tumour
Biol. 37:7959–7966. 2016. View Article : Google Scholar : PubMed/NCBI
|