Introduction
Triple-negative breast cancer (TNBC) is a type of
breast cancer (BC) in which the expression of human epidermal
growth factor receptor 2 (HER2), progesterone receptor and
oestrogen receptor have all been deleted (1). TNBC is associated with distinct
clinical characteristics and molecular complexity compared with
other types of BCs (1). Typically,
prognosis for women with TNBC following metastatic recurrence is
poorer compared with those with other subtypes of BCs (2). Chemotherapy remains to be the
preferred systemic treatment for TNBC (3). Although subpopulations showing
effective response to chemotherapy can be identified, particularly
in those carrying BRCA1 mutations, the effectiveness of
chemotherapy is restricted in other subpopulations with TNBC
(4). A number of treatment
strategies have been previously developed for clinical
intervention, including platinum salts, poly ADP-ribose polymerase
inhibitors, immunological agents and mitogen-activated
extracellular signal-regulated kinase inhibitors (5–7). Among
these, although a number of predictive biomarkers, including
O6-methylguanine DNA methyltransferase (8), isocitrate dehydrogenase (9), epidermal growth factor receptor
(10) and phosphatase and tensin
homolog (11), have been
identified, though suitable molecular features for optimizing
personalized treatment strategies for individual patients remain
insufficient (12).
Accumulating evidence has demonstrated high
heterogeneity within TNBC tumors, which is one of the main causes
of recurrence and resistance (13,14). A
number of previous studies have applied the use of gene expression
profiles in classifying TNBCs, which can offer relevant clinical
information (15,16). For example, platinum-based
chemotherapy can be used for patients carrying breast cancer (BRCA)
1 and BRCA2 mutations. Harano et al (17) previously recognized six TNBC
subtypes based on gene expression profiles, where the
immunomodulatory subtype was frequently observed during processes
involving immunocytes. In another study, Bonsang-Kitzis et
al (18) classified six TNBC
subgroups on the basis of gene selection driven by the biological
network, where two immunity clusters were included and a gene
signature was constructed based on the stromal immune module. In
addition, Burstein et al (19) previously recognized four TNBC
subtypes with high stability on the basis of mRNA expression and
DNA genomic profile data: i) Mesenchymal; ii) luminal/androgen
receptor; iii) basal-like immune activated; and iv) basal-like
immune suppressed. Based on this classification, Burstein et
al (19) also proposed
candidate treatment targets for the aforementioned subtypes. The
TNBC classification strategies aforementioned have contributed to
laying the foundations for developing targeted TNBC treatments.
The reprogramming of energy metabolism can serve as
a hallmark in cancer physiology, making it possible for cancer
cells to produce ATP whilst maintaining redox balance and
macromolecular biosynthesis, processes that are necessary for cell
proliferation, growth, migration, drug resistance and angiogenesis
(20). It has been previously
suggested that a large number of cancer types divert their energy
metabolism towards the glycolytic pathway, resulting in the
excessive production of lactate even under normoxic conditions, in
a phenomenon known as the Warburg effect (21,22).
Compared with non-malignant cells, cancer cells generally prefer
incomplete and non-oxidative glucose metabolism (22). Although glucose has been accepted as
a major source of energy in tumor cells, there is growing consensus
regarding the heterogeneity of metabolic phenotypes in tumors. A
portion of cancer cells prefer glycolysis, whilst other tumor cell
types can bias towards oxidative phosphorylation (OXPHOS) (23,24).
In addition, there is an increasing number of reports revealing the
presence of metabolic symbiosis between oxidative and glycolytic
cancer cells. For instance, pyruvate and lactate produced by
glycolysis can be transferred and utilized to become substrates of
the tricarboxylic acid cycle (TCA) and for ATP production by
neighboring tumor cells (25).
Likewise, malignant cancer cells can absorb ketone bodies and free
fatty acids generated through catabolic cells in their vicinity,
thereby accelerating mitochondrial OXPHOS (26). Glutamine has also been reported to
be metabolized by cancer cells through the TCA cycle for energy
production under hypoxic conditions or those under glucose
deficiency (27). Therefore, an
extensive understanding of energy metabolism in different types of
cancer cells can promote the development of novel therapeutic
strategies.
Catabolic pathways have been previously reported to
participate in energy metabolism in TNBC cells, which exhibit high
OXPHOS rates and are not responsive to glycolytic inhibitors. Under
normoxic conditions, TNBCs generally prefer OXPHOS to glycolysis,
whilst under hypoxic conditions, TNBCs generally prefer glycolysis
(28). Tumor stem cells do not
display glycolytic phenotypes compared with those of the
differentiated progeny cells for TNBC (29,30).
Previous studies have indicated that fatty acids can also be
utilized by TNBC cells as substrates for energy production
(31,32). Inhibiting the β-oxidation of fatty
acids can reduce cancer cell proliferation in myc-overexpressing
TNBC (31). However, the
association between the local metabolic state and its prognostic
significance in patients with TNBC remain unknown at present.
The present study aimed to investigate the
expression profiles of genes associated with energy metabolism,
together with their clinical significance in patients with TNBC,
based on data obtained from the gene expression omnibus (GEO) and
The Cancer Genome Atlas (TCGA) databases. Patients were divided
into four groups based on differential gene expression patterns,
where these four groups exhibited significant differences in terms
of prognosis, immunological and molecular features. A signature
based on energy metabolism was subsequently constructed to assess
TNBC patient prognosis based on the TCGA dataset, which was then
verified using the GEO dataset. This signature showed close
association with patient survival, suggesting that it can be used
as an independent prognostic factor. These findings revealed that
the energy metabolic state is closely associated with the clinical
prognosis of TNBC.
Materials and methods
Pre-processing of initial sample
information
In total, 1097 BC samples were collected from the
TCGA database for analysis, from which 191 samples that were
negative for ‘HER2’, ‘progesterone’ and ‘estrogen receptor
expression’ were screened using the three key words. A total of 177
samples with disease free survival (DFS) >30 days was then
obtained from the 191 samples. In addition, two GEO datasets
[GSE58812 (33) and GSE21653
(34)] were extracted from NCBI
database, which were then normalized according to the robust
multichip average (RMA) method (35). The GSE21653 dataset included 87 TNBC
cases, whilst the GSE58812 dataset included 107 TNBC cases. Of
note, 2 cases were excluded due to the lack of prognostic
information in the GSE21653 dataset. Following series data
preprocessing aforementioned, 369 samples, including 177 from the
TCGA training set and 192 from the GEO validation set, were
acquired for further analysis. Using following three keywords
‘metabolism’, ‘TCA’ and ‘glycogen’, the expression profiles of 594
genes associated with energy metabolism were extracted from the
Reactome database (36) based on
the related metabolic pathways (Table
I). Table II displays the
sample clinicopathological features of the samples.
 | Table I.Gene sets related to energy
metabolism extracted from the Reactome database. |
Table I.
Gene sets related to energy
metabolism extracted from the Reactome database.
| Metabolic pathways
from the Reactome | Pathway ID | Gene count |
|---|
| Biological
oxidations | R-HSA-211859 | 221 |
| Metabolism of
carbohydrates | R-HSA-71387 | 292 |
| Mitochondrial fatty
acid beta-oxidation | R-HSA-77289 | 38 |
| Glycogen
synthesis | R-HSA-3322077 | 16 |
| Glycogen
metabolism | R-HSA-8982491 | 27 |
| Glucose
metabolism | R-HSA-70326 | 92 |
| Glycogen breakdown
(glycogenolysis) | R-HSA-70221 | 15 |
| Glycolysis | R-HSA-70171 | 72 |
| Pyruvate
metabolism | R-HSA-70268 | 31 |
| Pyruvate metabolism
and citric acid (TCA) cycle | R-HSA-71406 | 55 |
| Citric acid cycle
(TCA cycle) | R-HSA-71403 | 22 |
| Sum | 881 (unique:
594) |
|
| Table II.Clinicopathological features of the
samples after series data pre-processing. |
Table II.
Clinicopathological features of the
samples after series data pre-processing.
| Characteristic | TCGA datasets
(n=177) | GSE21653
(n=85) | GSE58812
(n=107) |
|---|
| Age (years) |
|
|
|
|
≤60 | 118 | 50 | 64 |
|
>60 | 59 | 35 | 43 |
| Survival
status |
|
|
|
|
Living | 150 | 58 | 78 |
|
Deceased | 27 | 27 | 29 |
| Gender |
|
|
|
|
Female | 177 | 85 | 107 |
|
Male | 0 | 0 | 0 |
| T |
|
|
|
| T1 | 45 | 16 | – |
| T2 | 110 | 45 | – |
| T3 | 14 | 23 | – |
| T4 | 7 | 0 | – |
| N |
|
|
|
| N0 | 105 | 51 | – |
| N1 | 45 | 33 | – |
| N2 | 15 | 0 | – |
| N3 | 10 | 0 | – |
| M |
|
|
|
| M0 | 154 | – | – |
| M1 | 1 | – | – |
| MX | 21 | – | – |
| Tumor stage |
|
|
|
| Stage
I | 31 | – | – |
| Stage
II | 109 | – | – |
| Stage
III | 32 | – | – |
NMF (Negative matrix factorization)
clustering
NMF clustering was performed to identify stable
sample clusters based on 50 iterations according to the Brunet
method (37) using genes associated
with energy metabolism. In addition, the cluster number,
represented by k, was set as 2–10, whilst the best cluster number
was calculated based on the cluster cophenetic correlation and the
observed consensus map. The mean silhouette width of the consensus
membership matrix was determined using the ‘NMF’ function in the R
package (version 3.5.3; http://bioconductor.org/biocLite.R). For every member,
the lowest cluster number for each member was set as 10. Maftools
v1.6.15 from the R package was used to analyze the gene mutation
profiles within the TNBC case clusters. The tumor immune estimation
resource (TIMER; http://cistrome.shinyapps.io/timer/) was applied to
calculate the scores of immune cell infiltration within the TNBC
clusters (38).
Identification of gene signature
Differentially expressed genes (DEGs) associated
with energy metabolism in the TCGA training set (n=177) first
underwent univariate survival analysis by using the ‘survival coxph
function’ in the R package to investigate the genes linked to
patient prognosis and survival. Typically, a difference of
P<0.05 was considered to indicate a statistically significant
difference. The significant genes were subsequently screened by
multivariate Cox proportional hazards regression, using regional
lymph nodes (N) and tumor size (T) as covariants for the model and
P<0.05 as threshold for significance. Prognostic genes
recognized using the glmnet of R package (family=‘cox’; nλ=100;
α=1) were then refined using lasso Cox regression (39), which was appropriate for the
regression analysis of high-dimensional data. By using the
regularization coefficient of machine learning (λ, also known as
penalty coefficient), the number of variables when the cross
validation error is minimum was found. DESeq2 (40) was then used for calculating DEGs
that participated in energy metabolism by applying the thresholds
of false discovery rate (FDR) <0.05 and |log2 fold
change|>1. The R package cluster profile (41) was subsequently used to perform
enrichment analysis of the DEGs by turning them to ENTREZID.
Afterwards, the ENTREZIDs were enriched using the enrich Kyoto
Encyclopedia of Genes and Genomes pathways (KEGG) and the enrich
gene ontology (GO) functions by applying the P<0.05 threshold.
Using the enrichment map software from Cytoscape (version 3.8.0;
http://cytoscape.org/) (42), a visualization of the enrichment
results was then obtained. By applying the coefficients obtained
from lasso Cox regression analysis and expression value of each
gene, a specific risk signature was finally constructed, the
formula of which was shown below:
Risk score=0.051 × IL1RL2 + 0.012 × FBLN7 + 0.01 ×
CA3 + 0.146 × PDE1B + 0.01 × SLURP1 + 0.002 × CILP + 0.011 × AQP7 +
0.003 × TPSB.
The risk score values of all patients in the TCGA
training set were determined based on linear combination with the
expression of signature-related genes weighted according to the
corresponding regression coefficients. The regression coefficients
from the training set were then applied into the GEO validation set
for risk score calculation.
Multiple regression analyzes, gene set
enrichment analysis (GSEA) and gene ontology (GO) analysis
GO analysis was performed to annotate the major
functions of the DEGs using the Database for Annotation,
Visualization and Integrated Discovery online tool v6.8 (version
6.8; http://david.ncifcrf.gov/). The
statistically different genes identified between high risk and low
risk groups, which were classified according to the median risk
score values, were using the GSEA v7.1 software (MSigDB; http://software.broadinstitute.org/gsea/msigdb/index.jsp)
(43). Multiple regression analyses
were performed to determine the association between the clinical
features and the risk score values, which were displayed as forest
plots and nomograms.
Statistical analysis
All cases were classified into high-risk or low-risk
groups according to the median risk score value. Differences in
disease-free survival (DFS) between the two groups were evaluated
using Kaplan-Meier combined with a two-sided log-rank test.
Differences in the pathological characteristics between the two
groups were compared using χ2 test. Multivariate and
univariate cox regression analyses were performed for identifying
the independent prognosis factors. Lasso regression was used for
narrowing the number of genes. ROC curve was used to test the
sensitivity and specificity of risk score model and to calculate
the cutoff value using Youden's index (44). R or SPSS version 19.0 software (IBM
Corp.) was used for all statistical analyses. P<0.05 was
considered to indicate a statistically significant difference.
Results
Molecular subtypes on the basis of
different genes associated with energy metabolism
To examine the state of energy metabolism in TNBC, a
total of 369 cases including available clinical data and RNA
sequencing profiles were acquired from the GEO and TCGA databases.
In addition, one separate gene set containing 594 genes that were
associated with energy metabolism was also collected from the
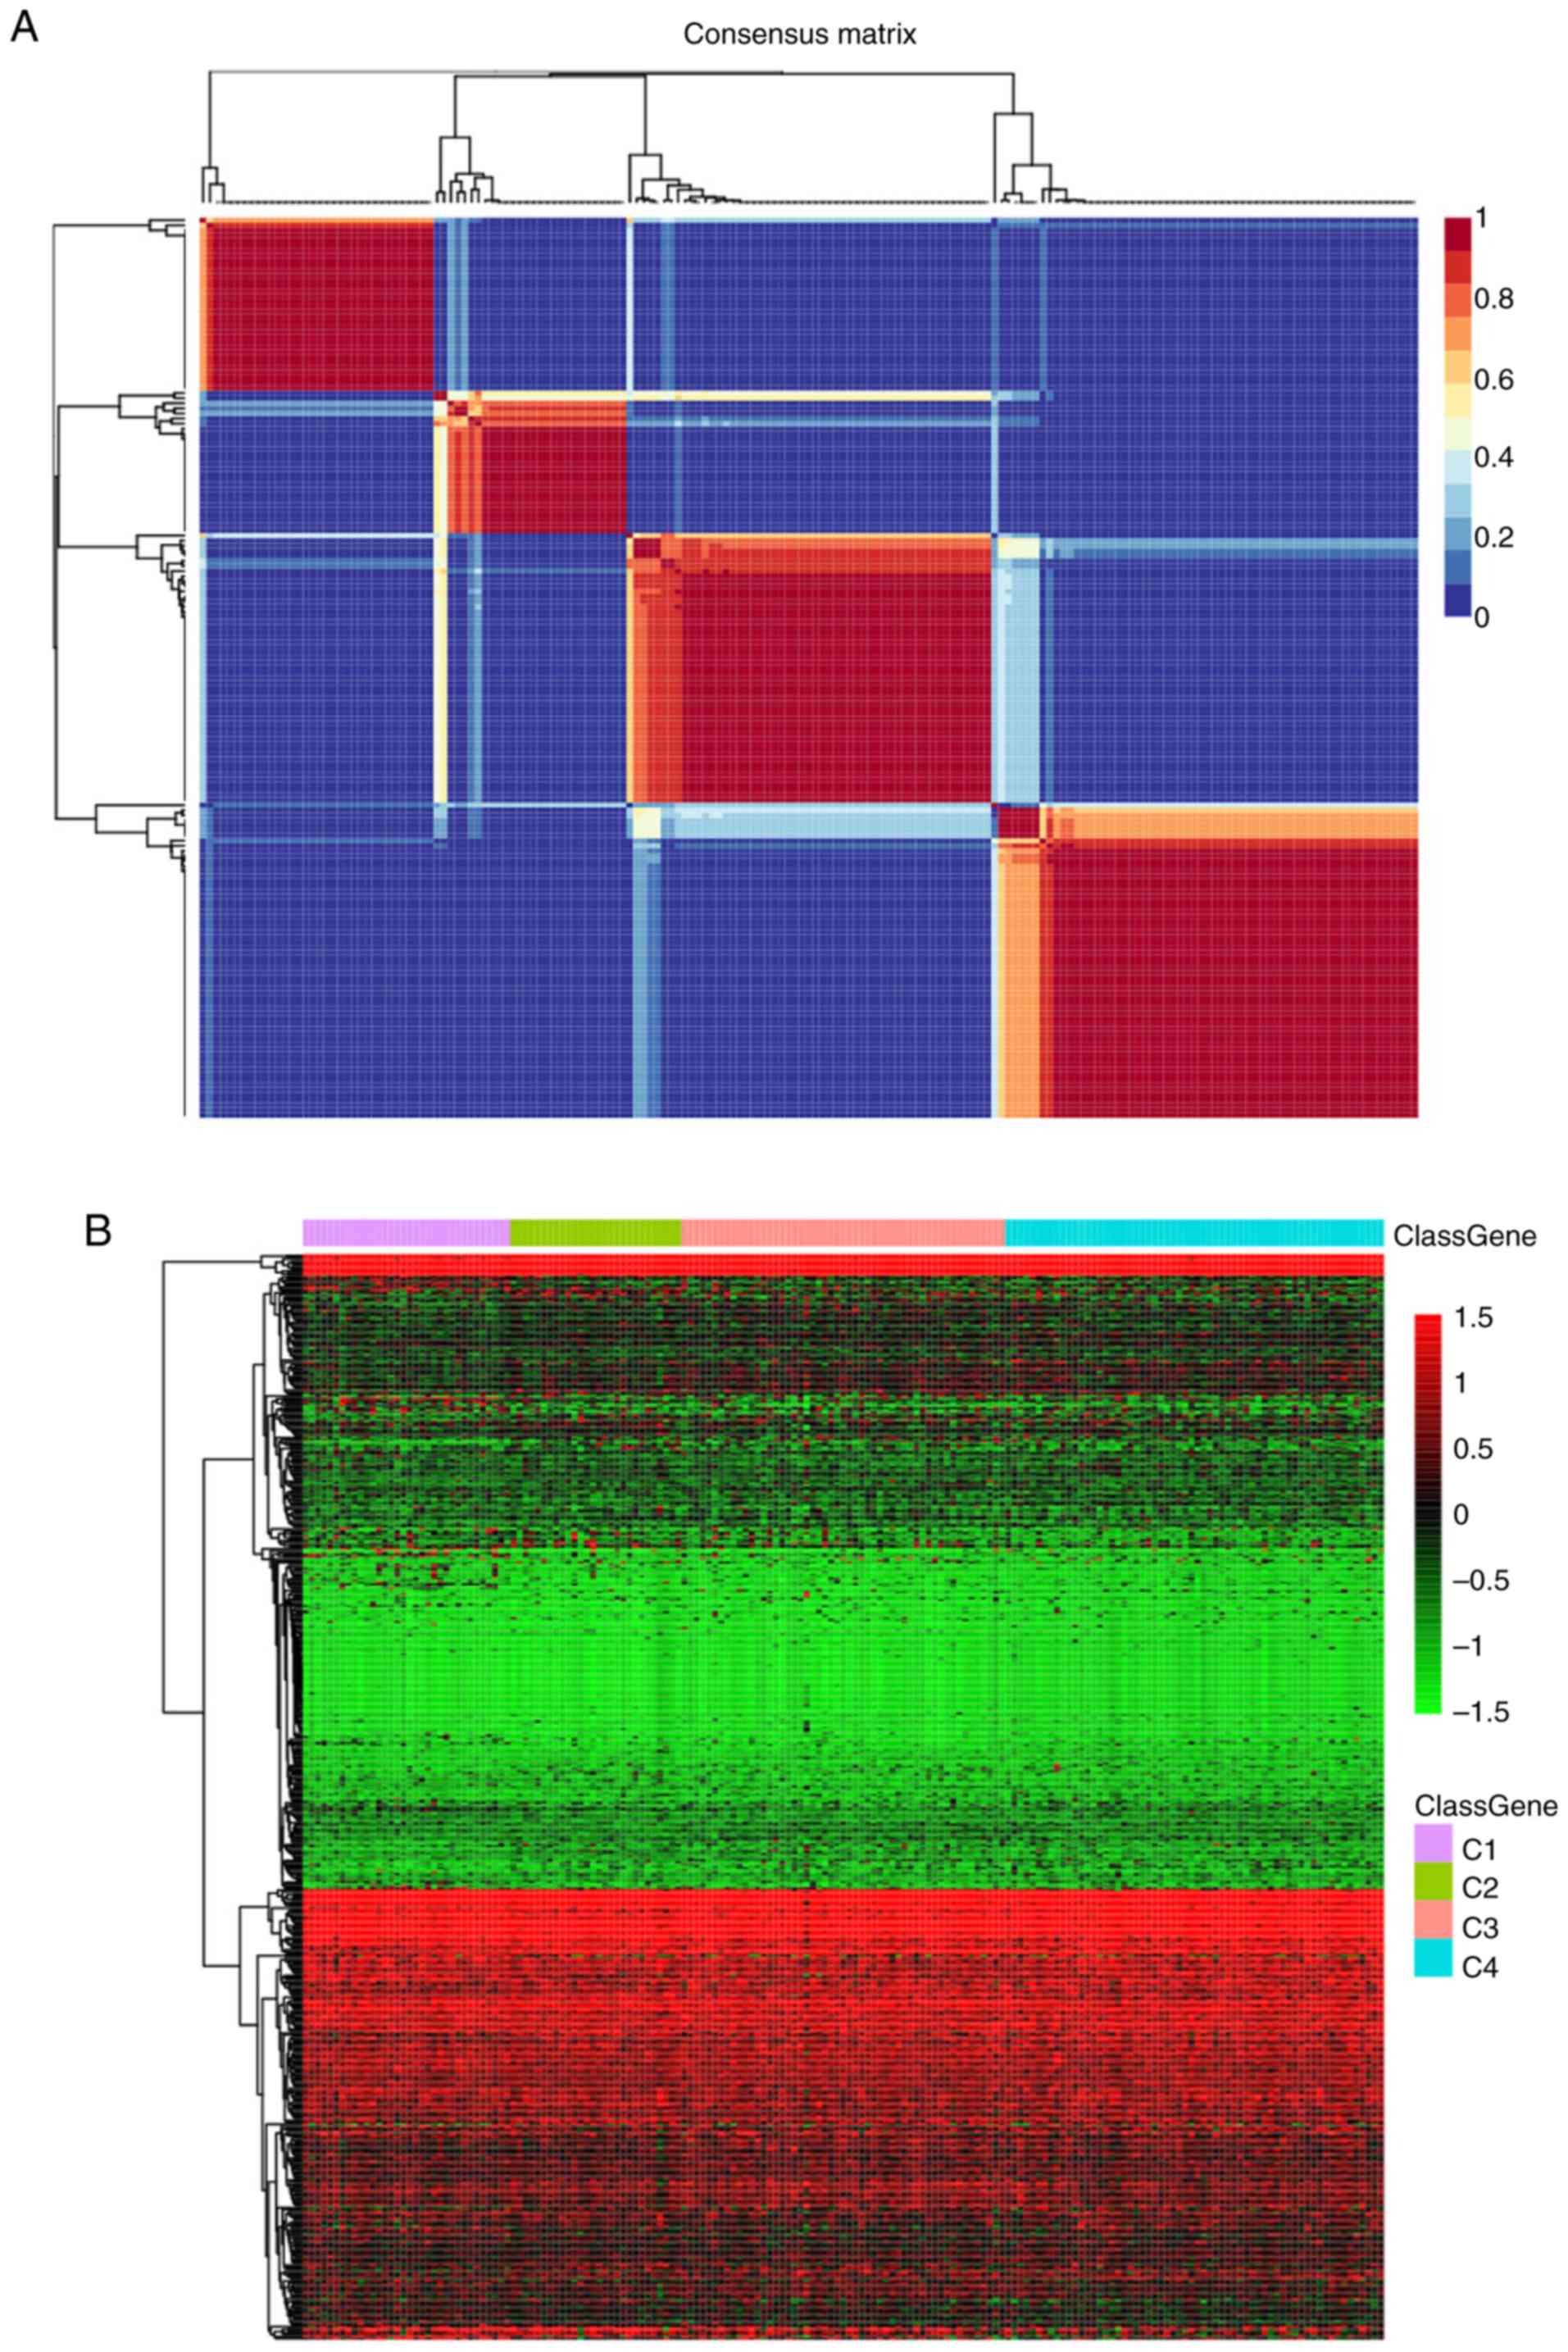
Reactome database. The NMF algorithm was applied for clustering the
TNBC cases, where the best k number was calculated to be 4 based on
silhouette, dispersion and cophenetic analyses (Fig. 1A). The expression levels of genes
associated with energy metabolism across the four subtypes are
displayed in Fig. 1B, where the
expression profiles of some genes were shown to be heterogenous
across the different subtypes. Prognosis among the patients within
the four subtypes was subsequently examined. Subtype C2 exhibited
the poorest prognosis, such that subtypes C1, C3 and C4 all
exhibited markedly superior prognoses compared with those in the C2
subtype (log rank P=0.06; Fig.
1C).
Differences in the aforementioned four TNBC case
clusters was measured. Firstly, associations of the TNBC mutation
profiles with each of the four sub-classifications were examined
using maftools v1.6.15 from R package. After the synonymous
mutations were eliminated, the missense and nonsense gene mutations
were obtained. The overall heterogeneity in mutation frequency
among the different subtypes was found to be of statistical
significance (Fig. 1D).
Subsequently, differences in the clinicopathological
characteristics, including age, TNM and stage, were compared among
the four subtypes. The differences in the clinicopathological
features among the four TNBC subtypes were not found to be
statistically significant (Table
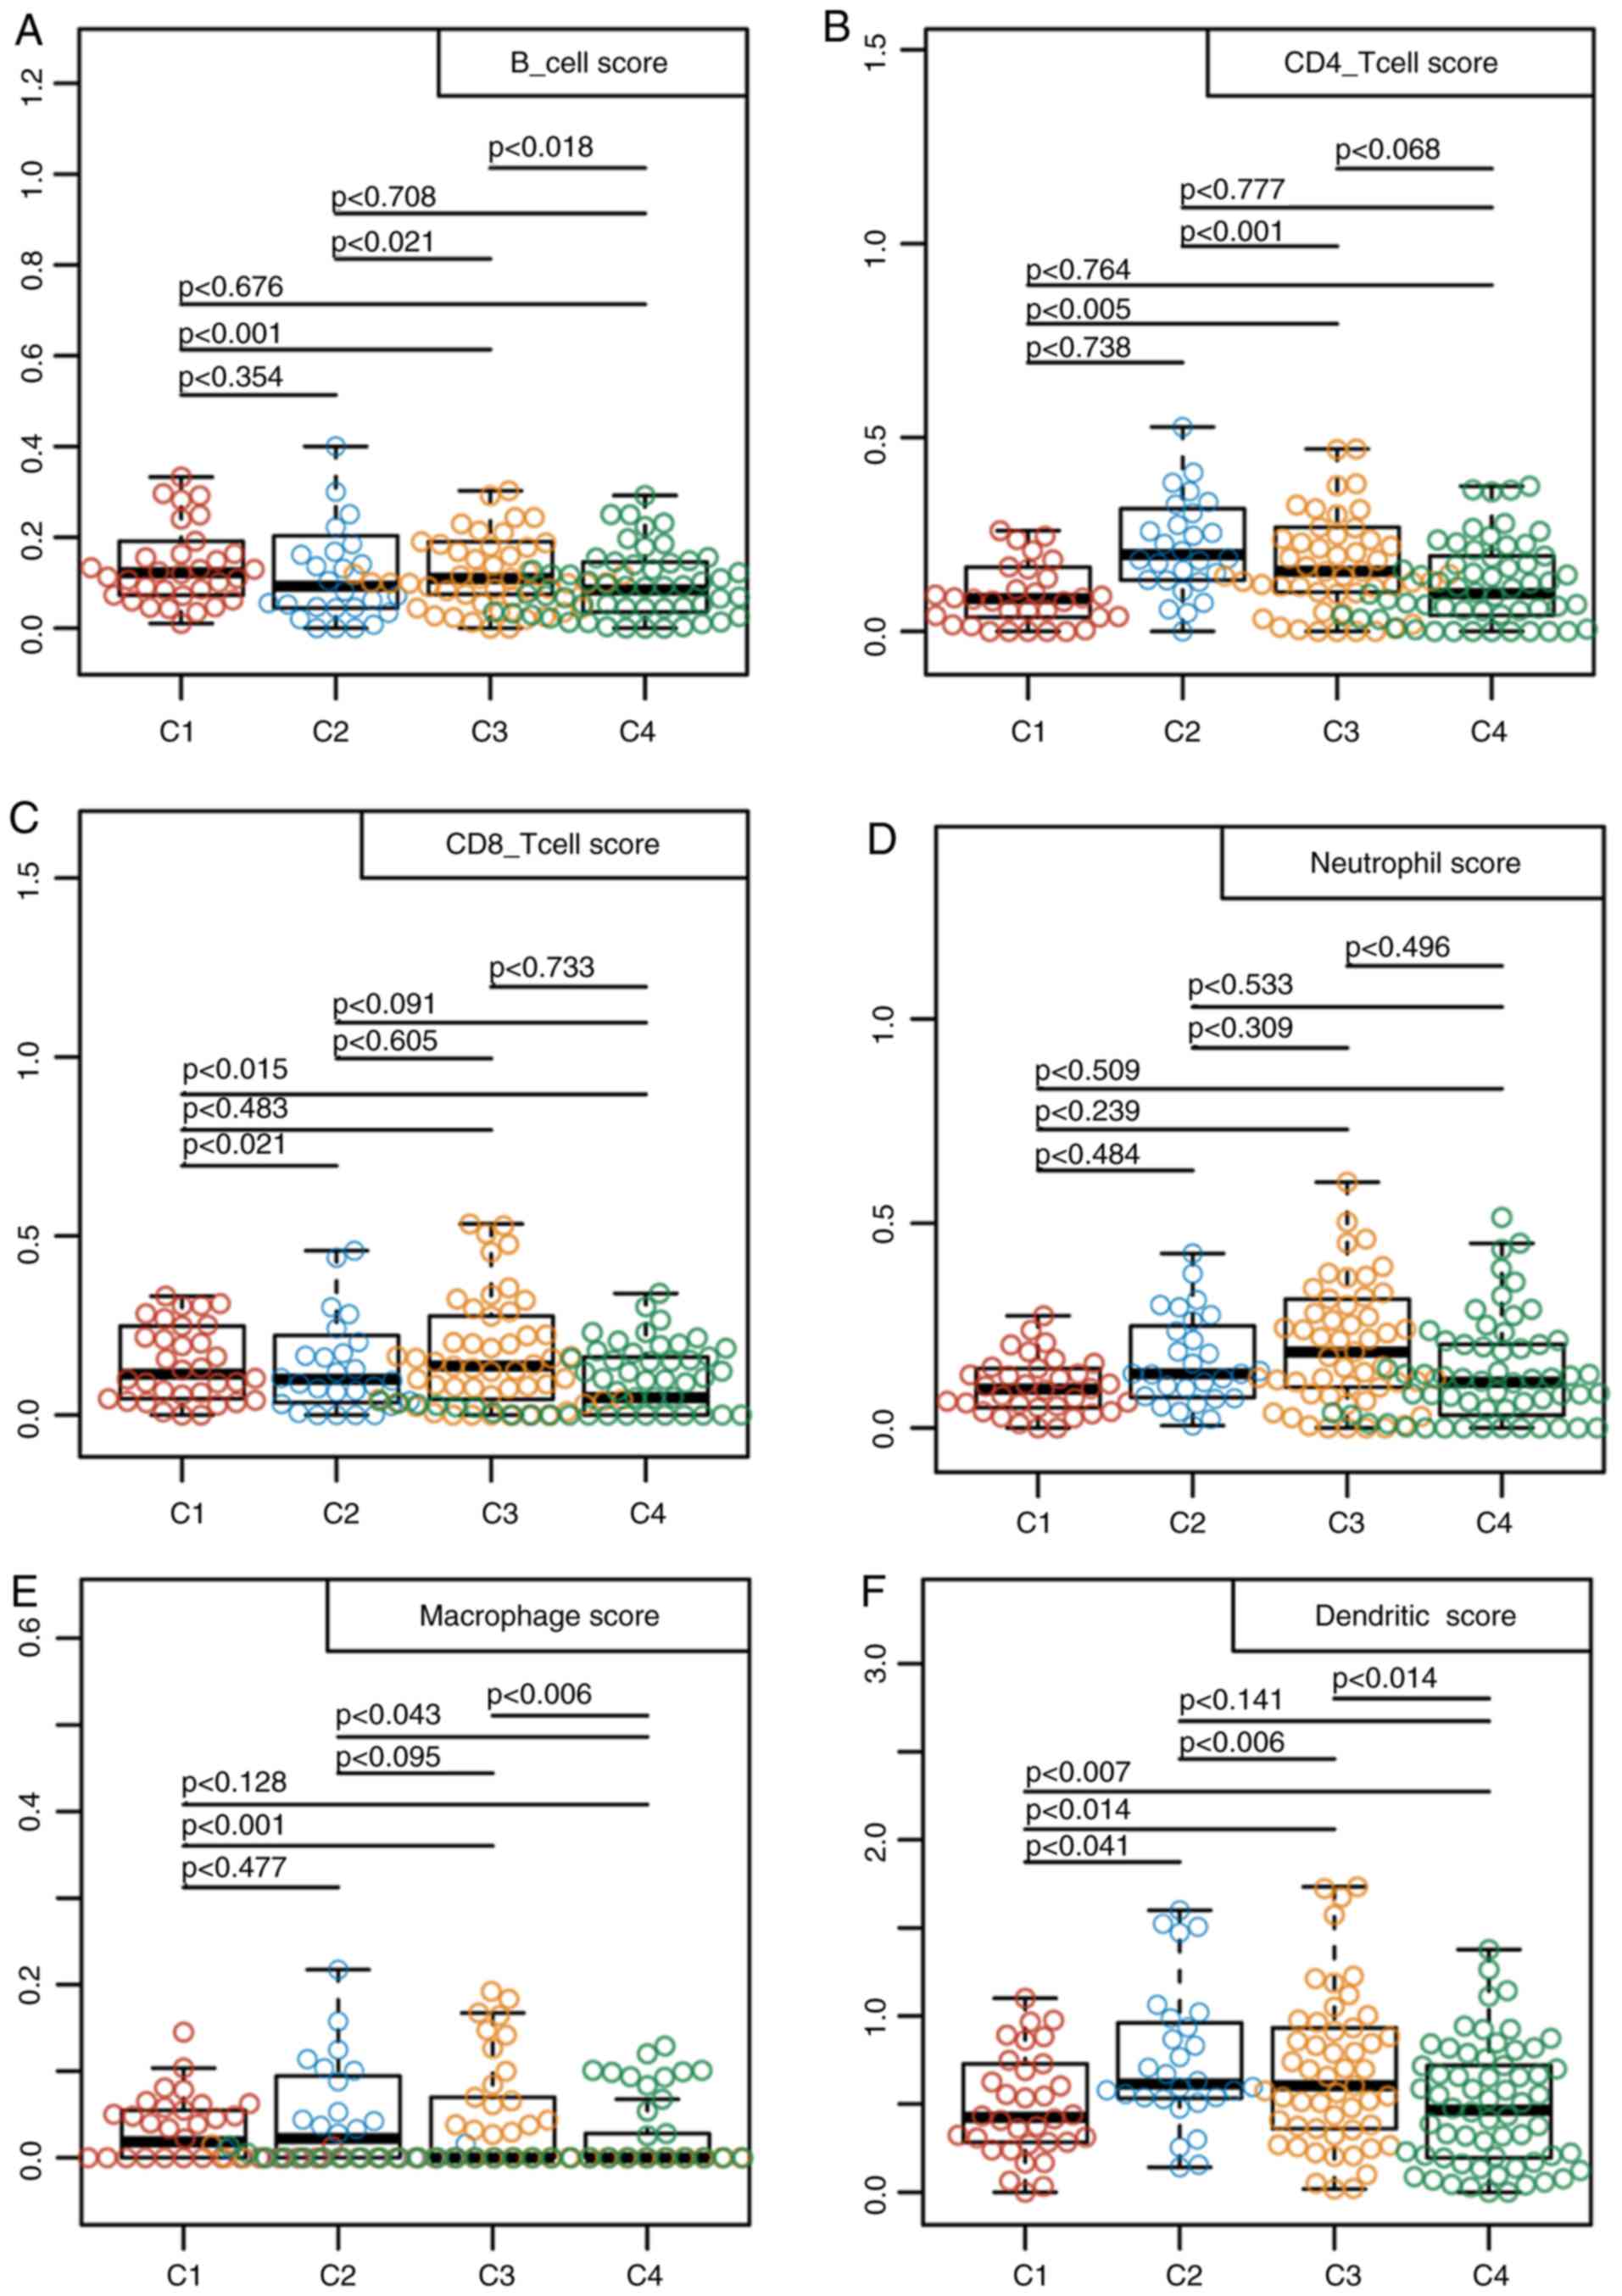
III). In addition, samples from these 4 subtypes were analyzed
using the TIMER method. The scores in terms of the three types of
immune cells, including dendritic cells, macrophages and CD4 T
cells were found to be higher in samples from the C2 subtype
compared with those from the other subtypes (Fig. 2). These findings suggested that the
immune microenvironment or the degree of immunocyte infiltration in
TNBC was associated with patient prognosis. In addition, the
expression profiles of genes associated with energy metabolism
displayed close association with the clinical characteristics and
patient prognosis in TNBC.
| Table III.Clinicopathological features among
the four triple-negative breast cancer subtypes. |
Table III.
Clinicopathological features among
the four triple-negative breast cancer subtypes.
| Clinical
features | C1 | C2 | C3 | C4 | P-value |
|---|
| Outcome |
|
|
|
| 0.130 |
|
Alive | 28 | 20 | 48 | 54 |
|
|
Deceased | 6 | 8 | 5 | 8 |
|
| T |
|
|
|
| 0.078 |
| T1 | 8 | 10 | 16 | 11 |
|
| T2 | 20 | 14 | 30 | 46 |
|
| T3 | 3 | 1 | 6 | 4 |
|
| T4 | 3 | 3 | 1 | 0 |
|
| N |
|
|
|
| 0.058 |
| N0 | 14 | 19 | 33 | 39 |
|
| N1 | 8 | 4 | 15 | 18 |
|
| N2 | 6 | 1 | 5 | 3 |
|
| N3 | 4 | 4 | 0 | 2 |
|
| Stage |
|
|
|
| 0.061 |
| I | 5 | 8 | 10 | 8 |
|
| II | 17 | 12 | 35 | 45 |
|
|
III | 11 | 8 | 7 | 6 |
|
| Gender |
|
|
|
| – |
|
Female | 34 | 28 | 53 | 62 |
|
|
Male | 0 | 0 | 0 | 0 |
|
| Age |
|
|
|
| 0.686 |
|
≤60 | 20 | 19 | 35 | 44 |
|
|
>60 | 14 | 9 | 18 | 18 |
|
Identification of the prognostic
signature associated with energy metabolism for TNBC
To examine the relationship between the expression
profiles of genes associated with energy metabolism and the TNBC
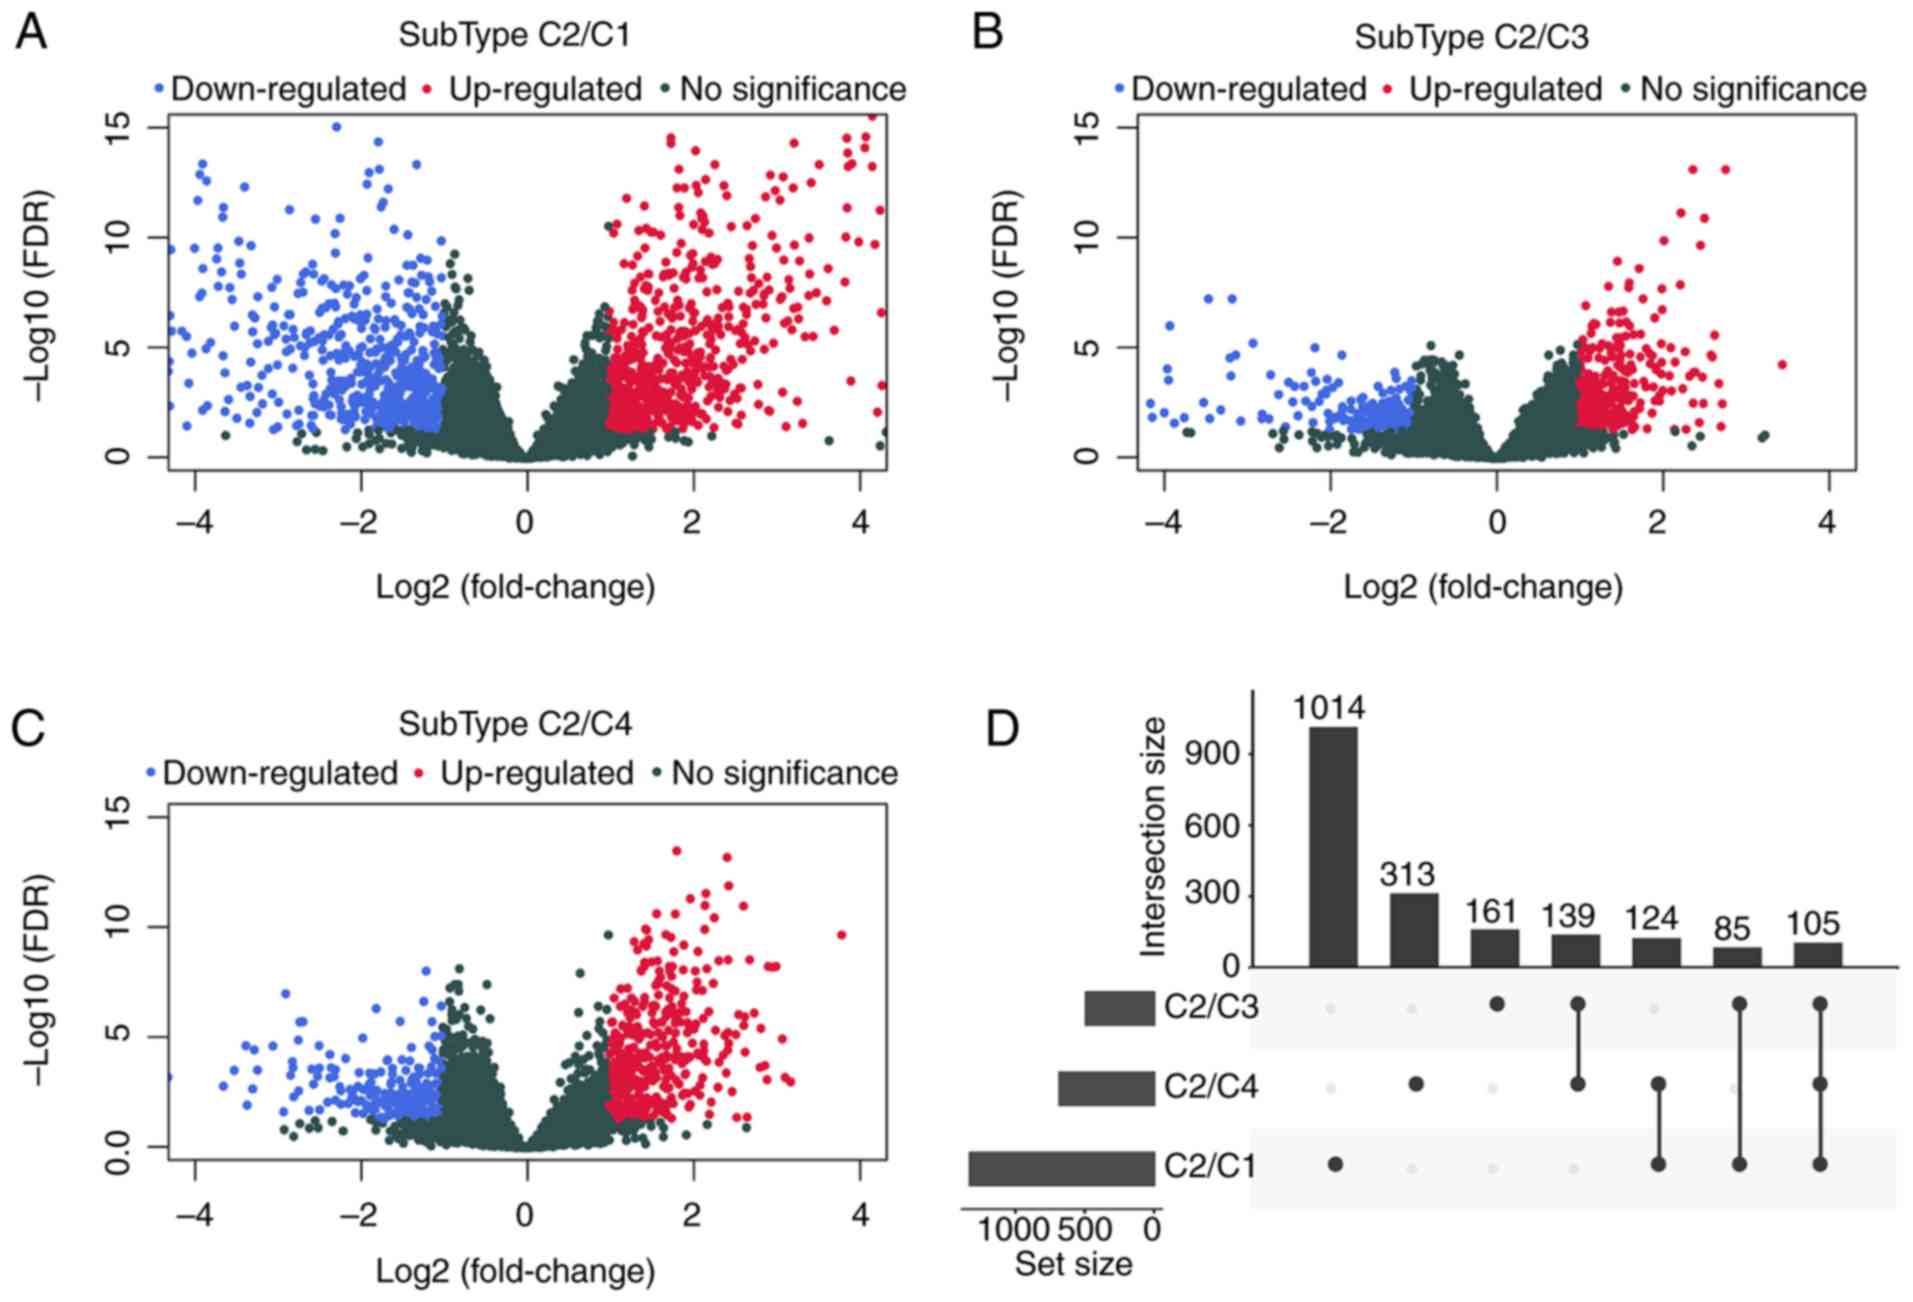
prognosis, DESeq2 was used for calculating DEGs that participated
in energy metabolism between samples from the C2 subtype, which had
the poorest prognosis and those in the C1, C3 or C4 subtypes, by
applying the thresholds of FDR <0.05 and |log2 fold
change|>1. Data shown in Fig. 3
and Table IV suggested that a
total of 1941 DEGs were identified between the subtype C2 samples
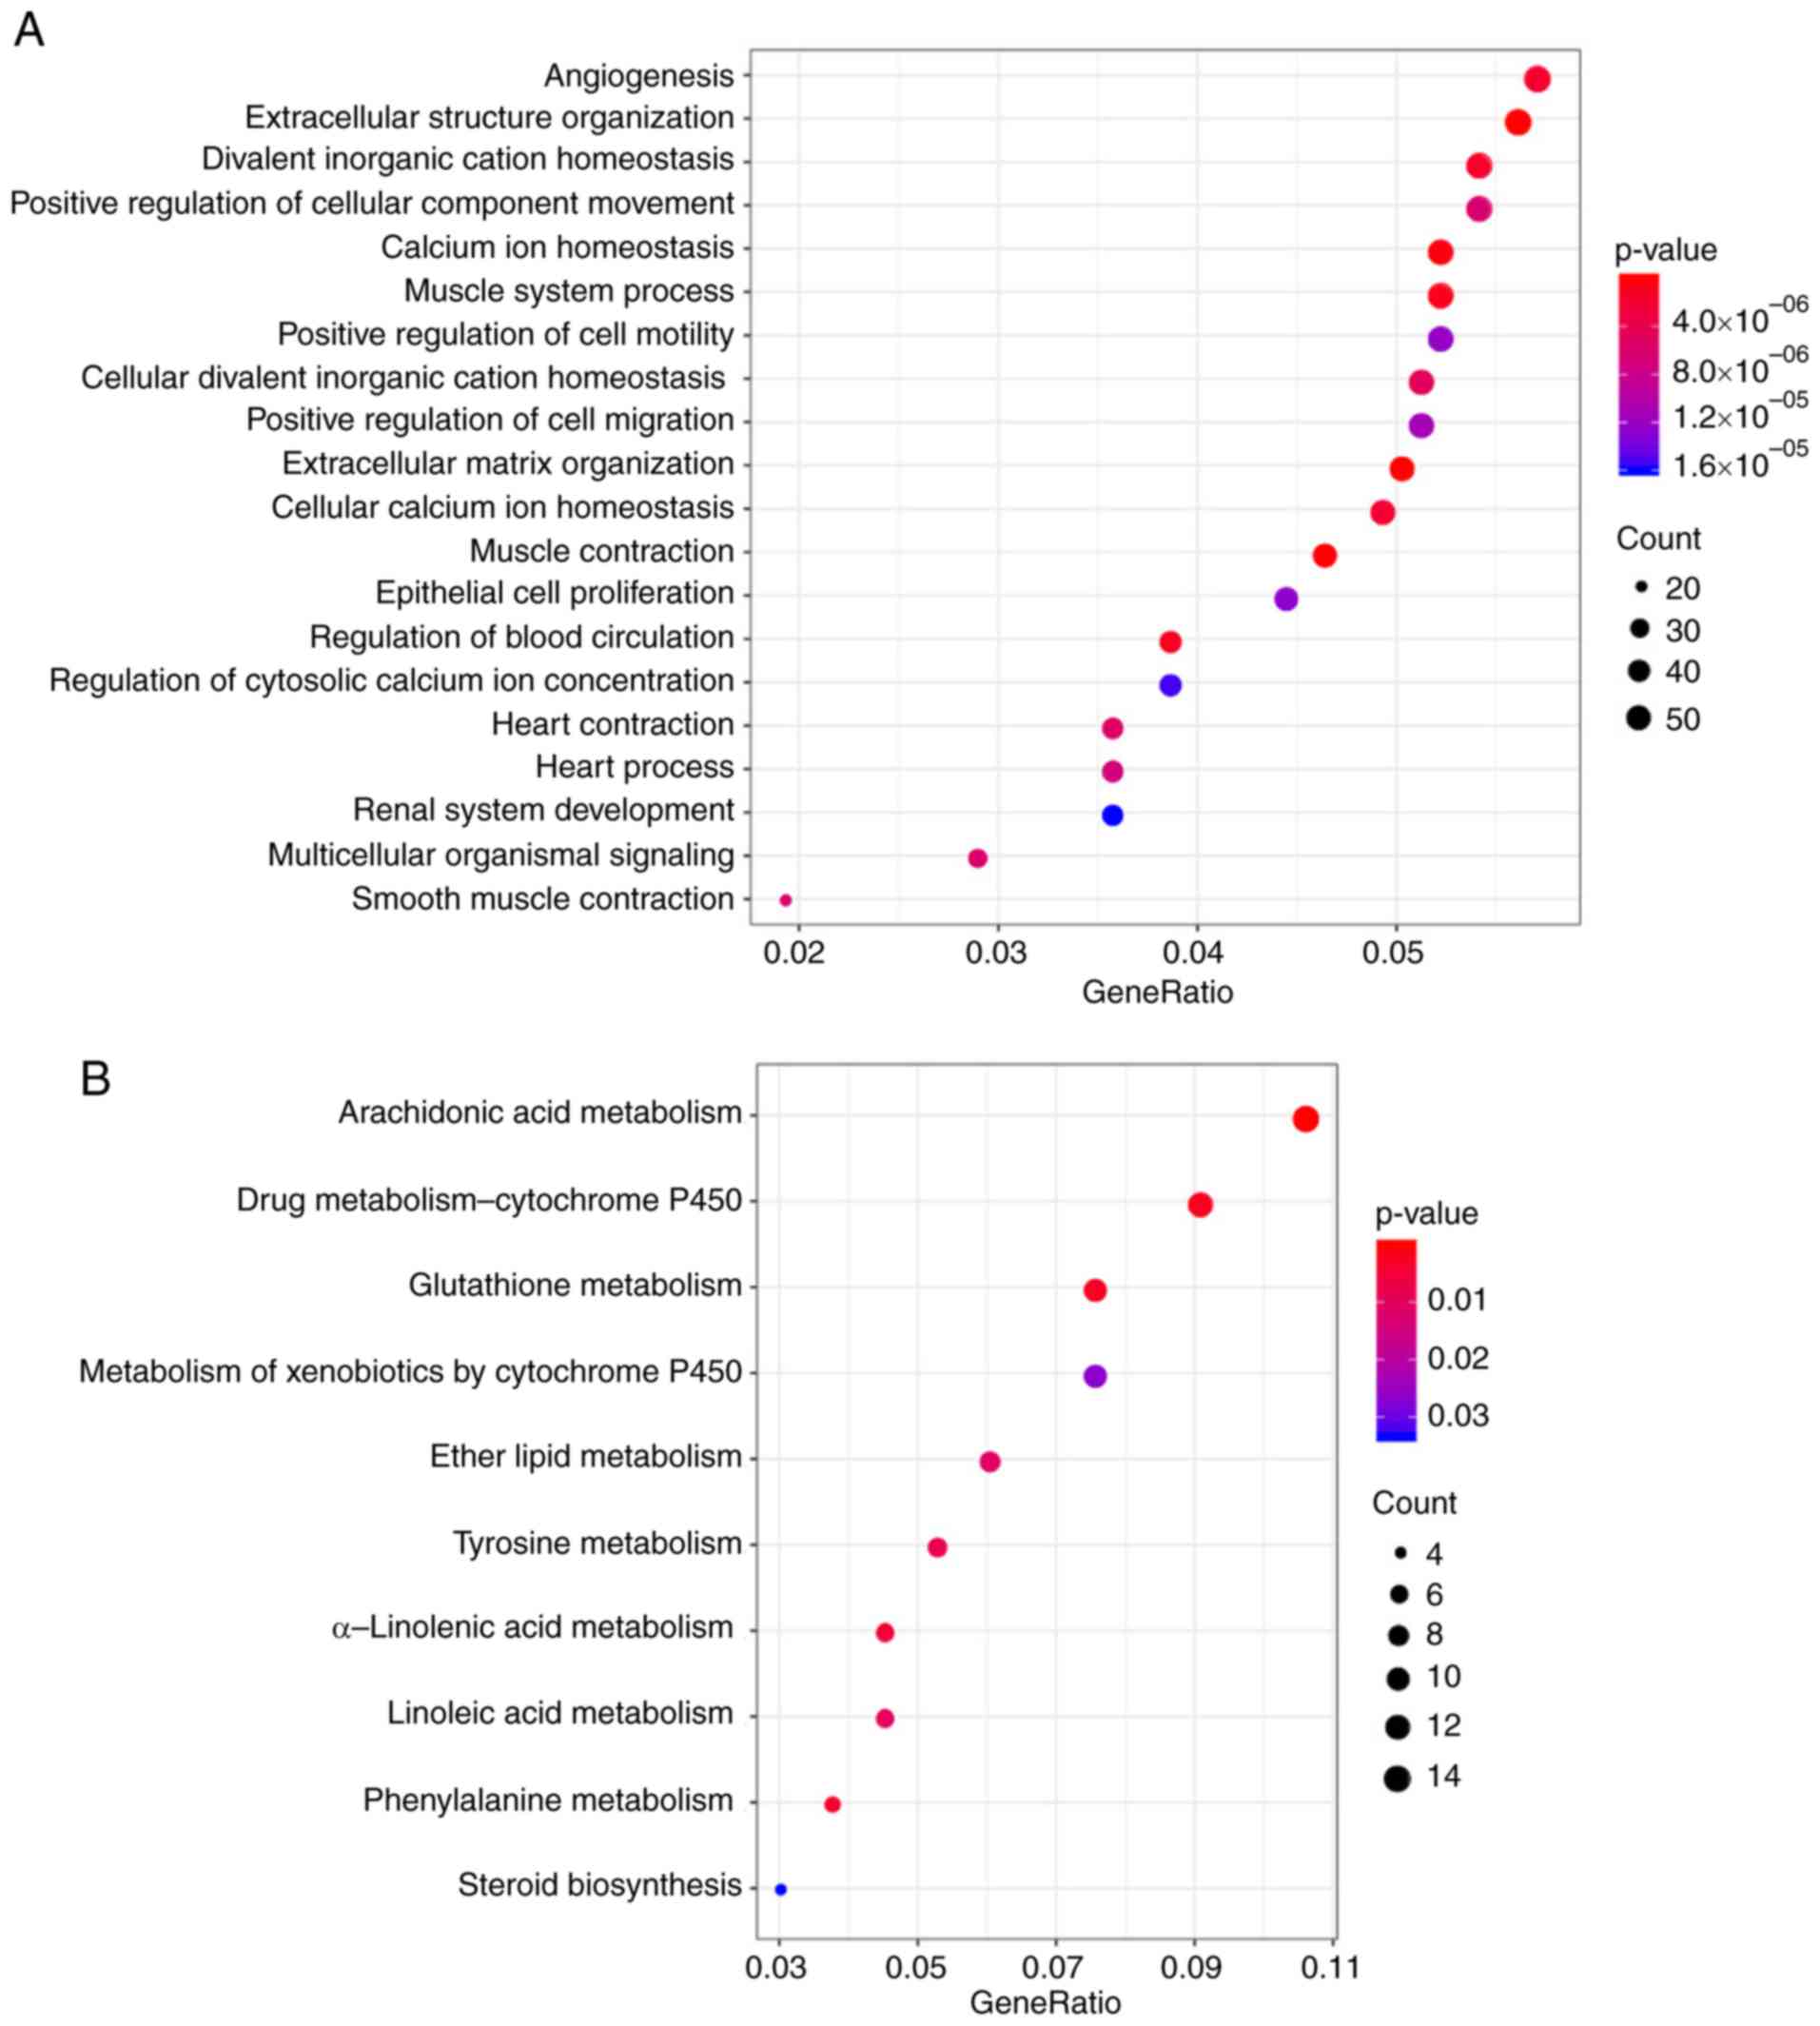
and those in the C1, C3 and C4 subtypes. The R package cluster
profile was subsequently used to perform enrichment analysis of
these 1941 DEGs. KEGG pathway enrichment and GO enrichment analysis
results appeared to show that these genes were mostly enriched in
biological functions and pathways associated with ‘calcium
homeostasis’, ‘angiogenesis’, the metabolism of molecules including
glutathione, arachidonic acid, drugs and xenobiotics and ‘positive
cell migration regulation’ (Fig.
4).
| Table IV.Comparison of differentially
expressed genes in samples from the C2 subtype with the C1, C3 and
C4 subtypes. |
Table IV.
Comparison of differentially
expressed genes in samples from the C2 subtype with the C1, C3 and
C4 subtypes.
| Type | C2/C1 | C2/C3 | C2/C4 |
|---|
| PCG_Up | 700 | 304 | 448 |
| PCG_Down | 628 | 186 | 233 |
| PCG_All | 1328 | 490 | 681 |
Since patient prognosis was found to be closely
associated with the energy metabolism state, a signature associated
with energy metabolism was therefore proposed to predict patient
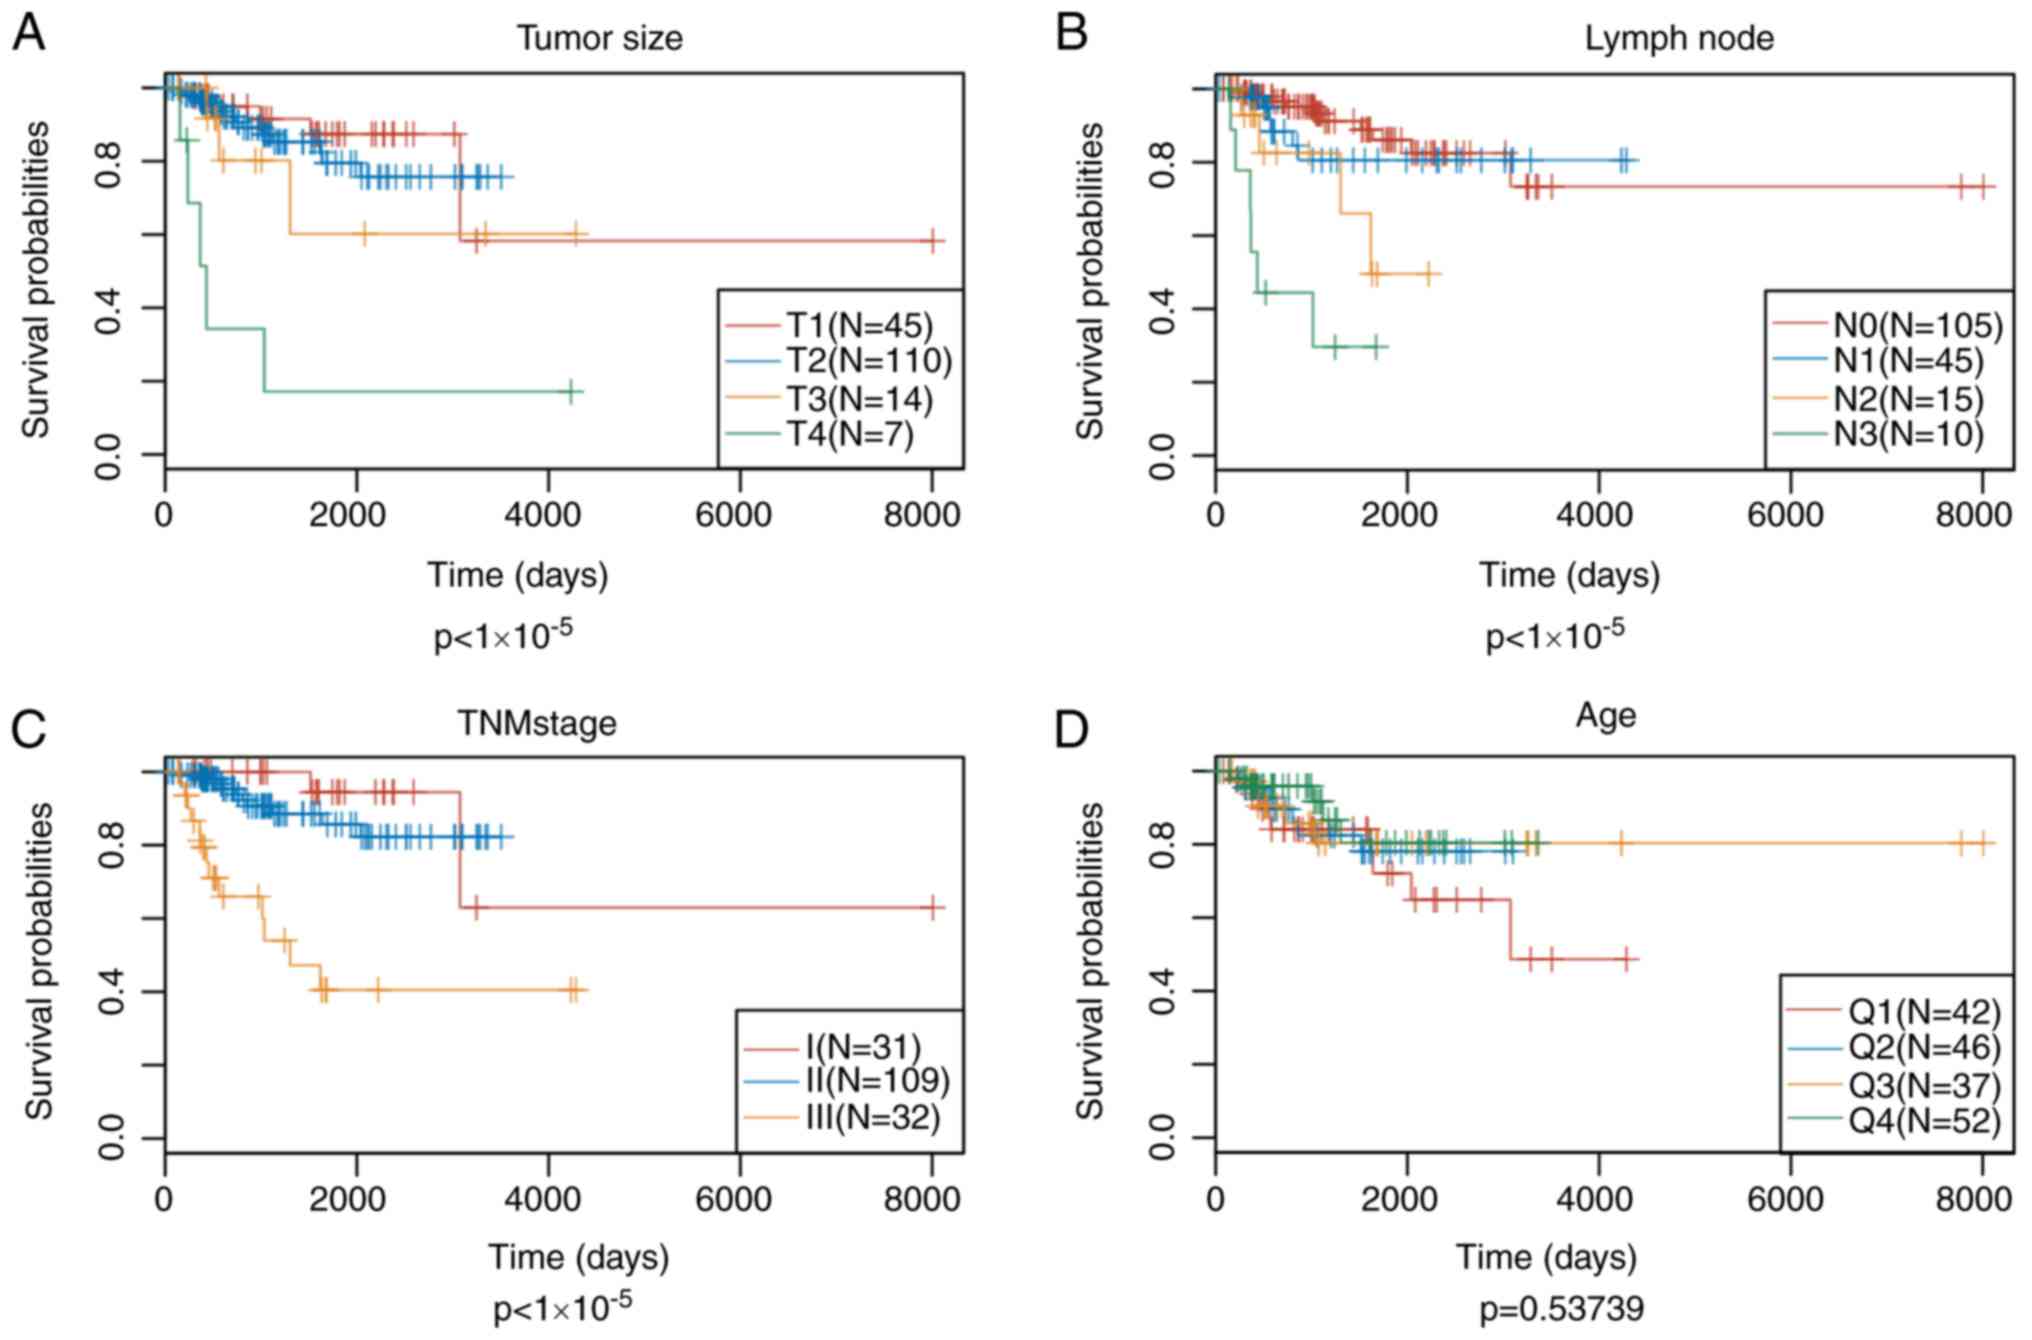
prognosis. Univariate Cox regression analysis suggested that 102 of
these DEGs showed significant association with the DFS of patients
in the training set (top 20 DEGs shown in Table V). Subsequently, the univariate Cox
proportional hazards regression model was performed to analyze the
age, TNM stages, stage, age and survival data. Differences in
stage, lymph node and tumor size were found to be statistically
significant in predicting prognosis (Fig. 5). Multivariate Cox proportional
hazards regression model was utilized to select for the genes
associated with energy metabolism that displayed the highest
prognostic significance, using stage, N and T as covariants. A
total of 14 genes associated with energy metabolism that were
specific to prognosis were mined and narrowed by lasso regression
to reduce the number of genes selected for the construction of the
prognostic signature. Typically, the lasso algorithm uses the
biased estimate to process multicollinearity data, to estimate and
screen variables and to solve the multicollinearity problem
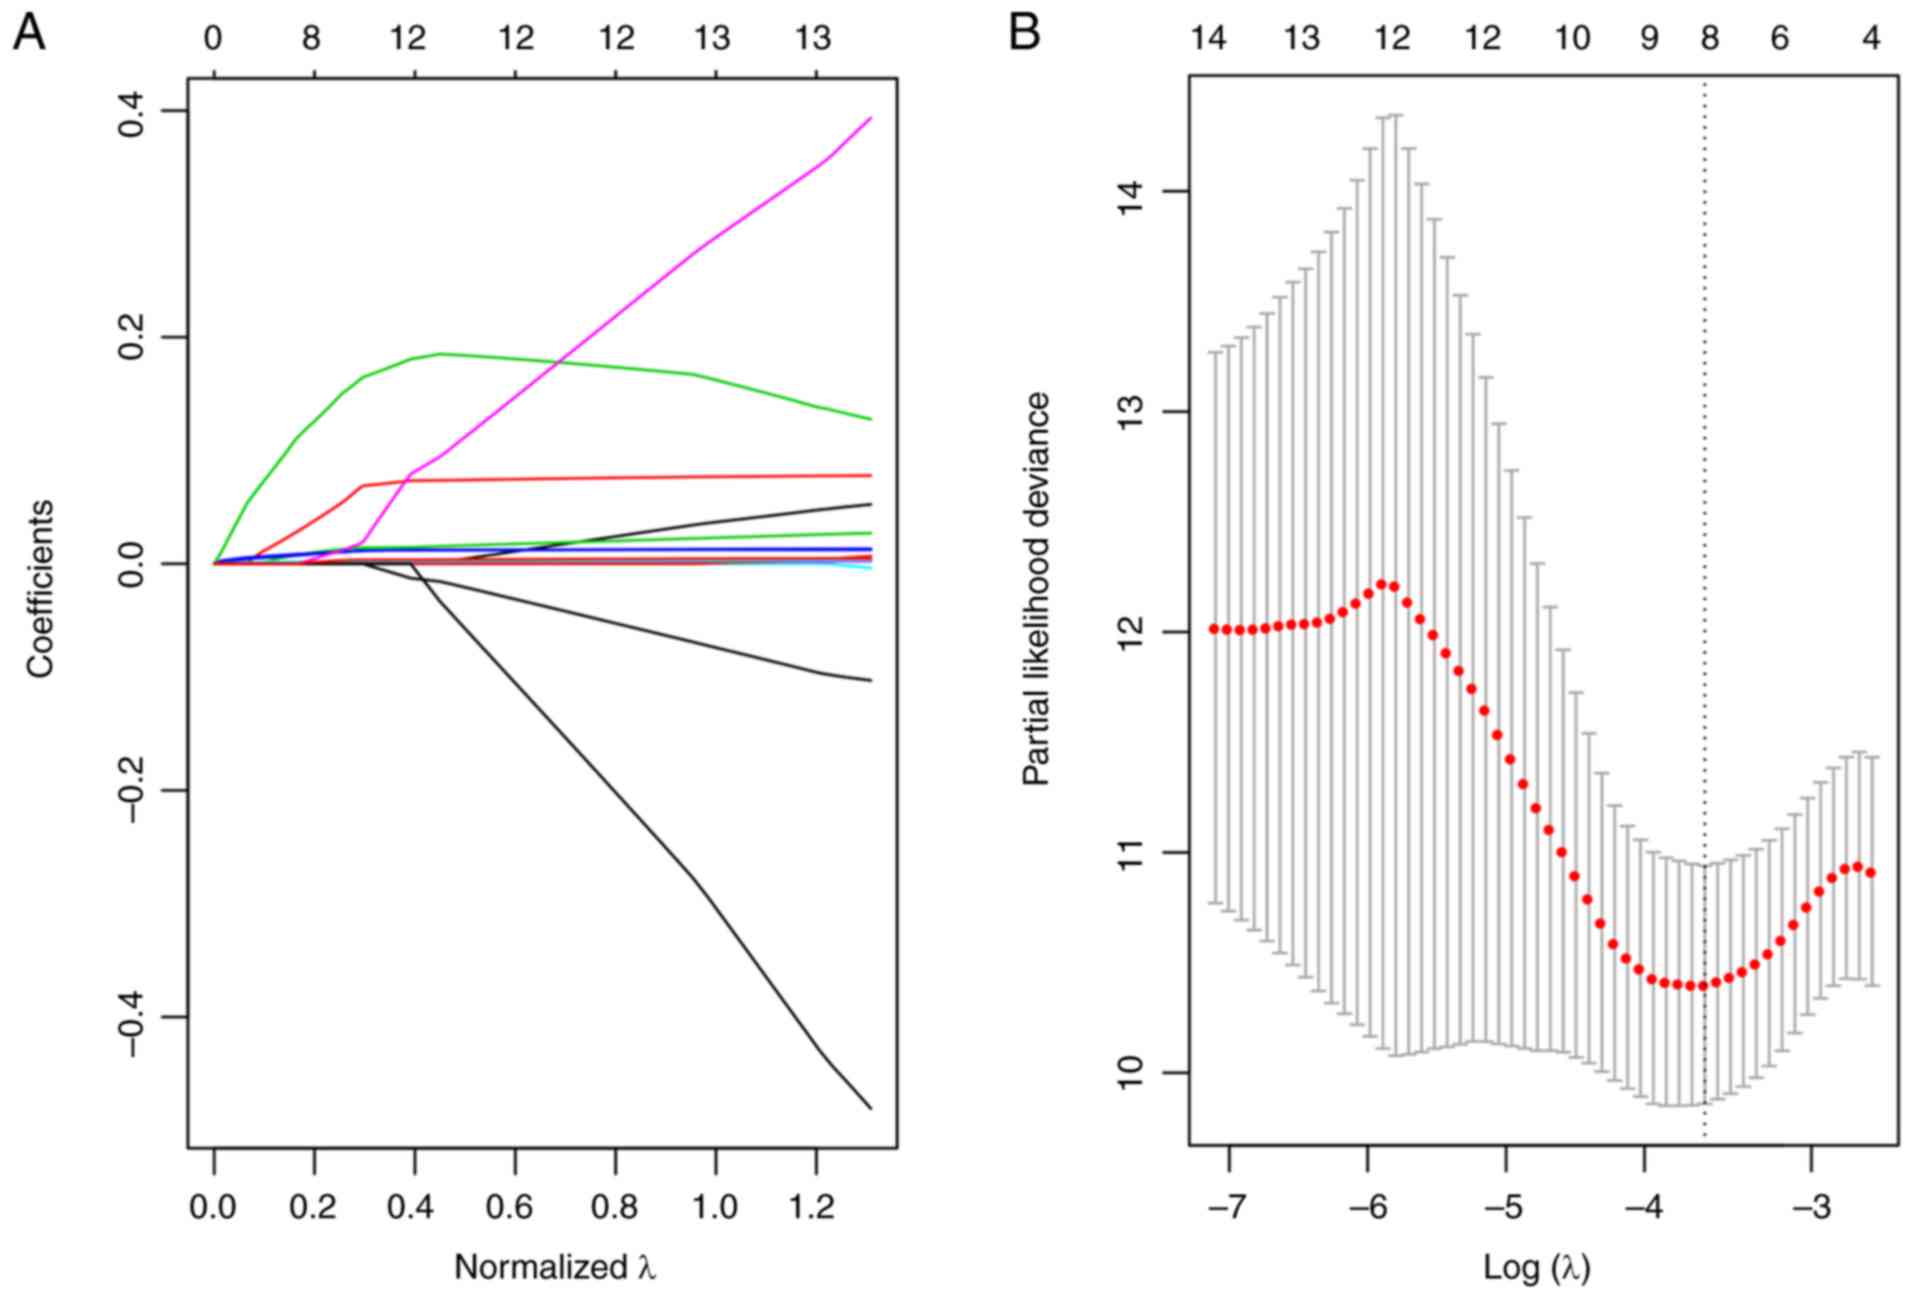
encountered during regression analysis. In the present study, the
glmnet function of R package was used to perform the lasso
regression analysis. For every independent parameter, a variation
trajectory was evaluated (Fig. 6A)
The coefficients of the 14 genes were revealed to be ~0 as the λ
gradually increased. Additionally, a model was constructed using a
three-fold cross-validation. Fig.
6B presents the confidence interval for every λ, which
suggested that λ=0.0283271 would result in the best model.
Consequently, the signature with λ=0.0283271 was applied to be the
eventual signature, which involves eight genes associated with
energy metabolism.
| Table V.Top 20 DEGs that showed significant
correlation with the disease-free survival of patients in the
training set by analysis of univariate Cox regression. |
Table V.
Top 20 DEGs that showed significant
correlation with the disease-free survival of patients in the
training set by analysis of univariate Cox regression.
| Symbol | P-value | Hazard ratio | Low 95% CI | High 95% CI |
|---|
| KRTDAP |
1.48×10−05 | 1.009 | 1.005 | 1.013 |
| PLAC9 |
4.89×10−05 | 1.021 | 1.011 | 1.031 |
| CD248 |
6.91×10−05 | 1.004 | 1.002 | 1.006 |
| SPRR2G |
2.55×10−04 | 1.035 | 1.016 | 1.055 |
| EFNB1 |
2.82×10−04 | 1.016 | 1.007 | 1.025 |
| SPON2 |
3.17×10−04 | 1.006 | 1.003 | 1.010 |
| PTGDS |
4.44×10−04 | 1.002 | 1.001 | 1.003 |
| CA3 |
5.86×10−04 | 1.010 | 1.004 | 1.015 |
| PTGER1 |
6.55×10−04 | 1.747 | 1.267 | 2.407 |
| CILP |
6.66×10−04 | 1.005 | 1.002 | 1.007 |
| COL16A1 |
7.28×10−04 | 1.009 | 1.004 | 1.014 |
| CNFN |
7.99×10−04 | 1.015 | 1.006 | 1.024 |
| PDE1B |
1.12×10−03 | 1.246 | 1.091 | 1.422 |
| ACVRL1 |
1.170×10−03 | 1.055 | 1.022 | 1.090 |
| COL5A3 |
1.39×10−03 | 1.009 | 1.003 | 1.014 |
| PYGM |
1.40×10−03 | 1.914 | 1.285 | 2.850 |
| MYL3 |
1.55×10−03 | 1.490 | 1.164 | 1.907 |
| DCSTAMP |
1.63×10−03 | 1.292 | 1.102 | 1.515 |
| RARRES2 |
1.68×10−03 | 1.003 | 1.001 | 1.005 |
| C1QTNF7 |
1.68×10−03 | 1.297 | 1.103 | 1.525 |
The eight-gene based signature shows
potential in predicting prognosis for TNBC
The risk score values for the samples in the
training set were first calculated, following which the samples
were divided into high-risk and low-risk groups according to the
risk score values and set at a threshold of 1.351149 according to
the 3-year area under the curve (AUC) after Youden's index
analysis. Fig. 7 displays the
efficiency of the constructed eight-gene signature in classifying
samples in the TCGA training set. showed that, for the samples from
the deceased group, the survival time was markedly reduced as the
patient risk score value increased (Fig. 7A). In addition, the high-risk group
was found to be associated with the increased number of deceased
samples (Fig. 7A). The increased
levels of the eight genes associated with energy metabolism also
appeared to be risk factors, since the risk score values were found
to be increased when the expression levels of these eight genes
were increased (Fig. 7A). According
to the ROC curves, the 1-, 3- and 5-year AUC were calculated to be
0.89, 0.80 and 0.80, respectively (Fig.
7B). After the patients were divided into low-risk and
high-risk groups, the difference in DFS between the two groups was
revealed to be statistically significant (HR=3.78; P<0.0001;
Fig. 7C).
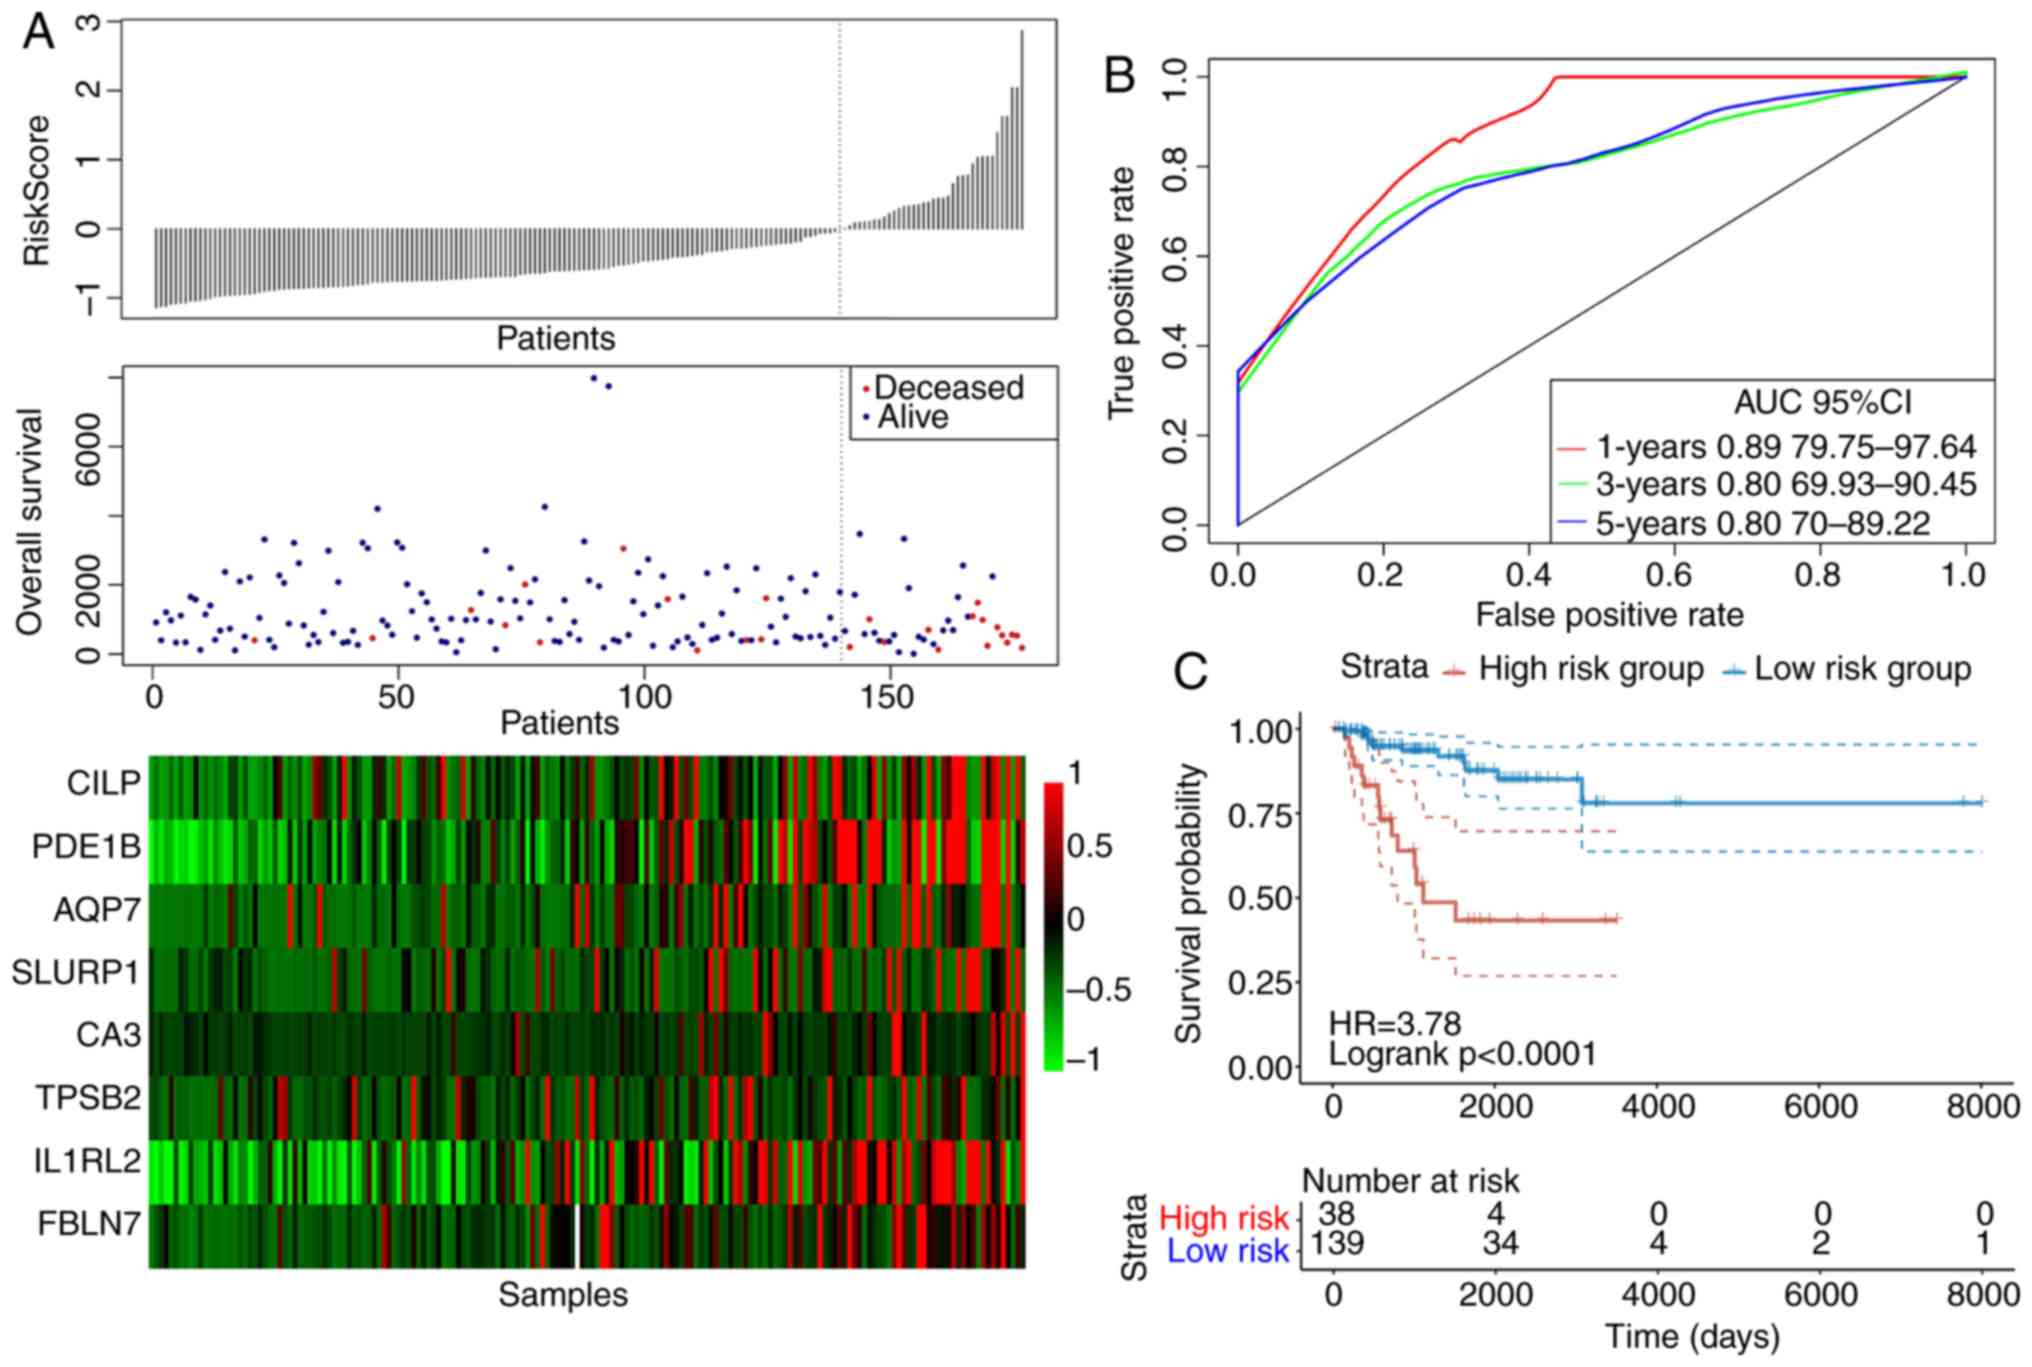 | Figure 7.The classification effect of the
eight-gene signature associated with energy metabolism in the TCGA
training set. (A) The relationship between the risk score, survival
time, survival status and the expression levels of the eight genes
derived from the TCGA training set. Colour scale represents the
expression levels of the eight genes, where red indicates
upregulation and green indicates downregulation. (B) ROC curves of
the eight-gene signature in triple-negative breast cancer samples
obtained from the TCGA training set. (C) Analysis of prognosis
following classification into the high risk and low-risk groups
according to the eight-gene signature. TCGA, The cancer genome
atlas; ROC, receiver operating characteristic; AUC, area under the
curve; CI, confidence interval; IL1RL2, interleukin-1 receptor-like
2; CA3, carbonic anhydrase 3; PDE1B, phosphodiesterase 1B; SLURP,
secreted Ly-6/uPAR-related protein; AQP7, aquaporin 7; TPSB,
tryptase-β2; FBLN7, fibulin 7; CILP, cartilage intermediate layer
protein. |
To determine the reliability of the constructed
eight-gene signature, an identical model used for the TCGA training
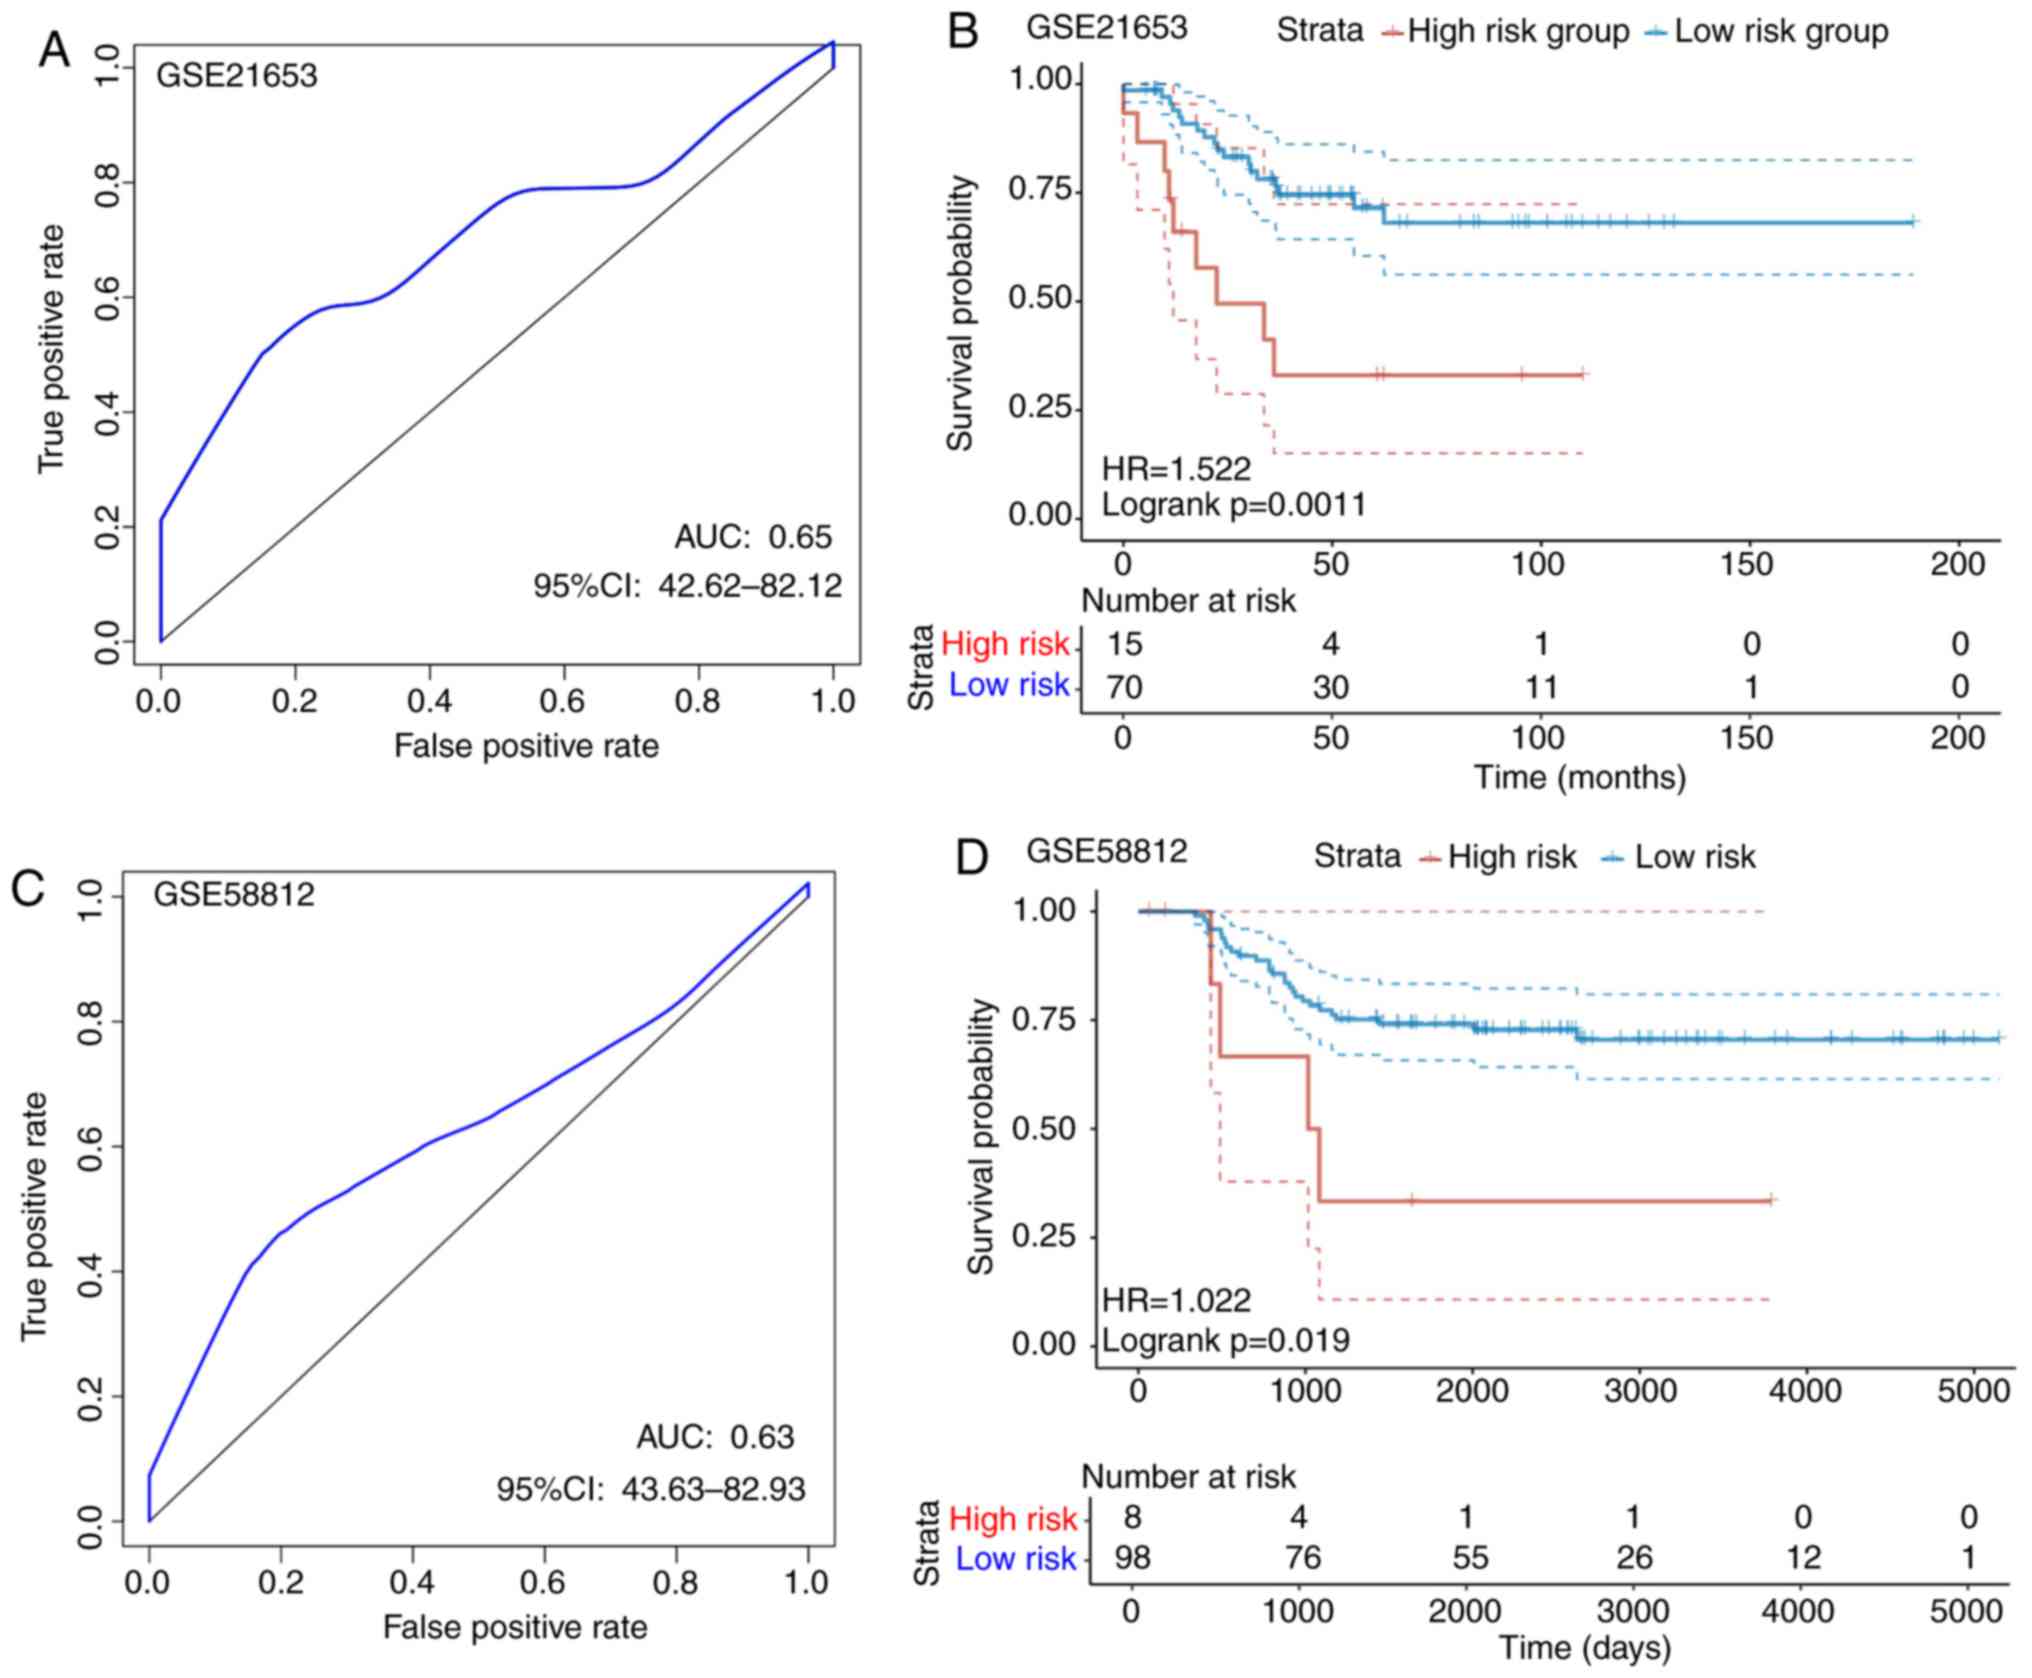
set samples was performed on the two GEO test sets. For the
GSE21653 dataset, according to the ROC analysis, a 1-year AUC of
0.65 was found, although interpretation was restricted by the
limited follow-up time of the samples (Fig. 8A). Subsequently, a total of 70 cases
were divided into the low-risk group, whereas 15 were allocated
into the high-risk group using a threshold of 1.475448 according to
the 1-year AUC, where a statistically significant difference was
found between the two groups (P=0.0011; Fig. 8B). For the GSE58812 dataset, ROC
analysis revealed the 1-year AUC to be 0.63, but interpretation was
restricted by the limited follow-up time of the samples (Fig. 8C). According to Fig. 8D, a total of 98 cases were allocated
into the low-risk group, whereas 8 were assigned into the high-risk
group using a threshold of 32.77999 according to the 1-year AUC,
where there was a statistically significant difference between the
two groups (P=0.0019). The threshold was found to be large,
possibly due to the larger variation in the GSE58812 dataset. For
the overall expression levels of the two GSE datasets, the
calculated risk scores differed drastically. In conclusion, the
signature constructed based on these eight genes showed high
accuracy in predicting prognosis for patients in both internal and
external TNBC datasets.
Compared with recent studies that also investigated
the prognostic models for TNBC (45–47),
that present study also calculated the risk scores of each sample
obtained from the TCGA database using the method reported in the
present study and those from the previous studies, where ROC
analysis was performed for each model. The samples were then
divided into high-risk and low-risk groups using the median risk
score, following which the difference in the prognosis of patients
between the high-risk and low risk groups were compared. It was
found that the signature derived from the present study was
superior compared with the other models from the recent studies in
terms of prognostic prediction (Fig.
S1).
The signature constructed based on
genes associated with energy metabolism is superior compared with
other clinical features in predicting survival of patients with
TNBC
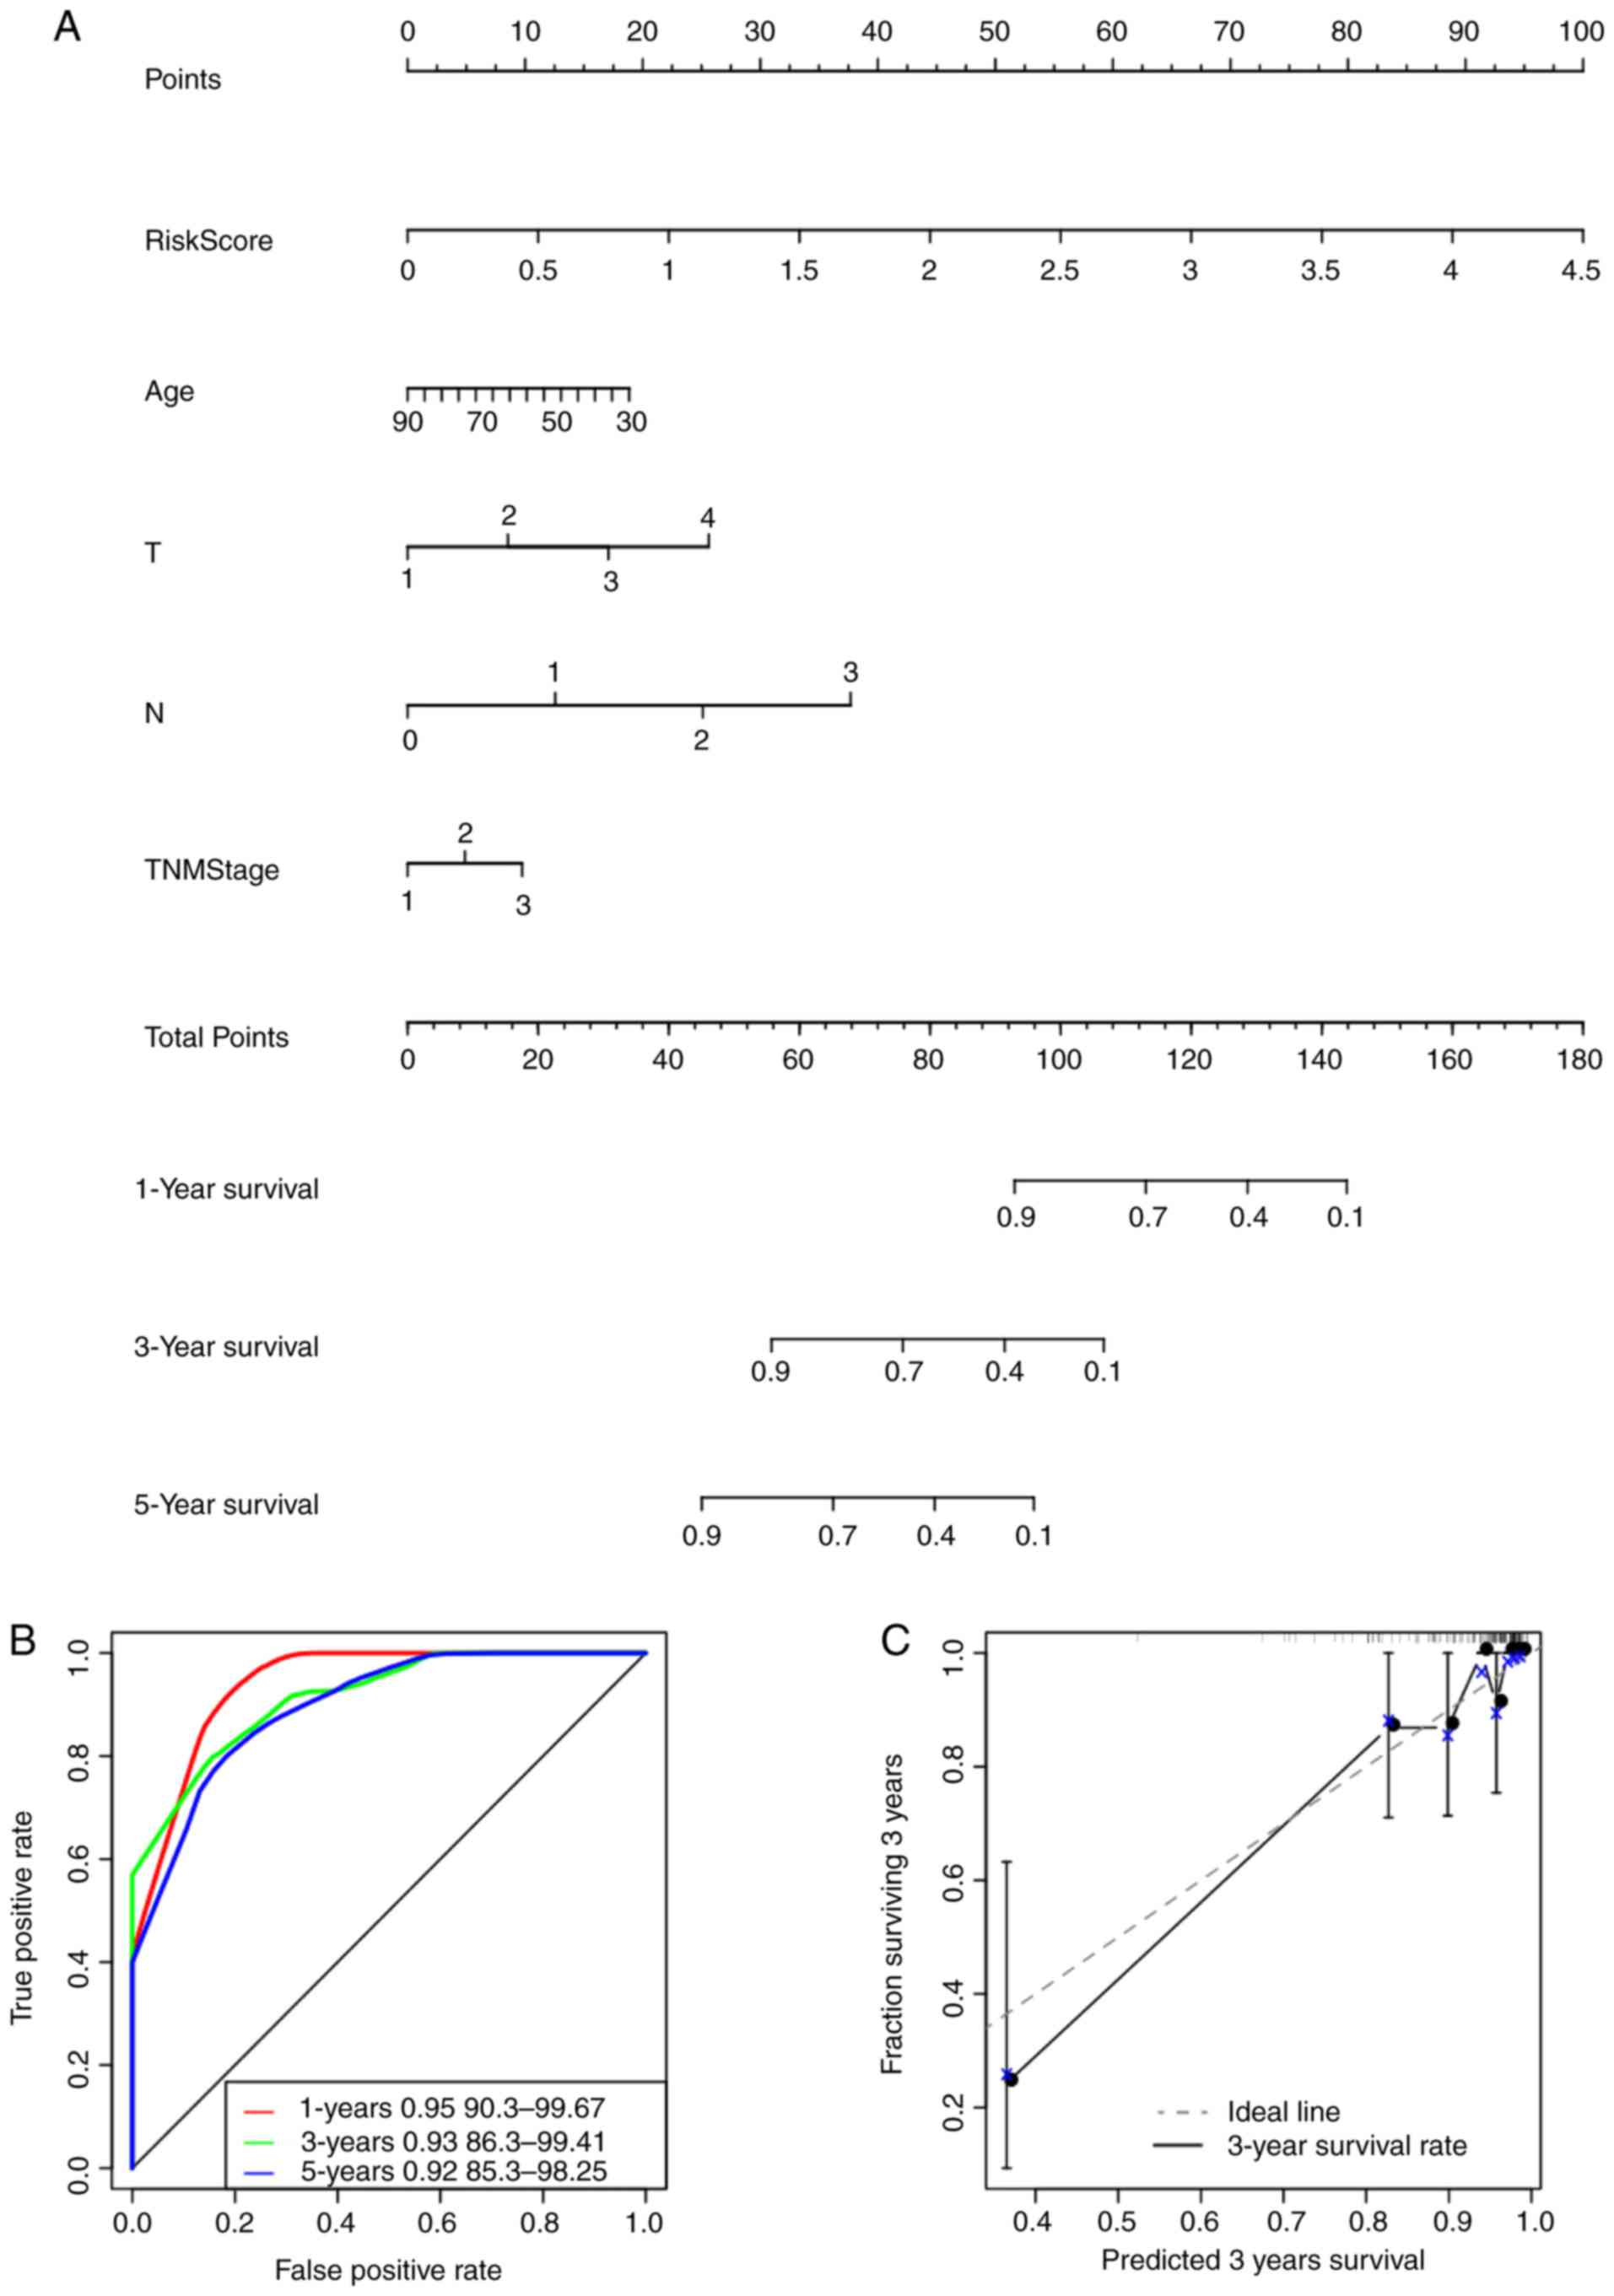
The risk score values were utilized in combination
with other clinicopathological features to construct a nomogram
model for the TNBC cases. Nomogram is a method for effectively and
intuitively presenting the results of a risk model, which can be
adopted conveniently for predicting patient outcome (48). Specifically, length of the straight
line within the nomogram indicates the influence of the various
parameters on the significance of patient outcome. In the present
study, a nomogram was constructed by integrating age, risk scores,
stage, N and T (Fig. 9A). The risk
score features were revealed to be associated with survival
prediction. This predictive efficiency was assessed further using
the ROC analysis to calculate the AUC of the nomogram scores, which
was obtained using the ‘predict’ function from the R package.
According to Fig. 9B, the 1-, 3-
and 5-year AUC of nomogram were calculated to be 0.95, 0.93 and
0.92, respectively. In addition, the constructed nomogram model
displayed consistent predictive capacity compared with that of the
ideal model (dotted line) for predicting the 3-year survival of
patients with TNBC (Fig. 9C).
Finally, a forest plot was constructed based on the risk score
values and the clinicopathological features. The HRs of the risk
score value was calculated to be ~3.848, as observed from the
forest plots constructed based on risk score values, stage, N, T
and age (P<0.001; Fig. 9D),
suggesting that the signature constructed based on the expression
profiles of the eight genes associated with energy metabolism
exhibited adequate capacity in predicting prognosis in patients
with TNBC.
Differences in pathways involved in
GSEA between the low and high-risk groups
GSEA was used for analyzing the markedly enriched
pathways between the low-risk and high-risk groups according to the
TCGA training set samples, where 20 markedly enriched pathways were
acquired in total. Genes associated with the high-risk group were
particularly enriched in the ‘MAPK signal transduction pathway’,
‘focal adhesion’, ‘hedgehog signaling’, ‘cardiomyopathy’ and ‘ECM
receptor interaction’, whilst those associated with the low-risk
group were involved in ‘mismatch repair’ and ‘propanoate
metabolism’ (Fig. 10; Table VI).
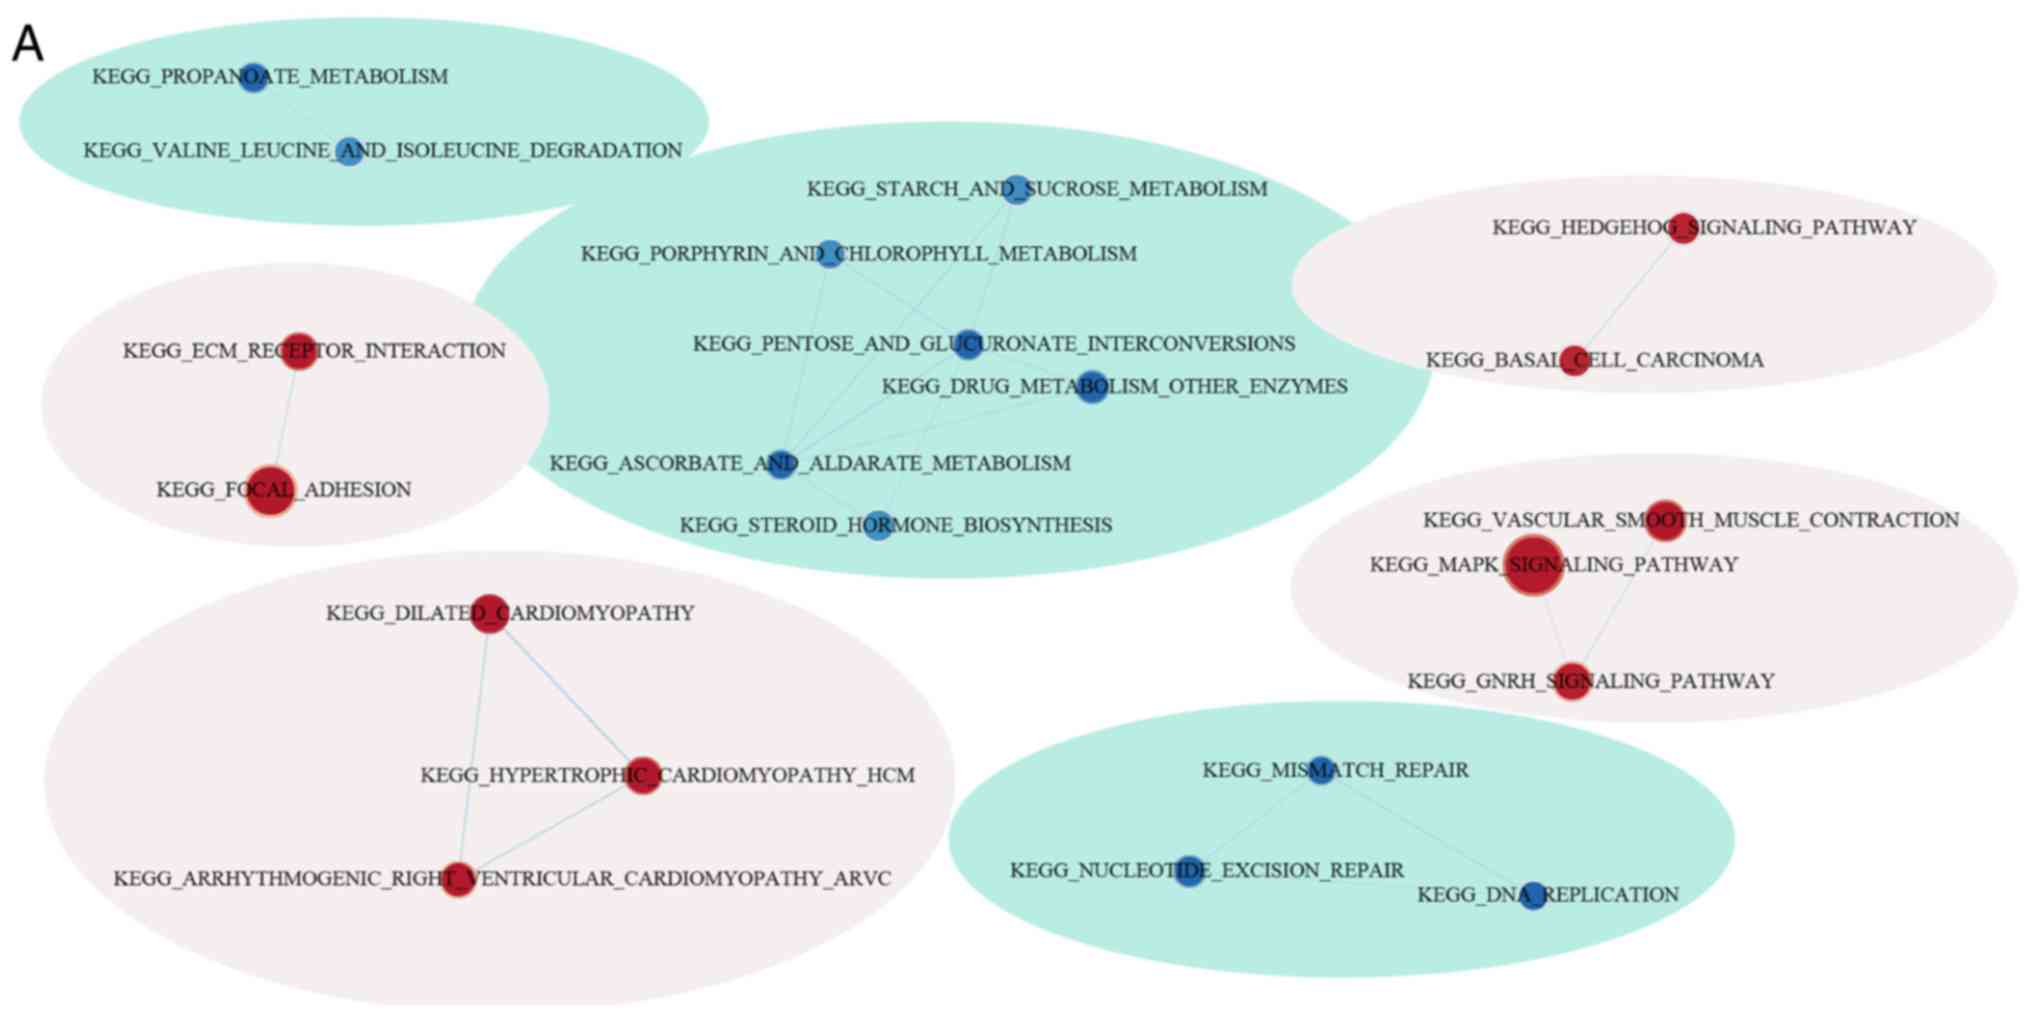 | Figure 10.Functional analysis of the eight-gene
signature. (A) Visualization of the GSEA enrichment results,
calculated based on the median values of the risk scores using the
enrichment map software from Cytoscape. The red region represents
the enriched pathways in the high-risk group, whilst the blue
region represents the enriched pathways in the low-risk group. The
sizes of the red/blue dots indicates the score of enrichment, the
higher the score of enrichment, the larger the dot sizes.
Functional analysis of the eight-gene signature. Enrichment plots
for (B) nucleotide excision pair, (C) proparoate metabolism, (D)
MAPK signaling pathway, (E) ECM receptor interaction, (F) hedgehog
signaling pathway and (G), hypertrophic cardiomyopathy. GSEA, gene
set enrichment analysis; KEGG, Kyoto Encyclopedia of Genes and
Genomes pathways; ECM, extracellular matrix. |
| Table VI.KEGG pathway of genes associated with
the high-risk groupand those associated with the low-risk
group. |
Table VI.
KEGG pathway of genes associated with
the high-risk groupand those associated with the low-risk
group.
| Name | Size | Esa | Nes | Nom P-value | FDR q-value |
|---|
|
KEGG_dilated_cardiomyopathy | 90 | 0.473 | 1.816 | 0.003 | 0.475 |
|
KEGG_calcium_signaling_pathway | 176 | 0.348 | 1.574 | 0.003 | 0.489 |
|
KEGG_hypertrophic_cardiomyopathy_hcm | 83 | 0.448 | 1.735 | 0.008 | 0.318 |
|
KEGG_ecm_receptor_interaction | 84 | 0.553 | 1.799 | 0.010 | 0.279 |
|
KEGG_notch_signaling_pathway | 47 | 0.424 | 1.618 | 0.013 | 0.561 |
|
KEGG_vascular_smooth_muscle_contraction | 115 | 0.379 | 1.586 | 0.023 | 0.546 |
|
KEGG_mapk_signaling_pathway | 265 | 0.287 | 1.357 | 0.045 | 0.771 |
|
KEGG_protein_export | 23 | −0.661 | −1.902 | 0.000 | 0.169 |
|
KEGG_biosynthesis_of_unsaturated_fatty_acids | 22 | −0.643 | −1.866 | 0.002 | 0.123 |
|
KEGG_n_glycan_biosynthesis | 46 | −0.504 | −1.764 | 0.006 | 0.180 |
|
KEGG_steroid_biosynthesis | 16 | −0.729 | −1.804 | 0.007 | 0.163 |
|
KEGG_glyoxylate_and_dicarboxylate_metabolism | 16 | −0.627 | −1.745 | 0.009 | 0.143 |
|
KEGG_one_carbon_pool_by_folate | 17 | −0.568 | −1.603 | 0.012 | 0.338 |
|
KEGG_terpenoid_backbone_biosynthesis | 15 | −0.663 | −1.714 | 0.013 | 0.163 |
|
KEGG_pentose_and_glucuronate_interconversions | 27 | −0.609 | −1.593 | 0.026 | 0.325 |
|
KEGG_proteasome | 44 | −0.617 | −1.747 | 0.034 | 0.168 |
|
KEGG_nucleotide_excision_repair | 44 | −0.480 | −1.562 | 0.039 | 0.331 |
|
KEGG_pantothenate_and_coa_biosynthesis | 16 | −0.552 | −1.556 | 0.040 | 0.317 |
|
KEGG_propanoate_metabolism | 32 | −0.511 | −1.545 | 0.046 | 0.314 |
|
KEGG_citrate_cycle_TCA_cycle | 30 | −0.564 | −1.578 | 0.049 | 0.325 |
Discussion
TNBC accounts for ~15-20% of all BC cases, which is
particularly prevalent among younger women aged <40 years. TNBC
is a complex disease with substantial heterogeneity, which is
associated with inferior prognosis compared with that in other BC
subtypes. Currently, treatments for TNBC mainly include surgery
combined with adjuvant chemotherapy for early stage disease and
chemotherapy for advanced stage disease. However, surgical
resection remain ineffective due to the localized invasion of
cancer cells to adjacent tissues or the development of distant
metastasis (49,50). Additionally, effects exerted by
chemotherapy may be diminished due to tumor heterogeneity (51,52).
Therefore, identifying novel candidate biomarkers for the
prognostic prediction of TNBC is important for finding novel
treatment targets for this disease and to accurately manage
patients potentially developing complete response from adjuvant
treatment. In the present study, a gene expression signature was
explored as potential approach for the prognostic prediction of
TNBC.
A number of previous studies have classified TNBC
subtypes using genomic profiling, which allows for the specific
classification and accurate prediction of TNBC outcomes. Using the
TIMER method, it was found that the scores for the three immune
cell types, specifically dendritic cells, macrophages and CD4
cells, were higher in the samples of the C2 subtype compared with
those of other subtypes, suggesting that the immune
microenvironment or the degree of immunocyte infiltration in TNBC
was associated with patient prognosis. Several molecular markers,
including O6-methylguanine DNA methyltransferase, isocitrate
dehydrogenase, epidermal growth factor receptor and phosphatase and
tensin homolog, were previous examined among patients with TNBC,
facilitating targeted and personalized anti-TNBC therapy. Fumagalli
C et al (8) previously found
that patients with TNBC carrying a silencing mutation in the
O6-methylguanine DNA methyltransferase gene are associated with an
increase in the susceptibility for alkylating agents. Wang et
al (10) found that epidermal
growth factor induced the expression of Fascin-1 through the
activation of MAPK, which lead to poorer relapse-free survival and
overall survival for patients with TNBC. However, since TNBC is
associated with poor prognosis, identification of novel molecular
biomarkers and development of treatment strategies are urgently
sorted for unravelling the possible mechanisms of TNBC progression
or improving patient prognosis.
Accumulating evidence suggested that the aberrant
metabolism can serve as a hallmark for cancer cells. In recent
years, significant research effort has been made on investigating
the difference in energy metabolism between tumor and normal cells
(53–55). Recent studies on TNBC revealed that
a number of catabolic pathways can participate in energy
metabolism, including fatty acid metabolism, OXPHOS and glycolysis
(28,56,57).
Consequently, it is of great significance to screen for new genes
associated with energy metabolism that are specific to prognosis,
to accurately predict the prognosis for patients, develop
therapeutic strategies and identify patients with a high risk of
postoperative relapse. In the present study, tumor size (T), nodal
status (N), age and TNM stages were applied as the prognostic
predictors to select for genes associated with energy metabolism.
For TNBC, these are classical prognostic predictors that are
universally acknowledged (58,59).
Consistent with this, the present study found the differences in
stage, N and T to be statistically significant in predicting
prognosis, showing them to be good prognostic predictors.
In the present study, the relationship between
energy metabolic state in the tumor microenvironment and the
prognostic significance among patients with TNBC was determined
based on RNA sequencing data. Use of profiling data of genes
associated with energy metabolism allowed for the delineation of
molecular and clinical characteristics among patients with TNBC. In
addition, a signature was developed for patient stratification into
low-risk or high-risk groups for predicting poor prognosis.
Univariate Cox model was considered to be insufficient in selecting
the variables based on dimensional data. Therefore, it was applied
to first screen for the genes associated with DFS, following which
an elastic net Cox regression model was used for enhancing the
prognostic prediction performance of the indices. The eight genes
acquired exerted cumulative effects on predicting patient survival.
This signature associated with energy metabolism could be used as
an effective indicator for prognosis prediction and patient
stratification for future treatments targeting energy
metabolism.
Based on the present study, five of the eight genes
in the signature had been previously recognized to participate in
TNBC pathogenesis, immune microenvironment, progression and
malignant transformation, which were interleukin-1 receptor-like 2,
carbonic anhydrase 3, phosphodiesterase 1B, secreted
Ly-6/uPAR-related protein and aquaporin 7 (60–63).
These five genes showed marked correlation with the prognosis and
survival of patients. These results suggested that the
bioinformatic mining results were reliable and accurate. However,
it remains unclear regarding the association between the other
genes and TNBC physiology, which require further study. Fibulin 7
has been previously reported to participate in the regulation of
aberrant neovascularization by modulating the
angiopoietin-1/angiopoietin-2-Tie2 axis (64). A previous study has shown that the
cartilage intermediate layer protein gene is differentially
expressed in differentiated thyroid carcinomas in comparison with
normal thyroid tissues (65). By
contrast, tryptase-β2 (TPSB) was documented as a major neutral
protease present in mast cells that participate in tumor-associated
immunity and can serve as a prognostic marker for several types of
cancer (66,67). TPSB has also been demonstrated to
upregulate vascular endothelial growth factor production in the
tumor microenvironment via the protease-activated receptors-2,
ERK1/2 and p38 MAPK signaling pathways (68).
In conclusion, the expression profiles of genes
associated with energy metabolism and their prognostic significance
in TNBC was revealed in the present study. A signature associated
with energy metabolism was subsequently constructed, allowing for
the classification of patients with TNBC into high-risk or low-risk
groups in terms of survival. However, further study is required,
since the predictive capacity of the eight-gene signature
constructed in the present study need to be tested in a clinical
setting. Results in the present study can shed new light on the
relationship between the metabolic state and TNBC pathophysiology
and potentially aid in the development of novel TNBC treatment
strategies targeting energy metabolism.
Supplementary Material
Supporting Data
Acknowledgements
Not applicable.
Funding
The present study was supported by The Natural
Science Foundation of Ningbo (grant no. 2017A610163).
Availability of data and materials
The datasets generated and analyzed during the
current study are available in the gene expression omnibus
(https://www.ncbi.nlm.nih.gov/geo/)
and The Cancer Genome Atlas (TCGA) databases (https://portal.gdc.cancer.gov/).
Authors' contributions
CLi was involved in the conception and design of the
study, project administration and drafted the manuscript. XLi
developed the methodology and supervised the study and critically
reviewed the manuscript. GLi and LS and WZ collected data from the
database and performed statistical data analysis. JJ and QG
organized the figures and tables and were involved in
interpretation of data for the work. All authors have read and
approved the final version of the manuscript.
Ethics approval and consent to
participate
Not applicable.
Patient consent for publication
Not applicable.
Competing interests
The authors declare that they have no competing
interests.
References
|
1
|
Bianchini G, Balko JM, Mayer IA, Sanders
ME and Gianni L: Triple-negative breast cancer: Challenges and
opportunities of a heterogeneous disease. Nat Rev Clin Oncol.
13:674–690. 2016. View Article : Google Scholar : PubMed/NCBI
|
|
2
|
Smid M, Wang Y, Zhang Y, Sieuwerts AM, Yu
J, Klijn JG, Foekens JA and Martens JW: Subtypes of breast cancer
show preferential site of relapse. Cancer Res. 68:3108–3114. 2008.
View Article : Google Scholar : PubMed/NCBI
|
|
3
|
Silver DP, Richardson AL, Eklund AC, Wang
ZC, Szallasi Z, Li Q, Juul N, Leong CO, Calogrias D, Buraimoh A, et
al: Efficacy of neoadjuvant Cisplatin in triple-negative breast
cancer. J Clin Oncol. 28:1145–1153. 2010. View Article : Google Scholar : PubMed/NCBI
|
|
4
|
Collignon J, Lousberg L, Schroeder H and
Jerusalem G: Triple-negative breast cancer: Treatment challenges
and solutions. Breast Cancer (Dove Med Press. 8:93–107.
2016.PubMed/NCBI
|
|
5
|
O'Shaughnessy J, Osborne C, Pippen JE,
Yoffe M, Patt D, Rocha C, Koo IC, Sherman BM and Bradley C:
Iniparib plus chemotherapy in metastatic triple-negative breast
cancer. N Engl J Med. 364:205–214. 2011. View Article : Google Scholar : PubMed/NCBI
|
|
6
|
Telli ML, Jensen KC, Vinayak S, Kurian AW,
Lipson JA, Flaherty PJ, Timms K, Abkevich V, Schackmann EA, Wapnir
IL, et al: Phase II study of gemcitabine, carboplatin, and iniparib
as neoadjuvant therapy for triple-negative and BRCA1/2
mutation-associated breast cancer with assessment of a tumor-based
measure of genomic instability: PrECOG 0105. J Clin Oncol.
33:1895–1901. 2015. View Article : Google Scholar : PubMed/NCBI
|
|
7
|
Nanda R, Chow LQ, Dees EC, Berger R, Gupta
S, Geva R, Pusztai L, Pathiraja K, Aktan G, Cheng JD, et al:
Pembrolizumab in patients with advanced triple-negative breast
cancer: Phase Ib KEYNOTE-012 Study. J Clin Oncol. 34:2460–2467.
2016. View Article : Google Scholar : PubMed/NCBI
|
|
8
|
Fumagalli C, Pruneri G, Possanzini P,
Manzotti M, Barile M, Feroce I, Colleoni M, Bonanni B, Maisonneuve
P, Radice P, et al: Methylation of O6-methylguanine-DNA
methyltransferase (MGMT) promoter gene in triple-negative breast
cancer patients. Breast Cancer Res Treat. 134:131–137. 2012.
View Article : Google Scholar : PubMed/NCBI
|
|
9
|
Campone M, Valo I, Jézéquel P, Moreau M,
Boissard A, Campion L, Loussouarn D, Verriele V, Coqueret O and
Guette C: Prediction of recurrence and survival for triple-negative
breast cancer (TNBC) by a protein signature in tissue samples. Mol
Cell Proteomics. 14:2936–2946. 2015. View Article : Google Scholar : PubMed/NCBI
|
|
10
|
Wang CQ, Li Y, Huang BF, Zhao YM, Yuan H,
Guo D, Su CM, Hu GN, Wang Q, Long T, et al: EGFR conjunct FSCN1 as
a novel therapeutic strategy in triple-negative breast cancer. Sci
Rep. 7:156542017. View Article : Google Scholar : PubMed/NCBI
|
|
11
|
Inanc M, Ozkan M, Karaca H, Berk V,
Bozkurt O, Duran AO, Ozaslan E, Akgun H, Tekelioglu F and Elmali F:
Cytokeratin 5/6, c-Met expressions, and PTEN loss prognostic
indicators in triple-negative breast cancer. Med Oncol. 31:8012014.
View Article : Google Scholar : PubMed/NCBI
|
|
12
|
Tutt A, Robson M, Garber JE, Domchek SM,
Audeh MW, Weitzel JN, Friedlander M, Arun B, Loman N, Schmutzler
RK, et al: Oral poly(ADP-ribose) polymerase inhibitor olaparib in
patients with BRCA1 or BRCA2 mutations and advanced breast cancer:
A proof-of-concept trial. Lancet. 376:235–244. 2010. View Article : Google Scholar : PubMed/NCBI
|
|
13
|
Bianchini G, Balko JM, Mayer IA, Sanders
ME and Gianni L: Triple-negative breast cancer: Challenges and
opportunities of a heterogeneous disease. Nat Rev Clin Oncol.
13:674–690. 2016. View Article : Google Scholar : PubMed/NCBI
|
|
14
|
Nedeljković M and Damjanović A: Mechanisms
of chemotherapy resistance in triple-negative breast cancer-how we
can rise to the challenge. Cells. 8:9572019. View Article : Google Scholar
|
|
15
|
Curtis C, Shah SP, Chin SF, Turashvili G,
Rueda OM, Dunning MJ, Speed D, Lynch AG, Samarajiwa S, Yuan Y, et
al: The genomic and transcriptomic architecture of 2,000 breast
tumours reveals novel subgroups. Nature. 486:346–352. 2012.
View Article : Google Scholar : PubMed/NCBI
|
|
16
|
Lehmann BD, Bauer JA, Chen X, Sanders ME,
Chakravarthy AB, Shyr Y and Pietenpol JA: Identification of human
triple-negative breast cancer subtypes and preclinical models for
selection of targeted therapies. J Clin Invest. 121:2750–2767.
2011. View
Article : Google Scholar : PubMed/NCBI
|
|
17
|
Harano K, Wang Y, Lim B, Seitz RS, Morris
SW, Bailey DB, Hout DR, Skelton RL, Ring BZ, Masuda H, et al: Rates
of immune cell infiltration in patients with triple-negative breast
cancer by molecular subtype. PLoS One. 13:e02045132018. View Article : Google Scholar : PubMed/NCBI
|
|
18
|
Bonsang-Kitzis H, Sadacca B, Hamy-Petit
AS, Moarii M, Pinheiro A, Laurent C and Reyal F: Biological
network-driven gene selection identifies a stromal immune module as
a key determinant of triple-negative breast carcinoma prognosis.
Oncoimmunology. 5:e10611762015. View Article : Google Scholar : PubMed/NCBI
|
|
19
|
Burstein MD, Tsimelzon A, Poage GM,
Covington KR, Contreras A, Fuqua SA, Savage MI, Osborne CK,
Hilsenbeck SG, Chang JC, et al: Comprehensive genomic analysis
identifies novel subtypes and targets of triple-negative breast
cancer. Clin Cancer Res. 21:1688–1698. 2015. View Article : Google Scholar : PubMed/NCBI
|
|
20
|
Fumarola C, Petronini PG and Alfieri R:
Impairing energy metabolism in solid tumors through agents
targeting oncogenic signaling pathways. Biochem Pharmacol.
151:114–125. 2018. View Article : Google Scholar : PubMed/NCBI
|
|
21
|
Spencer NY and Stanton RC: The Warburg
effect, lactate, and nearly a century of trying to cure cancer.
Seminars Nephrol. 39:380–393. 2019. View Article : Google Scholar
|
|
22
|
Schwartz L, Supuran CT and Alfarouk KO:
The Warburg effect and the hallmarks of cancer. Anticancer Agents
Med Chem. 17:164–170. 2017. View Article : Google Scholar : PubMed/NCBI
|
|
23
|
Sonveaux P, Végran F, Schroeder T, Wergin
MC, Verrax J, Rabbani ZN, De Saedeleer CJ, Kennedy KM, Diepart C,
Jordan BF, et al: Targeting lactate-fueled respiration selectively
kills hypoxic tumor cells in mice. J Clin Invest. 118:3930–3942.
2008.PubMed/NCBI
|
|
24
|
Whitaker-Menezes D, Martinez-Outschoorn
UE, Flomenberg N, Birbe RC, Witkiewicz AK, Howell A, Pavlides S,
Tsirigos A, Ertel A, Pestell RG, et al: Hyperactivation of
oxidative mitochondrial metabolism in epithelial cancer cells in
situ: Visualizing the therapeutic effects of metformin in tumor
tissue. Cell Cycle. 10:4047–4064. 2011. View Article : Google Scholar : PubMed/NCBI
|
|
25
|
Faubert B, Li KY, Cai L, Hensley CT, Kim
J, Zacharias LG, Yang C, Do QN, Doucette S, Burguete D, et al:
Lactate metabolism in human lung tumors. Cell. 171:358–371.e9.
2017. View Article : Google Scholar : PubMed/NCBI
|
|
26
|
Nieman KM, Kenny HA, Penicka CV, Ladanyi
A, Buell-Gutbrod R, Zillhardt MR, Romero IL, Carey MS, Mills GB,
Hotamisligil GS, et al: Adipocytes promote ovarian cancer
metastasis and provide energy for rapid tumor growth. Nat Med.
17:1498–1503. 2011. View
Article : Google Scholar : PubMed/NCBI
|
|
27
|
Le A, Lane AN, Hamaker M, Bose S, Gouw A,
Barbi J, Tsukamoto T, Rojas CJ, Slusher BS, Zhang H, et al:
Glucose-independent glutamine metabolism via TCA cycling for
proliferation and survival in B cells. Cell Metab. 15:110–121.
2012. View Article : Google Scholar : PubMed/NCBI
|
|
28
|
Pacheco-Velazquez SC, Robledo-Cadena DX,
Hernandez-Resendiz I, Gallardo-Perez JC, Moreno-Sanchez R and
Rodriguez-Enriquez S: Energy metabolism drugs block triple negative
breast metastatic cancer cell phenotype. Mol Pharm. 15:2151–2164.
2018. View Article : Google Scholar : PubMed/NCBI
|
|
29
|
Kim S, Kim DH, Jung WH and Koo JS:
Metabolic phenotypes in triple-negative breast cancer. Tumour Biol.
34:1699–1712. 2013. View Article : Google Scholar : PubMed/NCBI
|
|
30
|
Jeon HM, Kim DH, Jung WH and Koo JS:
Expression of cell metabolism-related genes in different molecular
subtypes of triple-negative breast cancer. Tumori. 99:555–564.
2013. View Article : Google Scholar : PubMed/NCBI
|
|
31
|
Camarda R, Zhou AY, Kohnz RA, Balakrishnan
S, Mahieu C, Anderton B, Eyob H, Kajimura S, Tward A, Krings G, et
al: Inhibition of fatty acid oxidation as a therapy for
MYC-overexpressing triple-negative breast cancer. Nat Med.
22:427–432. 2016. View Article : Google Scholar : PubMed/NCBI
|
|
32
|
Yamashita Y, Nishiumi S, Kono S, Takao S,
Azuma T and Yoshida M: Differences in elongation of very long chain
fatty acids and fatty acid metabolism between triple-negative and
hormone receptor-positive breast cancer. BMC Cancer. 17:5892017.
View Article : Google Scholar : PubMed/NCBI
|
|
33
|
Jézéquel P, Kerdraon O, Hondermarck H,
Guérin-Charbonnel C, Lasla H, Gouraud W, Canon JL, Gombos A, Dalenc
F and Delaloge S: Gene-expression molecular subtyping of
triple-negative breast cancer tumours: Importance of immune
response. Breast Cancer Res. 17:432015. View Article : Google Scholar : PubMed/NCBI
|
|
34
|
Sabatier R, Finetti P, Cervera N,
Lambaudie E, Esterni B, Mamessier E, Tallet A, Chabannon C, Extra
JM, Jacquemier J, et al: A gene expression signature identifies two
prognostic subgroups of basal breast cancer. Breast Cancer Res
Treat. 126:407–420. 2011. View Article : Google Scholar : PubMed/NCBI
|
|
35
|
Irizarry RA, Bolstad BM, Collin F, Cope
LM, Hobbs B and Speed TP: Summaries of Affymetrix GeneChip probe
level data. Nucleic Acids Res. 31:e152003. View Article : Google Scholar : PubMed/NCBI
|
|
36
|
Haw R and Stein L: Using the reactome
database. Curr Protoc Bioinformatics Chapter 8: Unit8.7. 2012.
View Article : Google Scholar
|
|
37
|
Brunet JP, Tamayo P, Golub TR and Mesirov
JP: Metagenes and molecular pattern discovery using matrix
factorization. Proc Natl Acad Sci USA. 101:4164–4169. 2004.
View Article : Google Scholar : PubMed/NCBI
|
|
38
|
Li T, Fan J, Wang B, Traugh N, Chen Q, Liu
JS, Li B and Liu XS: TIMER: A web server for comprehensive analysis
of tumor-infiltrating immune cells. Cancer Res. 77:e108–e110. 2017.
View Article : Google Scholar : PubMed/NCBI
|
|
39
|
Hou JY, Wang YG, Ma SJ, Yang BY and Li QP:
Identification of a prognostic 5-Gene expression signature for
gastric cancer. J Cancer Res Clin Oncol. 143:619–629. 2017.
View Article : Google Scholar : PubMed/NCBI
|
|
40
|
Love MI, Huber W and Anders S: Moderated
estimation of fold change and dispersion for RNA-seq data with
DESeq2. Genome Biol. 15:5502014. View Article : Google Scholar : PubMed/NCBI
|
|
41
|
Song W, Miao DL and Chen L: Comprehensive
analysis of long noncoding RNA-associated competing endogenous RNA
network in cholangiocarcinoma. Biochem Biophys Res Commun.
506:1004–1012. 2018. View Article : Google Scholar : PubMed/NCBI
|
|
42
|
Shannon P, Markiel A, Ozier O, Baliga NS,
Wang JT, Ramage D, Amin N, Schwikowski B and Ideker T: Cytoscape: A
software environment for integrated models of biomolecular
interaction networks. Genome Res. 13:2498–2504. 2003. View Article : Google Scholar : PubMed/NCBI
|
|
43
|
Subramanian A, Tamayo P, Mootha VK,
Mukherjee S, Ebert BL, Gillette MA, Paulovich A, Pomeroy SL, Golub
TR, Lander ES and Mesirov JP: Gene set enrichment analysis: A
knowledge-based approach for interpreting genome-wide expression
profiles. Proc Natl Acad Sci USA. 102:15545–15550. 2005. View Article : Google Scholar : PubMed/NCBI
|
|
44
|
Youden WJ: Index for rating diagnostic
tests. Cancer. 3:32–35. 1950. View Article : Google Scholar : PubMed/NCBI
|
|
45
|
Xie G, Yang H, Ma D, Sun Y, Chen H, Hu X,
Jiang YZ and Shao ZM: Integration of whole-genome sequencing and
functional screening identifies a prognostic signature for lung
metastasis in triple-negative breast cancer. Int J Cancer.
145:2850–2860. 2019. View Article : Google Scholar : PubMed/NCBI
|
|
46
|
Lv X, He M, Zhao Y, Zhang L, Zhu W, Jiang
L, Yan Y, Fan Y, Zhao H, Zhou S, et al: Identification of potential
key genes and pathways predicting pathogenesis and prognosis for
triple-negative breast cancer. Cancer Cell Int. 19:1722019.
View Article : Google Scholar : PubMed/NCBI
|
|
47
|
Quist J, Mirza H, Cheang MCU, Telli ML,
O'Shaughnessy JA, Lord CJ, Tutt ANJ and Grigoriadis A: A Four-gene
decision tree signature classification of Triple-negative breast
cancer: Implications for targeted therapeutics. Mol Cancer Ther.
18:204–212. 2019. View Article : Google Scholar : PubMed/NCBI
|
|
48
|
Balachandran VP, Gonen M, Smith JJ and
DeMatteo RP: Nomograms in oncology: More than meets the eye. Lancet
Oncol. 16:e173–e180. 2015. View Article : Google Scholar : PubMed/NCBI
|
|
49
|
Tseng LM, Hsu NC, Chen SC, Lu YS, Lin CH,
Chang DY, Li H, Lin YC, Chang HK, Chao TC, et al: Distant
metastasis in triple-negative breast cancer. Neoplasma. 60:290–294.
2013. View Article : Google Scholar : PubMed/NCBI
|
|
50
|
Altundag K: Genomic profiling of brain
metastasis and matched primary Triple-negative breast cancer. Clin
Breast Cancer. 17:e1612017. View Article : Google Scholar : PubMed/NCBI
|
|
51
|
Abramson VG and Mayer IA: Molecular
heterogeneity of triple negative breast cancer. Curr Br Cancer Rep.
6:154–158. 2014. View Article : Google Scholar
|
|
52
|
Chiu AM, Mitra M, Boymoushakian L and
Coller HA: Integrative analysis of the inter-tumoral heterogeneity
of triple-negative breast cancer. Sci Rep. 8:118072018. View Article : Google Scholar : PubMed/NCBI
|
|
53
|
Hashimoto N, Nagano H and Tanaka T: The
role of tumor suppressor p53 in metabolism and energy regulation,
and its implication in cancer and lifestyle-related diseases.
Endocr J. 66:485–496. 2019. View Article : Google Scholar : PubMed/NCBI
|
|
54
|
Zhu S, Dong Z, Ke X, Hou J, Zhao E, Zhang
K, Wang F, Yang L, Xiang Z and Cui H: The roles of sirtuins family
in cell metabolism during tumor development. Semin Cancer Biol.
57:59–71. 2019. View Article : Google Scholar : PubMed/NCBI
|
|
55
|
Lu J: The Warburg metabolism fuels tumor
metastasis. Cancer Metastasis Rev. 38:157–164. 2019. View Article : Google Scholar : PubMed/NCBI
|
|
56
|
Urra FA, Munoz F, Cordova-Delgado M,
Ramírez MP, Peña-Ahumada B, Rios M, Cruz P, Ahumada-Castro U,
Bustos G, Silva-Pavez E, et al: FR58P1a; a new uncoupler of OXPHOS
that inhibits migration in triple-negative breast cancer cells via
Sirt1/AMPK/β1-integrin pathway. Sci Rep. 8:131902018. View Article : Google Scholar : PubMed/NCBI
|
|
57
|
Li W, Tanikawa T, Kryczek I, Xia H, Li G,
Wu K, Wei S, Zhao L, Vatan L, Wen B, et al: Aerobic glycolysis
controls myeloid-derived suppressor cells and tumor immunity via a
specific CEBPB isoform in triple-negative breast cancer. Cell
Metab. 28:87–103.e6. 2018. View Article : Google Scholar : PubMed/NCBI
|
|
58
|
Cserni G, Chmielik E, Cserni B and Tot T:
The new TNM-based staging of breast cancer. Virchows Arch.
472:697–703. 2018. View Article : Google Scholar : PubMed/NCBI
|
|
59
|
Hortobagyi GN, Edge SB and Giuliano A: New
and important changes in the TNM staging system for breast cancer.
Am Soc Clin Oncol Educ Book. 38:457–467. 2018. View Article : Google Scholar : PubMed/NCBI
|
|
60
|
Chen YC, Gonzalez ME, Burman B, Zhao X,
Anwar T, Tran M, Medhora N, Hiziroglu AB, Lee W, Cheng YH, et al:
Mesenchymal Stem/Stromal cell engulfment reveals metastatic
advantage in breast cancer. Cell Rep. 27:3916–3926.e5. 2019.
View Article : Google Scholar : PubMed/NCBI
|
|
61
|
Kalantari-Dehaghi M, Parnell EA, Armand T,
Bernard HU and Grando SA: The nicotinic acetylcholine
receptor-mediated reciprocal effects of the tobacco nitrosamine NNK
and SLURP-1 on human mammary epithelial cells. Int Immunopharmacol.
29:99–104. 2015. View Article : Google Scholar : PubMed/NCBI
|
|
62
|
Zhu L, Ma N, Wang B, Wang L, Zhou C, Yan
Y, He J and Ren Y: Significant prognostic values of aquaporin mRNA
expression in breast cancer. Cancer Manag Res. 11:1503–1515. 2019.
View Article : Google Scholar : PubMed/NCBI
|
|
63
|
Wittliff JL, Sereff SB and Daniels MW:
Expression of genes for methylxanthine pathway-associated enzymes
accompanied by sex steroid receptor status impacts breast carcinoma
progression. Hormones Cancer. 8:298–313. 2017. View Article : Google Scholar : PubMed/NCBI
|
|
64
|
de Vega S, Kondo A, Suzuki M, Arai H,
Jiapaer S, Sabit H, Nakada M, Ikeuchi T, Ishijima M,
Arikawa-Hirasawa E, et al: Fibulin-7 is overexpressed in
glioblastomas and modulates glioblastoma neovascularization through
interaction with angiopoietin-1. Int J Cancer. 145:2157–2169. 2019.
View Article : Google Scholar : PubMed/NCBI
|
|
65
|
Celestino R, Nome T, Pestana A, Hoff AM,
Gonçalves AP, Pereira L, Cavadas B, Eloy C, Bjøro T,
Sobrinho-Simões M, et al: CRABP1, C1QL1 and LCN2 are biomarkers of
differentiated thyroid carcinoma, and predict extrathyroidal
extension. BMC Cancer. 18:682018. View Article : Google Scholar : PubMed/NCBI
|
|
66
|
Atiakshin D, Buchwalow I, Samoilova V and
Tiemann M: Tryptase as a polyfunctional component of mast cells.
Histochem Cell Biol. 149:461–477. 2018. View Article : Google Scholar : PubMed/NCBI
|
|
67
|
Aponte-López A, Fuentes-Pananá EM,
Cortes-Muñoz D and Muñoz-Cruz S: Mast cell, the neglected member of
the tumor microenvironment: Role in breast cancer. J Immunol Res.
2018:25842432018. View Article : Google Scholar : PubMed/NCBI
|
|
68
|
Yang XP, Li Y, Wang Y, Wang Y and Wang P:
Beta-Tryptase up-regulates vascular endothelial growth factor
expression via proteinase-activated receptor-2 and
mitogen-activated protein kinase pathways in bone marrow stromal
cells in acute myeloid leukemia. Leuk Lymphoma. 51:1550–1558. 2010.
View Article : Google Scholar : PubMed/NCBI
|