Introduction
Colorectal cancer (CRC), the third most common
malignancy, is the fourth leading cause of cancer-related deaths in
the world due to late tumor detection and rapid progression as CRC
easily develops into a metastatic stage of growth (1,2).
Approximately 90% of CRC patients can be cured by surgery at the
early stage of tumor progression. Unfortunately, many CRC patients
are usually diagnosed at advanced stages as a consequence of the
lack of prognostic biomarkers (3).
Although there are obvious improvements in the treatment strategies
for CRC such as surgery, radiotherapy, chemotherapy and
immunotherapy (4,5), advanced-stage patients still exhibit a
poor prognosis. Moreover, the 5-year survival rate is reportedly
around 40%, in different regions such as in the UK where it is
41.5% (6,7). Therefore, more research concerning CRC
initiation and development is urgently required.
Long non-coding RNAs (lncRNAs) are a class of RNA
molecules longer than 200 nucleotides in length without a
protein-coding function. Increasing evidence suggest that the
dysregulation of lncRNA expression is implicated in multiple types
of cancer (8). Several studies also
suggest that lncRNAs are involved in cancer-related cellular
processes such as proliferation, apoptosis, migration and invasion
through regulation of gene expression (9–11). In
addition, lncRNAs can also serve as diagnostic or prognostic
markers of various types of cancers, for instance, in
hepatocellular carcinoma and prostate cancer (12–14).
Various studies have reported that RP11-400N13.3 expression may
serve as a prognostic biomarker for various cancers including
gastric cancer, colorectal cancer, lung adenocarcinoma and breast
cancer (15–19). However, the biological functions and
underlying mechanisms of RP11-400N13.3 in CRC progression has yet
to be elucidated.
In the present study, we first discovered that N13.3
(abbreviation of RP11-400N13.3 used in this study) serves as an
oncogenic lncRNA in CRC. High expression of N13.3 was observed in
both CRC patients and CRC cell lines, and was associated with poor
patient prognosis. Through a series of function-related
experiments, we observed that high N13.3 expression promoted CRC
cell proliferation, migration and invasion, and inhibited apoptosis
by regulating the miR-4722-3p/P2Y receptor family member 8 (P2RY8)
axis in vivo and in vitro. We also found that the
knockdown of N13.3 reversed these experimental results
successfully. In general, our results may contribute to the
diagnosis and treatment of CRC.
Materials and methods
Cancer tissue samples
CRC tissues along with the adjacent non-cancerous
tissues were obtained from 60 CRC patients (age: 58±9.4 years old
who underwent surgery at the First Affiliated Hospital of Kunming
Medical University between June 2015 and August 2019. All patients
had not received any treatment and had no comorbidities. The
detailed characteristics of the patients are shown in Table I. Specimens were collected and
stored at −80°C. This study was approved by the Ethics Committee of
the First Affiliated Hospital of Kunming Medical University, and
conducted following the Helsinki Declaration. All patients had
signed a written informed consent.
 | Table I.Relationship between N13.3 expression
and clinicopathological features (n=60). |
Table I.
Relationship between N13.3 expression
and clinicopathological features (n=60).
|
|
| N13.3
expression |
|
|---|
|
|
|
|
|
|---|
|
Characteristics | n | Low (n=30) | High (n=30) | P-value |
|---|
| Age, years |
|
|
| 0.605 |
|
<60 | 32 | 15 | 17 |
|
|
≥60 | 28 | 15 | 13 |
|
| Sex |
|
|
| 0.795 |
|
Female | 33 | 16 | 17 |
|
|
Male | 27 | 14 | 13 |
|
| Tumor size, cm |
|
|
| 0.001a |
| ≤5 | 36 | 25 | 11 |
|
|
>5 | 24 | 5 | 19 |
|
| Tumor location |
|
|
| 0.793 |
|
Rectum | 35 | 17 | 18 |
|
|
Colon | 25 | 13 | 12 |
|
| TNM stage |
|
|
| 0.004a |
|
I/II | 27 | 19 | 8 |
|
|
III/IV | 33 | 11 | 22 |
|
| Lymph node
metastasis |
|
|
| 0.028a |
| No | 42 | 24 | 16 |
|
|
Yes | 20 | 6 | 14 |
|
| Distant
metastasis |
|
|
| 0.023a |
| No | 54 | 29 | 23 |
|
|
Yes | 8 | 1 | 7 |
|
Cell culture and transfection
CRC cell lines (HT-29, HCT-116, HCT-8, LoVo and RKO)
as well as the normal colonic epithelial cell line (NCM460) and
293T cells were purchased from American Type Culture Collection
(ATCC, USA). We authenticated the cell lines used in this study by
STR profiling. The cells were cultured in Dulbecco's modified
Eagle's medium (DMEM; Gibco; Thermo Fisher Scientific, Inc.)
supplemented with 10% fetal bovine serum (FBS) at 37°C, and
humidified with 5% CO2 atmosphere.
The N13.3 overexpression vector pcN13.3 and pcDNA3
(negative control), short hairpin N13.3 (sh-N13.3–1 and sh-N13.3–2)
and its negative control were purchased from GenePharma. The mimics
and ASO of miR-4722-3p (miR-4722-3p mimics and miR-4722-3p ASO) and
the respective negative control (mimics NC and ASO NC) were
purchased from RiboBio. The transfection was performed with
Lipofectamine 2000 (Invitrogen; Thermo Fisher Scientific, Inc.)
following the method described by the manufacturer.
Quantitative real-time PCR
(RT-qPCR)
The total RNA of tissues and cell lines were
extracted with Trizol Reagent (Invitrogen; Thermo Fisher
Scientific, Inc.) following the method described by the
manufacturer. The total RNA was then reversely transcribed into
complementary DNA (cDNA) using RT-PCR kit obtained from Promega
Corp. Real-Time qPCR kit purchased from Qiagen was used to estimate
the expression of N13.3, miR-4722-3p and P2RY8 through the
instrumentation of an ABI 7500 real-time PCR system (Applied
Biosystems; Thermo Fisher Scientific, Inc.). Thermocycling
conditions consisted of 95°C for 5 min, 40 cycles of 95°C for 5 sec
and 60°C for 20 sec, 95°C for 15 min. The primer sequences used in
the study are as follows: lncRNA RP11-400N13.3-forward,
5′-TCACAGTAAGCTGCCTTCTAAGGAG-3′ and lncRNA RP11-400N13.3-reverse,
5′-TGGTAAGATCCCTCGGACTAAAACA-3′; miR-4722-3p-forward,
5′-TGCGGTGGCTGGACGTCCCTCCA-3′ and miR-4722-3p-reverse,
5′-CCAGTGCAGGGTCCGAGGT-3′; U6-forward, 5′-TGCGGGTGCTCGCTTCGGCAGC-3′
and U6-reverse, 5′-CCAGTGCAGGGTCCGAGGT-3′; P2RY8-forward,
5′-CGCACCGATCTCACCTACC-3′ and P2RY8-reverse,
5′-GATGGTGGCCGTGTAACAAG-3′; GAPDH-forward,
5′-CTTCTACAATGAGCTGCGTG-3′ and GAPDH-reverse,
5′-TCATGATTGAGTCAGTCAGG-3′. U6 or GAPDH was used as an endogenous
control. The relative levels of expression were calculated by the
2−ΔΔCq method (20).
Colony formation assay
CRC cells were collected after the different
treatments and were seeded into a 6-well plate having a density of
1,000 cells per well, and were cultured for 2 weeks ensuring the
replacement of the culture medium at 3-day intervals. Colonies were
fixed with 10% formaldehyde and stained with 0.4% crystal violet in
20% ethanol for 5 min. Colonies were photographed and counted using
a inverted microscope with ×4 magnification (Olympus Corp.).
Cell proliferation assay
Cell proliferation assay was performed with the Cell
Counting Kit-8 (CCK-8) Dojindo) following the method described by
the manufacturer. In brief, transfected cells were seeded into a
96-well plate at a density of 1×10⁵ cells per well for
specific time intervals (0, 24, 48 and 72 h) following the method
described by the manufacturer. Absorbance was measured at 450 nm
using a microliter plate reader, and in turn, the cell viability
was calculated.
Transwell assay
The cell migration and invasion capacities were
ascertained by Transwell assays in Transwell chamber plates
(24-well plate, 8-mm pores; BD Biosciences). For invasion assay,
the Transwell chamber was pre-coated with 50 µl of Matrigel (1:7
dilution; BD Bioscience) before the experiments. Cells
(5×10⁴ cells) following the different treatments were
placed in serum-free medium and were added into the top chambers,
with the lower chamber filled with DMEM containing 10% FBS. After
incubation for 24 h, the chambers were fixed using 4%
paraformaldehyde and stained with 0.1% crystal. Stained cells in
the lower chambers were counted in three randomly selected fields
with the aid of a inverted microscope with a magnification, ×4
(Olympus Corp.). For the migration assay, a Transwell chamber
without pretreatment with Matrigel was used, while the other steps
were the same as the invasion assay.
RNA pull-down assay
In order to determine the existence of mutual
interaction between N13.3 and miR-4722-3p, RNA pull-down assay was
performed with a T7 Megascript kit (Thermo Fisher Scientific, Inc.)
following the method described by the manufacturer. In addition,
expression of miR-4722-3p was detected by RT-qPCR.
Luciferase reporter assay
The interaction between miR-4722-3p-N13.3 and
miR-4722-3p-P2RY8 was determined by dual-luciferase reporter assay.
In brief, sequences of N13.3 or P2RY8 3′UTR containing wild-type or
mutated sites of miR-4722-3p were synthesized. Cells were
co-transfected with luciferase reporter vectors and miR-4722-3p
mimic/ASO, alongside their respective negative controls using
Lipofectamine 2000. After transfection for 48 h, the luciferase
activity was measured by the dual-luciferase reporter assay system
(Promega Corp.).
Western blot analysis
Total protein was extracted from cells or tissues
with RIPA buffer (Sigma-Aldrich; Merck KGaA). Protein concentration
was determined by the Bicinchoninic Acid (BCA) protein assay
(Beyotime Biotechnology). The 30 µg protein extracts were separated
by 10% SDS-PAGE, and then transferred onto polyvinylidene
difluoride (PVDF) membranes. The membranes were blocked by dipping
them in 5% non-fat milk at room temperature for 1 h, and incubated
with primary antibodies against caspase-3 [product no. 9662S, Cell
Signaling Technology, Inc. (CST)], Bcl2, (ab32124; Abcam), Bax
(product no. 5023S; CST), P2RY8 (cat. no. ABP52106; Abbkine) and
GAPDH (product no. 51332S; CST) overnight. All primary antibodies
were diluted with 5% non-fat milk dissolved in 1X TBST.
Furthermore, the membranes were incubated with secondary antibodies
anti-rabbit (product no. 7074S; CST) and anti-mouse (product no.
7076S; CST) at room temperature for 1 h; the secondary antibody was
combined with horseradish peroxidase. All secondary antibodies were
also diluted with 5% non-fat milk dissolved in 1X TBST. The
generated signal for the protein-antibody complex was detected by
enhanced chemiluminescence (ECL) substrate (Millipore). Protein
quantification was completed with ImageJ 1.8.0 (National Institute
of Mental Health).
Tumor xenograft assay
All animal experiments were approved by the Ethics
Committee of the First Affiliated Hospital of Kunming Medical
University. A total of 48 males BALB/c nude mice (age: 4-weeks;
weight: 17–23 g) were obtained from Beijing HFK Bioscience. Mice
were housed in an SPF environment with 40–60% relative humidity at
22–24°C with a 12-h light/dark cycle and free access to water and
food. The mice were randomly divided into two groups (six per
group), and then injected subcutaneously with 5×10⁶
HT-29 cells in 200 µl PBS transfected with sh-NC/sh-N13.3,
pcDNA3/pcN13.3, mimics NC/miR-4722-3p mimics and ASO NC/miR-4722-3p
ASO, respectively. Tumor size was measured at an interval of 4
days, and tumor volume (V) was calculated as V=length ×
width2/2. After 24 days, the nude mice were sacrificed
and tumors were excised for further investigation.
Lung metastasis model
HT-29 cells (1×10⁶) infected with sh-NC
or sh-N13.3 were injected into the tail vein of the nude mice
(n=6). After 7 weeks, mice were sacrificed and lung metastasis was
assessed by counting the number of tumor nodules, and the weight of
the lung was subsequently weighed. In addition, H&E staining
was used to evaluate lung metastasis.
Apoptosis assay
Cells were transfected for 48 h and collected in
binding buffer. Cells were stained with Annexin V-FITC for 10 min,
and PI for 5 min (Beyotime Institute of Biotechnology), following
the method described by the manufacturer. The rate of apoptosis in
cells was estimated by flow cytometry (FACScan; BD
Biosciences).
Bioinformatics analysis
Multiple lncRNA expression in CRC patients and
normal individuals was analyzed with NONCODE database (http://www.noncode.org/index.php). Refseq
database (https://www.ncbi.nlm.nih.gov/refseq/) was also used to
analyzed the expression of lncRNAs in CRC patients. RegRNA 2.0
database was used to predict the target of N13.3 (http://regrna2.mbc.nctu.edu.tw/). P2RY8 was found
to be a potential target of miR-4722-3p by Targetscan online
software (http://www.targetscan.org/vert_71/).
Statistical analysis
Data are expressed as the mean ± standard deviation
(SD) of at least three separate experiments, and analyzed using
GraphPad Prism 5 software (GraphPad Software, Inc.) and SPSS 20
software (IBM, Corp.). Differences between the two groups were
assessed with Student's independent t-test. The relationship
between N13.3, P2RY8 and miR-4722-3p was determined by Spearman's
correlation. Chi-square test was employed to assess the clinical
relationship between N13.3 expression and tumor features. One way
ANOVA was used to analyze data from multiple groups. The overall
survival curve was analyzed using the Kaplan-Meier method and
log-rank test. The expression of N13.3, miR-4722-3p, and P2RY8 was
analyzed by paired t-test in cancer tissues of CRC patients.
P<0.05 was considered to indicate a statistically significant
difference.
Results
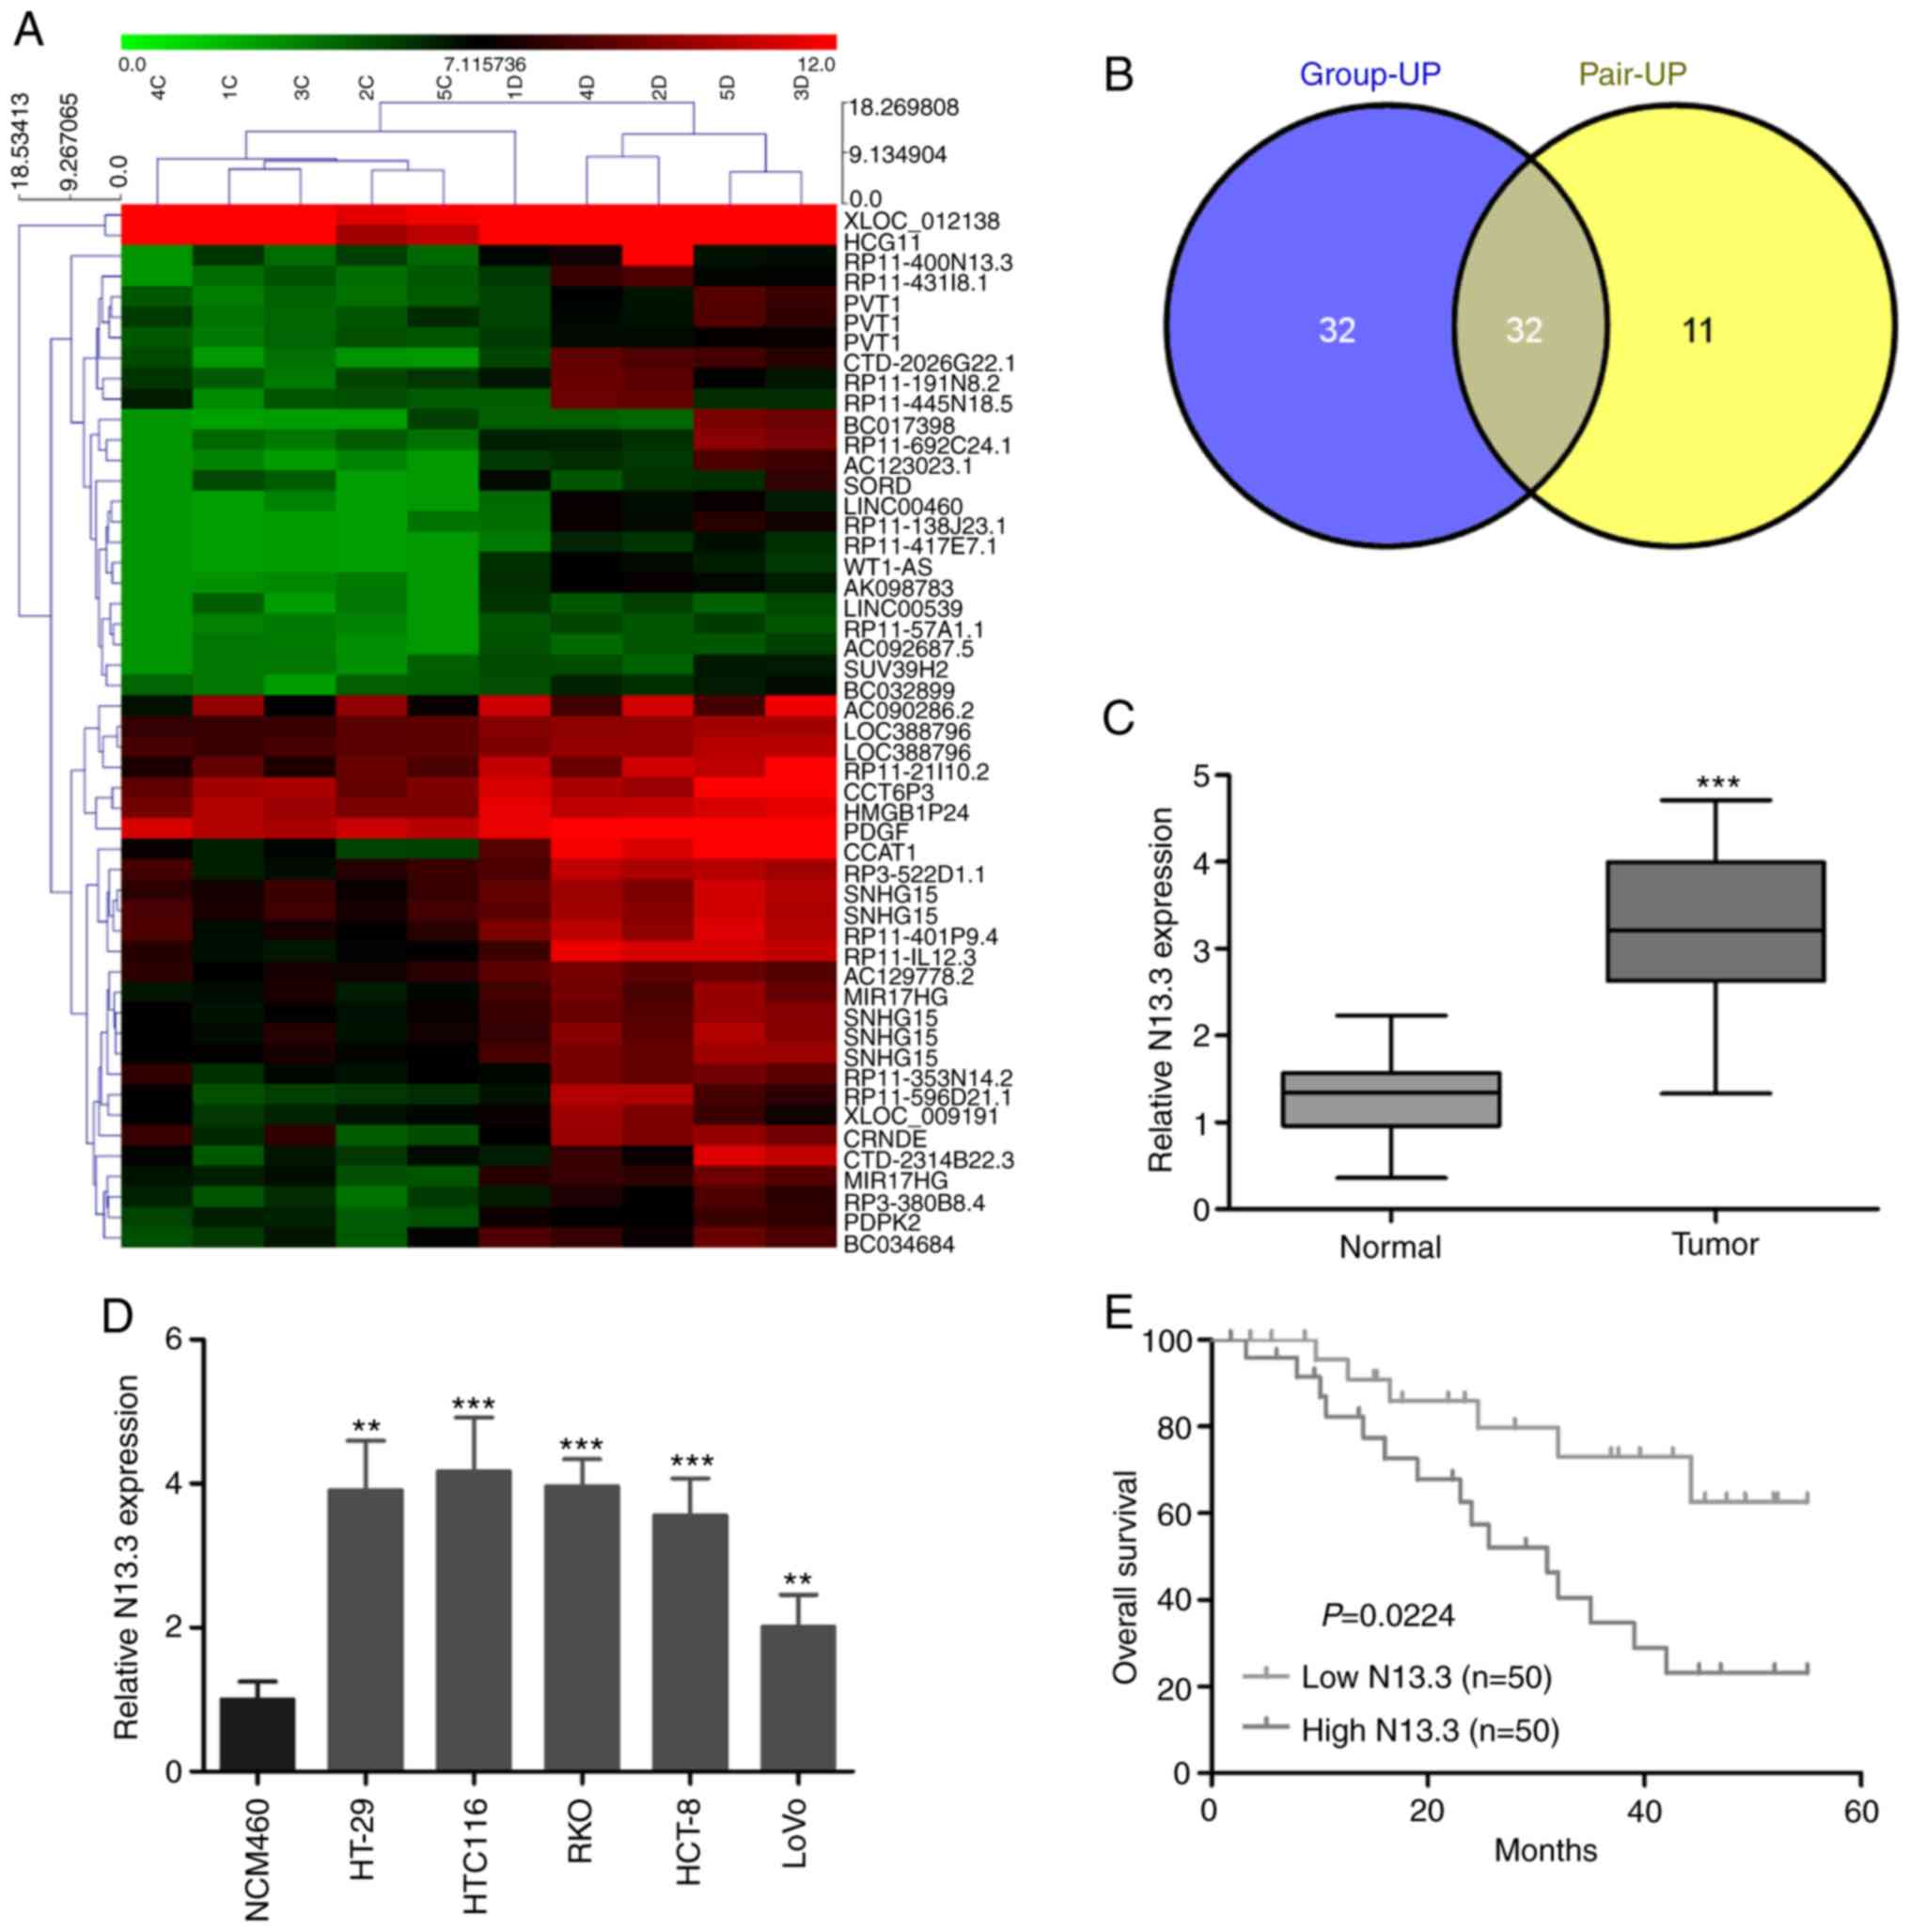
N13.3 is highly expressed in CRC
tissues and cell lines
We firstly analyzed the level of expression of
multiple lncRNAs in CRC patients and normal individuals with
NONCODE database (http://www.noncode.org/index.php). The relationship
between N13.3 expression and clinical features of the CRC patients
is shown in Table I. The heatmap
indicated that N13.3 was highly expressed in CRC patients compared
with normal individuals (Fig. 1A).
Further investigation revealed that 32 lncRNAs were overexpressed
in CRC in NONCODE and Refseq database (https://www.ncbi.nlm.nih.gov/refseq/) (Fig. 1B). In addition, the expression of
N13.3 in CRC 60 cancer tissues and corresponding adjacent normal
tissues was detected by RT-qPCR. We found that the expression of
N13.3 was upregulated in CRC tissues when compared with that in
corresponding adjacent normal tissues (Fig. 1C). Similarly, high expression of
N13.3 was found in CRC cell lines when compared with that in the
normal colonic epithelial cells (Fig.
1D). We also found that the overexpression of N13.3 was
correlated with poor overall survival of CRC patients (Fig. 1E). This results indicate that N13.3
may play a pivotal role in CRC.
Knockdown of N13.3 inhibits
proliferation, migration and invasion, and reduces apoptosis of CRC
cells
To further investigate the role of N13.3 in CRC
cells, HT-29 and HCT-116 cells were transfected with sh-N13.3 or
sh-NC and transfection efficiency was measured by RT-qPCR (Fig. 2A). CCK-8 assay revealed that the
proliferative ability of CRC cells was significantly suppressed by
the knockdown of N13.3 (Fig. 2B and
C). Consistently, we observed that the rate of apoptosis in
cells was significantly elevated following the knockdown of N13.3,
as compared with sh-NC group (Figs.
S1A and 2D). We also analyzed
the expression of apoptotic proteins. The results showed that
caspase-3 and Bax were significantly increased, and Bcl2 was
significantly decreased in the HT-29 and HCT-116 cells transfected
with sh-N13.3 when compared with the sh-NC group (Fig. 2E). The role of N13.3 in the
inhibition of cell apoptosis was confirmed by detecting the
expression of caspase-3, Bax and Bcl2 in HT-29 and HCT-116 cells
having highly expressed N13.3 (Fig.
2F). In addition, colony formation and Transwell invasion
assays revealed that the knockdown of N13.3 greatly reduced the
colony formation, migration and invasion capacity of HT-29 and
HCT-116 cells (Fig. 2G-L).
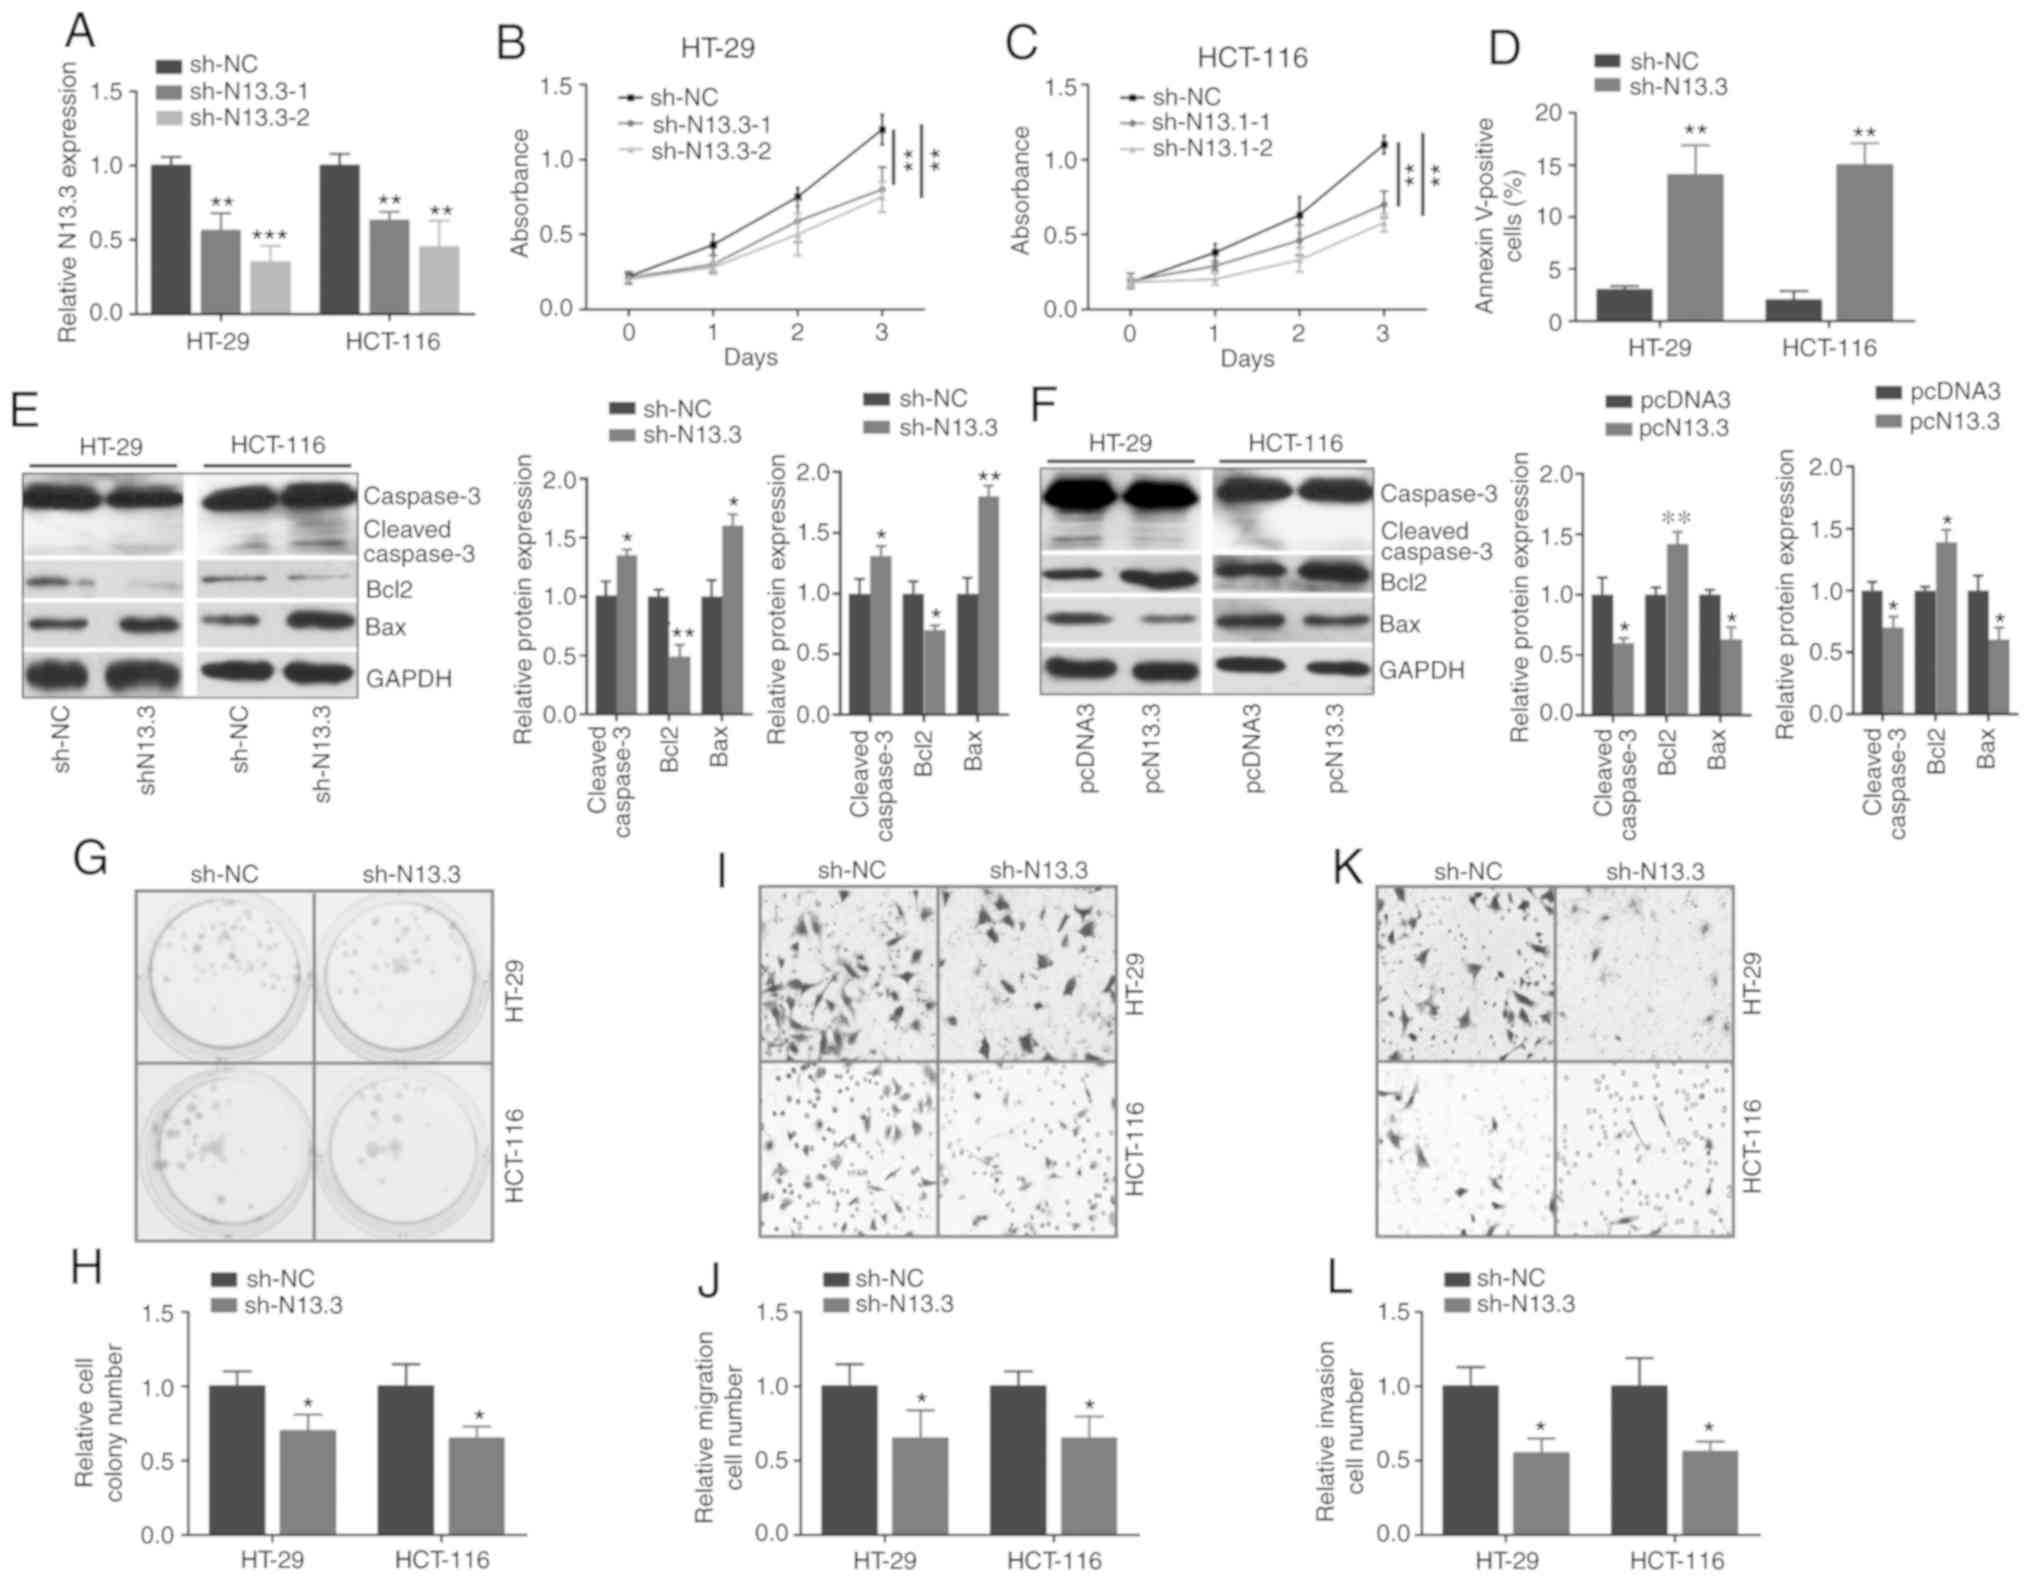 | Figure 2.Knockdown of N13.3 inhibits CRC
proliferation in vitro. HT-29 and HCT-116 cells were
transfected with sh-NC or sh-N13.3. (A) Expression of N13.3 was
assessed using RT-qPCR. **P<0.01 and ***P<0.001, compared
with the sh-NC group. (B and C) Cell viability was examined in
HT-29 and HCT-116 cells by CCK-8 assay at different time points.
**P<0.01, compared to the sh-NC group. (D) Cell apoptosis rates
were detected by flow cytometry. **P<0.01, compared to the sh-NC
group. (E and F) Western blot analysis of the expression of
apoptosis-related markers, caspase-3, Bcl2, Bax after transfection
of the CRC cells with sh-N13.3 or pcN13.3. *P<0.05, **P<0.01,
compared with the sh-NC or pcDNA3 group. (G and H) Colony formation
assay was performed in HT-29 and HCT-116 cells following
transfection with sh-N13.3. *P<0.05, compared with the sh-NC
group. (I-L) Transwell assays carried out to evaluate the migration
and invasion capacities of HT-29 and HCT-116 cells transfected with
sh-NC or sh-N13.3. *P<0.05, compared with the sh-NC group. Data
are expressed as the Means ± SD. Statistical analysis was conducted
using Student's t-test and One-way ANOVA analysis. *P<0.05,
**P<0.01 and ***P<0.001. N13.3, RP11-400N13.3; CRC,
colorectal cancer. |
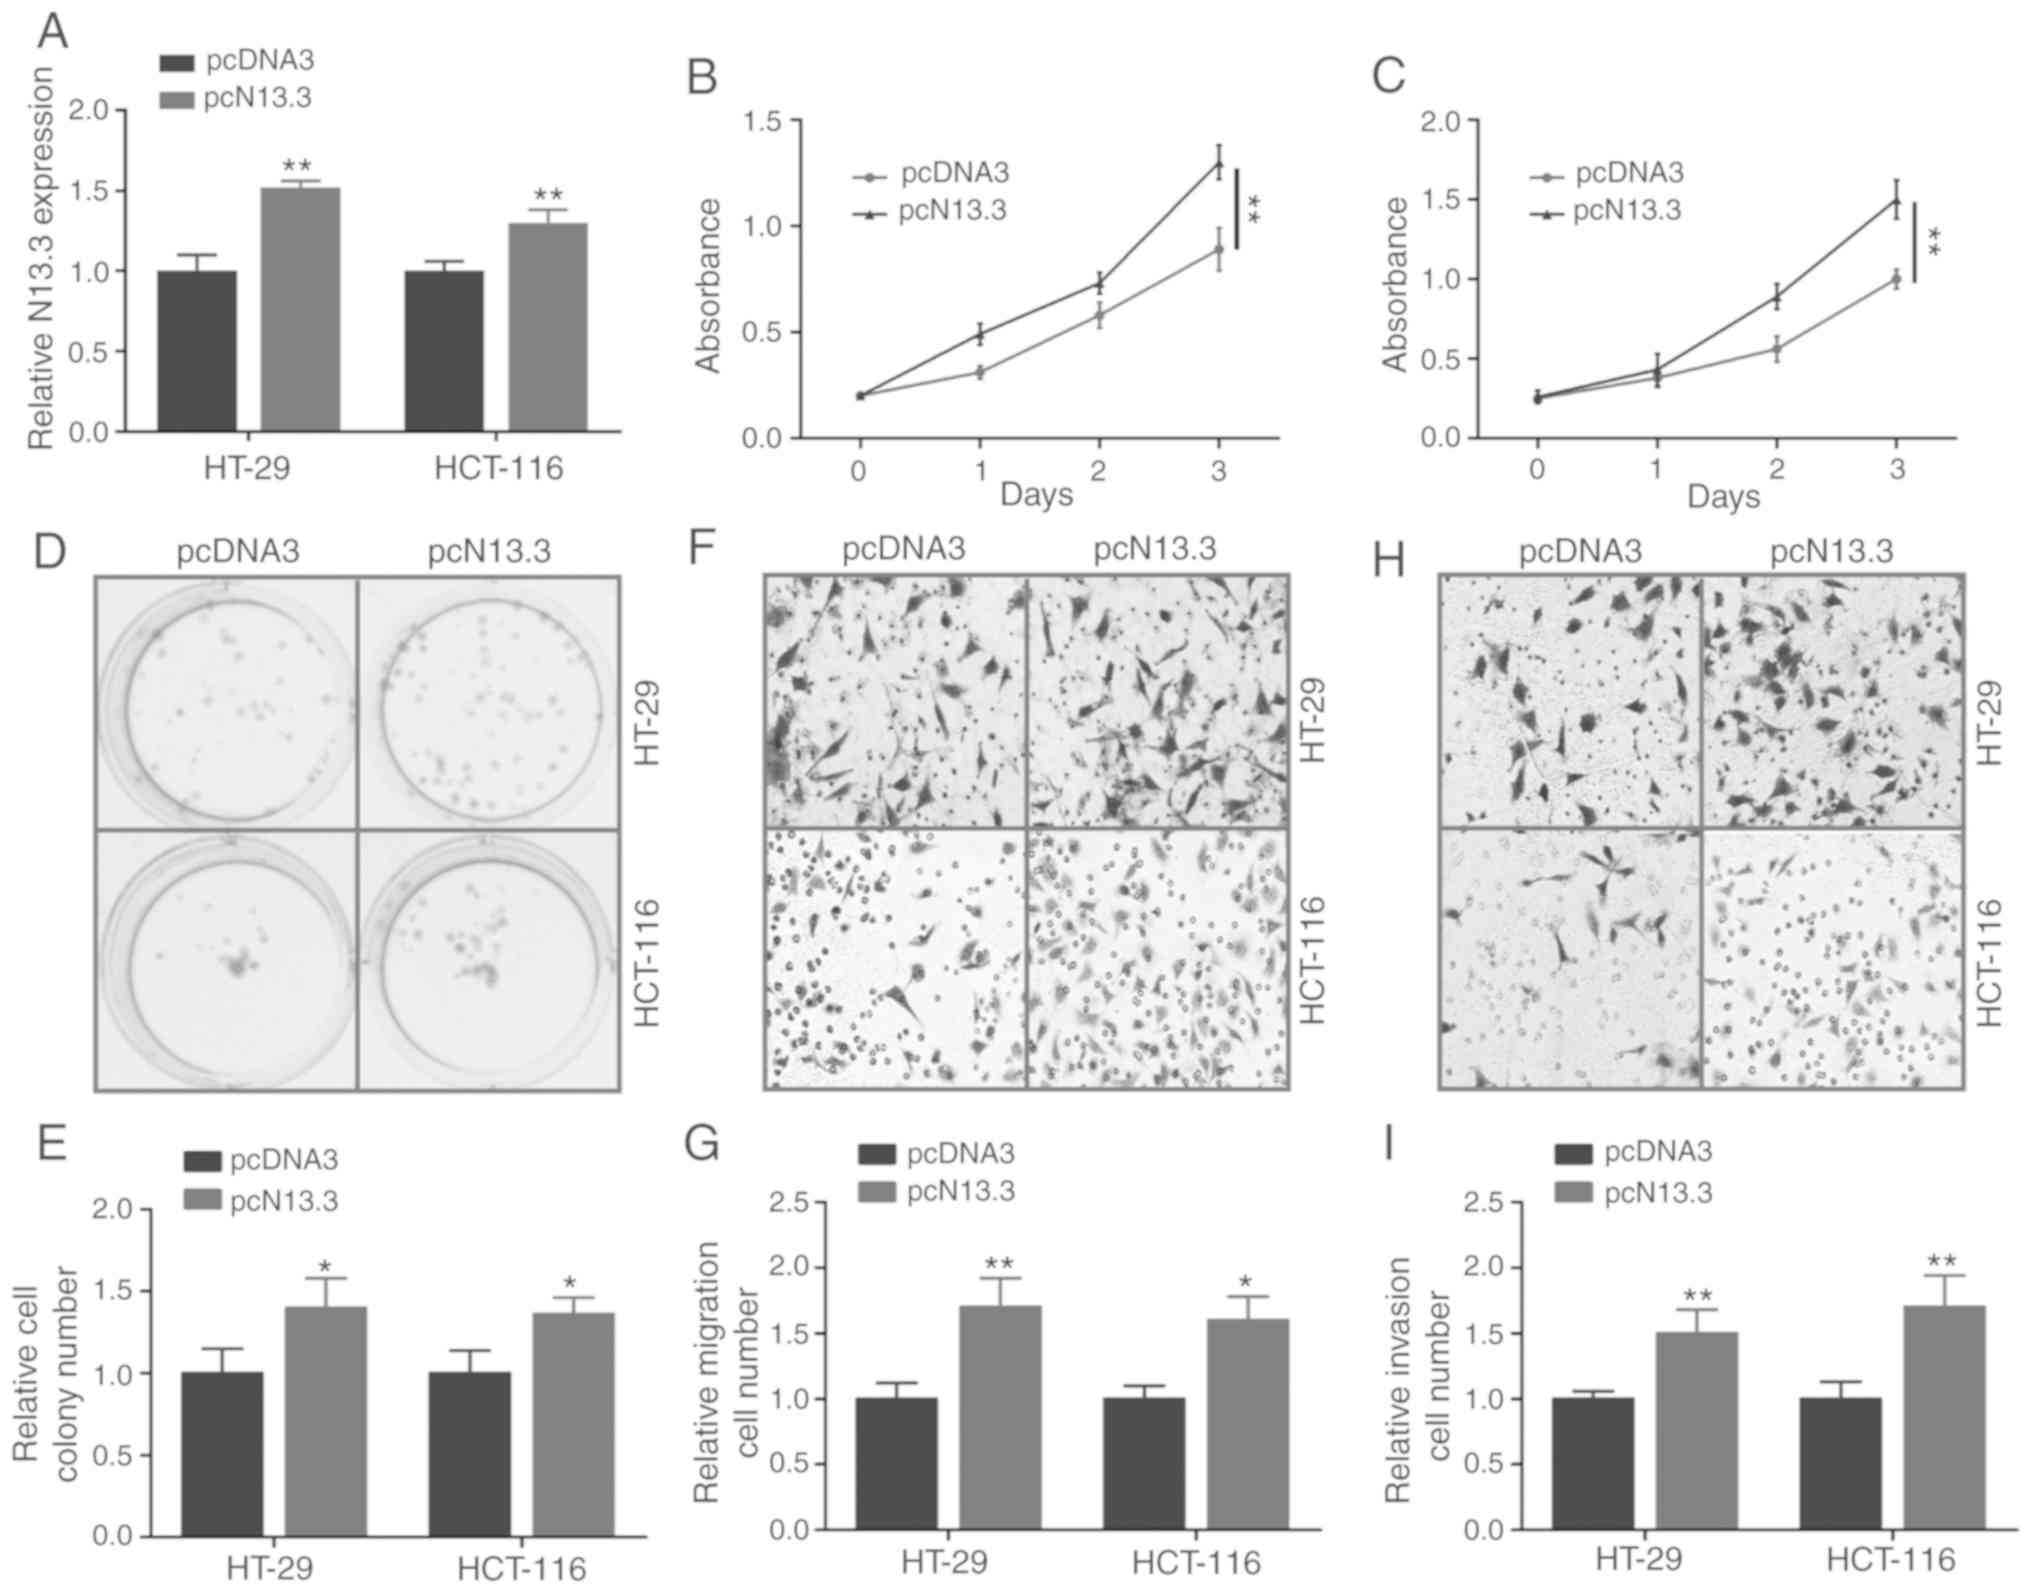
To further validate the function of N13.3 in CRC
cells, we upregulated the expression of N13.3 and ascertained the
effect on proliferation, migration and invasion of CRC cells. We
found that the expression of N13.3 was successfully increased in
CRC cells transfected with pcN13.3 (Fig. 3A). As expected, the cell
proliferation, colony formation, migration and invasion capacity
were significantly enhanced following transfection of pcN13.3 into
the CRC cells (Fig. 3B-I).
N13.3 functions as a molecular sponge
for miR-4722-3p in CRC cells
In this study, the RegRNA 2.0 database (http://regrna2.mbc.nctu.edu.tw/) predicted N13.3
as a potential downstream target of miR-4722-3p (Fig. 4A). To ascertain the potential
binding between miR-4722-3p and N13.3, the luciferase reporter
assay was performed. In briefly, HT-29 cells were transfected with
N13.3 [wild-type (wt) and mutant (mut), respectively] luciferase
reporter vector and miR-4722-3p (miR-4722-3p mimics and miR-4722-3p
ASO, respectively). Results showed that miR-4722-3p mimics
inhibited luciferase activity (Fig.
4B). However, it was enhanced by miR-4722-3p ASO (Fig. 4C). Furthermore, we detected the
expression of miR-4722-3p in CRC cell lines and tissues. The
results revealed that miR-4722-3p was significantly downregulated
in the CRC cell lines and cancer tissues as compared to the control
groups (Fig. 4D and E).
Furthermore, RNA pull down assay revealed that miR-4722-3p was
enriched in the N13.3 overexpression group as compared to the
pcDNA3 group (Fig. 4F). To further
validate these results, HT-29 and HCT-116 cells were transfected
with pcN13.3/sh-N13.3 and negative control, respectively. We found
that the expression of miR-4722-3p was significantly decreased in
cells transfected with pcN13.3 compared to the negative control
group (Fig. 4G), while sh-N13.3
induced an upregulation of miR-4722-3p (Fig. 4H). To study the effect of
miR-4722-3p on CRC cells, we first confirmed the overexpression or
knockdown efficiency of miR-4722-3p in CRC cells transfected with
miR-4722-3p mimics or ASO (Fig. S1D
and E). Next, we found that the expression of N13.3 was
significantly decreased or increased in the cells transfected with
miR-4722-3p mimics or ASO, respectively (Fig. 4I and J). In addition, N13.3 was
negatively correlated with miR-4722-3p in the clinical samples
(Fig. 4K). Finally, we observed
that miR-4722-3p mimics/ASO markedly suppressed/promoted the
proliferation, colony formation, migration and invasion of HT-29
and HCT-116 cells, but these results were reversed in cells
transfected with pcN13.3/sh-N13.3 (Figs. 4L-O and S1B and C).
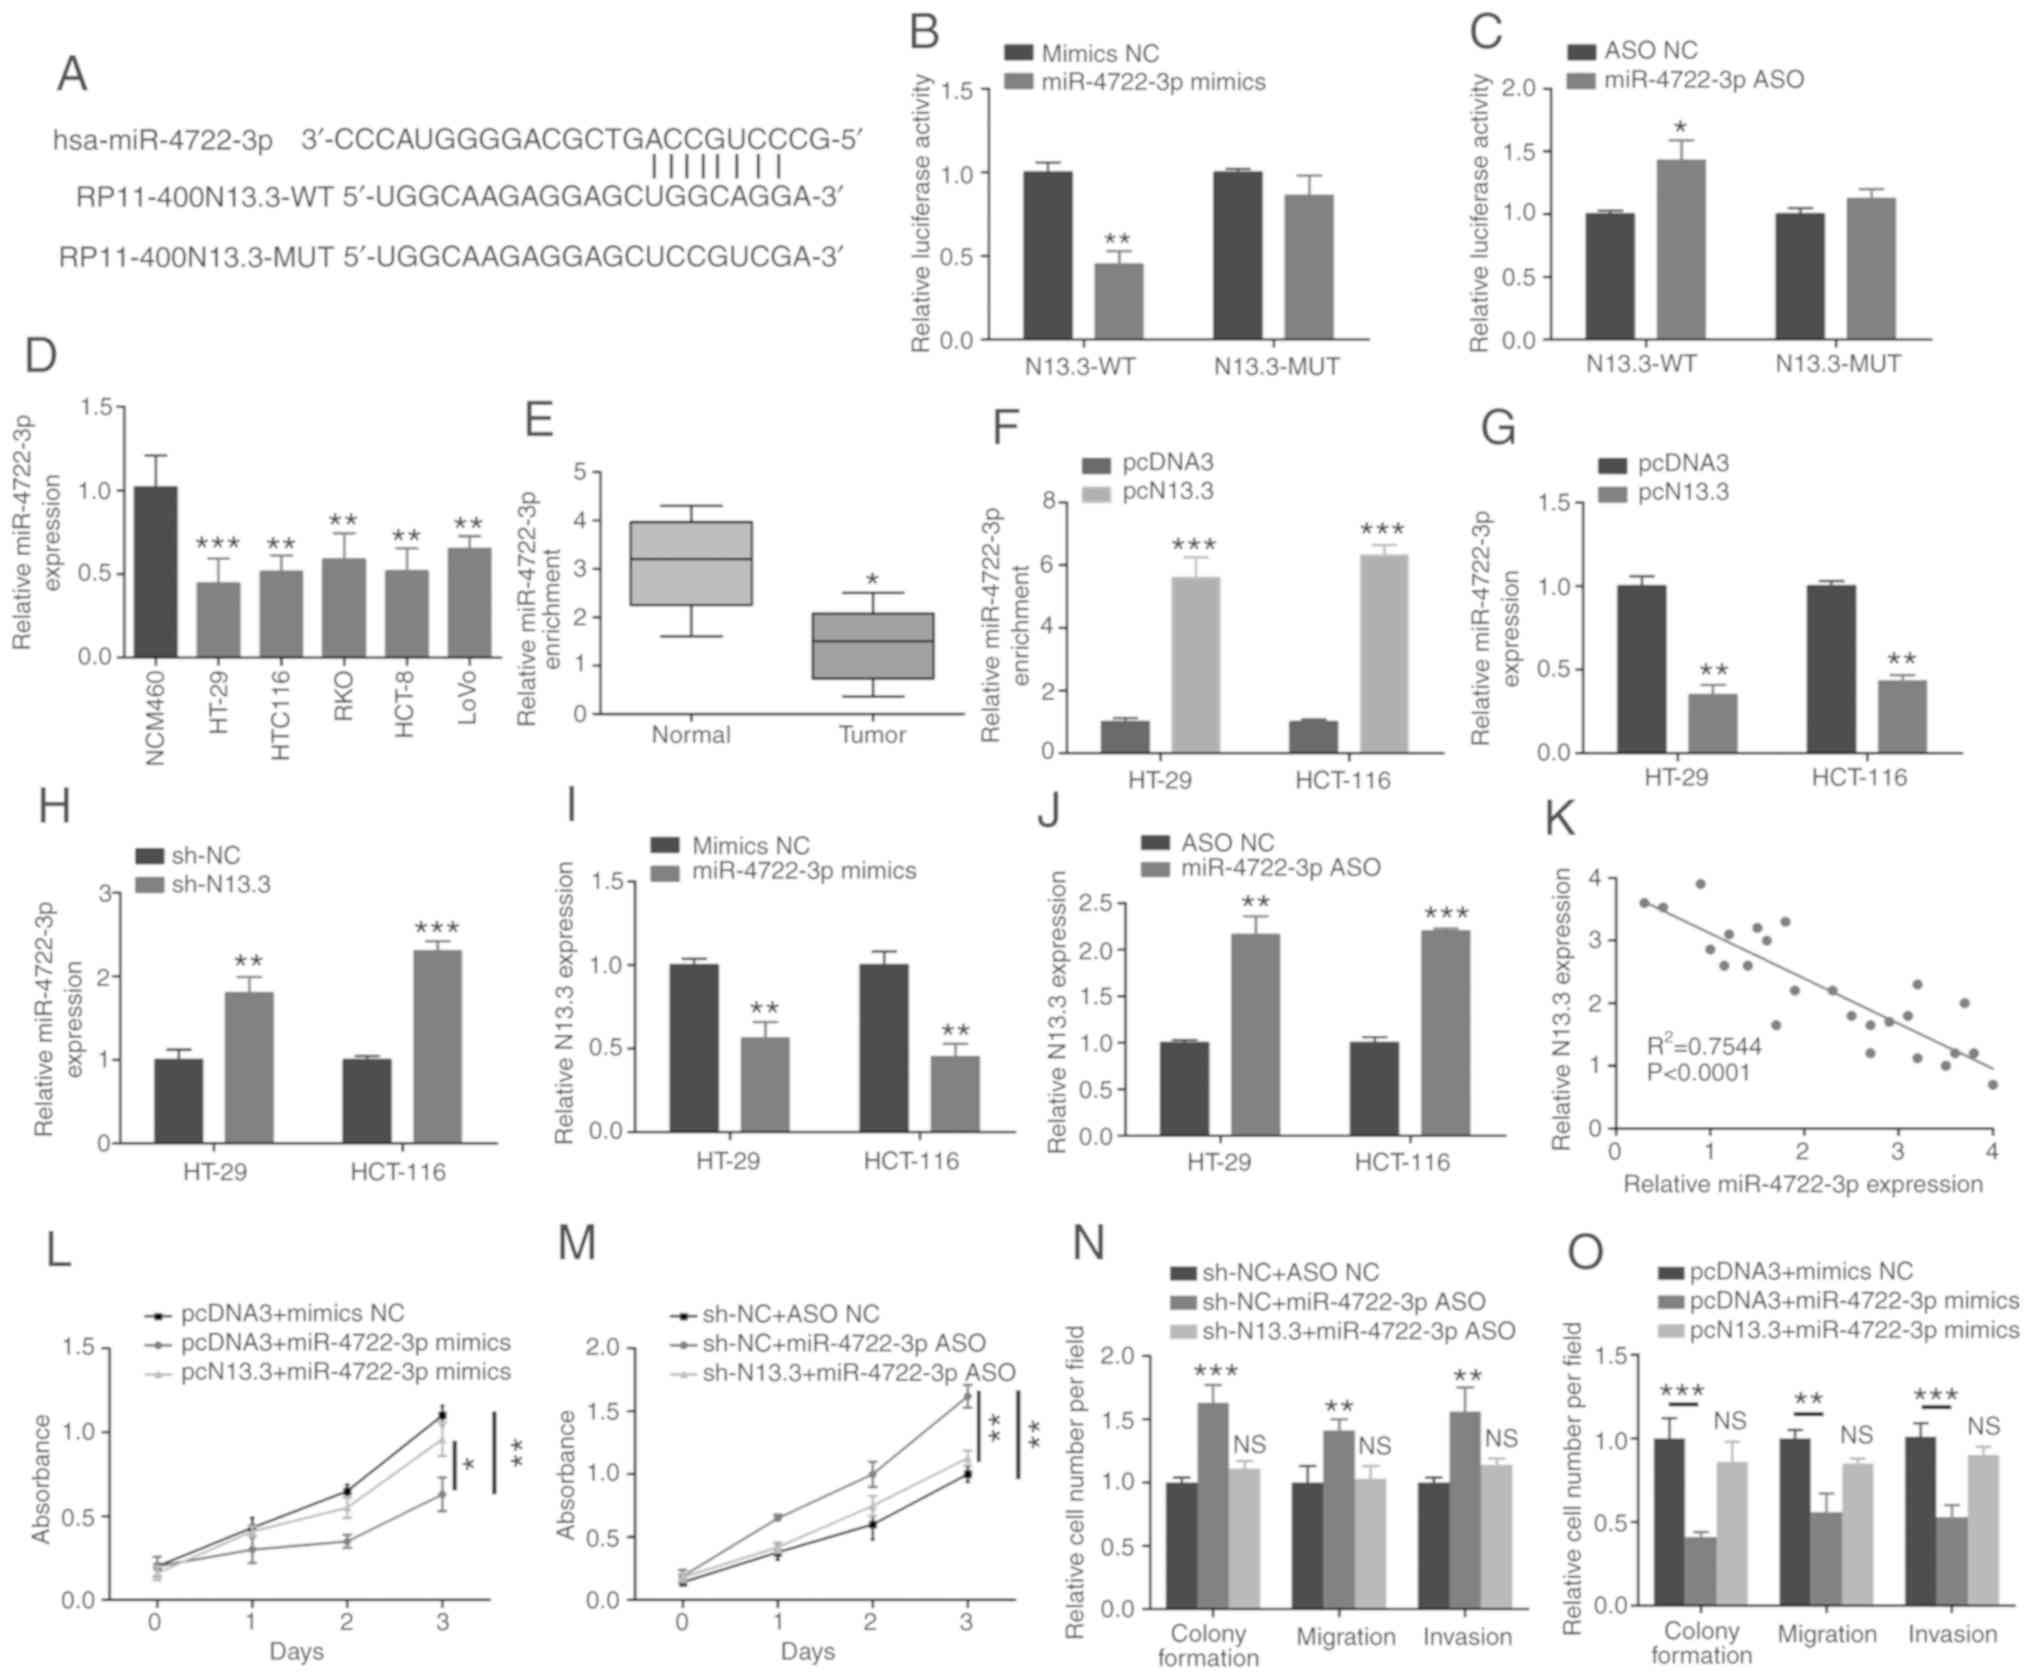 | Figure 4.N13.3 functions as a molecular sponge
for miR-4722-3p in CRC cells. (A) Bioinformatics software
Targetscan predicted the binding sites of miR-4722-3p on N13.3, and
the mutated sequence is presented. (B) Luciferase reporter assay
was performed to detect the luciferase activity of reporter vector
in HT-29 cells transfected with N13.3-WT/MUT and mimics
NC/miR-4722-3p mimics. **P<0.01, compared with the mimics NC
group. (C) Luciferase reporter assay was used to detect the
luciferase activity of reporter vector in HT-29 cells transfected
with N13.3-WT/MUT and ASO NC/miR-4722-3p ASO. *P<0.05, compared
with the ASO NC group. (D) Expression levels of miR-4722-3p were
detected in CRC cell lines and normal colonic epithelial cell line
NCM460 by RT-qPCR. **P<0.01 and ***P<0.001, compared with the
NCM460 cell line. (E) Expression levels of miR-4722-3p were
detected in CRC tumor and normal tissues using RT-qPCR (n=60).
*P<0.05, compared with the normal tissues. (F) Enrichment of
miR-4722-3p was measured in HT-29 cells transfected with pcDNA3 or
pcN13.3 using RNA-pull down assay. ***P<0.001, compared with the
pcDNA3 group. (G and H) Expression of miR-4722-3p was determined in
HT-29 and HCT-116 cells transfected with pcDNA3/pcN13.3 or
sh-NC/sh-N13.3 using RT-qPCR. **P<0.01 and ***P<0.001,
compared with the pcDNA3 or sh-NC group. (I and J) Expression of
N13.3 in HT-29 and HCT-116 cells transfected with mimics
NC/miR-4722-3p mimics or ASO NC/miR-4722-3p ASO. **P<0.01 and
***P<0.001, compared with the mimics NC or ASO NC group. (K) The
correlation was analyzed between N13.3 and miR-4722-3p expression
in the CRC cancer tissues. (L and M) CCK-8 assay was used to verify
the role of N13.3 and miR-4722-3p in HT-29 cells proliferation.
*P<0.05, **P<0.01. (N and O) Colony formation assay and
Transwell assays were carried out to determine the correlation
between N13.3 and miR-4722-3p in HT-29 cell colony formation,
migration and invasion. NS, not significant, *P<0.05,
**P<0.01 and ***P<0.001. Data are expressed as the means ±
SD. Statistical analysis was conducted using Student's t-test,
paired t-test and One-way ANOVA analysis. *P<0.05, **P<0.01
and ***P<0.001; NS, not significant. N13.3, RP11-400N13.3; CRC,
colorectal cancer. |
P2RY8 is a direct target of
miR-4722-3p in CRC cells
We further predicted P2RY8 as a potential downstream
target of miR-4722-3p by Targetscan online software (http://www.targetscan.org/vert_71/) (Fig. 5A). To determine whether miR-4722-3p
effectively targets P2RY8, the luciferase reporter assay was
employed. The results showed that the simulation of miR-4722-3p
distinctly inhibited the luciferase activity of P2RY8-WT reporter
(Fig. 5B), while miR-4722-3p ASO
significantly increased luciferase activity of P2RY8-WT reporter
(Fig. 5C). However, the miR-4722-3p
mimics or ASO exhibited no function on the luciferase activity of
cells transfected with mutated P2RY8 luciferase reporter (Fig. 5B and C). In addition, the RT-qPCR
experiment revealed a significantly high level of expression of
P2RY8 in the CRC cell lines and cancer tissues compared to the
NCM460 cells and the normal tissue (Fig. 5D and E). In addition, miR-4722-3p
mimics significantly downregulated P2RY8 expression in the HT-29
and HCT-116 cells (Fig. 5F).
Correspondingly, miR-4722-3p ASO upregulated P2RY8 expression in
the HT-29 and HCT-116 cells (Fig.
5G). Simultaneously, a negative and positive correlation was
noted between miR-4722-3p and P2RY8, and between N13.3 and P2RY8,
respectively, in the CRC tissues (Fig.
5H and I) and this was further investigated by western blot
analysis (Fig. 5J and K).
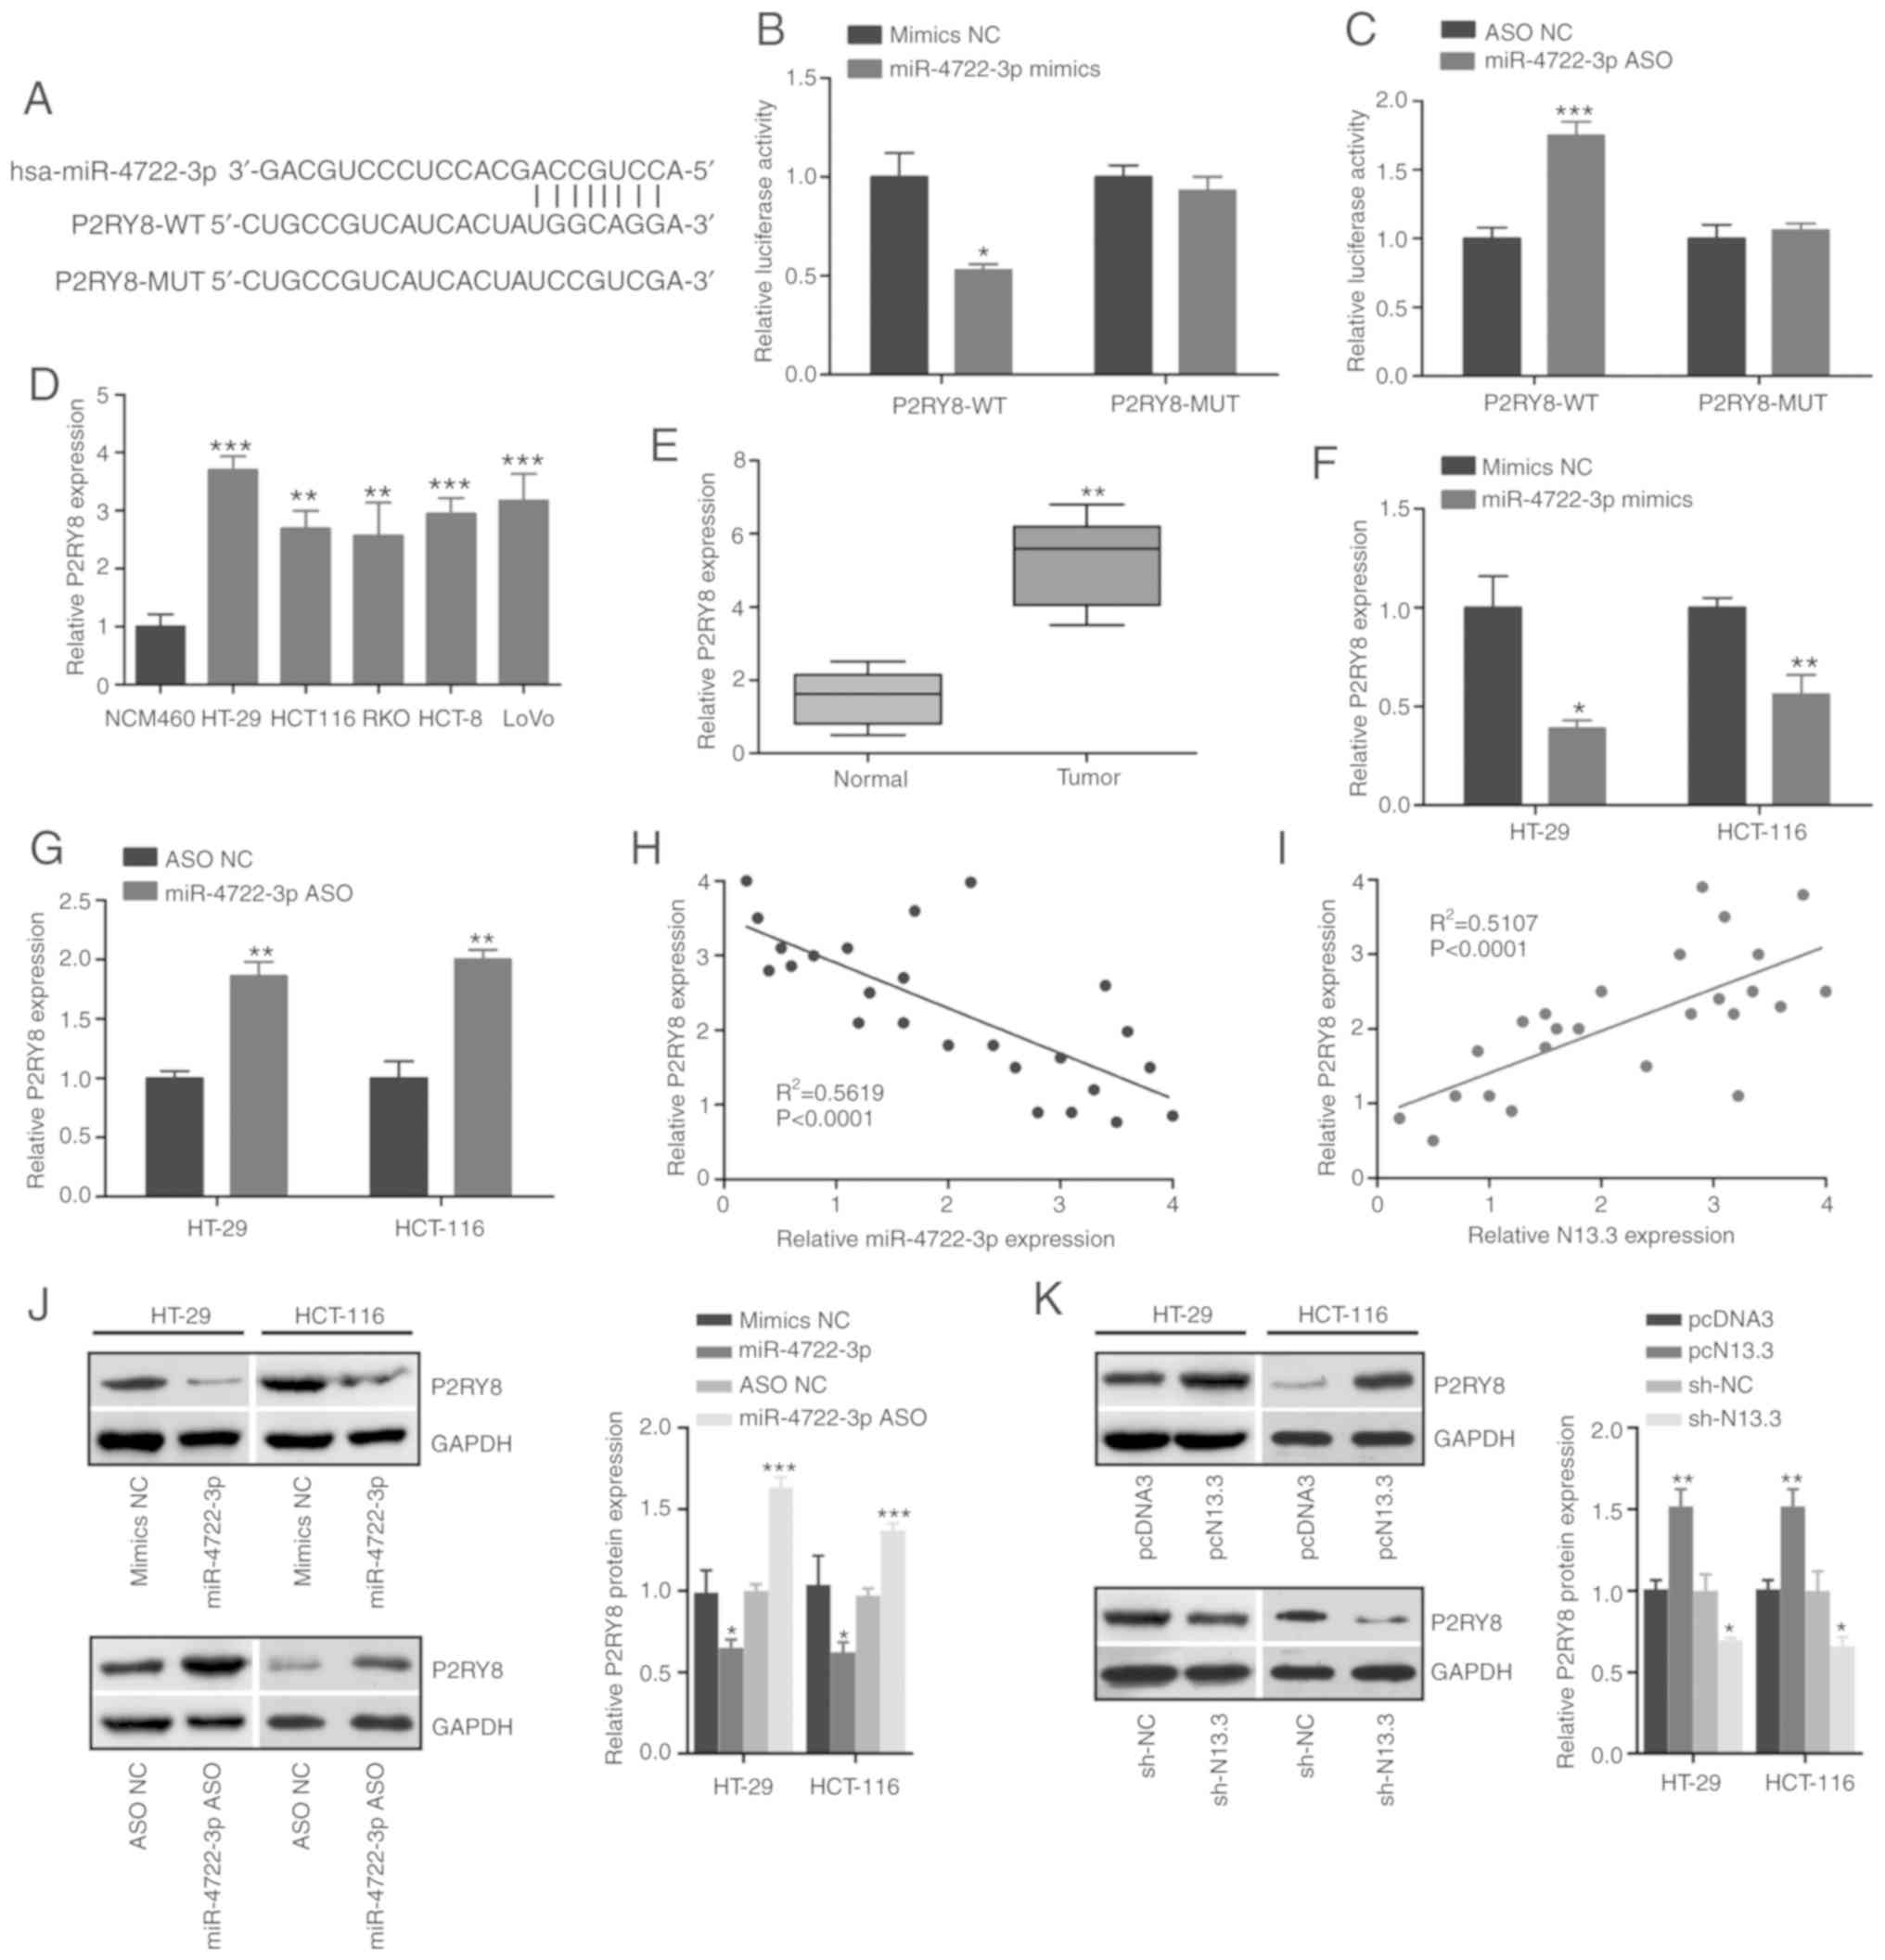 | Figure 5.P2RY8 is a direct target of
miR-4722-3p. (A) The binding sites between miR-4722-3p and P2RY
were predicted using Targetscan. (B) Luciferase reporter assay was
performed in 293T cells transfected with P2RY8-WT/MUT and mimics
NC/miR-4722-3p mimics. *P<0.05, compared with the mimics NC
group. (C) Luciferase activity in 293T cells transfected with
P2RY8-WT/MUT and ASO NC/miR-4722-3p ASO. ***P<0.001, compared
with the ASO NC group. (D) P2RY8 expression was detected in CRC
cell lines and normal colonic epithelial cell line NCM460 by
RT-qPCR. **P<0.01 and ***P<0.001, compared with the NCM460
cells. (E) RT-qPCR was used to analyze the expression of P2RY8 in
CRC tumor and normal tissues (n=60). **P<0.01, compared with the
normal tissues. (F and G) Expression of P2RY8 was measured in HT-29
and HCT-116 cells transfected with mimics NC/miR-4722-3p and ASO
NC/miR-4722-3p ASO by RT-qPCR. *P<0.05, **P<0.01, compared to
the mimics NC or ASO NC group. (H) The correlation was analyzed
between P2RY8 and miR-4722-3p expression levels in CRC cancer
tissues. (I) The correlation between P2RY8 and N13.3 expression in
CRC cancer tissues. (J) The expression of P2RY8 was measured in
HT-29 and HCT-116 cells transfected with mimics NC/miR-4722-3p
mimics or ASO NC/miR-4722-3p ASO by western blot analysis.
*P<0.05 and ***P<0.001, compared to the mimics NC or ASO NC
group. (K) P2RY8 expression level in HT-29 and HCT-116 cells
transfected with pcDNA3/pcN13.3 or sh-NC/sh-N13.3. *P<0.05 and
**P<0.01, compared to the sh-NC or pcDNA2 group. Data are
expressed as the Means ± SD. Statistical analysis was conducted
using Student's t-test, paired t-test and One-way ANOVA analysis.
*P<0.05, **P<0.01 and ***P<0.001. P2RY8, P2Y receptor
family member 8; CRC, colorectal cancer. |
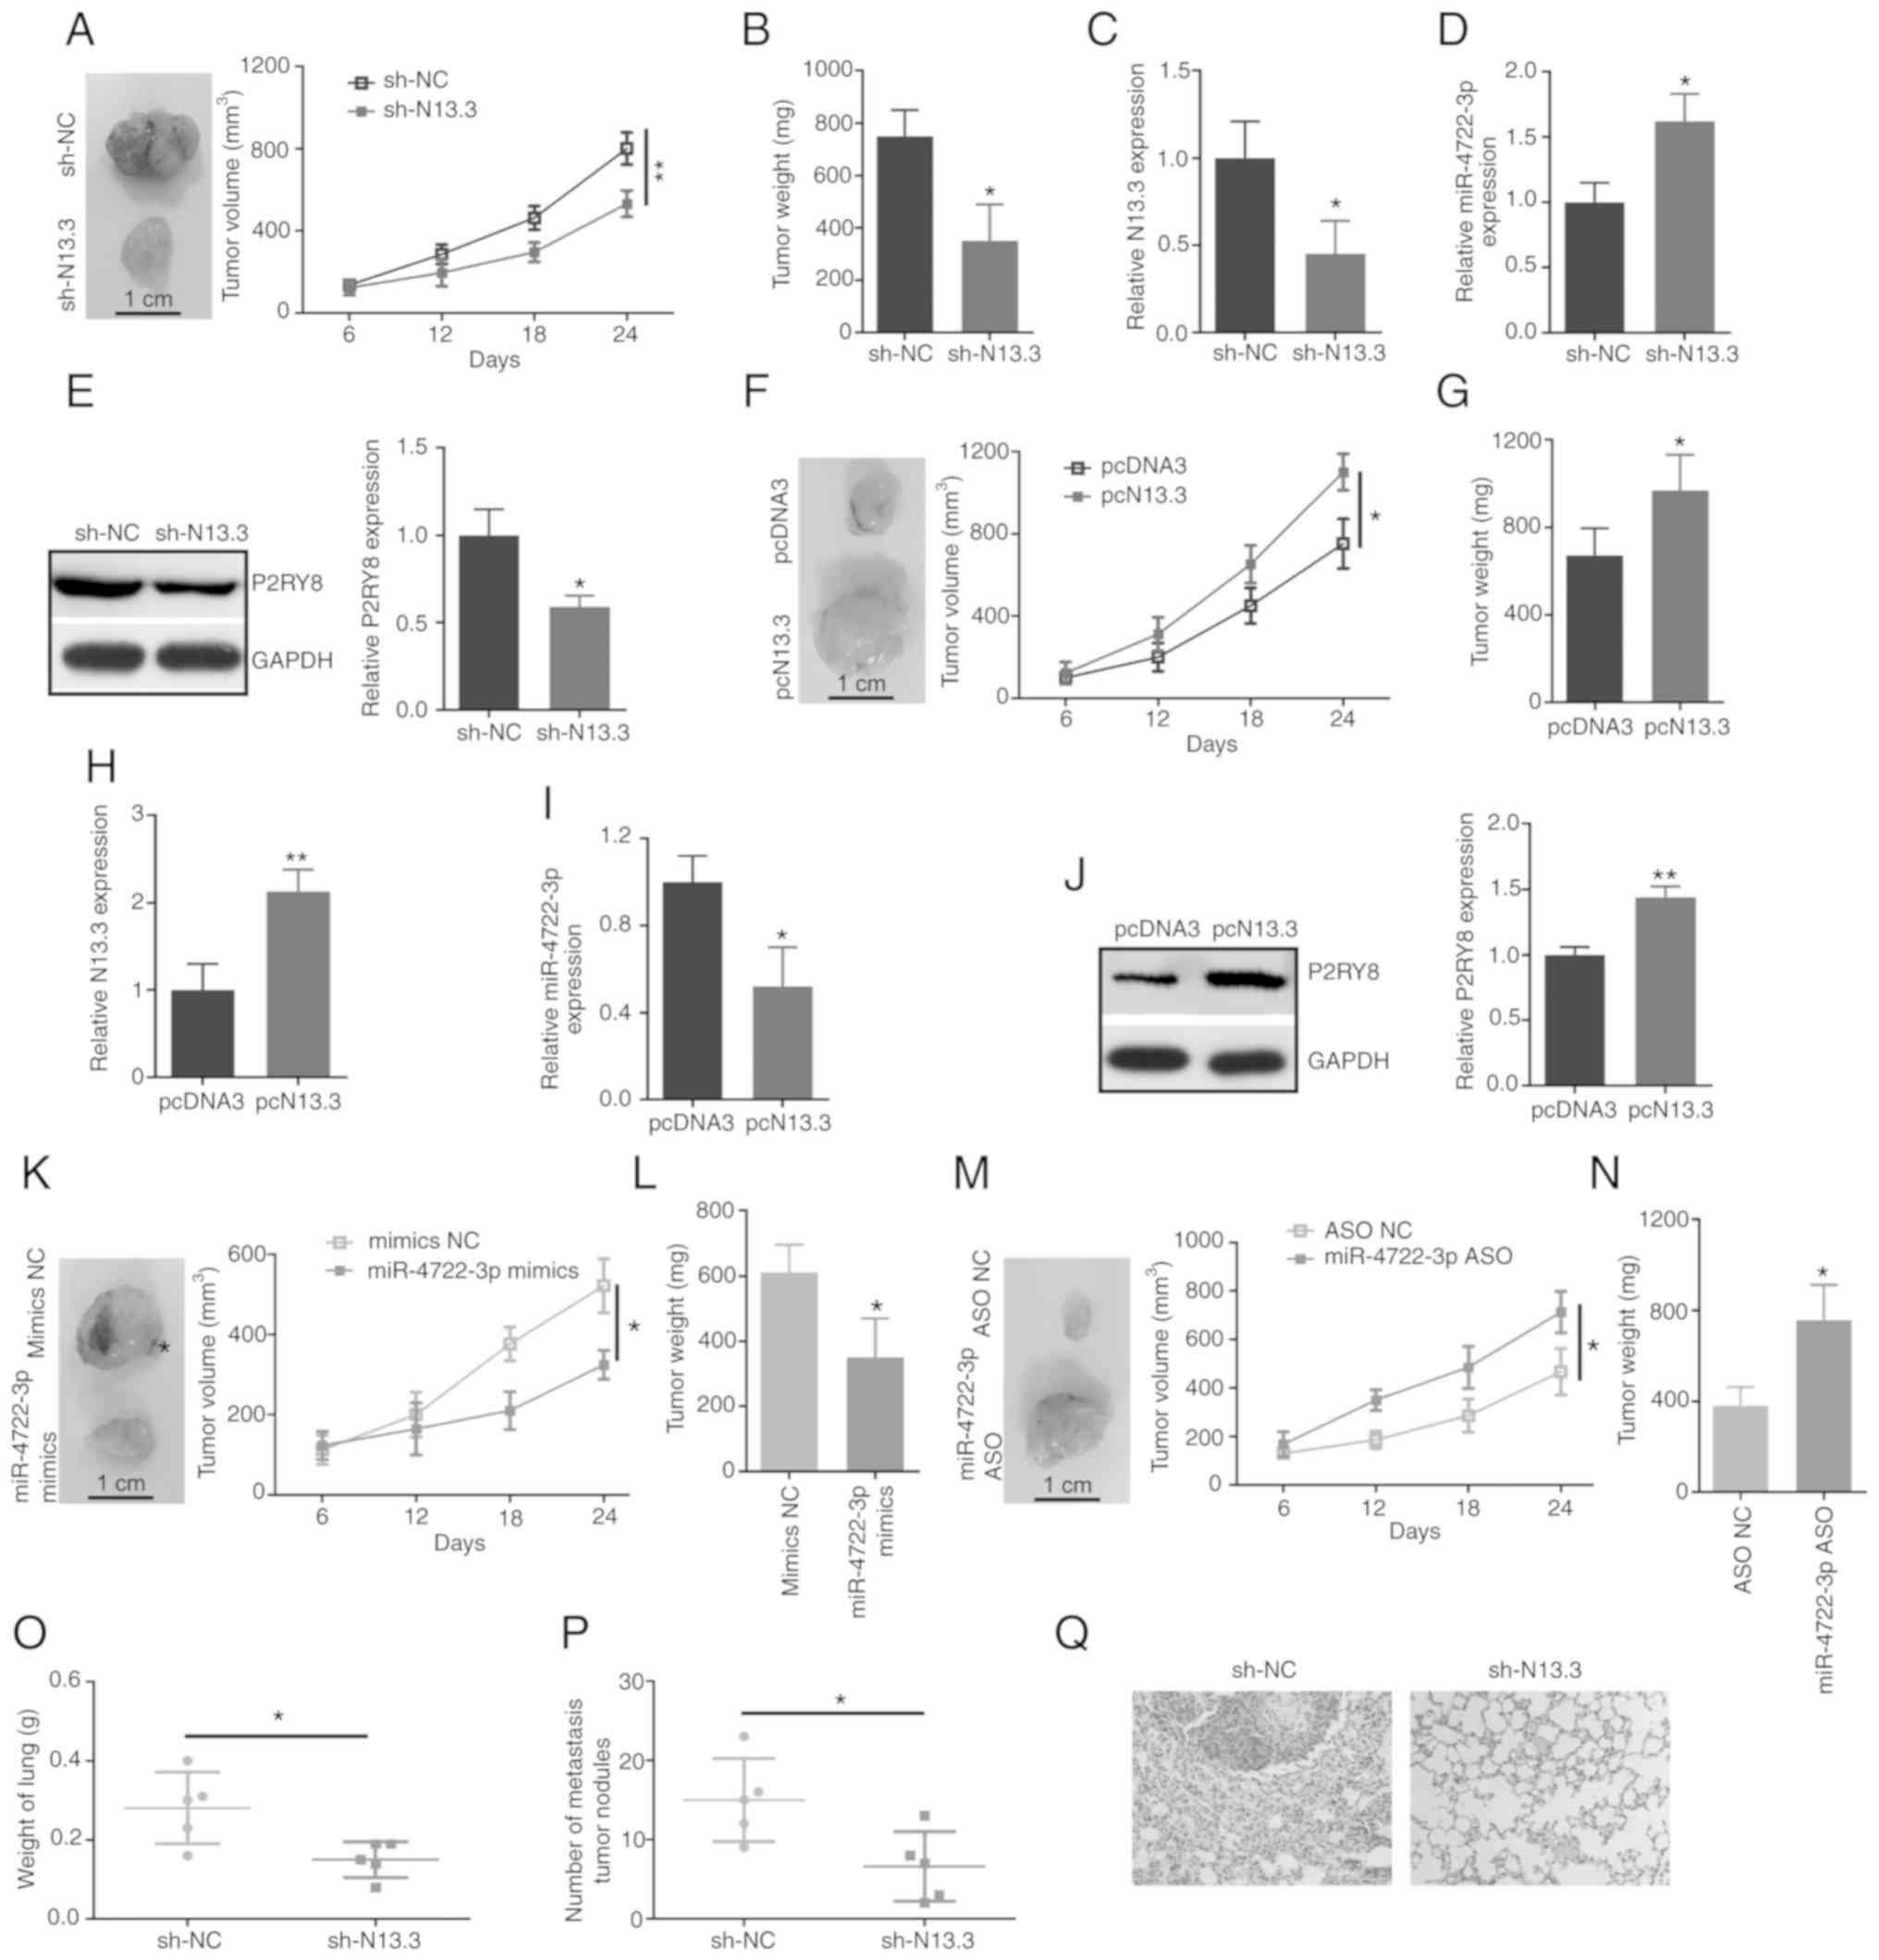
Knockdown of N13.3 inhibits CRC tumor
growth in vivo
To explore the effects of N13.3 and miR-4722-3p on
CRC cell tumorigenesis in animal models, HT-29 cells were
transfected with sh-N13.3/pcN13.3 or miR-4722-3p mimics/ASO, and
were injected subcutaneously into male nude mice. The results
showed that the knockdown of N13.3 inhibited tumor growth, but the
tumors formed from the N13.3-overexpressing HT-29 cells showed
faster growth rates when compared to the control group (Fig. 6A and F). The tumor weight was
significantly lower in the sh-N13.3 group as compared to the
control group. In contrast, a significantly higher tumor weight was
observed in the N13.3-overexpressing group when compared to the
control group (Fig. 6B and G). The
expression of N13.3 and P2RY8 was decreased in the sh-N13.3 group
(Fig. C and E) while N13.3 and P2RY8 was significantly increased in
the HT-29 cells transfected with pcN13.3 (Fig. 6H and J). In addition, miR-4722-3p
expression was assessed in the tumor tissues of the N13.3-knockout
and overexpressing groups by RT-qPCR (Fig. 6D and I). In addition, we found that
the tumor growth was suppressed in the miR-4722-3p mimics group and
promoted in miR-4722-3p ASO group (Fig.
6K and M). Subsequently, the tumor weight was significantly
lower in the miR-4722-3p mimics group and higher in the miR-4722-3p
ASO groups (Fig. 6L and N). Low
expression of N13.3 significantly inhibited the lung metastasis of
HT-29 cells in vivo (Fig. 6O and
P). H&E staining showed that low expression of N13.3
inhibited lung metastasis (Fig.
6Q).
Discussion
Colorectal cancer (CRC) is a type of human malignant
tumor. Many CRC patients succumb to the disease due to the lack of
sufficient diagnostic markers and poor understanding of the
pathological mechanism. Thus, there is an urgent need to elucidate
the pathological mechanisms of CRC. Recently, several reports have
revealed that a growing number of long non-coding RNAs (lncRNAs)
play key roles in the development and progression of cancers,
including CRC (11,21). Numerous studies have also documented
that the aberrant expression of lncRNAs, such as lncRNA OCC-1
(21), lncRNA HOXB-AS3 (22), CCAL (23) and lncRNA CCAT1-L (24), are involved in proliferation, poor
prognosis, overall survival rate, metastasis, migration and
invasion of CRC. Previous studies have also found that abnormal
N13.3 expression is associated with the progression of cancer. For
example, although it was found that lncRNA N13.3 expression was
upregulated (and may be a prognostic marker) in gastric cancer, the
biological function of N13.3 has not be extensively studied
(15,17). In the present study, the function of
N13.3 in CRC was revealed for the first time. We found that the
level of expression of N13.3 was significantly increased in CRC
cancer tissues compared with that noted in the corresponding
adjacent normal tissues of CRC patients. Analogous results were
found in CRC cell lines. In addition, high expression of N13.3 was
directly associated with an unsatisfactory overall survival rate of
CRC patients. These results indicated that the expression level of
N13.3 was intimately associated with progression and prognosis of
CRC patients. For the purpose of ascertaining the roles of N13.3 in
CRC, a series of functional experiments were executed in
vitro and in vivo. Our results demonstrated that the
proliferation, cell colony formation, migration and invasion
capacities were significantly inhibited while cell apoptosis was
increased due to the knockdown of N13.3; however, upregulation of
N13.3 expression reversed these results. Furthermore, we
demonstrated that the tumor growth was successfully suppressed by
the knockdown of N13.3. Thus, our findings indicate that N13.3
plays a carcinogenic function in CRC.
Meanwhile, many studies have shown that one of the
roles of lncRNAs is to regulate gene expression by competitively
binding to miRNAs as competing endogenous RNAs (ceRNAs) in cancers.
For instance, lncRNA linc00645 and SMAD5-AS1 have been reported as
ceRNAs to mediate the progression of glioma and nasopharyngeal
carcinoma by targeting miR-205-3p and miRNA-106a-5p, respectively
(25,26). In the present study, we predicted
miR-4722-3p as a potential downstream target of N13.3 by NONCODE
database analysis. The prediction result was validated by
luciferase reporter assay. There are few scientific studies
concerning miR-4722-3p, especially in cancers. Therefore, our study
was the first to investigate the biological functions of
miR-4722-3p. We demonstrated that the level of expression of
miR-4722-3p was inversely regulated by N13.3 both in CRC cell lines
and cancer tissues. This result was validated by overexpressing or
underexpressing one variable and then detecting the level of
expression of the other variable using RT-qPCR. Simultaneously,
elevated expression of miR-4722-3p significantly inhibited CRC cell
proliferation, colony formation, migration and invasion ability,
which were all reversed by overexpression of N13.3. Expectedly,
this negative regulation was found in HT-29 cells transfected with
miR-4722-3p ASO, and this was reversed by knockdown of N13.3. In
other words, the results revealed that downregulation of N13.3
suppressed CRC progression via sponging miR-4722-3p.
In general, lncRNAs act in part to affect the
progression of cancers by targeting miRNA/protein axis (25). P2RY8 was found to form the
P2RY8-CRLF2 fusion and participate in the hallmarks of B-progenitor
acute lymphoblastic leukaemia (ALL) progression (27). However, the studies on P2RY8 were
mainly carried out in ALL (28–30).
In the present study, we predicted P2RY8 as a potential downstream
target of miR-4722-3p for the first time, and confirmed the
prediction using the luciferase reporter assay. Further results
showed that P2RY8 was aberrantly upregulated in CRC cancer tissues
and cell lines as compared to the control groups. In addition, the
loss and gain experiments of miR-4722-3p indicated the negative
regulation of miR-4722-3p by P2RY8 by RT-qPCR and western blot
analysis. Simultaneously, we also found that N13.3 was positively
correlated with P2RY8. Therefore, this result confirmed that N13.3
promoted the development and progression of CRC by the
miR-4722-3p/P2RY8 axis.
In cancer tissues of CRC patients, we found that the
expression of N13.3 and P2RY8 were significantly increased, while
the expression of miR-4722-3p was decreased when compared with the
normal tissues. Based on the fact that the cancer tissue used in
this study was obtained from patient tissues during surgery, it is
possible to determine the progression of CRC patients by detecting
the changes in the expression of the above indices. For instance,
the increased expression of N13.3 and P2RY8 may indicate the
aggravation of the patient's condition. In addition, our results
showed that the expression of N13.3 was closely related to the poor
prognosis of the CRC patients. Moreover, the survival rate of CRC
patients having high expression of N13.3 was significantly lower
than that of the patients having low expression of N13.3.
Therefore, it may be possible to predict the survival of CRC
patients by detecting the expression level of N13.3. Although our
study was the first to determine that there is a differential
expression pattern of NA13.3, miR-4722-3p and P2RY8 in patients
with CRC, there are few studies on NA13.3, miR-4722-3p and P2RY8 in
patients with CRC. In this regard, further studies are needed to
determine the specific role of NA13.3, miR-4722-3p and P2RY8 in CRC
patients. Our follow-up study will further reveal the interaction
between them.
In conclusion, our study, for the first time,
identified the critical role of the N13.3/miR-4722-3p/P2RY8 axis in
CRC progression, and this may provide a new insight for the
clinical diagnosis and treatment of CRC.
Supplementary Material
Supporting Data
Acknowledgements
Not applicable.
Funding
The present study was supported by the National
Natural Science Foundation of China (81660410), the Yunnan Natural
Science Foundation of China [2017FE468(−174), 2015HB073] and the
Yunnan Science and Technology Project (2015HB073, L-2017018).
Availability of data and materials
The datasets used during the present study are
available from the corresponding author upon reasonable
request.
Authors' contributions
SB and HY conceived and designed the study. HY, QL,
YW, JD, YL, ZD, CX and JF performed the experiments. SB and HY
wrote the manuscript. All authors analyzed data, revised the
manuscript, and read and approved the final version of the
manuscript.
Ethics approval and consent to
participate
The protocol involving human participants was
approved by the Ethics Committee of The First Affiliated Hospital
of Kunming Medical University (Kunming, China) and written informed
consent was obtained from all participants. The animal experimental
protocol was approved by the Ethics Committee of The First
Affiliated Hospital of Kunming Medical University.
Patient consent for publication
Not applicable.
Competing interests
The authors declare that they have no competing
interests.
References
|
1
|
Arnold M, Sierra MS, Laversanne M,
Soerjomataram I, Jemal A and Bray F: Global patterns and trends in
colorectal cancer incidence and mortality. Gut. 66:683–691. 2017.
View Article : Google Scholar : PubMed/NCBI
|
|
2
|
Xu L, Li X, Cai M, Chen J, Li X, Wu WK,
Kang W, Tong J, To KF, Guan XY, et al: Increased expression of
Solute carrier family 12 member 5 via gene amplification
contributes to tumour progression and metastasis and associates
with poor survival in colorectal cancer. Gut. 65:635–646. 2016.
View Article : Google Scholar : PubMed/NCBI
|
|
3
|
Ozawa T, Matsuyama T, Toiyama Y, Takahashi
N, Ishikawa T, Uetake H, Yamada Y, Kusunoki M, Calin G and Goel A:
CCAT1 and CCAT2 long noncoding RNAs, located within the 8q.24.21
‘gene desert’, serve as important prognostic biomarkers in
colorectal cancer. Ann Oncol. 28:1882–1888. 2017. View Article : Google Scholar : PubMed/NCBI
|
|
4
|
Stein A, Atanackovic D and Bokemeyer C:
Current standards and new trends in the primary treatment of
colorectal cancer. Eur J Cancer. 47 (Suppl 3):S312–S314. 2011.
View Article : Google Scholar : PubMed/NCBI
|
|
5
|
Song W, Tiruthani K, Wang Y, Shen L, Hu M,
Dorosheva O, Qiu K, Kinghorn KA, Liu R and Huang L: Trapping of
lipopolysaccharide to promote immunotherapy against colorectal
cancer and attenuate liver metastasis. Adv Mater. 30:e18050072018.
View Article : Google Scholar : PubMed/NCBI
|
|
6
|
Downing A, Morris EJ, Corrigan N,
Sebag-Montefiore D, Finan PJ, Thomas JD, Chapman M, Hamilton R,
Campbell H, Cameron D, et al: High hospital research participation
and improved colorectal cancer survival outcomes: A
population-based study. Gut. 66:89–96. 2017. View Article : Google Scholar : PubMed/NCBI
|
|
7
|
Azvolinsky A: Colorectal cancer: To stack
or sequence therapy? J Natl Cancer Inst. 107:djv1382015. View Article : Google Scholar : PubMed/NCBI
|
|
8
|
Shi X, Sun M, Liu H, Yao Y and Song Y:
Long non-coding RNAs: A new frontier in the study of human
diseases. Cancer Lett. 339:159–166. 2013. View Article : Google Scholar : PubMed/NCBI
|
|
9
|
Liu Q, Huang J, Zhou N, Zhang Z, Zhang A,
Lu Z, Wu F and Mo YY: LncRNA loc285194 is a p53-regulated tumor
suppressor. Nucleic Acids Res. 41:4976–4987. 2013. View Article : Google Scholar : PubMed/NCBI
|
|
10
|
Yao N, Fu Y, Chen L, Liu Z, He J, Zhu Y,
Xia T and Wang S: Long non-coding RNA NONHSAT101069 promotes
epirubicin resistance, migration, and invasion of breast cancer
cells through NONHSAT101069/miR-129-5p/Twist1 axis. Oncogene.
38:7216–7233. 2019. View Article : Google Scholar : PubMed/NCBI
|
|
11
|
Zheng J, Zhang H, Ma R, Liu H and Gao P:
Long non-coding RNA KRT19P3 suppresses proliferation and metastasis
through COPS7A-mediated NF-κB pathway in gastric cancer. Oncogene.
38:7073–7088. 2019. View Article : Google Scholar : PubMed/NCBI
|
|
12
|
Yuan W, Sun Y, Liu L, Zhou B, Wang S and
Gu D: Circulating lncRNAs serve as diagnostic markers for
hepatocellular carcinoma. Cell Physiol Biochem. 44:125–132. 2017.
View Article : Google Scholar : PubMed/NCBI
|
|
13
|
Arriaga-Canon C, De La Rosa-Velázquez IA,
González-Barrios R, Montiel-Manríquez R, Oliva-Rico D,
Jiménez-Trejo F, Cortés-González C and Herrera LA: The use of long
non-coding RNAs as prognostic biomarkers and therapeutic targets in
prostate cancer. Oncotarget. 9:20872–20890. 2018. View Article : Google Scholar : PubMed/NCBI
|
|
14
|
Wang P, Ning S, Zhang Y, Li R, Ye J, Zhao
Z, Zhi H, Wang T, Guo Z and Li X: Identification of
lncRNA-associated competing triplets reveals global patterns and
prognostic markers for cancer. Nucleic Acids Res. 43:3478–3489.
2015. View Article : Google Scholar : PubMed/NCBI
|
|
15
|
Wang Y and Zhang J: Identification of
differential expression lncRNAs in gastric cancer using
transcriptome sequencing and bioinformatics analyses. Mol Med Rep.
17:8189–8195. 2018.PubMed/NCBI
|
|
16
|
Yang Y, Zhao Y, Zhang W and Bai Y: Whole
transcriptome sequencing identifies crucial genes associated with
colon cancer and elucidation of their possible mechanisms of
action. Onco Targets Ther. 12:2737–2747. 2019. View Article : Google Scholar : PubMed/NCBI
|
|
17
|
Ren W, Zhang J, Li W, Li Z, Hu S, Suo J
and Ying X: A tumor-specific prognostic long non-coding RNA
signature in gastric cancer. Med Sci Monit. 22:3647–3657. 2016.
View Article : Google Scholar : PubMed/NCBI
|
|
18
|
Shi X, Tan H, Le X, Xian H, Li X, Huang K,
Luo VY, Liu Y, Wu Z, Mo H, et al: An expression signature model to
predict lung adenocarcinoma-specific survival. Cancer Manag Res.
10:3717–3732. 2018. View Article : Google Scholar : PubMed/NCBI
|
|
19
|
Bradford JR, Cox A, Bernard P and Camp NJ:
Consensus analysis of whole transcriptome profiles from two breast
cancer patient cohorts reveals long non-coding RNAs associated with
intrinsic subtype and the tumour microenvironment. PLoS One.
11:e01632382016. View Article : Google Scholar : PubMed/NCBI
|
|
20
|
Livak KJ and Schmittgen TD: Analysis of
relative gene expression data using real-time quantitative PCR and
the 2(-Delta Delta C(T)) method. Methods. 25:402–408. 2001.
View Article : Google Scholar : PubMed/NCBI
|
|
21
|
Lan Y, Xiao X, He Z, Luo Y, Wu C, Li L and
Song X: Long noncoding RNA OCC-1 suppresses cell growth through
destabilizing HuR protein in colorectal cancer. Nucleic Acids Res.
46:5809–5821. 2018. View Article : Google Scholar : PubMed/NCBI
|
|
22
|
Huang JZ, Chen M, Chen D, Gao XC, Zhu S,
Huang H, Hu M, Zhu H and Yan GR: A peptide encoded by a putative
lncRNA HOXB-AS3 suppresses colon cancer growth. Mol Cell.
68:171–184.e6. 2017. View Article : Google Scholar : PubMed/NCBI
|
|
23
|
Ma Y, Yang Y, Wang F, Moyer MP, Wei Q,
Zhang P, Yang Z, Liu W, Zhang H, Chen N, et al: Long non-coding RNA
CCAL regulates colorectal cancer progression by activating
Wnt/β-catenin signalling pathway via suppression of activator
protein 2α. Gut. 65:1494–1504. 2016. View Article : Google Scholar : PubMed/NCBI
|
|
24
|
Xiang JF, Yin QF, Chen T, Zhang Y, Zhang
XO, Wu Z, Zhang S, Wang HB, Ge J, Lu X, et al: Human colorectal
cancer-specific CCAT1-L lncRNA regulates long-range chromatin
interactions at the MYC locus. Cell Res. 24:513–531. 2014.
View Article : Google Scholar : PubMed/NCBI
|
|
25
|
Li C, Zheng H, Hou W, Bao H, Xiong J, Che
W, Gu Y, Sun H and Liang P: Long non-coding RNA linc00645 promotes
TGF-β-induced epithelial-mesenchymal transition by regulating
miR-205-3p-ZEB1 axis in glioma. Cell Death Dis. 10:7172019.
View Article : Google Scholar : PubMed/NCBI
|
|
26
|
Zheng YJ, Zhao JY, Liang TS, Wang P, Wang
J, Yang DK and Liu ZS: Long noncoding RNA SMAD5-AS1 acts as a
microRNA-106a-5p sponge to promote epithelial mesenchymal
transition in nasopharyngeal carcinoma. FASEB J. 33:12915–12928.
2019. View Article : Google Scholar : PubMed/NCBI
|
|
27
|
Mullighan CG, Collins-Underwood JR,
Phillips LA, Loudin MG, Liu W, Zhang J, Ma J, Coustan-Smith E,
Harvey RC, Willman CL, et al: Rearrangement of CRLF2 in
B-progenitor- and Down syndrome-associated acute lymphoblastic
leukemia. Nat Genet. 41:1243–1246. 2009. View Article : Google Scholar : PubMed/NCBI
|
|
28
|
Potter N, Jones L, Blair H, Strehl S,
Harrison CJ, Greaves M, Kearney L and Russell LJ: Single-cell
analysis identifies CRLF2 rearrangements as both early and late
events in Down syndrome and non-Down syndrome acute lymphoblastic
leukaemia. Leukemia. 33:893–904. 2019. View Article : Google Scholar : PubMed/NCBI
|
|
29
|
Vesely C, Frech C, Eckert C, Cario G,
Mecklenbräuker A, Zur Stadt U, Nebral K, Kraler F, Fischer S,
Attarbaschi A, et al: Genomic and transcriptional landscape of
P2RY8-CRLF2-positive childhood acute lymphoblastic leukemia.
Leukemia. 31:1491–1501. 2017. View Article : Google Scholar : PubMed/NCBI
|
|
30
|
Morak M, Attarbaschi A, Fischer S,
Nassimbeni C, Grausenburger R, Bastelberger S, Krentz S, Cario G,
Kasper D, Schmitt K, et al: Small sizes and indolent evolutionary
dynamics challenge the potential role of P2RY8-CRLF2-harboring
clones as main relapse-driving force in childhood ALL. Blood.
120:5134–5142. 2012. View Article : Google Scholar : PubMed/NCBI
|