Introduction
Glioma is the most prevalent and aggressive tumor of
the central nervous system and accounts for ~70% of malignant
primary brain tumors (1). The past
several decades have seen consistent improvements in diagnostic
methods and treatment strategies for glioma, with standard
treatment including surgical resection followed by radiotherapy and
systemic temozolomide chemotherapy (2). However, the prognosis for patients with
glioma remains poor, with an overall survival time of only 12–14
months from diagnosis (3,4). Thus, there is an urgent need to identify
novel molecular targets associated with key processes involved in
glioma development and progression, such as proliferation,
apoptosis, differentiation, invasion and migration, which can
facilitate the development of more effective treatment
strategies.
Long non-coding RNAs (lncRNAs) are a subgroup of
RNAs with transcripts of >200 nucleotides in length having
little or no protein-coding potential (5,6). It has
been demonstrated that under normal physiological conditions,
lncRNAs serve crucial roles in numerous fundamental organism- and
cell-related processes, including development, genomic imprinting,
homeostasis, embryonic stem cell pluripotency (7–9), and cell
proliferation, metabolism, apoptosis, migration and differentiation
(10–12). The regulatory mechanisms through which
lncRNAs function are complex and not fully understood; however,
they are known to occur through epigenetic, transcriptional and
post-transcriptional mechanisms (13–15). A
novel regulatory mechanism, in which lncRNAs act as competing
endogenous RNAs (ceRNAs) by binding directly to complementary
sequences in microRNAs (miRNAs/miRs) and competitively blocking
miRNA interactions with their target mRNAs, has been identified
(16,17). Emerging evidence has demonstrated the
importance of ceRNAs, also known as sponges, in cancer through the
regulation of the expression levels of miRNAs and their target
genes. For instance, the lncRNA metallothionein 1J, pseudogene acts
as a ceRNA in gastric cancer to regulate the function of miR-92a-3p
and the expression of its target gene F-box and WD repeat domain
containing 7 (18). Similarly, the
lncRNA tumor suppressor candidate 8 acts as a ceRNA for
miR-190b-5p, which modulates the expression of myosin regulatory
light chain interacting protein mRNA and inhibits breast cancer
metastasis (19). Although these and
other studies (20,21) have established lncRNAs as core factors
in the development and growth of cancer, little is known regarding
the pathophysiological mechanisms of action of lncRNAs in
glioma.
The lncRNA nuclear paraspeckle assembly transcript 1
(NEAT1), located on chromosome 11, has been reported to be a
transcriptional regulator of numerous genes (22), and abnormal NEAT1 expression has been
implicated in the promotion of tumorigenesis in a variety of human
cancer types (23,24). Among its key mechanisms of action in
cancer, NEAT1 acts as a ceRNA for several tumor suppressor miRNAs
(25). In non-small cell lung cancer
(NSCLC), NEAT1 promotes growth under hypoxic conditions and
regulates the Wnt/β-catenin signaling pathway (26). The upregulation of NEAT1 has been
demonstrated to facilitate pancreatic cancer progression through
the negative regulation of miR-506-3p (27). To the best of our knowledge, it is not
yet known whether NEAT1 is involved in glioma development and
progression.
In the present study, the expression levels and
function of NEAT1 in glioma tissues and cell lines were examined,
and its mechanism of action was investigated in detail. NEAT1 was
revealed to promote glioma cell proliferation in vitro and
in vivo by functioning as a ceRNA for miR-324-5p, which, in
turn, regulated the expression of potassium channel tetramerization
protein domain containing 20 (KCTD20). The inhibition of NEAT1 and
KCTD20 inhibited the proliferation of glioma cells, which was
consistent with the results of miR-324-5p overexpression.
Therefore, the results revealed a novel NEAT1/miR-324-5p/KCTD20
regulatory axis in glioma, and identified a potential target for
the development of diagnostic, prognostic and/or therapeutic tools
for this disease.
Materials and methods
Human tissue samples
All 43 human glioma tissues (age range, 26–71 years;
mean age, 49 years), as well as their paired adjacent non-cancerous
tissues, were obtained from patients who underwent surgical
resection at The First Affiliated Hospital of Nanjing Medical
University (Nanjing, China) between January 2013 and December 2016.
The distance between the tumor and the matched normal adjacent
tissue was ~2 cm. The inclusion criteria were as follows: i)
Diagnosed with glioma; and ii) had not received pre-operative
radiotherapy, chemotherapy or other adjuvant treatments before
surgery. The exclusion criteria were as follows: i) Diagnosed with
other diseases; and ii) failed to cooperate with researchers.
Histological grade was classified by pathologists using the World
Health Organization criteria (28).
All tissue samples were collected during surgery, frozen
immediately in liquid nitrogen, and stored at −80°C for total RNA
or protein extraction. The clinicopathological characteristics of
the patients are summarized in Table
I. The present study was approved by the Institutional Review
Board and Ethics Committee of Nanjing Medical University (Nanjing,
China) and Fourth Military Medical University (Xi'an, China), and
written informed consent was obtained from all patients.
 | Table I.Association between the expression
levels of NEAT1 and clinicopathological features of 43 patients
with glioma. |
Table I.
Association between the expression
levels of NEAT1 and clinicopathological features of 43 patients
with glioma.
|
|
| NEAT1
expression |
|
|---|
|
|
|
|
|
|---|
|
Characteristics | Number | Low, n (n=22) | High, n (n=21) | P-value |
|---|
| Age, years |
|
|
|
|
|
<45 | 19 | 9 | 10 | 0.658 |
|
≥45 | 24 | 13 | 11 |
|
| Sex |
|
|
|
|
|
Male | 23 | 10 | 13 | 0.346 |
|
Female | 20 | 12 | 8 |
|
| Tumor size, cm |
|
|
|
|
|
<5 | 25 | 16 | 9 | 0.047a |
| ≥5 | 18 | 6 | 12 |
|
| Peritumoral brain
edema, cm |
|
|
|
|
|
<1 | 22 | 9 | 13 | 0.169 |
| ≥1 | 21 | 13 | 8 |
|
| WHO grade |
|
|
|
|
|
I–II | 27 | 17 | 10 | 0.044a |
|
III–IV | 16 | 5 | 11 |
|
Cell culture
A total of six human glioblastoma (GBM) cell lines,
including U87MG [GBM of unknown origin; American Type Culture
Collection HTB-14; short-tandem repeat (STR) profiling was
performed], LN229, H4, U251, U118 (derived from the U138MG
astrocytoma cell line; American Type Culture Collection HTB-15; STR
profiling was performed) and A172, were obtained from The Cell Bank
of Type Culture Collection of The Chinese Academy of Sciences. The
human 293T cell line was obtained from American Type Culture
Collection. All cells were sustained in DMEM (HyClone; Cytiva)
supplemented with 10% FBS (HyClone; Cytiva), 100 U/ml penicillin
and 100 ng/ml streptomycin. Normal human astrocytes (NHAs) were
purchased from Lonza Group, Ltd. and cultured in the provided
astrocyte growth media (Lonza Group, Ltd.) supplemented with 0.1%
recombinant human epidermal growth factor, 0.25% insulin, 0.1%
ascorbic acid, 0.1% GA-1000, 1% L-glutamine (all Lonza Group, Ltd.)
and 5% FBS. All cells were cultured at 37°C in a humidified
atmosphere with 5% CO2.
Total RNA extraction and reverse
transcription-quantitative PCR (RT-qPCR)
Total RNA was extracted from glioma tissues or
cultured cell lines using TRIzol® reagent (Invitrogen;
Thermo Fisher Scientific, Inc.) according to the manufacturer's
protocols. Single-stranded cDNA was synthesized using the
Primerscript RT Master mix (Takara Bio, Inc.) according to the
manufacturer's protocol. Subsequently, qPCR analysis was performed
with SYBR Premix Ex Taq (Takara Bio, Inc.) according to the
manufacturer's protocols. RT-qPCR was performed using an Applied
Biosystems 7900 Sequence Detection system (Thermo Fisher
Scientific, Inc.). The thermocycling conditions were as follows:
95°C for 3 min, followed by 40 cycles at 95°C for 1 min and 57°C
for 45 sec, and 72°C for 2 min. All primers used for RT and RT-qPCR
were purchased from Guangzhou RiboBio Co., Ltd. and the sequences
were as follows: NEAT1 forward, 5′-TGGCTAGCTCAGGGCTTCAG-3′ and
reverse, 5′-TCTCCTTGCCAAGCTTCCTTC-3′; miR-324-5p forward,
5′-CGCGGATCCGGGTGGATGTAAGGGATGAG-3′ and reverse,
5′-CCGGAATTCTTGGGCTGATCCAGGAGAAG-3′; KCTD20 forward,
5′-CGGGATCCATGAATGTTCACCGTGGCAG-3′ and reverse,
5′-CGAATTCCTAATCCTGAAAGTCGTTAGAAGC-3′; GAPDH forward,
5′-GACTCATGACCACAGTCCATGC-3′ and reverse
5′-AGAGGCAGGGATGATGTTCTG-3′; and U6 forward,
5′-CTCGCTTCGGCAGCACA-3′ and reverse, 5′-AACGCTTCACGAATTTGCGT-3′.
The relative expression levels of NEAT1 and KCTD20 were normalized
to those of GAPDH, while U6 was used as an internal control for
miRNA. The expression levels of NEAT1, miR-324-5p and KCTD20 were
calculated using 2−ΔΔCq analysis (29).
Cell transfection
The corresponding negative controls (NCs) and NEAT1
[small interfering RNA (si/siRNA)NEAT1], KCTD20 (siKCTD20),
miR-324-5p inhibitor and miR-324-5p mimics were synthesized by
Shanghai GenePharma Co., Ltd. The sequences were as follows: si
control (Ctrl), 5′-CCCACCAGUUUGAGACUCCACAAAU-3′; siNEAT1,
5′-GGTCTGTGTGGAAGGAGGAAGGCAG-3′; siKCTD20,
5′-GGGAGGAAUAUUCCCAAAUTT-3′; miR-324-5p mimic,
5′-CGCAUCCCCUAGGGCAUUGGUGU-3′; miR-324-5p inhibitor,
5′-ACACCAAUGCCCUAGGGGAUGCG-3′; mimic NC (miR-NC),
5′-UUCUCCGAACGUGUCACGU-3′; and inhibitor NC (Anti-Ctrl),
5′-CAGUACUUUUGUGUAGUACAA-3′. When cells reached a confluence of
80%, cells were transfected with siRNAs (100 nM), mimics (100 nM)
or miRNA inhibitors (100 nM) using Lipofectamine® 2000
transfection reagent (Invitrogen; Thermo Fisher Scientific, Inc.)
according to the manufacturer's protocol. The cells were then
cultured using DMEM containing 10% FBS, 100 U/l penicillin and 100
mg/l streptomycin at 5% CO2 and 37°C for 48 h. The
transfected cells were harvested 48 h post transfection and used
for subsequent experiments. To overexpress lncRNA NEAT1 in GBM
cells, 3 µg pcDNA3.1-NEAT1 (pcDNA-NEAT1) and 3 µg negative control
(empty Vector) (both Shanghai GenePharma Co., Ltd.) were
transfected into cells using Lipofectamine® 2000
(Invitrogen; Thermo Fisher Scientific, Inc.) according to the
manufacturer's protocol. The cells were incubated in complete
medium supplemented with 10% FBS, 100 U/l penicillin and 100 mg/l
streptomycin for 48 h at 37°C with 5% CO2, and
subsequent experiments were performed after 48 h of transfection.
For stable transfection, the shRNA lentiviral vectors targeting
NEAT1 (shNEAT1, 5′-CATGGACCGTGGTTTGTTACT-3′) and KCTD20 (shKCTD20,
5′-GCTTCCAAAGTGGGAATAAAC-3′) were synthesized by Shanghai
GenePharma Co., Ltd. Lentiviruses were produced using a
second-generation lentiviral system in 293T cells. 293T cells in
the logarithmic growth phase were harvested and re-suspended in
antibiotic-free and serum-free medium. Subsequently, cells
(5×10⁵ cells/ml) were cultured in DMEM (HyClone; Cytiva)
supplemented with 10% FBS (HyClone; Cytiva), 100 U/ml penicillin
and 100 ng/ml streptomycin in a 6-well plates at 37°C with 5%
CO2 until the cells reached 80% confluence. Briefly,
shNEAT1 or shKCTD20 was inserted into the pLKO.1 vector (BioSettia,
Inc.) and transfected into 293T cells (American Type Culture
Collection) together with 0.75 µg psPAX2 (BioSettia, Inc.) and 0.25
µg pMD2.G envelope plasmids (BioSettia, Inc.; lentiviral plasmid:
Packaging vector: Envelope=4:3:1) using Lipofectamine®
2000 (Invitrogen; Thermo Fisher Scientific, Inc.) to produce an
shRNA-containing lentivirus. The media containing lentiviral
particles were harvested at 48 h after transfection. Next, cells in
the media were removed using a 0.45-µm filter (EMD Millipore) and
viral particles were collected. Subsequently, U251 cells were
transduced with shNC, shNEAT1 or shKCTD20 lentiviruses
(multiplicity of infection, 10) for 24 h at 37°C with 5%
CO2 in the presence of 5 µg/ml polybrene (Shanghai
GenePharma Co., Ltd.). After 48 h of lentivirus infection, cells
were selected using 5 mg/ml puromycin (Sigma-Aldrich; Merck KGaA)
and maintained in puromycin-containing medium (5 mg/ml) for 14 days
to establish stably transduced cell lines.
Cell Counting Kit-8 (CCK-8) assay
At 48 h after transfection, cells were seeded at
2,000 cells per well in 96-well plates and cultured. First, the
cell proliferation rate was detected at the indicated time points
(0, 24, 48, 72 and 96 h) using a CCK-8 assay (Dojindo Molecular
Technologies, Inc.) according to the manufacturer's protocols.
After 1 h of incubation with CCK-8 at 37°C, the absorbance (optical
density value) at a wavelength of 450 nm was detected and used to
calculate cell proliferation.
Colony formation assay
The experimental procedures were performed according
to the method described in our previous study (30). Briefly, cells were harvested 48 h
after transfection and then seeded into a 6-well plate (200
cells/well). Following culture for ~2 weeks until colony formation
was observed, visible colonies were fixed with 100% methanol for 20
min at room temperature and stained with 0.1% crystal violet
(Sigma-Aldrich; Merck KGaA) for 15 min at room temperature. The
colonies were counted using an inverted light microscope (Olympus
X71; Olympus Corporation). The numbers of colonies were then
counted and measured using ImageJ software (version 1.51; National
Institutes of Health). Colony formation efficiency was calculated
as the number of colonies/plated cells ×100%.
Ethynyldeoxyuridine (EdU) assay
For the EdU proliferation assay, the Cell-Light EdU
labeling detection kit was purchased from Thermo Fisher Scientific,
Inc. As aforementioned, U251 and LN229 cells in 96-well plates
(2×10³ cells/well) were transfected with plasmid DNA or
siRNA for 48 h. Then, 10 µM EdU was added to the 96-well plates,
and they were incubated for 24 h at 37°C with 5% CO2.
The medium was then discarded and cells were washed twice with PBS
at room temperature for 3 min each time. The cells were fixed with
4% paraformaldehyde in PBS for 25 min at room temperature and 0.5%
Triton X-100 in PBS for 20 min at room temperature. Then, cells
were stained with the Alexa-Fluor 594 reaction cocktail for EdU.
After removal of the reaction cocktail, cells were washed with 3%
BSA (Thermo Fisher Scientific, Inc.) in PBS at room temperature.
Mounting medium with DAPI (2 µg/ml; cat. no. ab104139; Abcam) was
used to label the cell nuclei for 15 min at room temperature, the
cells were then washed with PBS at room temperature three times (30
sec each time). A total of five visual fields were selected
randomly using a fluorescence microscope (magnification, ×200;
Leica Microsystems GmbH). The EdU-positive cells and DAPI stained
cells (total cells) were counted. Cell proliferation rate=number of
proliferative cells/number of total cells ×100%.
Flow cytometry
Cell cycle analysis was performed as previously
described (31). For cell cycle
analysis, U251 and LN229 cells were transfected with the plasmids
or siRNA for 48 h and then collected by centrifugation for 5 min at
1,500 × g at room temperature. Subsequently, cells were washed
twice with PBS and fixed with 75% ice-cold ethanol at 4°C for 24 h.
The collected cells were re-suspended in PBS containing 25 mg/ml
PI, 0.1% Triton and 10 mg/ml RNase [Hangzhou Multi Sciences
(Lianke) Biotech Co., Ltd.] and incubated for 30 min in the dark,
before being analyzed by flow cytometry. The apoptotic cells were
stained with Annexin V-FITC/PI, the cells were analyzed with a
Gallios flow cytometer (Beckman Coulter, Inc.) equipped with Kaluza
2.1.1 software (Beckman Coulter, Inc.). Cells were divided into
dead cells (B1), late apoptotic cells (B2), negative control normal
cells (B3) and early apoptotic cells (B4) according to the
different state of the cell. In each experiment, the total
percentage of early and late apoptotic cells was compared with the
controls.
Western blotting and antibodies
Briefly, cultured cells were lysed on ice for 30 min
in RIPA buffer (Nanjing KeyGen Biotech Co., Ltd.). Subsequently,
total protein extraction of different transfected U251 and LN229
cells was evaluated using a BCA Protein Assay kit (Pierce; Thermo
Fisher Scientific). Protein (30 µg per lane) was loaded, subjected
to 10% SDS-PAGE and then transferred onto PVDF membranes (EMD
Millipore) for western blotting. After blocking the membranes with
5% non-fat for 2 h at room temperature, the membranes were probed
with antibodies against CDK4 (dilution, 1:1,000; cat. no. ab108357;
Abcam), cyclin D1 (dilution, 1:1,000; cat. no. ab40754; Abcam),
Bcl-2 (dilution, 1:1,000; cat. no. ab59348; Abcam), Bax (dilution,
1:1,000; cat. no. ab32503; Abcam), KCTD20 (dilution, 1:500; cat.
no. ab122094; Abcam), NIPBL (dilution, 1:500; cat. no. ab225908;
Abcam), ELAVL1 (dilution, 1:1,000; cat. no. ab200342; Abcam), KLF3
(dilution, 1:500; cat. no. ab154531; Abcam), MMP19 (dilution,
1:500; cat. no. ab53146; Abcam), ZFX (dilution, 1:500; cat. no.
5419; Cell Signaling Technology, Inc.) and GAPDH (dilution,
1:1,000; cat. no. AF5009; Beyotime Institute of Biotechnology) at
4°C overnight. Membranes were then incubated with corresponding
secondary antibodies goat anti-mouse (dilution, 1:1,000; cat. no.
A0216; Beyotime Institute of Biotechnology) and goat anti-rabbit
(dilution, 1:1,000; cat. no. A0208; Beyotime Institute of
Biotechnology) for 1 h at room temperature, and processed using ECL
Western Blot Detection reagents (EMD Millipore). An ECL detection
system (Thermo Fisher Scientific, Inc.) was used to visualize the
protein. GAPDH was used as an internal control. Signals were
examined by densitometric scans using ImageJ software (version
1.51; National Institutes of Health).
RNA immunoprecipitation (RIP)
For the RIP assay, pSL-MS2-12X (Addgene, Inc.) was
double digested using BamHI and XhoI, and the MS2-12X
fragment was inserted to the pcDNA3.1-NEAT1 vector to form
pSL-MS2-NEAT1. Next, U251 and LN229 cells were co-transfected with
pMS2-GFP and pSL-MS2-NETA1 or pSL-MS2-12× vectors (Addgene, Inc.).
After 48 h, the cells were used for the RIP assay with a green
fluorescent protein antibody (Roche Diagnostics). The RIP assay was
performed using the Magna RIP RNA-Binding Protein
Immunoprecipitation kit (EMD Millipore) according to the
manufacturer's protocols. Briefly, U251 and LN229 cells were
collected by centrifugation at 800 × g for 5 min at 4°C and then
lysed using RIP lysis buffer (EMD Millipore). One RIP reaction
required 100 µl of cell lysate from ~2.0×10⁷ cells.
Subsequently, cell lysates were incubated with 50 µl A/G magnetic
beads conjugated with human anti-argonaute RISC catalytic component
2 (Ago2) antibody (dilution, 1:150; cat. no. ab32381; Abcam) for 30
min at room temperature, while normal rabbit IgG (dilution, 1:150;
cat. no. 12-370; EMD Millipore) served as a negative control. Next,
the compounds of antibody and magnetic beads in 900 µl RIP
Immunoprecipitation Buffer (EMD Millipore) were co-incubated
overnight at 4°C with cell lysates supernatants (100 µl) after
centrifugation at 13,000 × g for 10 min at 4°C. Next, the beads (50
µl) were collected with a magnetic separator, washed three times
with cold RIP Wash Buffer (EMD Millipore). Then, the complexes were
incubated with 0.1% SDS/0.5 mg/ml proteinase K (EMD Millipore) for
30 min at 55°C to remove proteins and immunoprecipitated RNA was
isolated. NEAT1 and miR-324-5p expression was assessed by RT-qPCR,
as aforementioned.
Luciferase reporter assay
The complementary DNA fragment containing the
wild-type (WT) or mutant (MUT) sequences of NEAT1 or KCTD20 were
subcloned downstream of the luciferase gene within the
pGL3-luciferase reporter plasmid vectors (Promega Corporation).
Plasmids containing the sequences of miR-324-5p mimic
(5′-CGCAUCCCCUAGGGCAUUGGUGU-3′) and miR-NC
(5′-UUCUCCGAACGUGUCACGU-3′) were purchased from Shanghai GenePharma
Co., Ltd. Briefly, cells were seeded into 24-well plates and
cultured overnight. The cells were then co-transfected with WT- or
MUT-NEAT1 and the 3′ untranslated region (UTR) of the KCTD20
fragment, as well as equal amounts of miR-NC and miR-324-5p using
Lipofectamine® 2000 (Invitrogen; Thermo Fisher
Scientific, Inc.) according to the manufacturer's protocols. At 48
h after transfection, the relative luciferase activity in the cells
was measured using a Dual Luciferase Reporter Assay System (Promega
Corporation). The relative luciferase activity was normalized to
the Renilla luciferase activity. All experiments were
performed in triplicate.
Orthotopic xenograft studies
A total of 24 male immunodeficient nude mice (n=6
for each group; age, 6 weeks; weight, ~20 g) were purchased from
Shanghai Laboratory Animal Research Center. The mice were
maintained under specific pathogen-free conditions in a
temperature-controlled room (~20°C; humidity, 20%), with a 12-h
light/dark cycle, and with ad libitum access to commercially
available mouse food and sterilized water. To examine tumor growth
in the orthotopic xenograft model, a total of 100 µl of PBS
containing U251 cells (2.5×10⁵) were stably transfected
with shNEAT1 or shKCTD20 and the corresponding negative control
(shNC) was injected intracranially into the striatum of NOD/SCID
mice by a stereotactic device (coordinates, 2 mm behind the
anterior fontanel, 2 mm lateral to the sagittal suture, at a 3-mm
depth from the dura). A bioluminescence imaging system (IVIS
Spectrum; PerkinElmer, Inc.) was used to confirm tumor formation
and measure tumor growth weekly. At 7, 14, 21 and 28 days after
cell implantation, the mice were injected intraperitoneally with
D-luciferin at 50 mg/ml and then subjected to in vivo
bioluminescence imaging to visualize tumor growth for 10–120 sec.
The whole experiment lasted ~2 months. During this process,
according to development of neurological signs (hunching, weight
loss, rough coat), the moribund mice were anesthetized by an
intraperitoneal injection of 10% chloral hydrate (400 mg/kg body
weight). The mice showed no signs of peritonitis, pain or other
discomfort, and were then euthanized by means of cervical
dislocation. Their brains were harvested, cut into sections,
paraffin-embedded and stained with H&E to confirm the presence
of tumors, and subjected to immunohistochemistry (IHC). For H&E
staining, brain tissues were fixed with 10% formaldehyde at room
temperature for 24 h. Subsequently, paraffin-embedded specimens
were cut into 5-µm sections and dewaxed with xylene and cleared
with a series of changing alcohol concentrations. The samples were
washed three times in PBS (5 min each time) at room temperature,
and then stained with hematoxylin (Sigma-Aldrich; Merck KGaA) for 5
min at room temperature. Sections were stained with eosin
(Sigma-Aldrich; Merck KGaA) for 2 min at room temperature to
observe the clarity of the nucleus and cytoplasm under a light
microscope (Leica Microsystems GmbH). The images were assessed
using Image-Pro Plus 6.0 (Media Cybernetics, Inc.). For IHC, tumor
tissues were fixed with 10% formaldehyde for 24 h at room
temperature and sectioned into 5-µm-thick slides, followed by
incubation with citrate buffer (Thermo Fisher Scientific, Inc.)
under high pressure to repair the antigen for 3 min. The slides
were incubated with 0.3% H2O2 for 20 min at
room temperature to quench the endogenous peroxidase. Next,
blocking reagent (3% BSA; Thermo Fisher Scientific, Inc.) was used
to reduce the non-specific binding of antibodies at room
temperature for 1 h. Primary antibodies against Ki-67 (dilution,
1:200; cat. no. ab16667; Abcam) and KCTD20 (dilution, 1:100; cat.
no. ab122094; Abcam) were used for incubation at 4°C overnight.
After washing with PBS, the slides were incubated with biotinylated
secondary antibody (dilution 1:500; cat. no. ab207995; Abcam) for 1
h at room temperature. The slides were incubated with
HRP-conjugated streptavidin for 40 min at room temperature and then
the DAB chromogen (Promega Corporation) was used for visualization.
Slides were imaged under a light microscope (Leica Microsystems
GmbH). The maximum diameter of the tumor was ~1.1 cm and the tumor
volume 0.56 cm3. Tumor volume was calculated using the
following formula: Tumor volume=length × width2/2. In
addition, the overall survival of the mice was monitored during the
experimental period. All animal experimental procedures were
approved by the Fourth Military Medical University Institutional
Committee for Animal Research (Xi'an, China), and were in
accordance with the Animal Management Rule of the Chinese Ministry
of Health (document 55, 2001) (32).
Fluorescence in situ hybridization
(FISH)
lncRNA NEAT1 expression in glioma tissues and normal
samples was examined by FISH. Briefly, tissues were fixed with 10%
formaldehyde at room temperature for 2 h and embedded in paraffin,
and then cut into 5-µm tissue slices. The NEAT1 sequence
(5′-CGAGAAACGCACAAGAAGGCAGGCAAACAG-3′) was synthesized by Wuhan
Servicebio Technology Co., Ltd. (probe type, oligonucleotide;
template source, human), and marked with 5′ digoxigenin (DIG; cat.
no. GDP1070; Wuhan Servicebio Technology Co., Ltd.) at 37°C for 16
h. Treated sections were digested with Proteinase K (20 µg/ml;
Sigma-Aldrich; Merck KGaA) for 3 min at 37°C, washed three times
for 5 min each with deionized water and PBS at room temperature.
Next, the sections were post-fixed in 10% paraformaldehyde fixative
in PBS for 20 min at room temperature and washed three times (5 min
each time) with PBS. And then tissue samples were incubated with
pre-hybridization solution (Wuhan Servicebio Technology Co., Ltd.)
in an incubator at 37°C for 1 h. Next, after removing the
pre-hybridization solution, the hybridization solution (containing
6 ng/µl NEAT probe; Wuhan Servicebio Technology Co., Ltd.) was
added onto the slides, followed by incubation at 37°C overnight.
Tissue sections were washed with preheated 2X sodium citrate (SSC)
for 10 min, 1X SSC (twice for 5 min each) and 0.5X SSC in sequence
for 10 min at 37°C to remove non-specific and repetitive RNA
hybridization. Subsequently, sections were blocked with 3% BSA
(Thermo Fisher Scientific, Inc.) at room temperature for 30 min,
followed by incubation with anti-DIG-488 antibody (dilution, 1:300;
Jackson ImmunoResearch Laboratories, Inc.) for 50 min and washed
three times (3 min each) with PBS at 37°C. Afterwards, the FITC-TSA
reagent (dilution, 1:3,000; Wuhan Servicebio Technology Co., Ltd.)
was used for incubation for 5 min at room temperature in the dark,
followed by washing with PBS three times for 5 min each, and
incubation with aqueous fluoroshield mounting medium with DAPI (2
µg/ml; cat. no. ab104139; Abcam) for nuclei staining in the dark
for 15 min at room temperature. Finally, the slides were removed
from the plate and fixed with 50% glycerol in PBS at room
temperature for 30 min. Sections were then examined with a Zeiss
LSM 700 confocal microscope (Zeiss AG). The images were analyzed
using ImageJ software (version 1.51; National Institutes of
Health).
Bioinformatics analysis
All statistical analysis was performed using
GraphPad Prism 5.0 (GraphPad Software, Inc.). Gene expression
profiles for patients with glioma [low grade glioma (LGG) and
high-grade glioma (HGG; GBM)] were obtained from The Cancer Genome
Atlas (TCGA; http://tcga-data.nci.nih.gov/tcga/) (33) and clinical data for overall survival
were also download from TCGA (34).
Gliomas were categorized as LGG [World Health Organization (WHO)
Grade I–II] and HGG (WHO Grade III–IV) (35). China Glioma Genome Atlas (CGGA;
http://www.cgga.org.cn/) (36) and Gene Expression Omnibus (dataset
accession no. GSE16011; http://www.ncbi.nlm.nih.gov/geo/query/acc.cgi?acc=GSE16011)
(37) were used to select
differentially expressed lncRNAs, miRNAs and target genes.
Furthermore, StarbaseV2.0 (http://starbase.sysu.edu.cn) and lncRNASNP2
(http://bioinfo.life.hust.edu.cn/lncRNASNP/#!/)
(38) were used to predict the
potentially targeting relationship between lncRNAs and miRNAs.
Based on the dual luciferase reporter assay results, lncRNASNP2 was
used to predict the binding site between NEAT1 and miR-324-5p.
Three online prediction tools, including Targetscan 7.1 (http://www.targetscan.org/), miRDB (http://mirdb.org) (39)
and miRWalk 2.0 (http://mirwalk.umm.uni-heidelberg.de), were used to
search for specific miRNA-mRNA relationships. The different results
of online data prediction were analyzed and used to draw Venn
diagrams using the Venn online analysis software (http://bioinformatics.psb.ugent.be/webtools/Venn/)
(40). In addition, putative binding
sites between miR-324-5p and KCTD20 from Targetscan were used for
miRNA target validation analysis.
Statistical analysis
All experiments were performed in triplicate and
data are presented as the mean ± SD. All statistical analysis was
carried out using GraphPad Prism 5.0 (GraphPad Software, Inc.).
Comparisons between tumor and adjacent normal tissues were
performed using a paired Student's t-test and the experimental and
control groups were compared using an unpaired Student's t-test.
One-way ANOVA was used to compare multiple different groups
followed by Bonferroni's test. Survival curves were analyzed using
Kaplan-Meier analysis, and significance was determined using the
log-rank test. For TCGA Kaplan-Meier analysis, the median
expression level was used as the cut-off value (n=314 >median;
n=314 ≤median). The χ2 test was used to analyze the
association between NEAT1 and the clinicopathologic characteristics
of patients. The correlation between NEAT1, miR-324-5p and KCTD20
expression was determined by Spearman's rank correlation analysis.
P<0.05 was considered to indicate a statistically significant
difference.
Results
NEAT1 expression is upregulated in
glioma tissues and is associated with poor prognosis
To evaluate aberrantly expressed lncRNAs in glioma
and to identify those that may be involved in tumorigenesis, the
glioma datasets LGG and HGG (GBM) from TCGA was analyzed. Among the
dysregulated lncRNAs detected, NEAT1 expression was significantly
upregulated in high-grade gliomas (HGG; n=172) compared with in
low-grade gliomas (LGG; n=530; Fig.
1A). In addition, RT-qPCR analysis of NEAT1 levels in 43
matched pairs of clinical specimens revealed significantly elevated
NEAT1 expression in glioma tissues compared with adjacent normal
brain tissues (n=43; Fig. 1B).
Additionally, NEAT1 expression was examined in NHAs and a panel of
six human glioma cell lines (U87MG, LN229, H4, U251, U118 and
A172), and significantly higher NEAT1 expression was detected in
all six tumor cell lines, particularly U251 and LN229 cells,
compared with in NHAs (Fig. 1C).
Furthermore, FISH and IHC demonstrated that the expression levels
of NEAT1 and Ki-67, a proliferation marker, were upregulated in
glioma sections compared with in normal brain sections (Fig. 1D), which was consistent with the
RT-qPCR results (Fig. 1B).
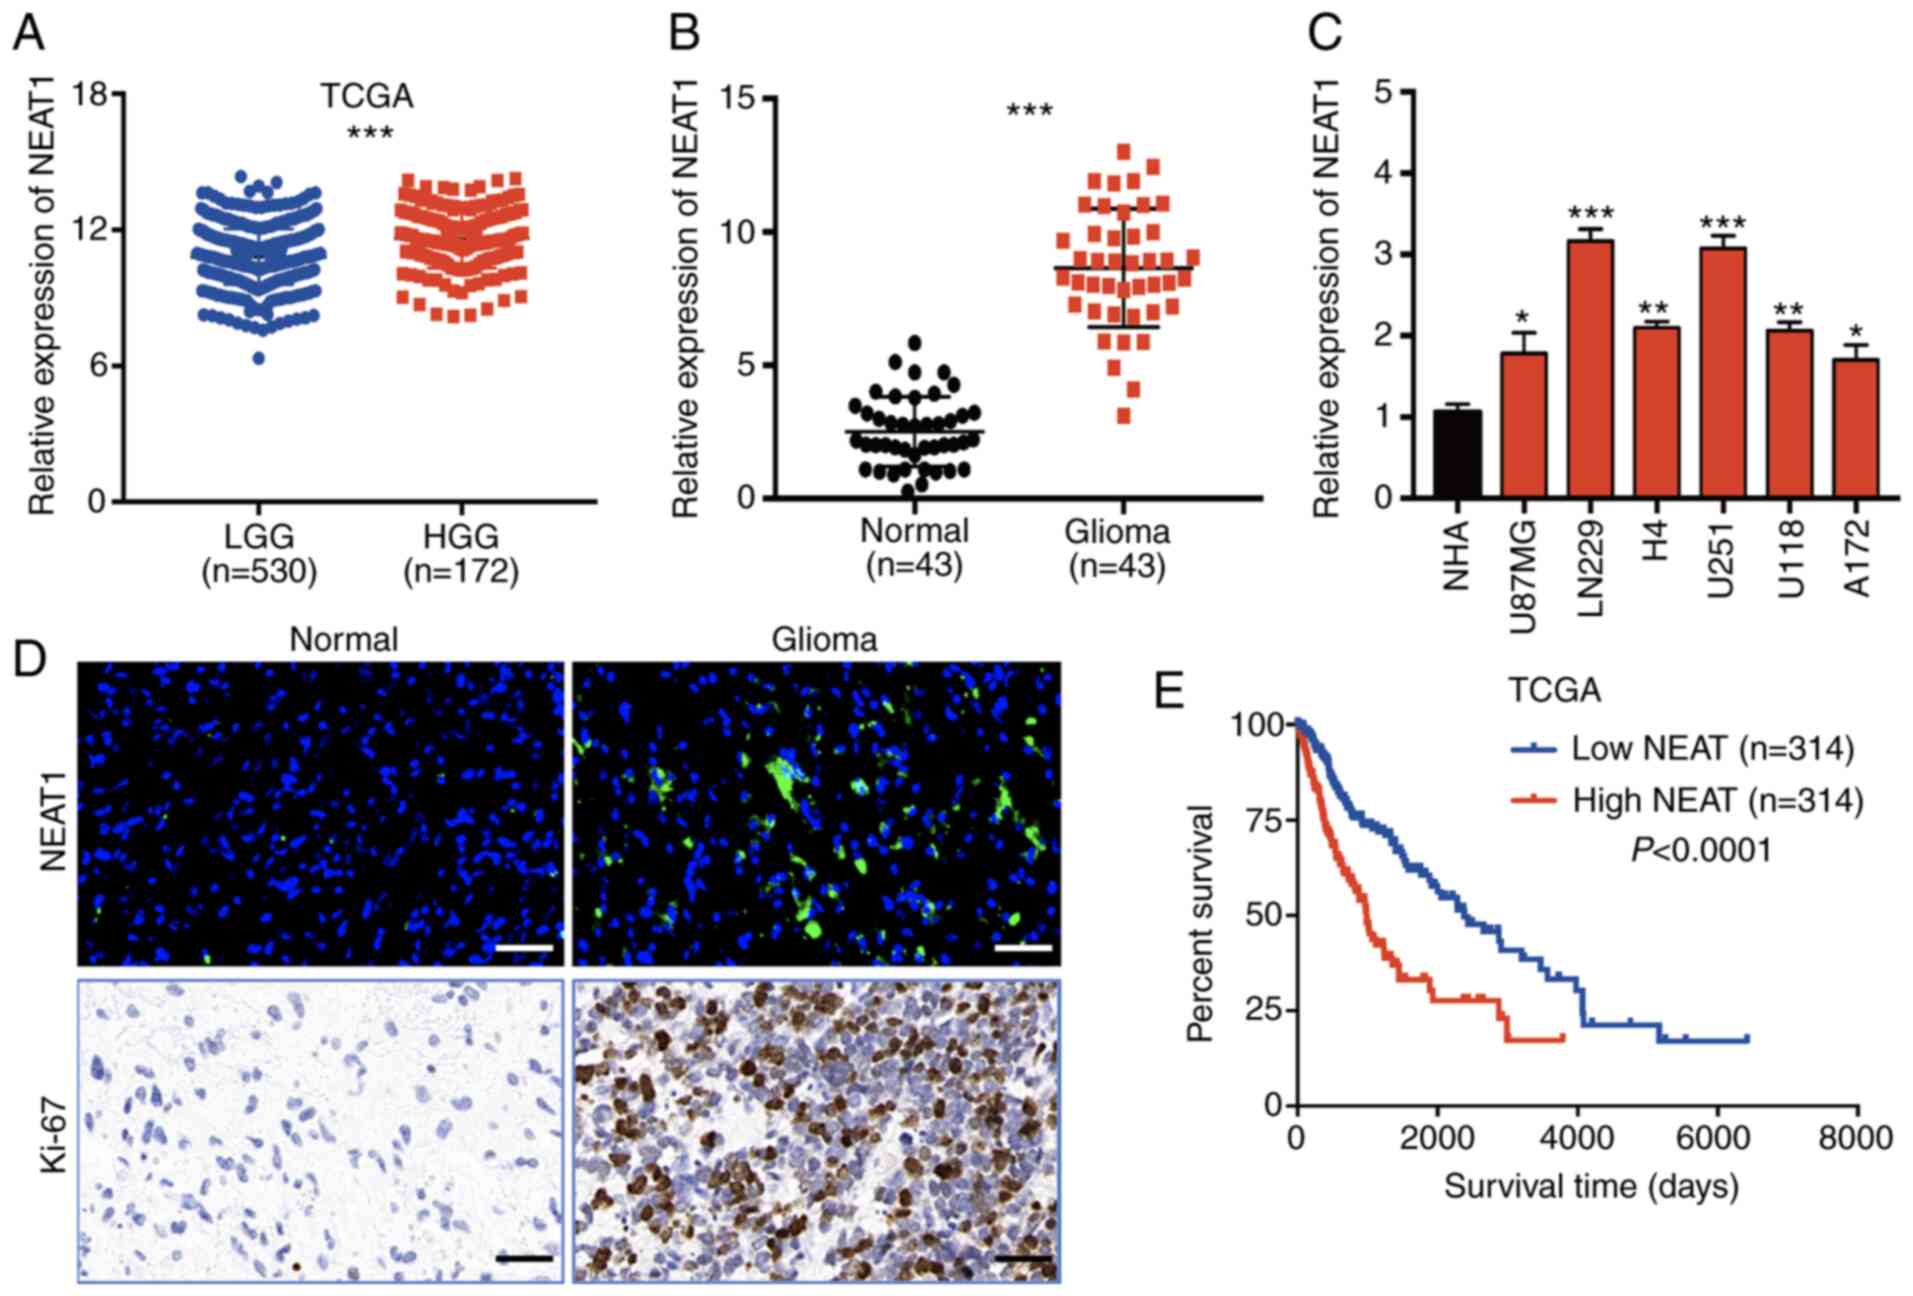 | Figure 1.Expression levels of long non-coding
RNA NEAT1 in glioma tissues and cell lines. (A) NEAT1 expression in
LGG and HGG tissues in a TCGA dataset. (B) RT-qPCR of NEAT1
expression in 43 pairs of glioma tissues and adjacent non-tumor
tissues. Data were normalized to GAPDH mRNA expression. (C) RT-qPCR
of NEAT1 expression in NHAs and six glioma cell lines (U87MG,
LN229, H4, U251, U118 and A172). (D) Fluorescence in situ
hybridization of NEAT1 expression (upper panels) and
immunohistochemical staining of Ki-67 expression (lower panels) in
glioma tissues and adjacent non-tumor tissues. Scale bar, 100 µm.
(E) Kaplan-Meier survival analysis of patients with glioma
stratified by high (n=314) and low (n=314) tumor expression levels
of NEAT1. Data were obtained from TCGA. The experiments were
performed in triplicate and data are presented as the mean ± SD.
*P<0.05, **P<0.01 and ***P<0.001 vs. normal astrocytes
(NHA) or as indicated. NEAT1, nuclear paraspeckle assembly
transcript 1; NHAs, normal human astrocytes; LGG, low-grade glioma;
HGG, high-grade glioma; RT-qPCR, reverse transcription quantitative
PCR; TCGA, The Cancer Genome Atlas. |
To assess the effect of NEAT1 upregulation on the
prognosis of patients with glioma, Kaplan-Meier survival analysis
was conducted using the median NEAT1 expression level as the
cut-off value for dichotomization of patients from the dataset
obtained from TCGA. It was revealed that high NEAT1 expression was
significantly associated with a shorter overall survival (Fig. 1E). Furthermore, 43 patients were
divided into two groups with high or low NEAT1 expression, using
the median expression level as the cut-off value (n=22 >median;
n=22 ≤median). The results demonstrated that high NEAT1 expression
was significantly associated with a larger tumor size (P=0.047) and
advanced World Health Organization glioma stage (P=0.044; Table I). In combination, these data
suggested that NEAT1 expression was significantly upregulated in
glioma and could potentially serve as a prognostic marker for
patients with glioma.
NEAT1 promotes the proliferation of
glioma cells and induces apoptosis in vitro
To explore the potential mechanisms via which
elevated NEAT1 expression may influence glioma cell biology, gain-
and loss-of-function experiments with U251 and LN229 cell lines,
which had the highest NEAT1 expression levels (Fig. 1C), were performed by transfecting them
with a control sequence (siCtrl) or NEAT1-specific siRNA (siNEAT1),
or with a NEAT1 overexpression vector (pcDNA 3.1-NEAT1) or empty
vector. RT-qPCR was performed 48 h after transfection and
demonstrated that NEAT1 siRNA significantly reduced NEAT1
expression in U251 and LN229 cells, while transfection of
pcDNA-NEAT1 increased NEAT1 expression (Fig. 2A).
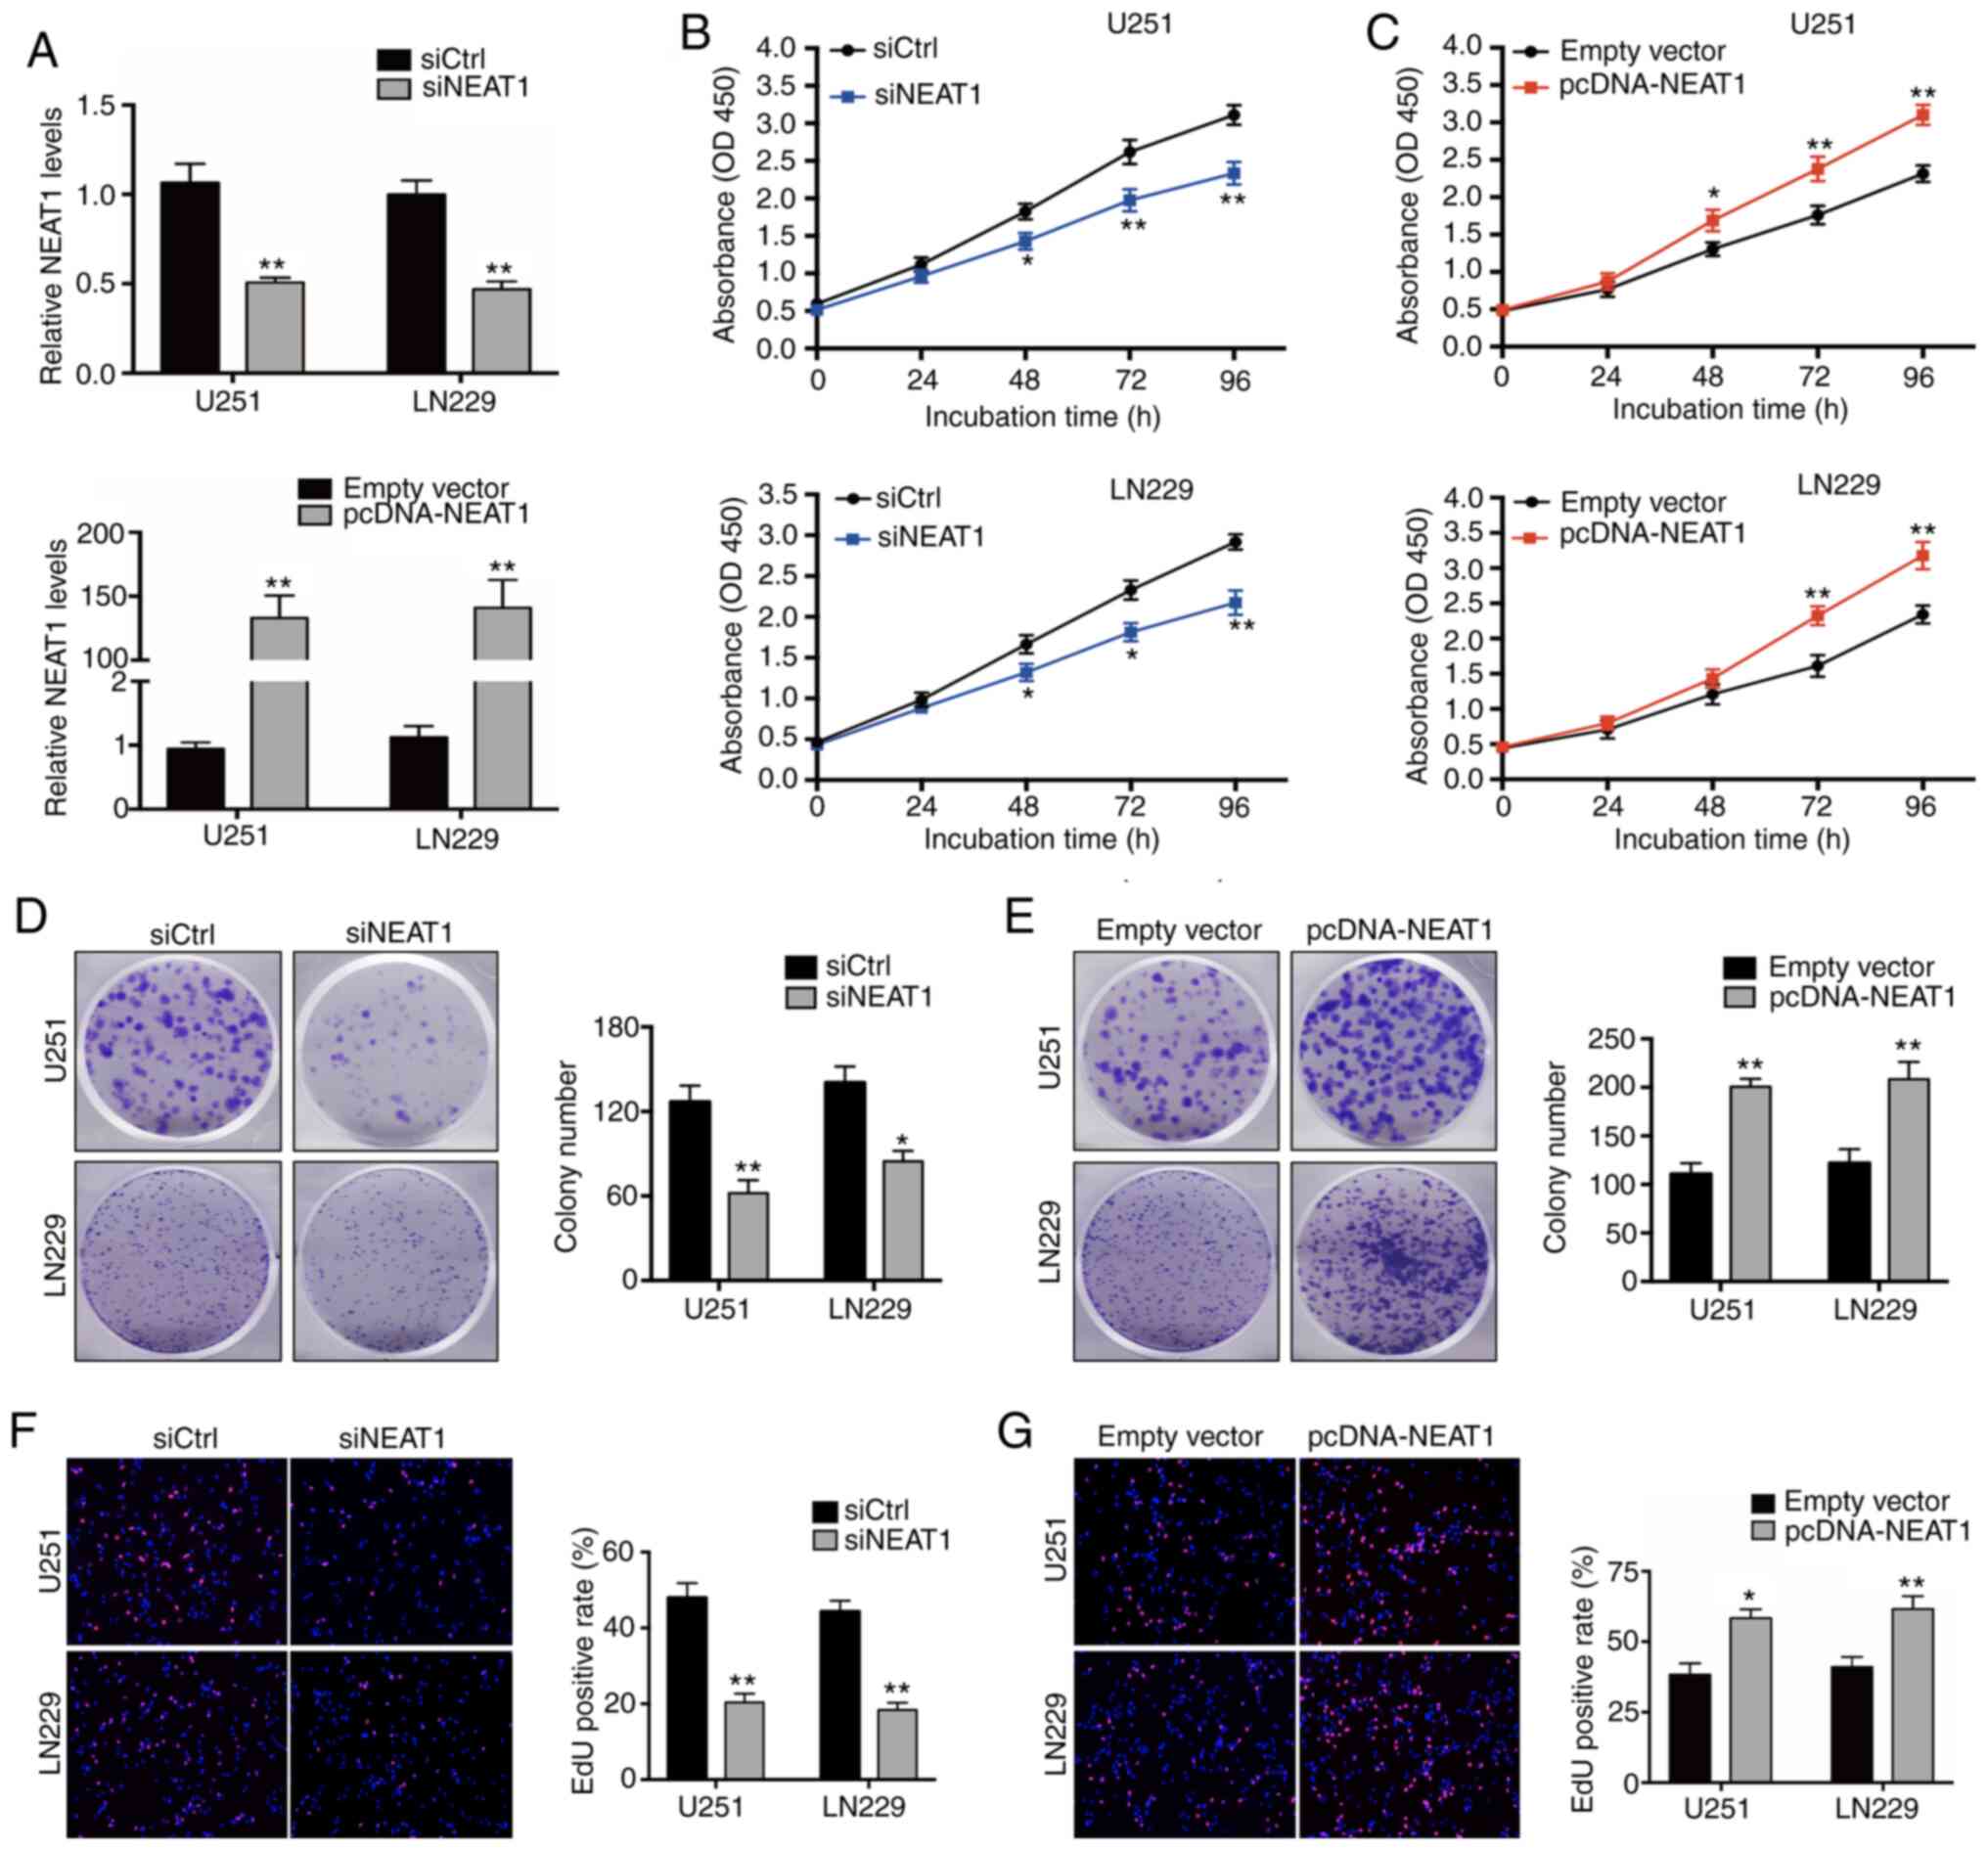 | Figure 2.Effects of NEAT1 on glioma cells
proliferation in vitro. (A) Reverse
transcription-quantitative PCR analysis of NEAT1 expression in U251
and LN229 cells transfected with siCtrl, siNEAT1, pcDNA-NEAT1 or
empty vector. (B) Cell Counting Kit-8 proliferation assay of U251
and LN229 cells transfected with siCtrl or siNEAT1. (C) A Cell
Counting Kit-8 assay was used to analyze cell proliferation in U251
and LN229 cells transfected with empty vector or pcDNA-NEAT1. (D)
Representative plate images (left) and quantitative analysis
(right) of colony formation (magnification, ×40) after 14 days of
incubation of cells transfected with siCtrl or siNEAT1. (E)
Representative plate images (left) and quantitative analysis
(right) of colony formation (magnification, ×40) after 14 days of
incubation of cells transfected with empty vector or pcDNA-NEAT1.
(F) Fluorescence microscopy images (left) and quantification
(right) of EdU (magnification ×200) staining of cells transfected
with siCtrl or siNEAT1. (G) EdU (magnification ×200) staining of
cells transfected with empty vector or pcDNA-NEAT1. The experiments
were performed in triplicate and data are presented as the mean ±
SD. *P<0.05 and **P<0.01 vs. siCtrl or empty vector. NEAT1,
nuclear paraspeckle assembly transcript 1; EdU,
ethynyldeoxyuridine; OD, optical density; pcDNA-NEAT1, NEAT1
overexpression vector; siRNA, small interfering RNA; siCtrl,
control siRNA; siNEAT1, NEAT1-specific siRNA. |
To analyze the effects of NEAT1 regulation on glioma
cell function, the proliferation of transfected cells was assessed
using CCK-8, EdU staining and colony formation assays. The results
revealed significantly reduced proliferation in cells expressing
siNEAT1 compared in cells transfected with siCtrl (Fig. 2B, D and F), as reflected in all three
assays. Conversely, the overexpression of NEAT1 promoted cell
proliferation in both U251 and LN229 cells in all three assays
(Fig. 2C, E and G). Collectively,
these results suggested that NEAT1 may act as an oncogene in
glioma.
Knockdown of NEAT1 induces cell cycle
arrest and apoptosis in glioma cells in vitro and suppresses
gliomagenesis in vivo
To determine the potential mechanism through which
NEAT1 may promote glioma cell proliferation, the effects of
knockdown or overexpression of NEAT1 on the cell cycle distribution
and apoptotic rate of U251 and LN229 cells were analyzed using flow
cytometry. Downregulation of NEAT1 expression resulted in a marked
accumulation of U251 and LN229 cells at the
G0/G1 phase of the cell cycle, with a
concomitant decrease in the proportion of cells at the S phase
(Fig. 3A). Conversely, an increase in
cell cycle progression of G1-S transition was observed
in NEAT1-overexpressing U251 (S phase increased from 21.1 to 34.6%)
and LN229 cells (S phase increased from 23.2 to 41.4%; Fig. 3B). Consistent with these results, the
proportion of cells undergoing apoptosis was increased
significantly following knockdown of NEAT1 and decreased following
overexpression of NEAT1 (Fig. 3C and
D). These results were supported by the analysis of the
expression levels of the cell cycle-related proteins CDK-4 and
cyclin D1, the pro-apoptotic protein Bax and the anti-apoptotic
protein Bcl-2. Western blotting demonstrated that the protein
expression levels of CDK-4, cyclin D1, Bcl-2 and Bax were
upregulated or downregulated in a manner consistent with the
functional effects of knockdown and overexpression of NEAT1 on cell
cycle progression and apoptosis. As shown in Fig. 3E, knockdown of NEAT1 was associated
with decreased expression levels of cycle-related proteins (CDK-4
and cyclin D1) and apoptosis-related protein Bcl-2 but the
expression levels of apoptosis-related protein Bax were increased.
By contrast, the overexpression of NEAT1 inhibited the expression
of Bax and promoted the expression of CDK-4, cyclin D1 and Bcl-2
(Fig. 3E).
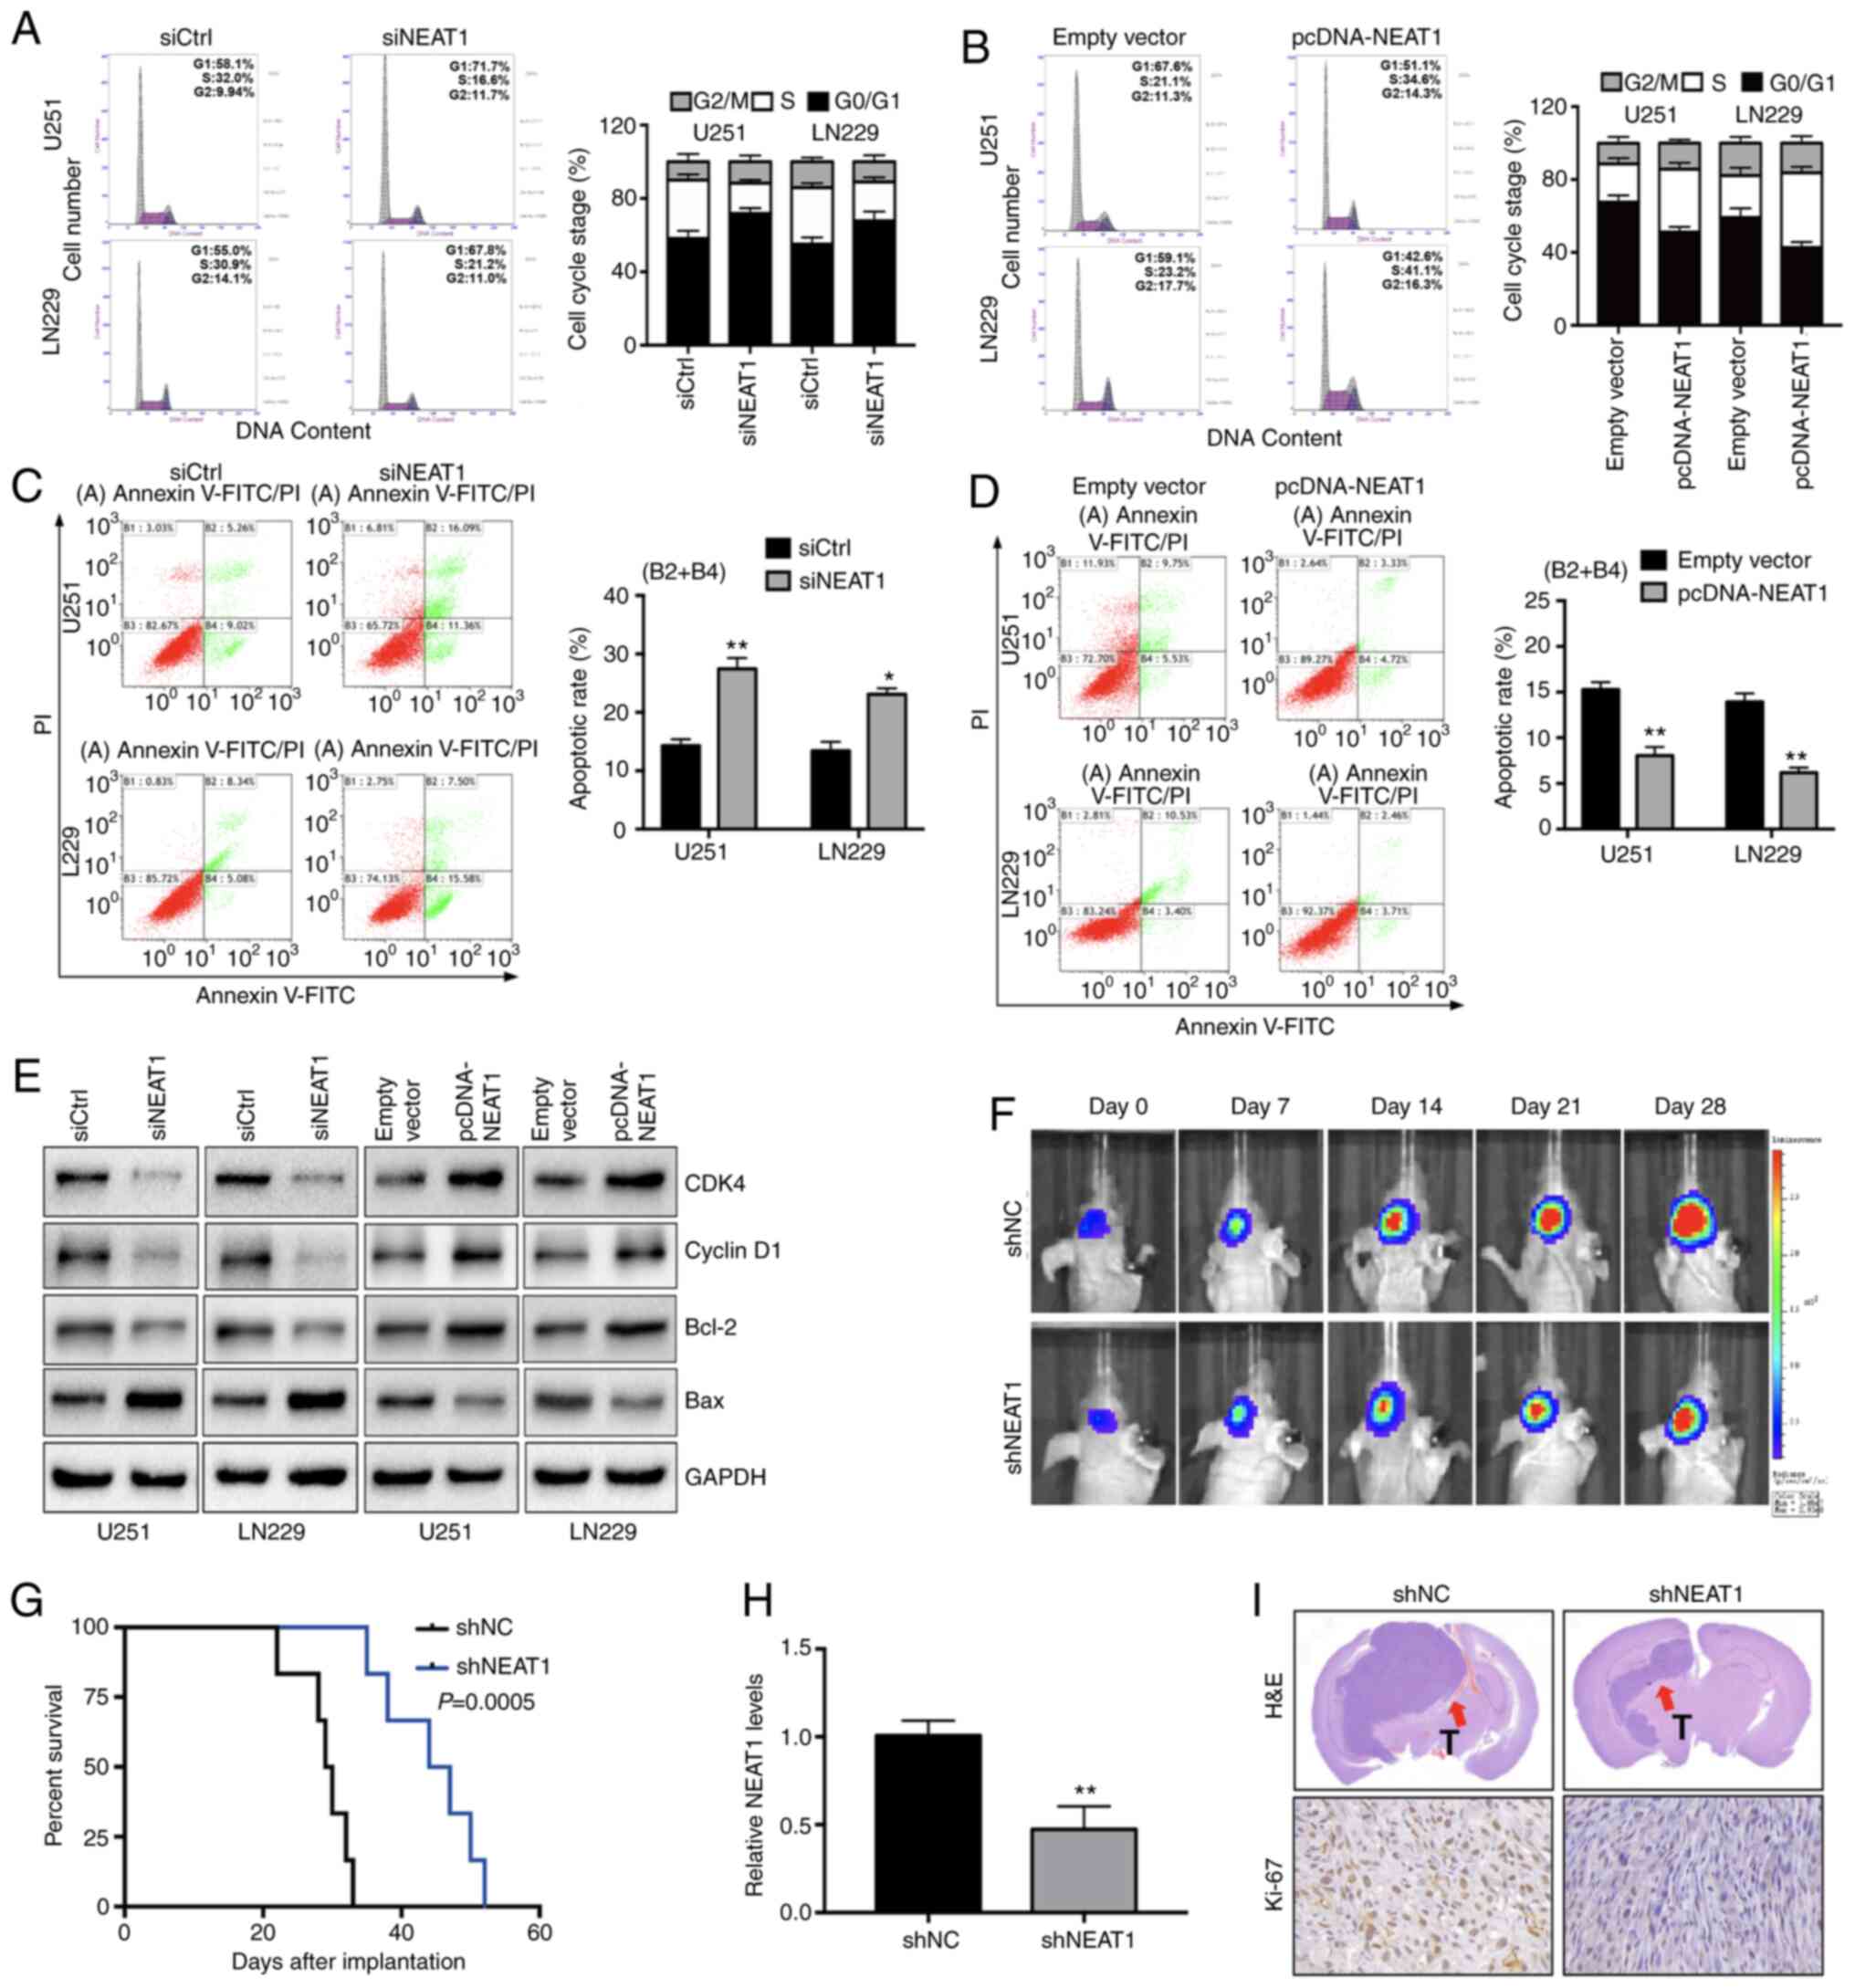 | Figure 3.Long non-coding RNA NEAT1 involvement
in glioma cell apoptosis and cell cycle progression in vitro
and in vivo. (A) Flow cytometry histograms (left) and
quantification (right) of the cell cycle distribution of U251 and
LN229 cells transfected with siCtrl or siNEAT1. (B) Flow cytometry
assays were performed to analysis the cell cycle distribution of
U251 and LN229 cells transfected with pcDNA-NEAT1 or empty vector.
(C) Flow cytometry dot plots (left) and quantification (right) of
the apoptotic rates of U251 and LN229 cells transfected with siCtrl
or siNEAT1. Quadrants B2 and B4 contained terminal and early
apoptotic cells, respectively. (D) Flow cytometry cell apoptosis
assays were performed to measure the apoptotic rates of U251 and
LN229 cells transfected with pcDNA-NEAT1 or empty vector. Quadrants
B2 and B4 contained terminal and early apoptotic cells,
respectively. (E) Western blot analysis of the expression levels of
cell cycle proteins (CDK4 and cyclin D1) and apoptosis-related
proteins (Bcl-2 and Bax) in U251 and LN229 cells transfected as
described for (A and B) GAPDH was used as the loading control. (F)
Representative in vivo images of nude mice injected
intracranially with U251 cells transfected with shNC or shNEAT1
(n=6 for each group). Mice were injected with D-luciferin and
imaged with the IVIS imaging system. (G) Survival of mice treated
as described for (F) A log-rank test was used to assess the
statistical significance of the differences. (H) Reverse
transcription-quantitative PCR was performed to detect the
expression levels of NEAT1 in implanted tumor tissues. (I)
Representative images of H&E staining (upper panels;
magnification, ×100) and immunohistochemical staining of Ki-67
(lower panels; magnification, ×400) of tumors excised from mice
treated with shNEAT1. Arrows indicate the location of the tumor.
The experiments were performed in triplicate and data are presented
as the mean ± SD. *P<0.05 and **P<0.01 vs. siCtrl or empty
vector. NEAT1, nuclear paraspeckle assembly transcript 1;
pcDNA-NEAT1, NEAT1 overexpression vector; shNC, control shRNA;
shNEAT1, NEAT1-specific shRNA; shRNA, short hairpin RNA; siCtrl,
control siRNA; siNEAT1, NEAT1-specific siRNA; siRNA, small
interfering RNA; T, tumor. |
Subsequently, the present study examined whether the
role of NEAT1 in the promotion of glioma cell proliferation in
vitro could also be observed in vivo. U251 cell lines
stably expressing shNC or shNEAT (n=6 for each group) were
generated, and the cells were injected intracranially into nude
mice. As shown in Fig. 3F and G,
silencing of NEAT1 markedly inhibited the growth of intracranial
tumors at all examined time points and also significantly increased
the survival of mice. Furthermore, RT-qPCR revealed that the
shNEAT1 transfection group had lower NEAT1 levels compared with the
control group (Fig. 3H). H&E and
IHC staining of tumors excised from experimental mice demonstrated
the effect of NEAT1 knockdown on tumor growth. Tumors derived from
shNEAT1-expressing U251 cells were markedly smaller and expressed
much lower levels of Ki-67 compared with control tumors (Fig. 3I). These data indicated that silencing
of NEAT1 inhibited glioma cell proliferation by inducing cell cycle
arrest and promoting apoptosis, and demonstrated the carcinogenic
activity of NEAT1 in glioma in vivo.
NEAT1 functions as a ceRNA by
competitively binding to miR-324-5p
To determine whether the effects of NEAT1 in glioma
might be mediated by sponging of ≥1 miRNAs, the present study
searched for potential candidate miRNAs with sequences
complementary to NEAT1 using the online target prediction tools
StarbaseV2.0 and lncRNASNP2. Based on this analysis, 13 miRNAs that
were identified by both tools were selected (Fig. 4A), and their expression levels were
analyzed in normal and glioma tissues using the TCGA and CGGA
datasets. The results identified four miRNAs (miR-125a, miR-324-5p,
miR-495-3p and miR-504) that were expressed at significantly lower
levels in GBM tissues compared with normal brain tissues (Figs. 4B and S1A), and in HGG compared with LGG (Fig. 4C).
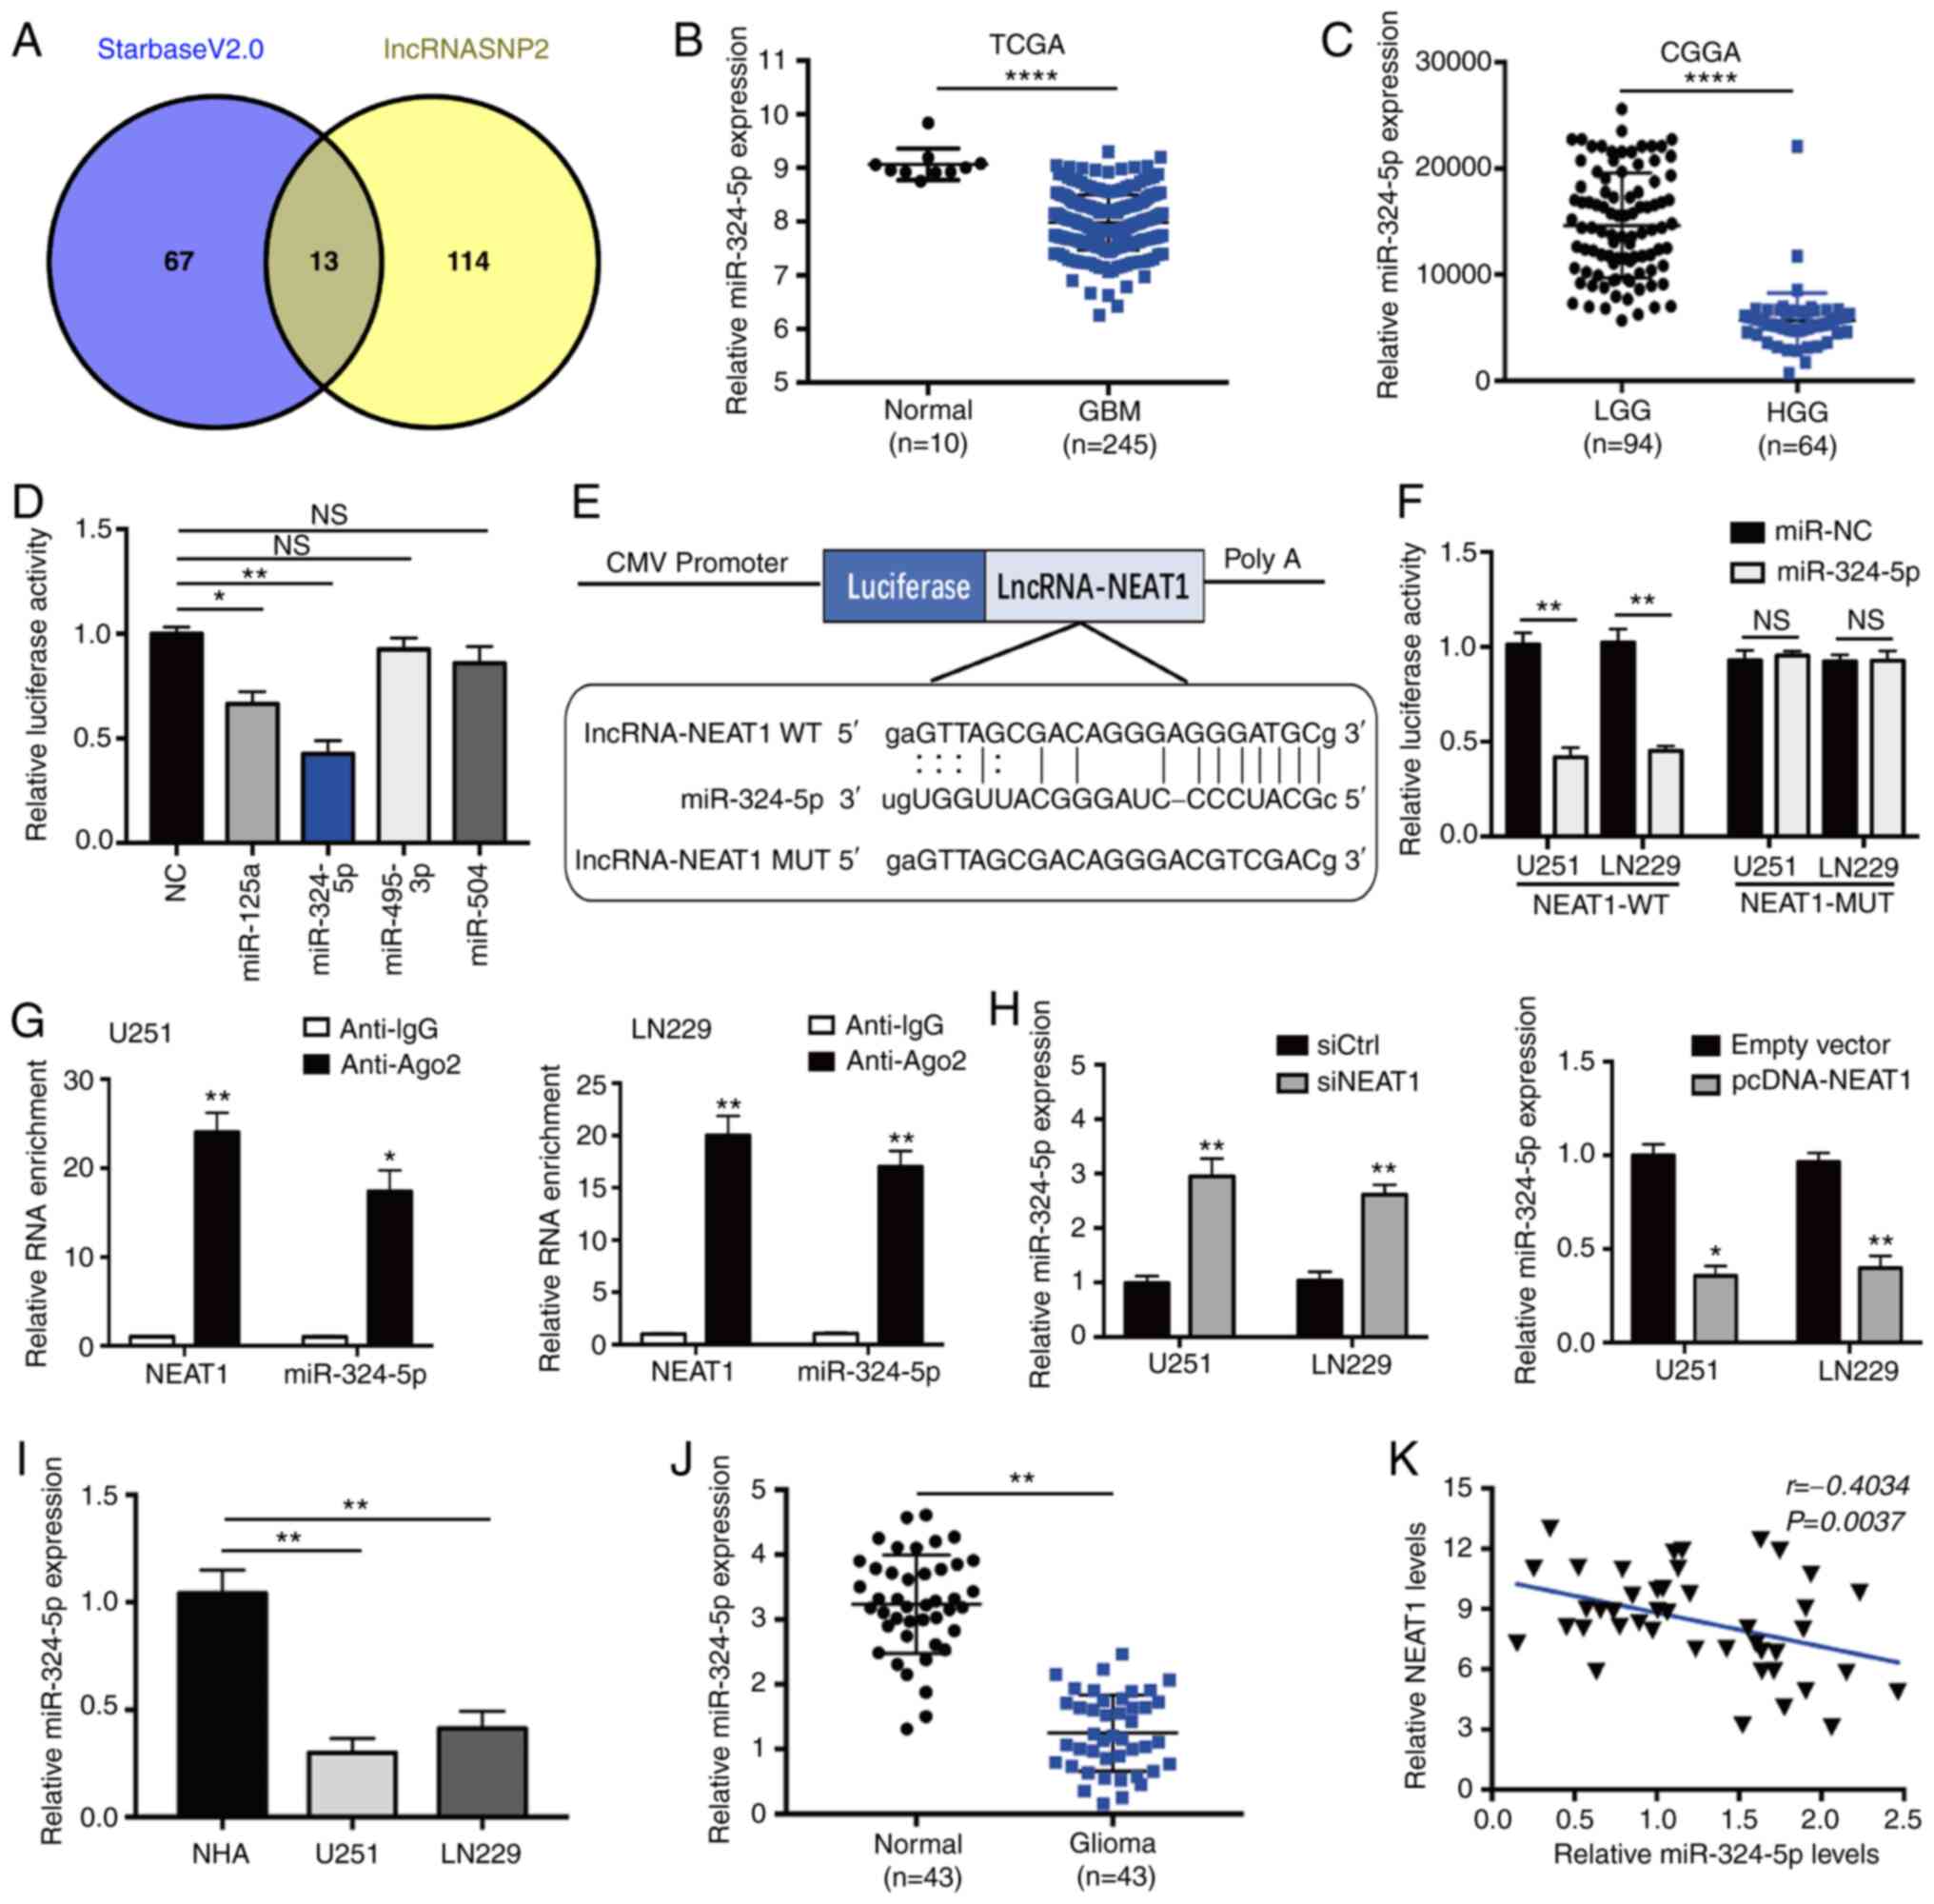 | Figure 4.Direct interaction between lncRNA
NEAT1 and miR-324-5p. (A) Venn diagram showing an overlap of
potential NEAT1 targets predicted by Starbase V2.0 and lncRNASNP2.
(B and C) Relative expression levels of miR-324-5p in glioma
tissues compared with normal tissues. Data were obtained from (B)
TCGA and (C) CGGA databases. (D) Luciferase activity in 293T cells
co-transfected with the luciferase reporter gene plasmids
containing NEAT1 sequence and four different miR-encoding plasmids.
(E) Schematic showing the WT sequence of NEAT1, the location of the
miR-324-5p-binding site predicted by lncRNASNP2, and the MUT
sequence of NEAT1 used for the luciferase reporter assays. (F)
Luciferase activity of U251 and LN229 cells co-transfected with NC
or miR-324-5p mimics and a luciferase reporter plasmid driven by
WT- or MUT-NEAT1. (G) RNA immunoprecipitation assays of U251 and
LN229 cells immunoprecipitated with IgG or anti-Ago2 antibodies,
followed by RT-qPCR of the immmunoprecipitates for NEAT1 and
miR-324-5p sequences. (H) RT-qPCR of miR-324-5p expression in U251
and LN229 cells transfected with siCtrl, siNEAT1, pcDNA-NEAT1 or
empty vector. RT-qPCR analysis of miR-324-5p expression in (I) NHAs
or U251 and LN229 cells, or (J) in glioma and matched normal
tissues. (K) Spearman's rank correlation analysis of the
association between NEAT1 and miR-324-5p expression in 43 glioma
specimens. The experiments were performed in triplicate and data
are presented as the mean ± SD. *P<0.05, **P<0.01 and
****P<0.0001 vs. anti-IgG, siCtrl or empty vector. Ago2,
argonaute RISC catalytic component 2; CGGA, Chinese Glioma Genome
Atlas; GBM, glioblastoma; HGG, high-grade glioma; LGG, low-grade
glioma; lncRNA, long non-coding RNA; miR, microRNA; MUT, mutant;
NC, negative control; NEAT1, nuclear paraspeckle assembly
transcript 1; NHAs, normal human astrocytes; NS, not significant;
pcDNA-NEAT1, NEAT1 overexpression vector; RT-qPCR, reverse
transcription quantitative PCR; siCtrl, control siRNA; siNEAT1,
NEAT1-specific siRNA; siRNA, small interfering RNA; TCGA, The
Cancer Genome Atlas; WT, wild-type. |
The ability of miR-125a, miR-324-5p, miR-495-3p and
miR-504 to interact directly with NEAT1 was analyzed using
luciferase reporter assays. Co-transfection of cells with a
NEAT1-driven luciferase expression vector and miR-125a or
miR-324-5p mimics significantly inhibited luciferase activity
compared with that of cells co-transfected with controls (Fig. 4D), indicating that these two miRNAs
bound to the NEAT1 sequence. Of the two inhibitory miRNAs,
miR-324-5p had the greatest inhibitory activity and was therefore
selected for further analysis. To verify binding between NEAT1 and
miR-324-5p, the control or miR-324-5p mimics were co-transfected
along with luciferase vectors driven by the WT-NEAT1 sequence or a
mutated sequence (MUT-NEAT1) carrying mismatched residues in the
predicted miR-324-5p binding site (Fig.
4E). As shown in Fig. 4F, the
luciferase activity of U251 and LN229 cells co-transfected with
WT-NEAT1 and miR-324-5p was significantly reduced compared with
that of cells transfected with miR-NC, but there was no significant
change in the MUT-NEAT1 group, which demonstrated a direct
association between NEAT1 and miR-324-5p. These results were
substantiated by the results of the RIP experiments in U251 and
LN229 cells. The RIP analysis revealed that NEAT1 was highly
enriched in Ago2 immmunoprecipitates from cells transfected with
the miR-324-5p mimics compared with the anti-IgG group (Fig. 4G).
The assessment of the functional association between
NEAT1 and miR-324-5p by RT-qPCR, and it was revealed that knockdown
of NEAT1 was associated with the upregulation of miR-324-5p in U251
and LN229 cells. Furthermore, overexpression of NEAT1 was
associated with the opposite results (Fig. 4H). The downregulation or upregulation
of miR-324-5p had no significant effect on NEAT1 expression
(Fig. S1B). These results
demonstrated that NEAT1 may directly bind to and modulate the
expression levels of miR-324-5p in glioma cells. The expression
levels of miR-324-5p were detected in NHA, U251 and LN229 cells by
RT-qPCR, and the results revealed that, compared those in with NHA
cells, the expression levels of miR-324-5p in U251 and LN229 were
significantly reduced (Fig. 4I).
Furthermore, miR-324-5p expression was significantly lower in human
glioma tissues compared with in normal tissues (Fig. 4J), and Spearman's correlation analysis
demonstrated a significant negative correlation between the
expression levels of NEAT1 and miR-324-5p in glioma tissues
(Fig. 4K). In combination, these data
demonstrated that NEAT1 functions as a ceRNA to modulate miR-324-5p
levels in glioma.
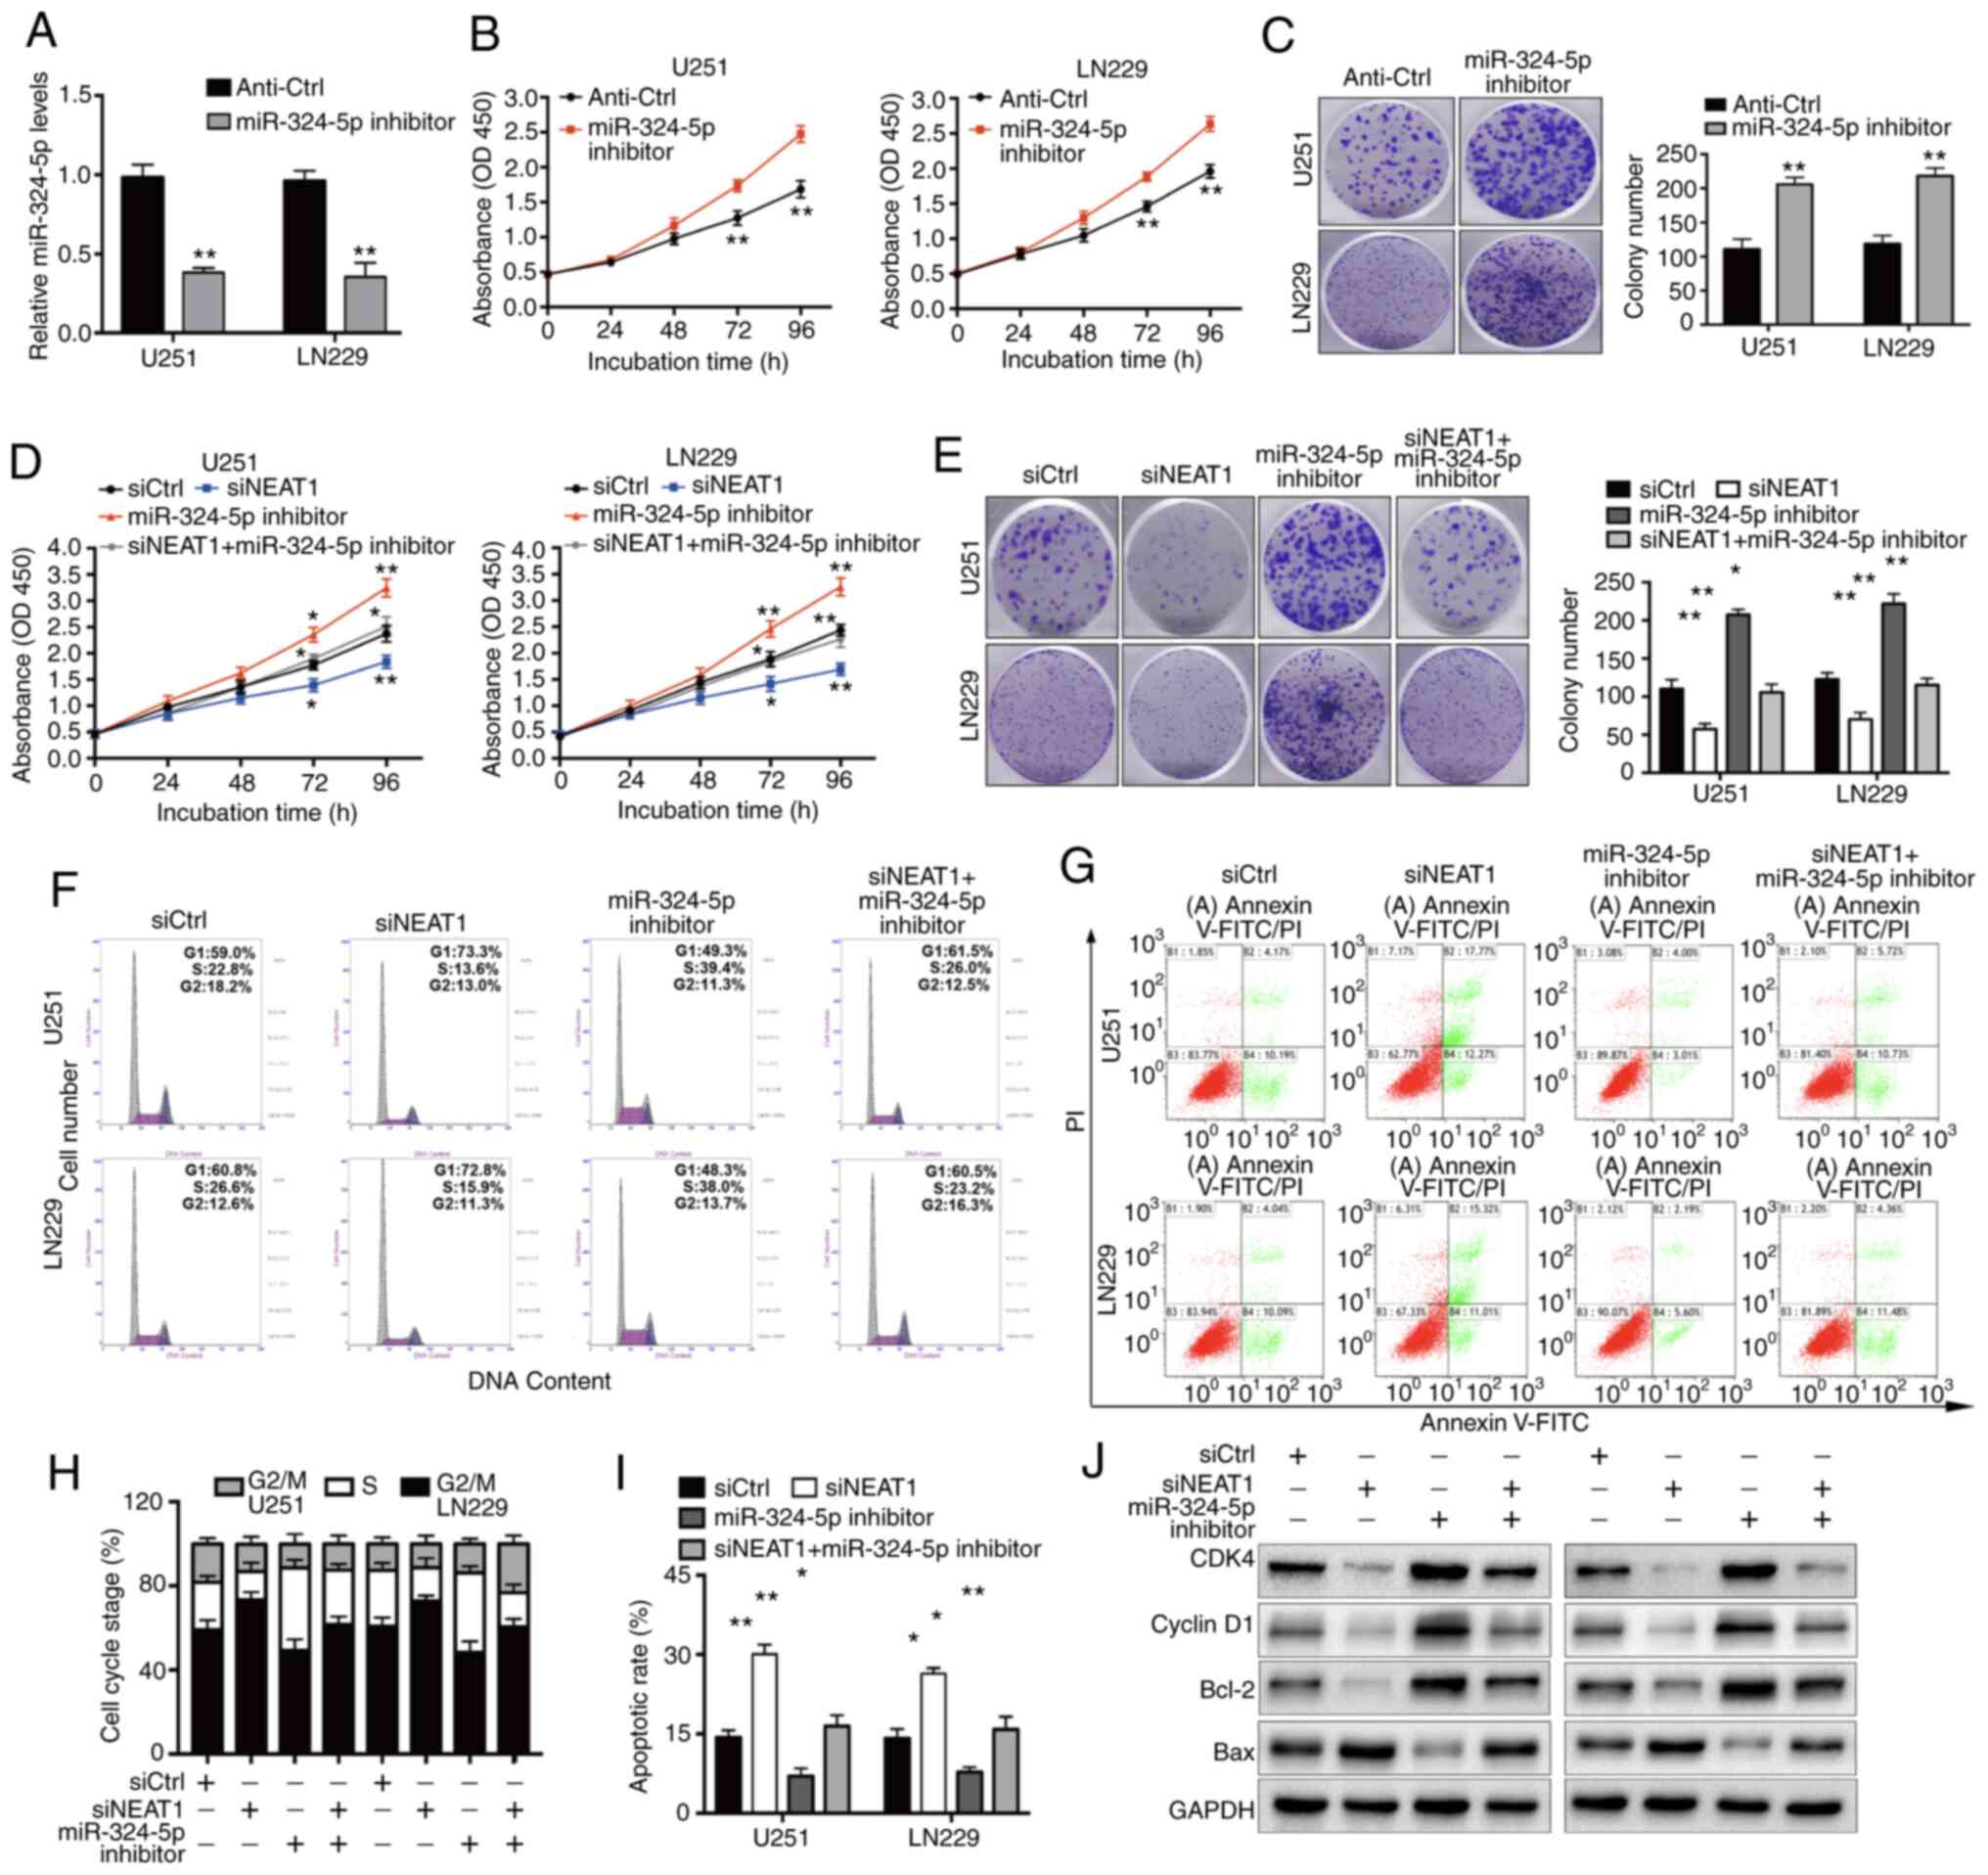
miR-324-5p inhibition reverses the
suppressive effects of knockdown of NEAT1 on glioma cells
Having established an association between NEAT1 and
miR-324-5p, it was next examined whether miR-324-5p mediates the
NEAT1-induced changes in glioma cell biology. For these
experiments, U251 and LN229 cells were transfected with a
miR-324-5p inhibitor (Fig. 5A) with
or without concomitant NEAT1 knockdown. Compared with those of
control glioma cells, transfection of the miR-324-5p inhibitor
alone markedly increased proliferation and colony formation
(Fig. 5B and C). In addition, the
experiments demonstrated that overexpression of miR-324-5p
significantly inhibited the progression of glioma in vitro.
miR-324-5p mimics were transfected into U251 and LN229 cells
(Fig. S1C). Colony formation and EdU
assays revealed that overexpression of miR-324-5p significantly
inhibited the cell proliferation rate (Fig. S1D and E). Additionally, the cell
cycle was blocked at the G0/G1 phase
(Fig. S1F). Additionally,
upregulation of miR-324-5p resulted in an increase in the number of
apoptotic cells (Fig. S1G). Western
blotting was used to analyze the expression levels of cycle-related
proteins and apoptosis-related proteins after cells were
transfected with miR-324-5p mimics (Fig.
S1H). As shown in Fig. 5E-J,
glioma cells were co-transfected with siNEAT1 and the miR-324-5p
inhibitor or siCtrl. These experiments demonstrated that miR-324-5p
inhibition partially reversed the effects of transfection with
siNEAT1 on U251 and LN229 cell proliferation and colony formation
(Fig. 5D and E), as well as cell
cycle arrest and apoptosis (Fig.
5F-I), and had a corresponding rescue effect on the expression
levels of cell cycle and apoptosis-related proteins (Fig. 5J). Collectively, these data suggested
that a potential interaction between NEAT1 and miR-324-5p may be
involved in the development of glioma.
 | Figure 5.miR-324-5p involvement in glioma cell
proliferation, cell cycle progression and apoptosis in
vitro. (A) Reverse transcription-quantitative PCR analysis of
miR-324 expression, (B) CCK-8 cell proliferation assay and (C)
colony formation assay (magnification, × 40) of U251 and LN229
cells transfected with an miR-324-5p inhibitor or Anti-Ctrl. (D)
CCK-8 cell proliferation assay, (E) colony formation assay
(magnification, ×40) and (F and H) cell cycle distribution analysis
of U251 and LN229 cells transfected with siCtrl or siNEAT1 with or
without an miR-324-5p inhibitor. (G and I) FACS analysis of the
apoptotic rate of U251 and LN229 cells transfected with siCtrl or
siNEAT1 with or without an miR-324-5p inhibitor. (J) Western
blotting of the indicated cell cycle and apoptosis proteins in
LN229 and U251 cells transfected as described for (F-I) GAPDH was
used as the loading control. The experiments were performed in
triplicate and data are presented as the mean ± SD. *P<0.05 and
**P<0.01 vs. Anti-Ctrl, siCtrl or as indicated. Anti-Ctrl,
control sequence; CCK-8, Cell Counting Kit-8; FACS, fluorescence
activated cell sorting; miR, microRNA; NEAT1, nuclear paraspeckle
assembly transcript 1; OD, optical density; siCtrl, control siRNA;
siNEAT1, NEAT1-specific siRNA; siRNA, small interfering RNA. |
NEAT1 positively regulates KCTD20
expression via competitive inhibition of miR-324-5p
The present study next sought to identify the target
mRNAs of miR-324-5p through which NEAT1 and miR-324-5p regulate
glioma cell proliferation. Using the online informatics tools
TargetScan, miRDB and miRWalk, which predict miR-324-5p target
mRNAs based on sequence complementarity, 52 shared target genes
with potential binding sites for miR-324-5p were identified from
the three online informatics tools (Fig.
6A). Among the 52 genes, six were expressed at significantly
higher levels in glioma tissues compared with normal tissues in the
dataset from TCGA (Fig. S2A and B).
The mRNA and protein expression levels of the six genes were
analyzed in U251 cells transfected with a control sequence or the
miR-324-5p inhibitor. This analysis revealed that miR-324-5p
suppression significantly increased the expression levels of all
six genes. However, the most striking effect was that on KCTD20
expression (Fig. 6B). Notably, KCTD20
expression was consistently upregulated in glioma tissues compared
with normal brain tissues in the clinical specimens, as well as the
TCGA, CGGA and GSE16011 datasets (Figs.
6C and S2B). Similarly, IHC
staining showed that the abundance of KCTD20 protein in human
glioma samples was increased compared with that in normal brain
tissue (Fig. S2C). Therefore, KCTD20
was selected for further analysis of the NEAT1-miR-324-5p-mRNA
regulatory relationship in glioma cells.
 | Figure 6.Direct targeting of the 3′-UTR of
KCTD20 by miR-324-5p and inhibition of its effects by silencing of
NEAT1. (A) Venn diagram showing an overlap among potential
miR-324-5p target genes predicted by Targetscan, miRBD and miRWalk.
(B) Western blotting and RT-qPCR analysis of the expression levels
of six putative miR-324-5p target genes in U251 cells transfected
with Anti-Ctrl or miR-324-5p inhibitor. (C) RT-qPCR analysis of
KCTD20 expression in glioma and adjacent non-tumor tissues. (D)
Schematic showing the WT-KCTD20 3′-UTR sequence, the location of
the miR-324-5p binding site predicted by Targetscan and the
MUT-KCTD20 3′-UTR sequence used for the luciferase reporter assay.
(E) Luciferase activity in U251 and LN229 cells co-transfected with
a luciferase plasmid driven by the WT- or MUT-KCTD20 3′-UTR and
either control (miR-NC) or miR-324-5p mimics. (F) Western blotting
and RT-qPCR of KCTD20 expression in U251 and LN229 cells
transfected with Anti-Ctrl, miR-324-5p inhibitor, miR-NC or
miR-324-5p mimics. (G) Western blotting and RT-qPCR analysis of
KCTD20 expression in U251 and LN229 cells transfected with siCtrl
or siNEAT1. (H) Western blotting and RT-qPCR analysis of KCTD20
expression in U251 and LN229 cells transfected with siCtrl or
siNEAT1 with or without an miR-324-5p inhibitor. (I) Spearman's
rank correlation analysis of the association between NEAT1 and
KCTD20 mRNA expression in 43 glioma tissues. The experiments were
performed in triplicate and data are presented as the mean ± SD.
*P<0.05, **P<0.01 and ***P<0.001 vs. Anti-Ctrl, miR-NC,
siCtrl or as indicated. Anti-Ctrl, control sequence; ELAVL1, ELAV
like RNA binding protein 1; KCTD20, potassium channel
tetramerization protein domain containing 20; KLF3, Kruppel like
factor 3; miR, microRNA; MUT, mutant; NC, negative control; NEAT1,
nuclear paraspeckle assembly transcript 1; NIPBL, NIPBL cohesin
loading factor; RT-qPCR, reverse transcription quantitative
polymerase chain reaction; siCtrl, control siRNA; siNEAT1,
NEAT1-specific siRNA; siRNA, small interfering RNA; 3′UTR, 3′
untranslated region; WT, wild-type; ZFX, zinc finger protein
X-linked. |
To verify that KCTD20 mRNA was directly regulated by
miR-324-5p in glioma cells, a luciferase reporter assay was
performed in cells expressing plasmids with the WT 3′-UTR of KCTD20
or MUT 3′-UTR carrying mutations in the putative binding site for
miR-324-5p (Fig. 6D). Co-transfection
with miR-324-5p mimics significantly repressed luciferase activity
in U251 and LN229 cells expressing the WT, but not the MUT, KCTD20
3′-UTR (Fig. 6E). Furthermore, KCTD20
protein and mRNA expression was increased following the
transfection of glioma cells with the miR-324-5p inhibitor and
suppressed by their transfection with miR-324-5p mimics (Fig. 6F). These data demonstrated that
miR-324-5p functionally regulated KCTD20 expression in glioma cells
and suggested that KCTD20 expression may therefore be regulated by
changes in NEAT1 levels. To test this, KCTD20 expression was
examined by western blotting and RT-qPCR in cells transfected with
siNEAT1 or a control sequence. Notably, KCTD20 expression was
markedly reduced following NEAT1 knockdown (Fig. 6G). However, co-silencing of miR-324-5p
abolished the inhibitory effects of siNEAT1 on KCTD20 mRNA and
protein expression (Fig. 6H). IHC
staining revealed reduced KCTD20 expression in tumor sections from
mice injected with shNEAT1-expressing glioma cells compared with in
mice injected with control cells (Fig.
S2D). Finally, a significant positive correlation was
identified between the mRNA expression levels of NEAT1 and KCTD20
in the glioma specimens (Fig. 6I).
Since NEAT1 could sponge miR-324-5p, the present study next
determined whether NEAT1 could regulate KCTD20 expression by
binding to the same site in miR-204-5p. Luciferase reporter assays
demonstrated that miR-324-5p could bind to NEAT1 and the 3′ UTR of
KCTD20. To determine whether miR-324-5p served a role in the
relationship between NEAT1 and KCTD20, cells were co-transfected
with siNEAT1 and the miR-324-5p inhibitor. Knockdown of NEAT1 also
significantly reduced KCTD20 mRNA and protein expression in U251
and LN229 cells (Fig. 6G).
Additionally, the downregulation of KCTD20 protein expression
induced by siNEAT1 was effectively reversed by the miR-324-5p
inhibitor. The experimental results also showed that changes in the
expression of NEAT1 could affect the expression levels of
miR-324-5p; however, changes in the expression levels of miR-324-5p
had no effect on NEAT1 (Fig. S1B).
The expression levels of NEAT1 and KCTD20 in clinical tissues were
positively associated (Fig. 6I),
consistent with the existence of a NEAT1-miR-324-5p-KCTD20
regulatory axis. In combination, these data suggested that NEAT1
regulated the expression levels of KCTD20 in glioma cells by
post-transcriptional modulation of miR-324-5p.
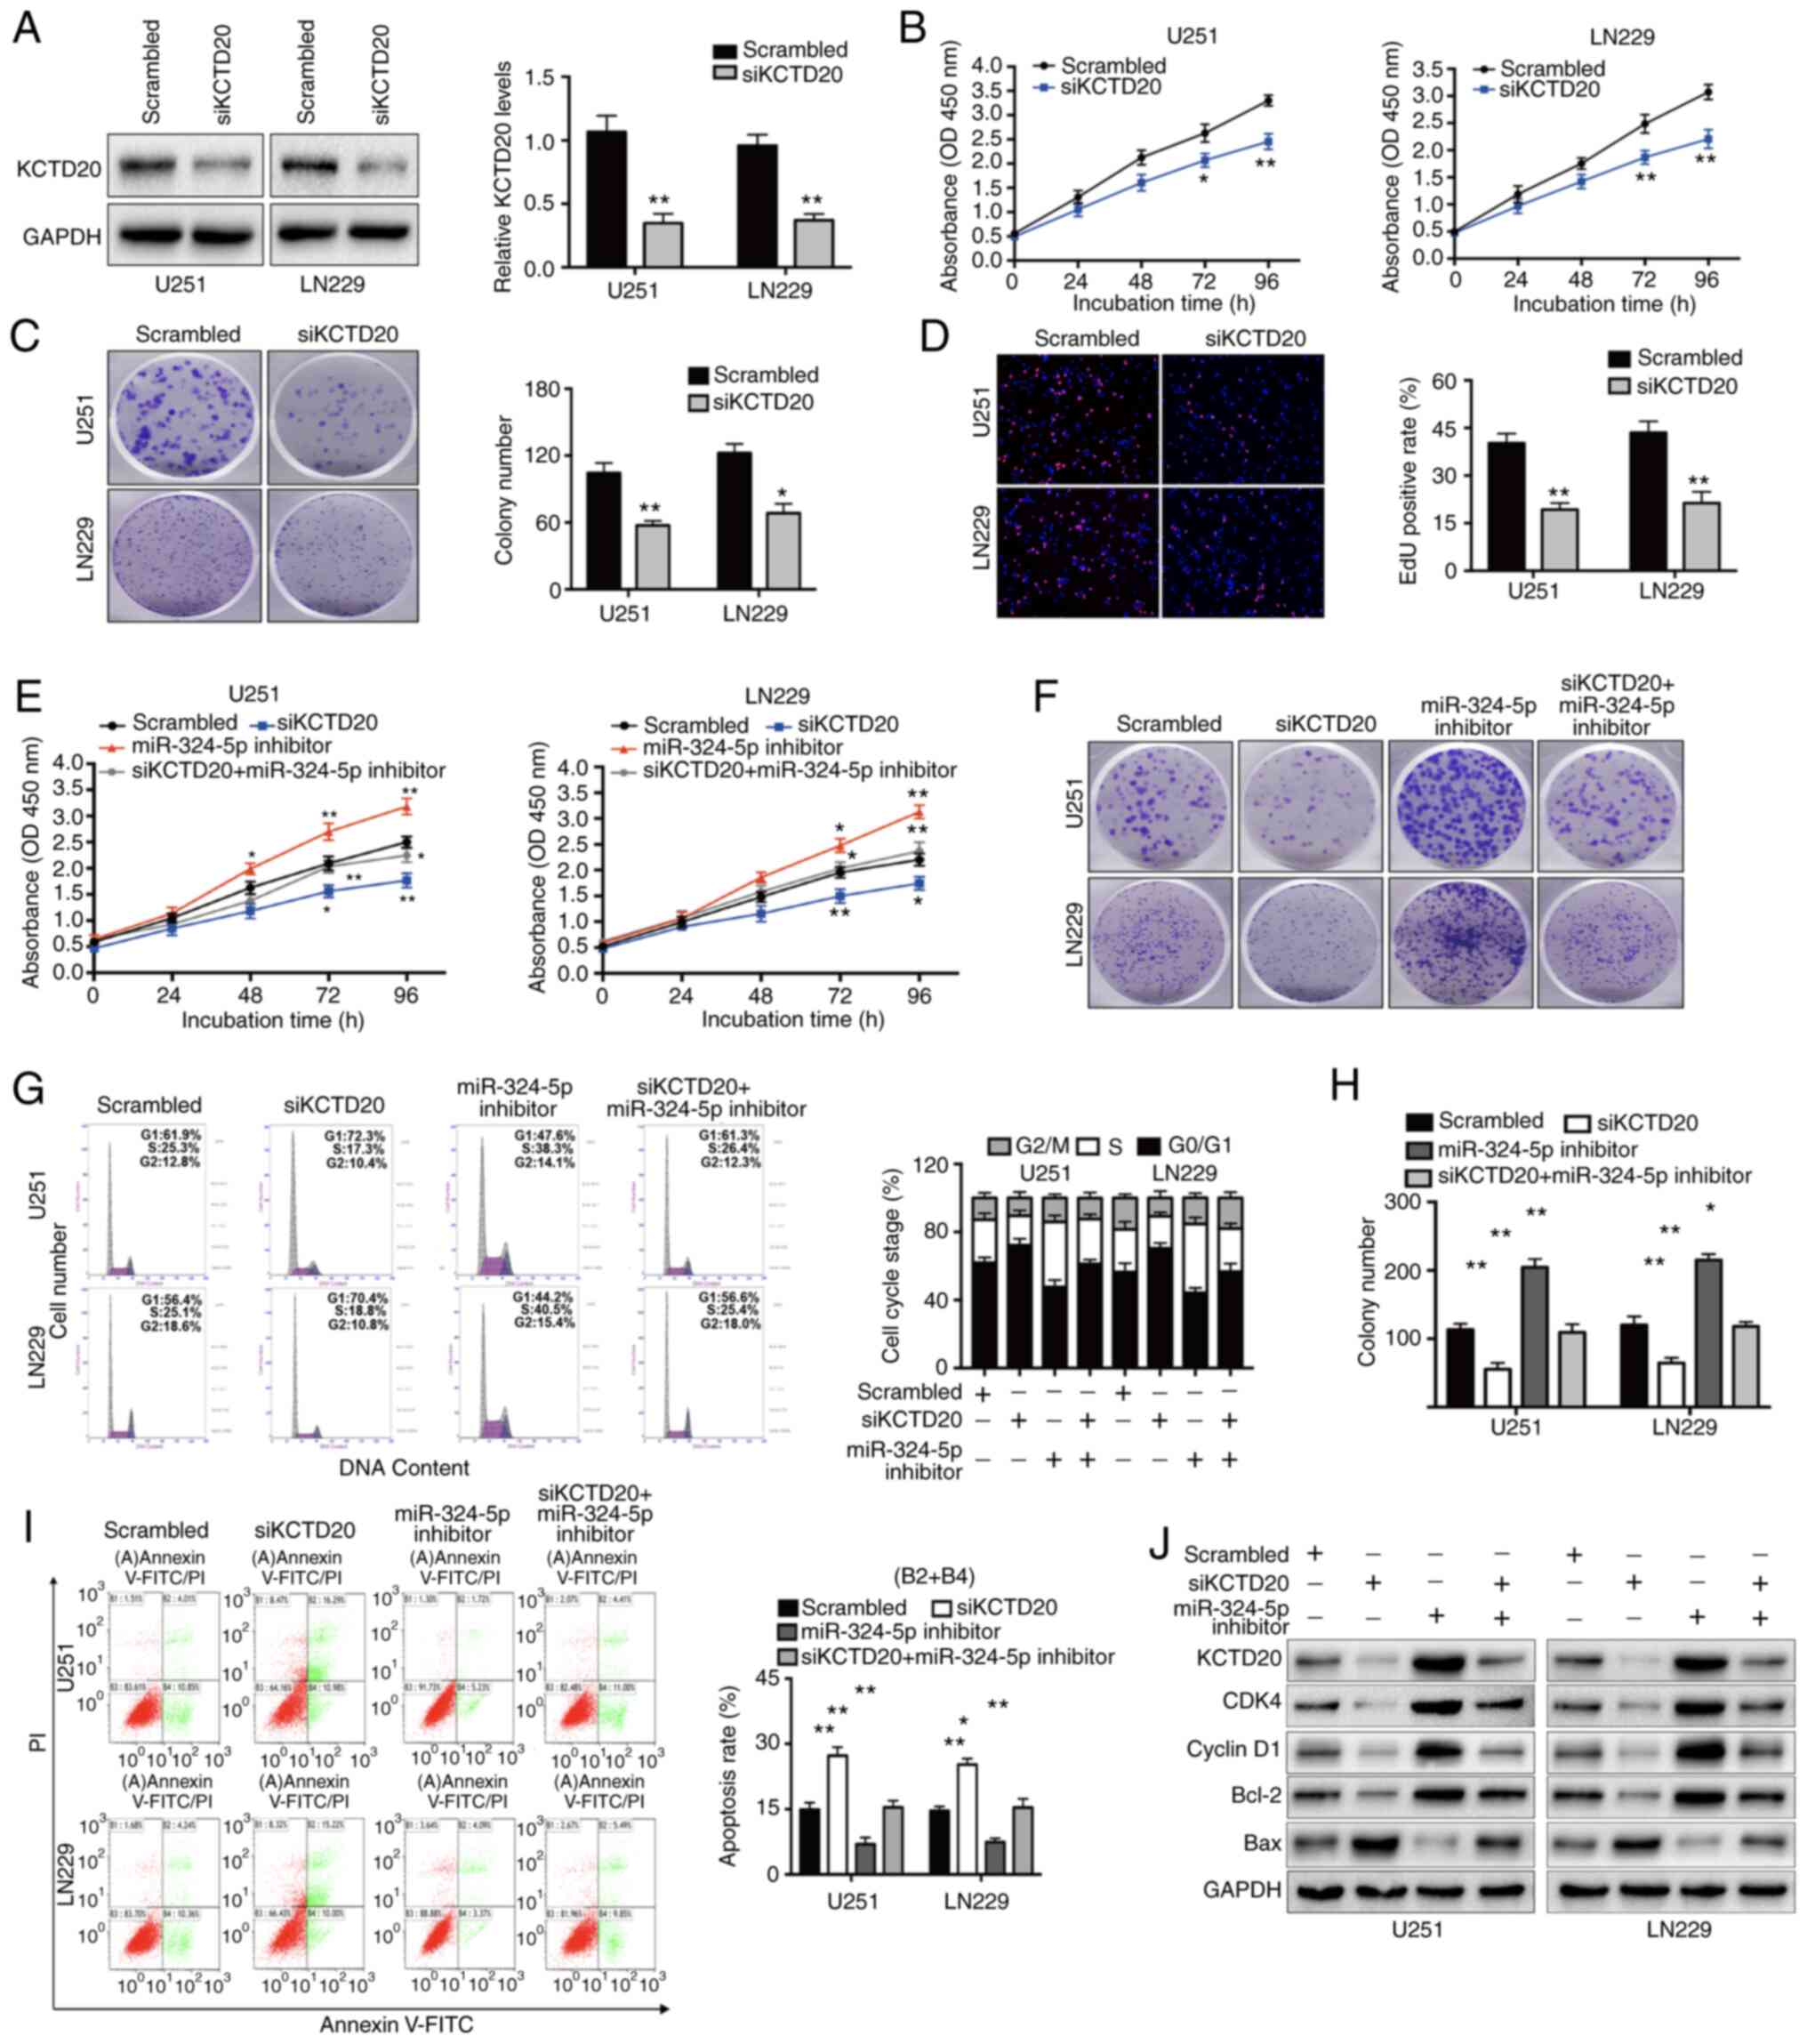
KCTD20 mediates the effects of NEAT1
on glioma cell proliferation in vitro and in vivo
Subsequently, it was determined whether the
functional effects of NEAT1 and miR-324-5p on glioma cell biology
were mediated through their control of KCTD20 expression.
Transfection of U251 and LN229 cells with siKCTD20 effectively
decreased KCTD20 mRNA and protein expression compared with that in
control cells (Fig. 7A). Notably, the
silencing of KCTD20 significantly inhibited U251 and LN229
proliferation, based on the results of CCK-8, colony formation and
EdU incorporation assays (Fig. 7B-D),
Furthermore, the results demonstrated that more cells were in the
G0/G1 phase and fewer cells were in S phase
of the cell cycle after cells were transfected with siKCTD20
(Fig. S3A), Depletion of KCTD20
significantly increased the efficiency of apoptosis (Fig. S3B). Similarly, the protein expression
levels of cyclin D1, CDK4 and Bcl-2 were downregulated, while the
expression levels of Bax protein were upregulated (Fig. S3C). These results were consistent
with the observed effects of knockdown of NEAT1 or overexpression
of miR-324-5p on glioma cell functions.
 | Figure 7.Inhibition of glioma cell
proliferation and induction of cell cycle arrest and apoptosis
in vitro by knockdown of KCTD20. (A) Western blotting and
Reverse transcription-quantitative PCR analysis of KCTD20
expression in U251 and LN229 cells transfected with a scrambled
control sequence or siKCTD20. (B) Cell Counting Kit-8 proliferation
assay, (C) colony formation assay (magnification, ×40) and (D) EdU
(magnification ×200) staining of U251 and LN229 cells transfected
with a scrambled sequence or siKCTD20. (E-H) Rescue of
siKCTD20-induced inhibition of (E) cell proliferation, (F and H)
cell colony formation (magnification, ×40), (G) cell cycle
progression and (I) apoptosis in U251 and LN229 cells by
co-transfection with an miR-324-5p inhibitor. (J) Western blot
analysis of the expression levels of KCTD20, cell cycle proteins
(CDK4 and cyclin D1), apoptosis-related proteins (Bcl-2 and Bax)
and GAPDH in U251 and LN229 cells transfected as described for (G
and H) The experiments were performed in triplicate and data are
presented as the mean ± SD. *P<0.05 and **P<0.01 vs.
scrambled or as indicated. EdU, ethynyldeoxyuridine; KCTD20,
potassium channel tetramerization protein domain containing 20;
miR, microRNA; OD, optical density; siKCTD20, KCTD20-targeting
small interfering RNA. |
The findings were verified by examining the effects
of KCTD20 knockdown or concomitant KCTD20 and miR-324-5p knockdown
on glioma cell biology. First, U251 cells stably expressing
luciferase and either shKCTD20 or control shNC (n=6 for each group)
were intracerebrally injected into nude mice, and the mice were
followed up by imaging examinations for up to 28 days. Consistent
with the results of the in vitro assays, silencing of KCTD20
markedly inhibited glioma growth and significantly improved the
survival time of tumor-bearing mice (Fig. S3D and E). As presented in Fig. S3F, immunoblot analysis indicated that
KCTD20 expression was downregulated in shKCTD20-inoculated tumor
tissues. In addition, transfection of miR-324-5p inhibitor in
addition to knockdown of KCTD20 in glioma cell lines partially
reversed the effects of KCTD20 knockdown (Figs. 7E, F and H and S3G and H), demonstrating the functional
relationship between miR-324-5p and KCTD20. Furthermore, the
concomitant knockdown of miR-324-5p and KCTD20 in U251 and LN229
cells abrogated the effects of knockdown of KCTD20 on cell cycle
arrest (Fig. 7G), apoptosis (Fig. 7I), and CDK4, cyclin D1, Bcl-2 and Bax
expression (Fig. 7J). Finally, a
statistically significant inverse correlation was detected between
the expression levels of miR-324-5p and KCTD20 in the clinical
glioma tissues (r=−0.4582; P=0.002; Fig.
S3I). In combination, the data presented in the current study
provided substantial evidence that NEAT1 is oncogenic in glioma
cells and exerts its effects through the modulation of
miR-324-5p-regulated KCTD20 expression.
Discussion
In the last several decades, intense efforts have
been made to identify lncRNAs and to elucidate their roles in the
development and progression of several human diseases, including
cancer (41–43). The roles of lncRNAs as important
regulatory factors in cellular processes through their effects on
gene expression via epigenetic, transcriptional and
post-transcriptional mechanisms (44). Although numerous lncRNAs have been
annotated (45), research remains in
the early stages of interpreting their functions. In total, ~18% of
human lncRNAs are considered to be involved in cancer compared with
only ~9% of protein-coding genes (46). Therefore, a systematic study of the
molecular mechanisms through which lncRNAs contribute to glioma
development and progression will increase the understanding of the
disease. In addition, such knowledge may have important
implications for improving the early diagnosis, treatment and
prognosis of patients with glioma.
NEAT1 expression has been reported to be upregulated
in a variety of tumors, and has been proposed as a potential
therapeutic target in cancer (47).
NEAT1 is regarded as an oncogene in breast cancer, and its
downregulation suppresses tumor cell proliferation (48). The results of the present study
suggested that NEAT1 may have similarly cancer-promoting effects in
glioma. NEAT1 expression was revealed to be upregulated in glioma
specimens and cell lines, and to modulate glioma cell
proliferation, cell cycle progression and apoptosis by acting as a
competitive inhibitor of miR-324-5p binding to KCTD20 mRNA.
Additionally, these results were confirmed in vivo using a
mouse xenograft model of glioma. Therefore, the present study
indicated not only that NEAT1 expression in the tissue may serve as
a useful predictor of poor prognosis in glioma, but also that the
NEAT1-miR-324-5p-KCTD20 axis may be a potential therapeutic target
for the development of novel treatments.
A growing number of studies have suggested that
lncRNAs can bind directly to miRNAs, thereby competitively
inhibiting sequence-specific interactions with mRNA targets
(49,50). In cancer, the lncRNA-mediated sponging
of miRNAs could block the tumor suppressor role of specific miRNAs
by re-enabling the expression of oncogenic mRNAs. For example, the
lncRNA PSMA3 antisense RNA 1 has been demonstrated to promote
esophageal cancer cell progression by negatively modulating miR-101
function and thus increasing the expression levels of the
proto-oncogene EZH2, a miR-101 target (51). lncRNA urothelial cancer associated 1
functions as an endogenous sponge of miR-182-5p to positively
regulate the expression levels of δ-like ligand 4 in renal cancer
cells (52). Similarly, NEAT1 has
been demonstrated to serve a regulatory role in a variety of cancer
types through competitive binding with different miRNAs (53,54). For
example, lncRNA NEAT1 regulates NSCLC cell proliferation, migration
and invasion by sponging miR-153-3p (53). In addition, lncRNA NEAT1 affects tumor
progression by regulating the miR-296-5p/CNN2 axis in
hepatocellular carcinoma cells (54).
The results of the present study shed light on a similar
lncRNA-miRNA-mRNA regulatory mechanism through which NEAT1 promotes
glioma cell proliferation. By using a combination of bioinformatics
tools, glioma datasets, and in vitro and in vivo
assays with glioma cell lines, it was demonstrated that NEAT1 may
directly bind to miR-324-5p to exert its regulatory role. These
results suggested that miR-324-5p may normally serve an inhibitory
role in NHAs, and that its aberrantly low expression in glioma
cells may contribute to tumor progression. Since the effects of
NEAT1 overexpression were similar to those of miR-324-5p
inhibition, it was suggested that NEAT1 may regulate glioma cell
proliferation by controlling miR-324-5p expression. In the present
study, using glioma cells, the ability of NEAT1 to
post-transcriptionally regulate KCTD20 mRNA by acting as a ceRNA
for miR-324-5p was demonstrated.
The KCTD protein family consists of 25 members
[KCTD1-21, SH3KBP1 binding protein 1, BTB domain containing 10
(BTBD10), TNFα induced protein 1 and potassium channel regulator],
which serve a key role in basic physiological and pathological
processes (55,56). The KCTD family of proteins have been
reported to be involved in a variety of regulatory processes,
including γ-aminobutyric acid type B signaling, proteasome
processes, potassium transport and regulation of transcription
response (57). Previous studies have
demonstrated that these proteins are closely associated with the
progression of cancer, including acute myeloid leukemia (58), breast cancer (59) and medulloblastoma (60).
KCTD20, encoded on chromosome 6, is an isoform of
BTBD10 and harbors a C-terminal amino acid sequence similar to that
of BTBD10 (61). A recent study
demonstrated that KCTD20 is part of a powerful gene network
(including the RhoA pathway), involving ubiquitin-related
proteasome pathways, protein synthesis/transport and mitotic cell
cycle (62). However, to the best of
our knowledge, the role of KCTD20 in the development and
progression of other types of cancer remains unclear. Consistent
with a previous report on KCTD20 in NSCLC, the present study
demonstrated that KCTD20 expression was upregulated in glioma
tissues compared with in normal tissues (63). The present study demonstrated that
miR-324-5p may bind directly to the KCTD20 3′-UTR to regulate its
expression. Notably, it was demonstrated that knockdown of KCTD20
in a mouse model of glioma not only reduced tumor growth but also
extended mouse survival. In addition, miR-324-5p expression in
glioma specimens was inversely correlated with the expression
levels of both NEAT1 and KCTD20, while NEAT1 expression was
positively correlated with KCTD20 expression. These findings
revealed a novel mechanism of the regulation of glioma cell
proliferation via the NEAT1-miR-324-5p-KCTD20 axis. The current
experimental data revealed that KCTD20 is a novel type of important
participant in the growth of glioma, and its downregulation can
inhibit cell proliferation in vivo and in vitro. The
NEAT1/miR-324-5p/KCTD20 axis may be involved in signal transduction
or protein degradation mechanisms, which need to be defined in
future studies.
In conclusion, the results of the present study
provided mechanistic insights into the function of the lncRNA NEAT1
and demonstrated that it could act as a molecular sponge for
miR-324-5p, thereby increasing KCTD20 expression and promoting the
proliferation of glioma cells in vitro and in vivo.
These findings suggested that NEAT1 may serve as a prognostic
marker for patients with glioma, and that the
NEAT1-miR-324-5p-KCTD20 regulatory axis could be a potential
therapeutic target for the development of novel glioma
treatments.
Supplementary Material
Supporting Data
Acknowledgements
Not applicable.
Funding
The present study was supported by the Natural
Science Foundation of China (grant no. 81627806) and the Six Talent
Peaks Project in Jiangsu Province [grant no. 2015-WSN-023
(IB15)].
Availability of data and materials
The datasets used and/or analyzed during the current
study are available from the corresponding author on reasonable
request.
Authors' contributions
JZ and YaL performed data analyses and wrote the
initial manuscript. JZ, YaL, YuL and GX performed the cell and
animal experiments. YH performed the bioinformatics analysis. XL
contributed clinical information and samples. JZ, XL and WL
designed the study and revised the manuscript. XL and WL confirm
the authenticity of all the raw data. All authors read and approved
the final manuscript.
Ethics approval and consent to
participate
The present study was approved by the Institutional
Review Board and Ethics Committee of the Nanjing Medical University
(Nanjing, China) and Fourth Military Medical University (Xi'an,
China). All experiments were performed in accordance with the
principles of the Declaration of Helsinki and written informed
consent was obtained from all patients. All animal experiments were
approved by the Animal Management Rule of the Chinese Ministry of
Health (document 55, 2001) and were conducted in accordance with
the approved guidelines and experimental protocols of the Fourth
Military Medical University (Xi'an, China).
Patient consent for publication
Not applicable.
Competing interests
The authors declare that they have no competing
interests.
References
|
1
|
Ricard D, Idbaih A, Ducray F, Lahutte M,
Hoang-Xuan K and Delattre JY: Primary brain tumours in adults.
Lancet. 379:1984–1996. 2012. View Article : Google Scholar : PubMed/NCBI
|
|
2
|
Weller M, Cloughesy T, Perry JR and Wick
W: Standards of care for treatment of recurrent glioblastoma-are we
there yet? Neuro Oncol. 15:4–27. 2013. View Article : Google Scholar : PubMed/NCBI
|
|
3
|
Wang J, Su HK, Zhao HF, Chen ZP and To SS:
Progress in the application of molecular biomarkers in gliomas.
Biochem Biophys Res Commun. 465:1–4. 2015. View Article : Google Scholar : PubMed/NCBI
|
|
4
|
Stupp R, Mason WP, van den Bent MJ, Weller
M, Fisher B, Taphoorn MJ, Belanger K, Brandes AA, Marosi C, Bogdahn
U, et al: Radiotherapy plus concomitant and adjuvant temozolomide
for glioblastoma. N Engl J Med. 352:987–996. 2005. View Article : Google Scholar : PubMed/NCBI
|
|
5
|
Shi X, Sun M, Liu H, Yao Y and Song Y:
Long non-coding RNAs: A new frontier in the study of human
diseases. Cancer Lett. 339:159–166. 2013. View Article : Google Scholar : PubMed/NCBI
|
|
6
|
Ponting CP, Oliver PL and Reik W:
Evolution and functions of long noncoding RNAs. Cell. 136:629–641.
2009. View Article : Google Scholar : PubMed/NCBI
|
|
7
|
Sheik Mohamed J, Gaughwin PM, Lim B,
Robson P and Lipovich L: Conserved long noncoding RNAs
transcriptionally regulated by Oct4 and Nanog modulate pluripotency
in mouse embryonic stem cells. RNA. 16:324–337. 2010. View Article : Google Scholar : PubMed/NCBI
|
|
8
|
Yang L, Froberg JE and Lee JT: Long
noncoding RNAs: Fresh perspectives into the RNA world. Trends
Biochem Sci. 39:35–43. 2014. View Article : Google Scholar : PubMed/NCBI
|
|
9
|
Guttman M, Donaghey J, Carey BW, Garber M,
Grenier JK, Munson G, Young G, Lucas AB, Ach R, Bruhn L, et al:
lincRNAs act in the circuitry controlling pluripotency and
differentiation. Nature. 477:295–300. 2011. View Article : Google Scholar : PubMed/NCBI
|
|
10
|
Cai B, Zheng Y, Ma S, Xing Q, Wang X, Yang
B, Yin G and Guan F: Long non-coding RNA regulates hair follicle
stem cell proliferation and differentiation through PI3K/AKT signal
pathway. Mol Med Rep. 17:5477–5483. 2018.PubMed/NCBI
|
|
11
|
Zheng W and Yu A: EZH2-mediated
suppression of lncRNA-LET promotes cell apoptosis and inhibits the
proliferation of post-burn skin fibroblasts. Int J Mol Med.
41:1949–1957. 2018.PubMed/NCBI
|
|
12
|
Zheng P, Yin Z, Wu Y, Xu Y, Luo Y and
Zhang TC: LncRNA HOTAIR promotes cell migration and invasion by
regulating MKL1 via inhibition miR206 expression in HeLa cells.
Cell Commun Signal. 16:52018. View Article : Google Scholar : PubMed/NCBI
|
|
13
|
Bueno MJ, Perez de Castro I and Malumbres
M: Control of cell proliferation pathways by microRNAs. Cell cycle.
7:3143–3148. 2008. View Article : Google Scholar : PubMed/NCBI
|
|
14
|
Cesana M, Cacchiarelli D, Legnini I,
Santini T, Sthandier O, Chinappi M, Tramontano A and Bozzoni I: A
long noncoding RNA controls muscle differentiation by functioning
as a competing endogenous RNA. Cell. 147:358–369. 2011. View Article : Google Scholar : PubMed/NCBI
|
|
15
|
Tsai MC, Manor O, Wan Y, Mosammaparast N,
Wang JK, Lan F, Shi Y, Segal E and Chang HY: Long noncoding RNA as
modular scaffold of histone modification complexes. Science.
329:689–693. 2010. View Article : Google Scholar : PubMed/NCBI
|
|
16
|
Cech TR and Steitz JA: The noncoding RNA
revolution-trashing old rules to forge new ones. Cell. 157:77–94.
2014. View Article : Google Scholar : PubMed/NCBI
|
|
17
|
Salmena L, Poliseno L, Tay Y, Kats L and
Pandolfi PP: A ceRNA hypothesis: The Rosetta Stone of a hidden RNA
language? Cell. 146:353–358. 2011. View Article : Google Scholar : PubMed/NCBI
|
|
18
|
Zhang G, Li S, Lu J, Ge Y, Wang Q, Ma G,
Zhao Q, Wu D, Gong W, Du M, et al: LncRNA MT1JP functions as a
ceRNA in regulating FBXW7 through competitively binding to
miR-92a-3p in gastric cancer. Mol cancer. 17:872018. View Article : Google Scholar : PubMed/NCBI
|
|
19
|
Zhao L, Zhou Y, Zhao Y, Li Q, Zhou J and
Mao Y: Long non-coding RNA TUSC8 inhibits breast cancer growth and
metastasis via miR-190b-5p/MYLIP axis. Aging (Albany NY).
12:2974–2991. 2020. View Article : Google Scholar : PubMed/NCBI
|
|
20
|
Chen Y, Cheng W, Shi H, Huang S, Chen H,
Liu D, Xu W, Yu J and Wang J: Classifying gastric cancer using
FLORA reveals clinically relevant molecular subtypes and highlights
LINC01614 as a biomarker for patient prognosis. Oncogene.
40:2898–2909. 2021. View Article : Google Scholar : PubMed/NCBI
|
|
21
|
Zhang Z, Chen F, Zhan H, Chen L, Deng Q,
Xiong T, Li Y and Ye J: lncRNA CASC9 sponges miR-758-3p to promote
proliferation and EMT in bladder cancer by upregulating TGF-β2.
Oncol Rep. 45:265–277. 2021. View Article : Google Scholar : PubMed/NCBI
|
|
22
|
Clemson CM, Hutchinson JN, Sara SA,
Ensminger AW, Fox AH, Chess A and Lawrence JB: An architectural
role for a nuclear noncoding RNA: NEAT1 RNA is essential for the
structure of paraspeckles. Mol Cell. 33:717–726. 2009. View Article : Google Scholar : PubMed/NCBI
|
|
23
|
Chakravarty D, Sboner A, Nair SS,
Giannopoulou E, Li R, Hennig S, Mosquera JM, Pauwels J, Park K,
Kossai M, et al: The oestrogen receptor alpha-regulated lncRNA
NEAT1 is a critical modulator of prostate cancer. Nat Commun.
5:53832014. View Article : Google Scholar : PubMed/NCBI
|
|
24
|
Dong P, Xiong Y, Yue J, Xu D, Ihira K,
Konno Y, Kobayashi N, Todo Y and Watari H: Long noncoding RNA NEAT1
drives aggressive endometrial cancer progression via
miR-361-regulated networks involving STAT3 and tumor
microenvironment-related genes. J Exp Clin Cancer Res. 38:2952019.
View Article : Google Scholar : PubMed/NCBI
|
|
25
|
Dong P, Xiong Y, Yue J, Hanley SJB,
Kobayashi N, Todo Y and Watari H: Long Non-coding RNA NEAT1: A
novel target for diagnosis and therapy in human tumors. Front
Genet. 9:4712018. View Article : Google Scholar : PubMed/NCBI
|
|
26
|
Kong X, Zhao Y, Li X, Tao Z, Hou M and Ma
H: Overexpression of HIF-2α-Dependent NEAT1 promotes the
progression of non-small cell lung cancer through
miR-101-3p/SOX9/Wnt/β-catenin signal pathway. Cell Physiol Biochem.
52:368–381. 2019. View Article : Google Scholar : PubMed/NCBI
|
|
27
|
Huang B, Liu C, Wu Q, Zhang J, Min Q,
Sheng T, Wang X and Zou Y: Long non-coding RNA NEAT1 facilitates
pancreatic cancer progression through negative modulation of
miR-506-3p. Biochem Biophys Res Commun. 482:828–834. 2017.
View Article : Google Scholar : PubMed/NCBI
|
|
28
|
Louis DN, Ohgaki H, Wiestler OD, Cavenee
WK, Burger PC, Jouvet A, Scheithauer BW and Kleihues P: The 2007
WHO classification of tumours of the central nervous system. Acta
Neuropathol. 114:97–109. 2007. View Article : Google Scholar : PubMed/NCBI
|
|
29
|
Livak KJ and Schmittgen TD: Analysis of
relative gene expression data using real-time quantitative PCR and
the 2(-Delta Delta C(T)) Method. Methods. 25:402–408. 2001.
View Article : Google Scholar : PubMed/NCBI
|
|
30
|
Peng C, Chen Z, Wang S, Wang HW, Qiu W,
Zhao L, Xu R, Luo H, Chen Y, Chen D, et al: The error-prone DNA
polymerase κ promotes temozolomide resistance in glioblastoma
through Rad17-dependent activation of ATR-Chk1 signaling. Cancer
Res. 76:2340–2353. 2016. View Article : Google Scholar : PubMed/NCBI
|
|
31
|
Zhang R, Luo H, Wang S, Chen W, Chen Z,
Wang HW, Chen Y, Yang J, Zhang X, Wu W, et al: MicroRNA-377
inhibited proliferation and invasion of human glioblastoma cells by
directly targeting specificity protein 1. Neuro Oncol.
16:1510–1522. 2014. View Article : Google Scholar : PubMed/NCBI
|
|
32
|
http://www.beijing.gov.cn/zhengce/zhengcefagui/qtwj/201912/t20191219_1304752.html
|
|
33
|
Cooper LA, Demicco EG, Saltz JH, Powell
RT, Rao A and Lazar AJ: PanCancer insights from The Cancer Genome
Atlas: The pathologist's perspective. J Pathol. 244:512–524. 2018.
View Article : Google Scholar : PubMed/NCBI
|
|
34
|
Wang Z, Jensen MA and Zenklusen JC: A
practical guide to The Cancer Genome Atlas (TCGA). Methods Mol
Biol. 1418:111–141. 2016. View Article : Google Scholar : PubMed/NCBI
|
|
35
|
Walker C, Baborie A, Crooks D, Wilkins S
and Jenkinson MD: Biology, genetics and imaging of glial cell
tumours. Br J Radiol. 84:Spec No 2(Spec Iss 2). S90–106. 2011.
View Article : Google Scholar : PubMed/NCBI
|
|
36
|
Yan W, Zhang W, You G, Zhang J, Han L, Bao
Z, Wang Y, Liu Y, Jiang C, Kang C, et al: Molecular classification
of gliomas based on whole genome gene expression: A systematic
report of 225 samples from the Chinese Glioma Cooperative Group.
Neuro Oncol. 14:1432–1440. 2012. View Article : Google Scholar : PubMed/NCBI
|
|
37
|
Gravendeel LA, Kouwenhoven MC, Gevaert O,
de Rooi JJ, Stubbs AP, Duijm JE, Daemen A, Bleeker FE, Bralten LB,
Kloosterhof NK, et al: Intrinsic gene expression profiles of
gliomas are a better predictor of survival than histology. Cancer
Res. 69:9065–9072. 2009. View Article : Google Scholar : PubMed/NCBI
|
|
38
|
Miao YR, Liu W, Zhang Q and Guo AY:
lncRNASNP2: An updated database of functional SNPs and mutations in
human and mouse lncRNAs. Nucleic acids Res. 46:D276–D280. 2018.
View Article : Google Scholar : PubMed/NCBI
|
|
39
|
Chen Y and Wang X: MiRDB: An online
database for prediction of functional microRNA targets. Nucleic
Acids Res. 48(D1): D127–D131. 2020. View Article : Google Scholar : PubMed/NCBI
|
|
40
|
Shade A and Handelsman J: Beyond the Venn
diagram: The hunt for a core microbiome. Environ Microbiol.
14:4–12. 2012. View Article : Google Scholar : PubMed/NCBI
|
|
41
|
Gutschner T and Diederichs S: The
hallmarks of cancer: A long non-coding RNA point of view. RNA Biol.
9:703–719. 2012. View Article : Google Scholar : PubMed/NCBI
|
|
42
|
Gibb EA, Brown CJ and Lam WL: The
functional role of long non-coding RNA in human carcinomas. Mol
Cancer. 10:382011. View Article : Google Scholar : PubMed/NCBI
|
|
43
|
Feng Y, Hu X, Zhang Y, Zhang D, Li C and
Zhang L: Methods for the study of long noncoding RNA in cancer cell
signaling. Methods Mol Biol. 1165:115–143. 2014. View Article : Google Scholar : PubMed/NCBI
|
|
44
|
Rinn JL and Chang HY: Genome regulation by
long noncoding RNAs. Annu Rev Biochem. 81:145–166. 2012. View Article : Google Scholar : PubMed/NCBI
|
|
45
|
Xie C, Yuan J, Li H, Li M, Zhao G, Bu D,
Zhu W, Wu W, Chen R and Zhao Y: NONCODEv4: Exploring the world of
long non-coding RNA genes. Nucleic acids Res. 42((Database issue)):
D98–D103. 2014. View Article : Google Scholar : PubMed/NCBI
|
|
46
|
Khachane AN and Harrison PM: Mining
mammalian transcript data for functional long non-coding RNAs. PLoS
One. 5:e103162010. View Article : Google Scholar : PubMed/NCBI
|
|
47
|
Yu X, Li Z, Zheng H, Chan MT and Wu WK:
NEAT1: A novel cancer-related long non-coding RNA. Cell Prolif.
50:e123292017. View Article : Google Scholar : PubMed/NCBI
|
|
48
|
Shin VY, Chen J, Cheuk IW, Siu MT, Ho CW,
Wang X, Jin H and Kwong A: Long non-coding RNA NEAT1 confers
oncogenic role in triple-negative breast cancer through modulating
chemoresistance and cancer stemness. Cell Death Dis. 10:2702019.
View Article : Google Scholar : PubMed/NCBI
|
|
49
|
Yang C, Wu D, Gao L, Liu X, Jin Y, Wang D,
Wang T and Li X: Competing endogenous RNA networks in human cancer:
Hypothesis, validation, and perspectives. Oncotarget.
7:13479–13490. 2016. View Article : Google Scholar : PubMed/NCBI
|
|
50
|
Jalali S, Bhartiya D, Lalwani MK,
Sivasubbu S and Scaria V: Systematic transcriptome wide analysis of
lncRNA-miRNA interactions. PLoS One. 8:e538232013. View Article : Google Scholar : PubMed/NCBI
|
|
51
|
Qiu BQ, Lin XH, Ye XD, Huang W, Pei X,
Xiong D, Long X, Zhu SQ, Lu F, Lin K, et al: Long non-coding RNA
PSMA3-AS1 promotes malignant phenotypes of esophageal cancer by
modulating the miR-101/EZH2 axis as a ceRNA. Aging (Albany NY).
12:1843–1856. 2020. View Article : Google Scholar : PubMed/NCBI
|
|
52
|
Wang W, Hu W, Wang Y, An Y, Song L, Shang
P and Yue Z: Long non-coding RNA UCA1 promotes malignant phenotypes
of renal cancer cells by modulating the miR-182-5p/DLL4 axis as a
ceRNA. Mol Cancer. 19:182020. View Article : Google Scholar : PubMed/NCBI
|
|
53
|
Zhao L, Bi M, Zhang H and Shi M:
Downregulation of NEAT1 suppresses cell proliferation, migration,
and invasion in NSCLC Via Sponging miR-153-3p. Cancer Biother
Radiopharm. 35:362–370. 2020. View Article : Google Scholar : PubMed/NCBI
|
|
54
|
Li Y, Ding X, Xiu S, Du G and Liu Y:
lncRNA NEAT1 promotes proliferation, migration and invasion via
regulating miR-296-5p/CNN2 axis in hepatocellular carcinoma cells.
OncoTargets Ther. 12:9887–9897. 2019. View Article : Google Scholar : PubMed/NCBI
|
|
55
|
Teng X, Aouacheria A, Lionnard L, Metz KA,
Soane L, Kamiya A and Hardwick JM: KCTD: A new gene family involved
in neurodevelopmental and neuropsychiatric disorders. CNS Neurosci
Ther. 25:887–902. 2019. View Article : Google Scholar : PubMed/NCBI
|
|
56
|
Liu Z, Xiang Y and Sun G: The KCTD family
of proteins: Structure, function, disease relevance. Cell Biosci.
3:452013. View Article : Google Scholar : PubMed/NCBI
|
|
57
|
Skoblov M, Marakhonov A, Marakasova E,
Guskova A, Chandhoke V, Birerdinc A and Baranova A: Protein
partners of KCTD proteins provide insights about their functional
roles in cell differentiation and vertebrate development.
BioEssays. 35:586–596. 2013. View Article : Google Scholar : PubMed/NCBI
|
|
58
|
Smaldone G, Coppola L, Incoronato M,
Parasole R, Ripaldi M, Vitagliano L, Mirabelli P and Salvatore M:
KCTD15 protein expression in peripheral blood and acute myeloid
leukemia. Diagnostics (Basel). 10:3712020. View Article : Google Scholar : PubMed/NCBI
|
|
59
|
Rivas J, Díaz N, Silva I, Morales D,
Lavanderos B, Álvarez A, Saldías MP, Pulgar E, Cruz P, Maureira D,
et al: KCTD5, a novel TRPM4-regulatory protein required for cell
migration as a new predictor for breast cancer prognosis. FASEB J.
34:7847–7865. 2020. View Article : Google Scholar : PubMed/NCBI
|
|
60
|
Canettieri G, Di Marcotullio L, Greco A,
Coni S, Antonucci L, Infante P, Pietrosanti L, De Smaele E,
Ferretti E, Miele E, et al: Histone deacetylase and
Cullin3-REN(KCTD11) ubiquitin ligase interplay regulates Hedgehog
signalling through Gli acetylation. Nat Cell Biol. 12:132–142.
2010. View Article : Google Scholar : PubMed/NCBI
|
|
61
|
Nawa M and Matsuoka M: KCTD20, a relative
of BTBD10, is a positive regulator of Akt. BMC Biochem. 14:272013.
View Article : Google Scholar : PubMed/NCBI
|
|
62
|
Huggett SB and Stallings MC:
Cocaine'omics: Genome-wide and transcriptome-wide analyses provide
biological insight into cocaine use and dependence. Addict Biol.
25:e127192020. View Article : Google Scholar : PubMed/NCBI
|
|
63
|
Zhang X, Zhou H, Cai L, Fan C, Liu Y, Wang
L, Li Q and Miao Y: Kctd20 promotes the development of non-small
cell lung cancer through activating Fak/AKT pathway and predicts
poor overall survival of patients. Mol Carcinog. 56:2058–2065.
2017. View Article : Google Scholar : PubMed/NCBI
|


