Introduction
The main function of PI3K is phosphorylation, triggering a series of intracellular signal transmissions through phosphorylation of several proteins (1). These signals are associated with numerous cellular activities, including cell proliferation, migration, survival, the production of new proteins and help in intracellular material transport (2,3). PI3K is composed of a regulatory subunit (p85) and a catalytic subunit (p110) (4). The phosphatidylinositol-3-kinase catalytic subunit α (PIK3CA) gene encodes the p110 catalytic subunit (5). The PIK3CA mutation is an extensively existing gene mutation in tumors (6). There are three hotspot mutations in this gene (7), with more than 80% of the occurrence of the mutation (8). The three hotspot mutations are located in exon 9, helix region named E542K and E545K, respectively, and in exon 20 kinase region named H1047R (9–11). This pathogenic mutation leads to the encoding of aberrant p110 subunits and the continuous activation of PI3K (12), increasing intracellular signal transduction and leading to uncontrolled cell proliferation and ultimately to the formation of tumors (13).
The Warburg effect and glutamine dependence are essential characteristics of tumor cells that distinguish them from normal cells (14). Tumor cells have a promising proliferation advantage through the Warburg effect (15). Conversely, glutamic acid is metabolized to ketoglutaric acid by glutaminase or transaminase, filling the tricarboxylic acid (TCA) cycle (16). As a result of this phenomenon, the tumor cells need glutamine. In tumor cells, the increase in glutamine metabolism augments the glutamic-pyruvate transaminase 2 (GPT2) gene expression (17). Numerous studies have revealed that after the mutation of the PIK3CA gene in tumor cells, GPT2 expression in the cells was significantly increased (18), leading to a stronger dependence on glutamine in the mutated colorectal cancer (CRC) cells; however, the underlying mechanism remains unclear (19). A previous study reported that GPT2 may be regulated by transcriptional activator 4 (ATF4) (20), and ATF4 is possibly mediated by signal transduction molecules such as p90 ribosome S6 kinase 2 (RSK2) (21), 3-phosphoinositide-dependent kinase-1(PDK1) (22) and serine/threonine-specific protein kinase (AKT) (23) in its upstream. Therefore, the possible effects of PI3K on RSK2, ATF4, and GPT2 through PDK1 and AKT were considered (24). Moreover, it has been reported that PI3K could also trigger signal transduction through mitogen-activated protein kinase (MEK), which is related to the activation of phosphatidylinositol 3/4/5 triphosphate dependent RAC exchanger 1 (P-Rex1) (25). Whether that pathway is related to GPT2 metabolism is worth investigating. Based on the aforementioned insights, an attempt was made to reveal the comprehensive signal transduction pathway of the mutated PI3K affecting GPT2 and the effect of these signal transduction molecules on the proliferation and apoptosis of HCT116 tumor cells.
Materials and methods
Cell culture and experimental animals
HCT116 cells were purchased from the National Collection of Authenticated Cell Cultures of the Chinese Academy of Sciences. HCT116 cells were routinely cultured in RPMI-1640 medium (product code C11875500BT; Gibco; Thermo Fisher Scientific, Inc.) containing 10% fetal bovine serum (FBS; cat no. S711-001S; Lonsera Science Srl), 100 U/ml penicillin and 100 U/ml streptomycin (Beyotime Institute of Biotechnology). Culture medium was changed once every 2–3 days. The cells were cultured in 5% CO2 at 37°C, and the logarithmic growth-phase cells were used for experimental study. To study the effects of glutamine on cells, the cells were cultured overnight in ordinary medium (RPMI-1640 medium; product code C11875500BT; Gibco; Thermo Fisher Scientific, Inc.), then replaced with a culture medium without glutamine in RPMI-1640 medium (Beijing Solarbio Science & Technology Co., Ltd.) for 24 h for follow-up experiments. To study the effects of each inhibitor on cells, normal culture solution was used overnight and then replaced with RPMI-1640 culture solution containing 10, 100 nM, 1 and 10 µM of inhibitors, respectively. The culture solution was incubated for 12 h for subsequent western blot assay, 16 h for subsequent apoptosis detection, or the cell proliferation ability was assessed at 24, 48 and 72 h, respectively. A total of 35 female nude mice (GemPharmatech Co., Ltd.), aged 4–6 weeks and weighing 15–20 g, were raised in an individually ventilated cage (IVC) system without pathogens. The culture environment temperature was 26–28°C, and the relative humidity was 40–60%, with a 12-h light/dark cycle, no pathogens and free access to food and water. The Animal Welfare and Ethics Committee of Wannan Medical College (Wuhu, China) approved the study (approval no. LLSC-2020-139) and the experimental procedures carried out on mice were according to the guidelines for the Care and Use of Experimental Laboratory Animals of Wannan Medical College.
Mutant (MUT) cell construction
According to the PIK3CA gene sequences and synthetic guide (sg)RNA design principles in the sgRNA design website (http://chopchop.Cbu.Uib.No/), a total of 2 sgRNA for knockout of the PIK3CA gene were designed, then constructed in tandem into the lentiCRISPR-v2 vector (Streptococcus pyogenes Cas9 protein coding gene; Shanghai Ruantuo Biotech Co. Ltd. The test used an Applied Biological Materials, Inc. (abm) qPCR Lentivirus Titer kit (cat. no. LV900), to obtain an all in one lentiviral knockout vector expressing Cas9 and double sgRNA (Table I). The aim was to knock out PIK3CA; the knockout targets were exon 1 and exon 3 and the mutation type was a frameshift mutation (Fig. S1). After the vector was successfully constructed, it was packaged into a lentivirus (lentiCRISPR-v2 vector) and the 3rd generation system was used. The interim cell line used was 293T obtained from the National Collection of Authenticated Cell Cultures of the Chinese Academy of Sciences. The quantity of lentiviral plasmid used was 3.7 µg for transfection and the lentiviral plasmid: packaging vector: envelope was 1:1:1. The collection of lentiviral particles was 20 TU with a multiplicity of infection (MOI) of 10, along with the lentivirus packaging plasmid, and the titer was determined after purification. Then, cell transfection and screening were performed. When HCT116 cells grew to the logarithmic phase, they were inoculated into a 6-well cell culture plate at a density of 2.5×10⁵ cells/well. After the cells adhered overnight, the viral volume was added according to the MOI value (MOI=10) to infect cells for 12 h, and then, fresh culture solution was replaced and the culture continued for 24 h. The infected cells were screened with 0.3 µg/ml puromycin and expanded, and then the A3140G mutant version of PIK3CA was inserted into the cells (Fig. S1). According to the PIK3CA gene sequences and the mutation site information, the primers were designed for the gene of CDS A3140G (H1047R) with point mutations in exon 20, and PAM loci of two sgRNA synonymous mutations (Table I), augmented with PAM mutations and an A3140G point mutation of the PCR fragments, and then merged with objective mutations and the PAM mutations, concurrently, at both ends with AgeI and SalI enzyme loci. After successful construction, the vector was packaged together with lentiviral plasmid, and the titer was determined after purification. When the HCT116 cells grew to the logarithmic phase, the cells were inoculated into a 6-well cell culture plate at a density of 2.5×10⁵ cells/well. After the cells adhered to the wall overnight, the viral volume was added according to the MOI value (MOI=10), and the cells were infected for 12 h. The medium was changed with fresh medium and then culture continued for 24 h. The infected cells were then screened with 0.3 µg/ml puromycin and expanded for use in subsequent experiments.
 |
Table I.
Sequences of PIK3CA gene knockout sgRNA, and H1047R mutant plasmid.
|
Table I.
Sequences of PIK3CA gene knockout sgRNA, and H1047R mutant plasmid.
| sgRNA |
|
Sequence (5′→3′) |
| PIK3CA gene knockout sgRNA |
PIK3CA-NS1 |
GGATTTAGCTATTCCCACGCAGG |
| |
PIK3CA-NS2 |
TCGAATATTTACATTCACGTAGG |
| H1047R mutant plasmid |
PIK3CA-MutF |
TAATACGACTCACTATAGGGACCGG |
| |
|
TACGCGTGGAGCTAGTTATTAATAG |
| |
PIK3CA-MutR |
CGCTCTAGAACTAGTGGATCCCGTC |
| |
|
GACCTATTATCAGTTCAATGCATGC |
| |
|
TGTTTAATTGTGTGGAAGATCC |
Western blot analysis
HCT116 or MUT cells were cultured to a density of 1×10⁶ cells and seeded in 6-well plates. Cells adherent overnight, were then treated with the following inhibitors: PI3K inhibitor (taselisib; cat. no. HY-13898; MedChemExpress), MEK inhibitor (U0126-EtOH; cat. no. HY-12031; MedChemExpress), PDK1 inhibitor (GSK2334470; cat. no. HY-14981; MedChemExpress), AKT inhibitor (GSK-690693; cat. no. HY-10249; MedChemExpress)] for 12 h at 37°C. The old medium in each well was discarded and the cells were washed 3 times with precooled PBS. A total of 200 µl of western and IP cell lysate (cat. no. P0013; Beyotime Institute of Biotechnology) was added to the wells and incubated on ice for 30 min. The lysates from each well were collected and centrifuged at 14,300 × g for 10–15 min at 4°C to collect the supernatant. Protein concentration was assessed using a BCA protein assay kit (cat. no. P0012S; Beyotime Institute of Biotechnology). The equivalent amounts of protein (50 µg) of each sample were loaded on 10% or 12% SDS-PAGE gels. After separation, the protein was transferred to a PVDF membrane (cat. no. IPVH00010; EMD Millipore) at 350 mA for 100 min. Then, the membrane was blocked with 5% skimmed milk at room temperature for 1 h, washed 3 times with TBST (containing 0.1% Tween-20) for 5 min each time, and incubated overnight at 4°C with the corresponding primary antibody: GAPDH (product no. 5174T), PIK3CA-N (product no. 4249S), P-Rex1 (product no. 13168S) from Cell Signaling Technology, Inc.; PIK3CA-F (cat. no. A12484), MEK (cat. no. A4868), PDK1 (cat. no. A0834), AKT (cat. no. A18120), RSK2 (cat. no. A0177), ATF4 (cat. no. A0201), GPT2 (cat. no. A11819) from ABclonal Biotech Co., Ltd.) all diluted 1:1,000. After incubation with horseradish peroxidase conjugated goat anti-mouse IgG (cat. no. A0216; 1:10,000 dilution) and goat anti-rabbit IgG (cat. no. A0208; 1:10,000 dilution); both from Beyotime Institute of Biotechnology) at 1.5 h at room temperature, an ultra-sensitive ECL chemiluminescence kit (cat. no. P0018S; Beyotime Institute of Biotechnology) was used for visualization. Chemiluminescence imaging system exposure, ImageJ software (version 1.52; National Institutes of Health), was used for analysis to determine the expression levels of related proteins.
Cell proliferation assays
HCT116 cells or MUT cells were inoculated into a 96-well cell culture plate at a density of 3×10³ cells/well. After the cells had adhered to the wall overnight, they were exposed to inhibitors at concentrations of 10, 100 nM, 1, 10 µM or culture medium without glutamine for 24, 48, or 72 h. The old culture medium was discarded, washed twice with PBS solution, and the fresh culture medium was added. A total of 10 µl Cell Counting Kit (CCK)-8 working solution (cat. no. C0037; Beyotime Institute of Biotechnology) was added to each well, shaken evenly, bubbles were avoided, and incubated for 1 h at 37°C and in atmosphere containing 5% CO2. Then the absorbance was measured using a Multiskan™ GO plate reader (Thermo Fisher Scientific, Inc.) at 450 nm with an enzyme micrometer.
Apoptosis assays
HCT116 cells or MUT cells were inoculated into a 12-well cell culture plate at a density of 5×10⁵, and then exposed to the following inhibitors: PI3K inhibitor (taselisib; cat. no. HY-13898; MedChemExpress), MEK inhibitor (U0126-EtOH; cat. no. HY-12031; MedChemExpress), PDK1 inhibitor (GSK2334470; cat. no. HY-14981; MedChemExpress), at concentrations of 10, 100 nM, 1, 10 µM for 16 h. HCT116 cells were digested with trypsin without EDTA and collected, washed twice with precooled PBS, centrifuged at 158 × g (4°C for 5 min), and resuspended in 500 µl staining buffer. HCT116 cells were stained with propidium iodide (PI) and Annexin V-FITC (Nanjing KeyGen Biotech Co., Ltd.) at 4°C for 15 min to evaluate apoptosis. A total of 1×10⁴ stained cells were collected and detected by CytoFLEX (Beckman Coulter Biotechnology Co., Ltd.) within 1 h, and their apoptosis was analyzed using FlowJo v. 7.6.1 (FlowJo LLC).
Reverse transcription quantitative (RT-q)PCR
Total RNA from HCT116 and MUT cells was extracted using an RNA extraction kit (cat. no. DP430, Tiangen Biotech Co., Ltd) according to the manufacturer's instructions, and RNA was reverse transcribed to cDNA using RevertAid First Strand cDNA Synthesis Kit (cat. no. K1622; Thermo Fisher Scientific, Inc.) according to the manufacturer's instructions. Then, PIK3CA and GPT2 were amplified using cDNA as a template to evaluate the expression of PIK3CA and GPT2 in HCT116 and MUT cells. The thermocycling condition were as follows: Initial denaturation at 95°C, 3 min; 30 cycles of denaturation at 95°C, 30 sec, annealing and elongation at 72°C, 60 sec; and final extension at 72°C, 5 min. Hefei General Biotechnology Co., Ltd. was commissioned to follow the primer design principles and design and synthesize specific primers for PIK3CA (annealing 52°C; 30 sec), GPT2 (annealing 54°C; 30 sec) and GAPDH (annealing 62°C; 30 sec). The primer sequences are listed in Table II. Finally, ImageJ software 1.52 was used for analysis to determine the expression level of relevant RNA.
|
Table II.
Sequences of PIK3CA, GPT2 and GAPDH specific primers.
|
Table II.
Sequences of PIK3CA, GPT2 and GAPDH specific primers.
| Genes |
Sequence (5′→3′) |
| PIK3CA |
F: TCGTGCATGTGGGATGTATT |
| |
R: TTTCGCACCACCTCAATAAG |
| GPT2 |
F: GTGATGGCACTATGCACCTAC |
| |
R: TTCACGGATGCAGTTGACACC |
| GAPDH |
F: CGGGTGATGCTTTTCCTAGA |
| |
R: TGATCTTGAGGCTGTTGTCATAC |
Xenograft studies
A total of 3×10⁶ HCT116 cells, 3×10⁶ MUT cells in a volume of 0.1 ml or 1×10⁷ MUT cells (26,27) in a volume of 0.2 ml serum-free medium were injected subcutaneously into 4-week athymic nude mice near the right hind leg. Once tumors reached an average size of 200 mm3, nude mice treated with 3×10⁶ MUT cells were randomly divided into 5 groups: i) PBS, ii) 5 mg/kg of PI3K inhibitor, iii) 20 mg/kg of PDK1 inhibitor, iv) 10 mg/kg of MEK inhibitor or v) combined application of 20 mg/kg of PDK1 and 10 mg/kg of MEK inhibitor. PBS or inhibitors were injected intraperitoneally every day for 10 days. Tumor volume was measured every 2 days. The maximum tumor size observed in our study was 16.32×15.46 mm, and the maximum volume was 1950.33 mm3. In each individual experiment, when the tumor volume reached 2,000 mm3 or on the 15th day after tumor implantation, mice were sacrificed by cervical dislocation. Animal experiments were approved by the Animal Welfare and Ethics Committee of Wannan Medical College (Wuhu, China). The experimental procedures were carried out according to the guidelines for the Care and Use of Experimental Laboratory Animals of Wannan Medical College.
Statistical analysis
All data were expressed as the mean ± SD and the experiments were repeated 3 times. The experimental data were first analyzed using one-way analysis of variance (ANOVA). When the variance was equal, the significance of the difference between the two groups was analyzed. When the variances were not equal, the differences between the two groups were analyzed by Dunnett's T3 test. This analysis was followed by Bonferroni post hoc test. The experimental data which observed cells before and after mutation were analyzed using t-tests. The tumor volume differences were analyzed using a mixed two-way ANOVA, and then Bonferroni post hoc test was used for analysis. P<0.05 was considered to indicate a statistically significant difference. All statistical analyses were performed with SPSS 19.0 software (IBM Corp.).
Results
Construction of PIK3CA mutant HCT116 cells
In order to construct PIK3CA-mutated HCT116 cells, knockout and mutant vectors were first constructed (Fig. 1A); then, targeted insertion of the PIK3CA gene through CRISPR/Cas9 method was performed to destroy the function of the original gene, and finally overexpression of the constructed point-mutated plasmid into the HCT116 cells was carried out (Fig. 1B). Sequencing results revealed that MUT cells constructed by our research group had been mutated at this site, and mutation of A3140G occurred at this site (Figs. 1C and S2). Moreover, it was detected by western blotting and RT-qPCR experiments that PIK3CA protein (PIK3CA-N) or mRNA expression in MUT cells and the KO cells was increased compared with that in HCT116 cells, while the corresponding GAPDH protein expression was not altered (Fig. S2). The antibody that binds to the mutation site (PIK3CA-F) was assessed using western blotting. The results revealed that no band was detected in the MUT cells and KO cells (Figs. 1D and S2).
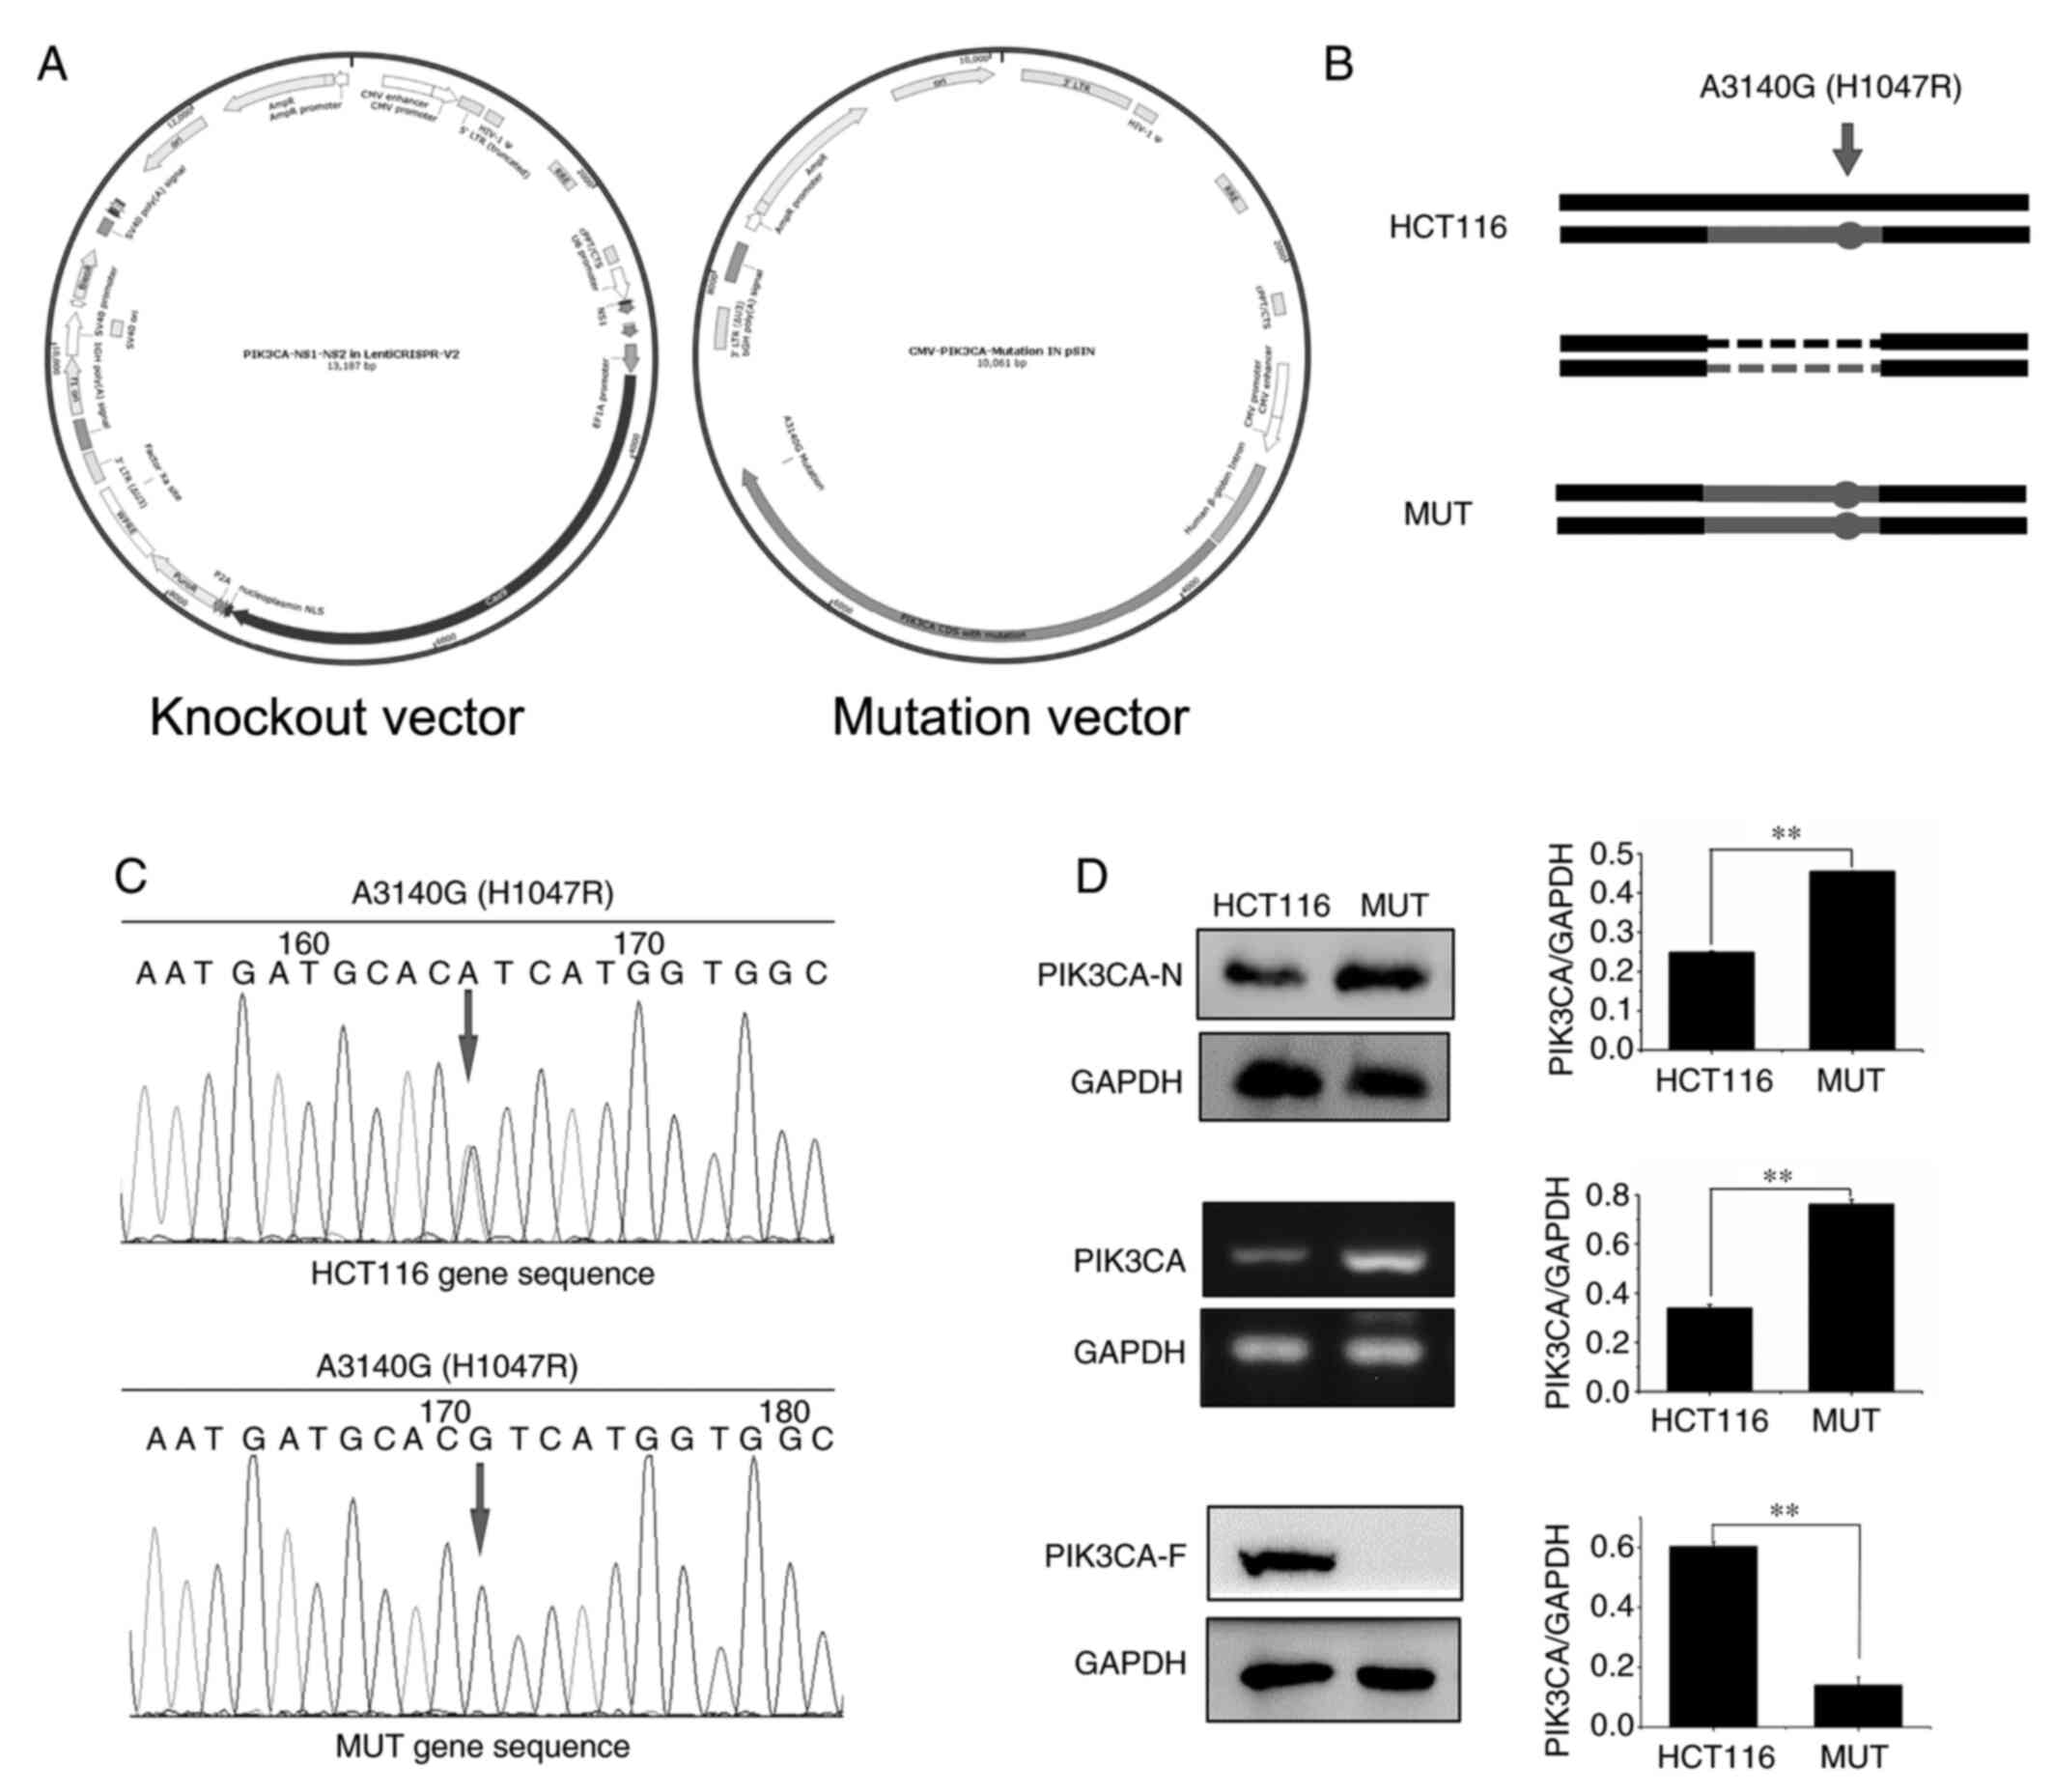 |
Figure 1.
Construction of PIK3CA mutated HCT116 MUT cells. (A) Construction of knockout and mutant vectors of MUT cells. (B) Allele diagram of PIK3CA mutant cells in HCT116 cells. The point mutant plasmid was overexpressed in the cells. The cells in which the mutant plasmid was overexpressed were called MUT cells. (C) A point mutation overexpressed plasmid was constructed, and the PIK3CA gene point mutation in the plasmid was determined by sequencing. The mutation occurred at the point of the arrow, and the base change is indicated above the arrow. (D) According to western blotting and RT-qPCR experiment verification, the MUT cells overexpressed PIK3CA protein. PIK3CA-N, the antibody binds to the non-frameshift mutant region of PIK3CA; and PIK3CA-F, the antibody binds to the frameshift mutation region of PIK3CA which contains the mutation point. **P<0.01. PIK3CA, phosphatidylinositol-3-kinase catalytic subunit α; MUT, mutant.
|
Detection of proliferation of HCT116 cells and MUT cells
In order to determine whether PIK3CA mutation had an effect on the proliferation ability of HCT116 and MUT cells, proliferation assays were performed. It was revealed that under normal culture conditions, the proliferation ability of MUT cells was significantly enhanced compared with that of normal HCT116 cells (P<0.01) (Fig. 2A). Subsequently, suboptimal conditions with low serum (5% FBS) culture were investigated by detecting apoptotic differences between HCT116 and MUT cells.
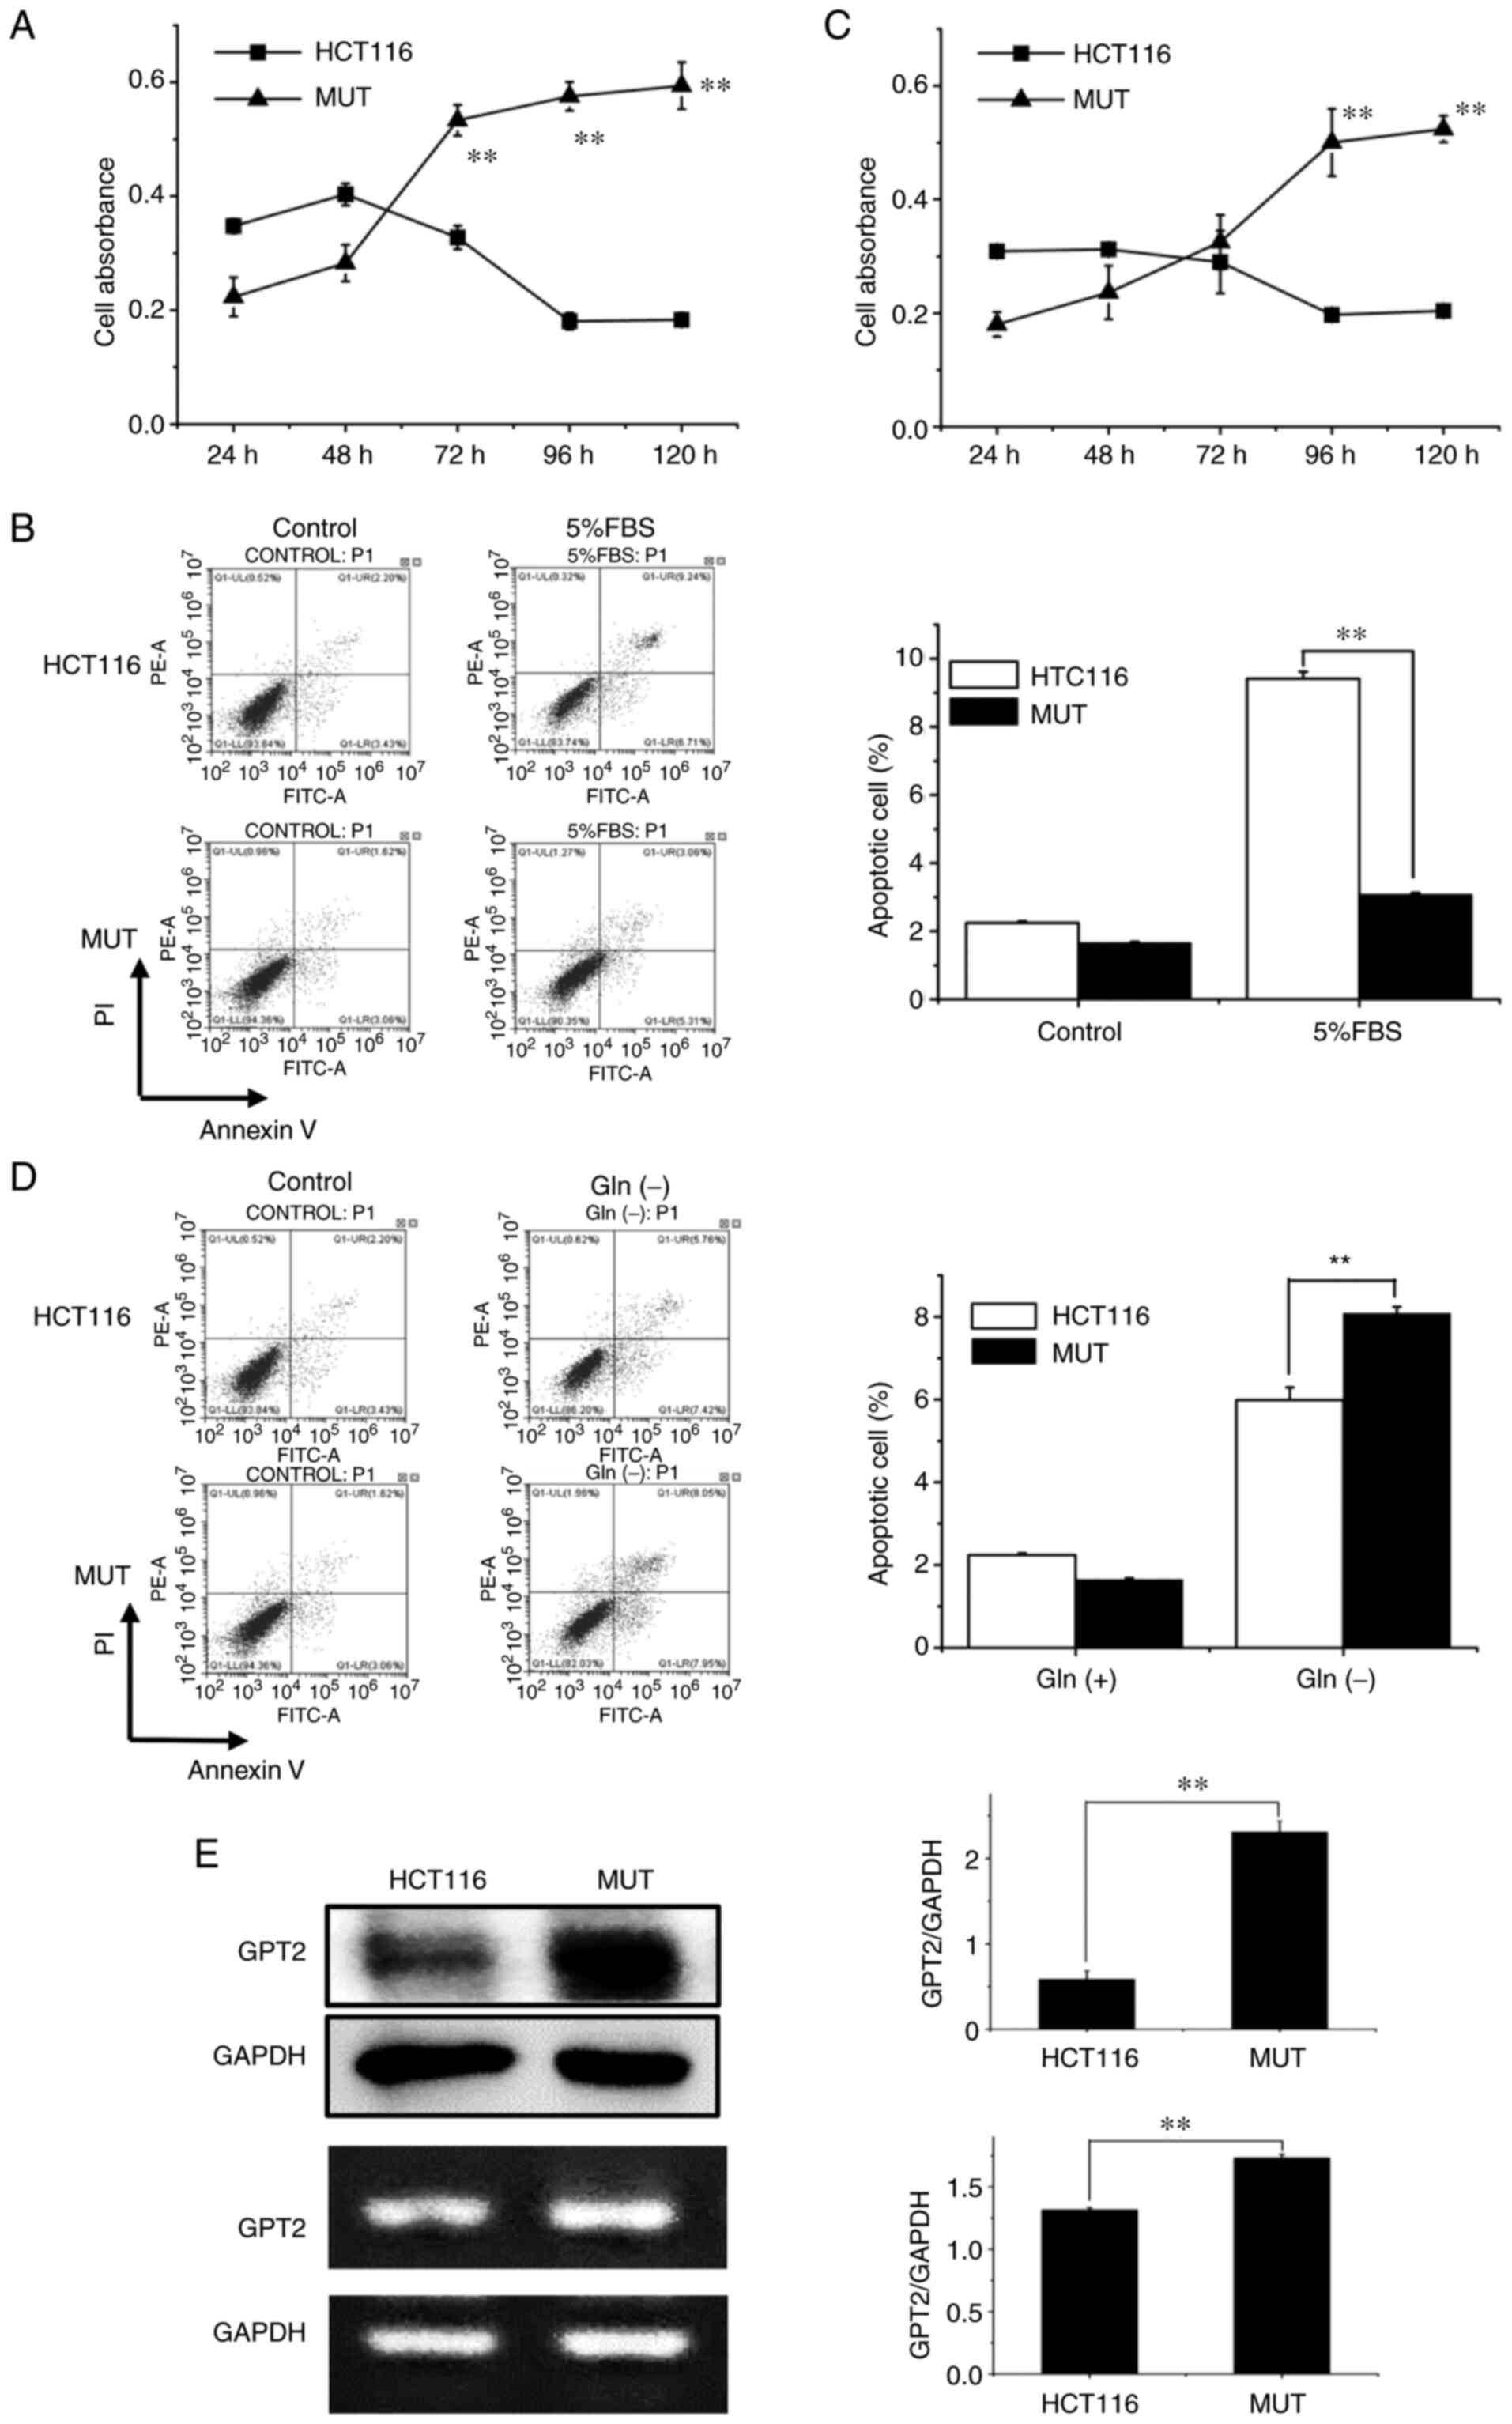 |
Figure 2.
(A) Under normal culture conditions, the absorbance values of HCT116 and MUT cells were detected and analyzed at 5 time-points (24, 48, 72, 96 and 120 h, respectively). (B) Under low serum conditions, the effect of inducing apoptosis in HCT116 cells was more evident. (C) Under glutamine-free culture conditions, the absorbance values of HCT116 and MUT cells were detected and analyzed at 5 time-points (24, 48, 72, 96 and 120 h, respectively). (D) Lack of glutamine induced more apoptosis in MUT cells. (E) The expression of glutamic-pyruvate transaminase 2 in MUT cells was higher than that in HCT116 cells. **P<0.01. MUT, mutant; GPT2, glutamic-pyruvate transaminase 2.
|
It was revealed by flow cytometric analysis that under the condition of low serum culture, containing the 5% FBS, the apoptotic cell rate significantly decreased in MUT cells compared with HTC116 cells; at a 5% FBS concentration, the HCT116 cell apoptotic rate was 9.24% and the MUT cell apoptotic rate was 3.06%, which was a significant difference (P<0.01) (Fig. 2B). In order to further investigate whether the increased proliferative ability of HCT116 cells and MUT cells was due to the dependence on glutamine, the cells were cultured without glutamine and the changes were studied by detecting cell proliferation and apoptosis. Cell proliferation was detected using a CCK-8 assay, and it was revealed that the proliferation ability of HCT116 cells was almost unchanged, and the proliferation ability of MUT cells cultured without glutamine was weakened compared with normal culture (Fig. 2C). Flow cytometric detection revealed that the cell apoptotic rate was significantly increased after the mutation in the glutamine-free culture condition, and the apoptotic rate of the HCT116 group was 5.76%, and that of MUT group was 8.05%, revealing a significant difference between the two groups (P<0.01) (Fig. 2D). Western blotting and RT-qPCR were used to detect the expression of GPT2 protein in HCT116 and MUT cells, and it was revealed that the expression of GPT2 in MUT cells was significantly higher than that in HCT116 cells (P<0.01) (Fig. 2E).
Effect of the inhibition of PI3K on its downstream signal transduction molecules
In order to study the influence of PI3K inhibition on its downstream signal transduction molecules, the PI3K inhibitor was used to detect the changes of other signaling pathway molecules using western blotting. After the inhibition of PI3K, the expression levels of RSK2, ATF4 and GPT2 proteins were significantly downregulated. Among these, the inhibition levels of ATF4 and GPT2 were the most significant and dose-dependent (Fig. 3). With the increase of the dose to 100 nM, the inhibitory effect was more evident. In addition, the expression of PDK1, MEK, and AKT significantly decreased under the effect of 10 µM inhibition. Western blotting results revealed that when the dose of the PI3K inhibitor reached 100 nM, compared with the control group, the expression levels of all proteins were decreased (P<0.01). When the dose of PI3K inhibitor reached 1 µM or higher, the expression of all protein levels exhibited a statistically significant decrease compared with the control group (P<0.01).
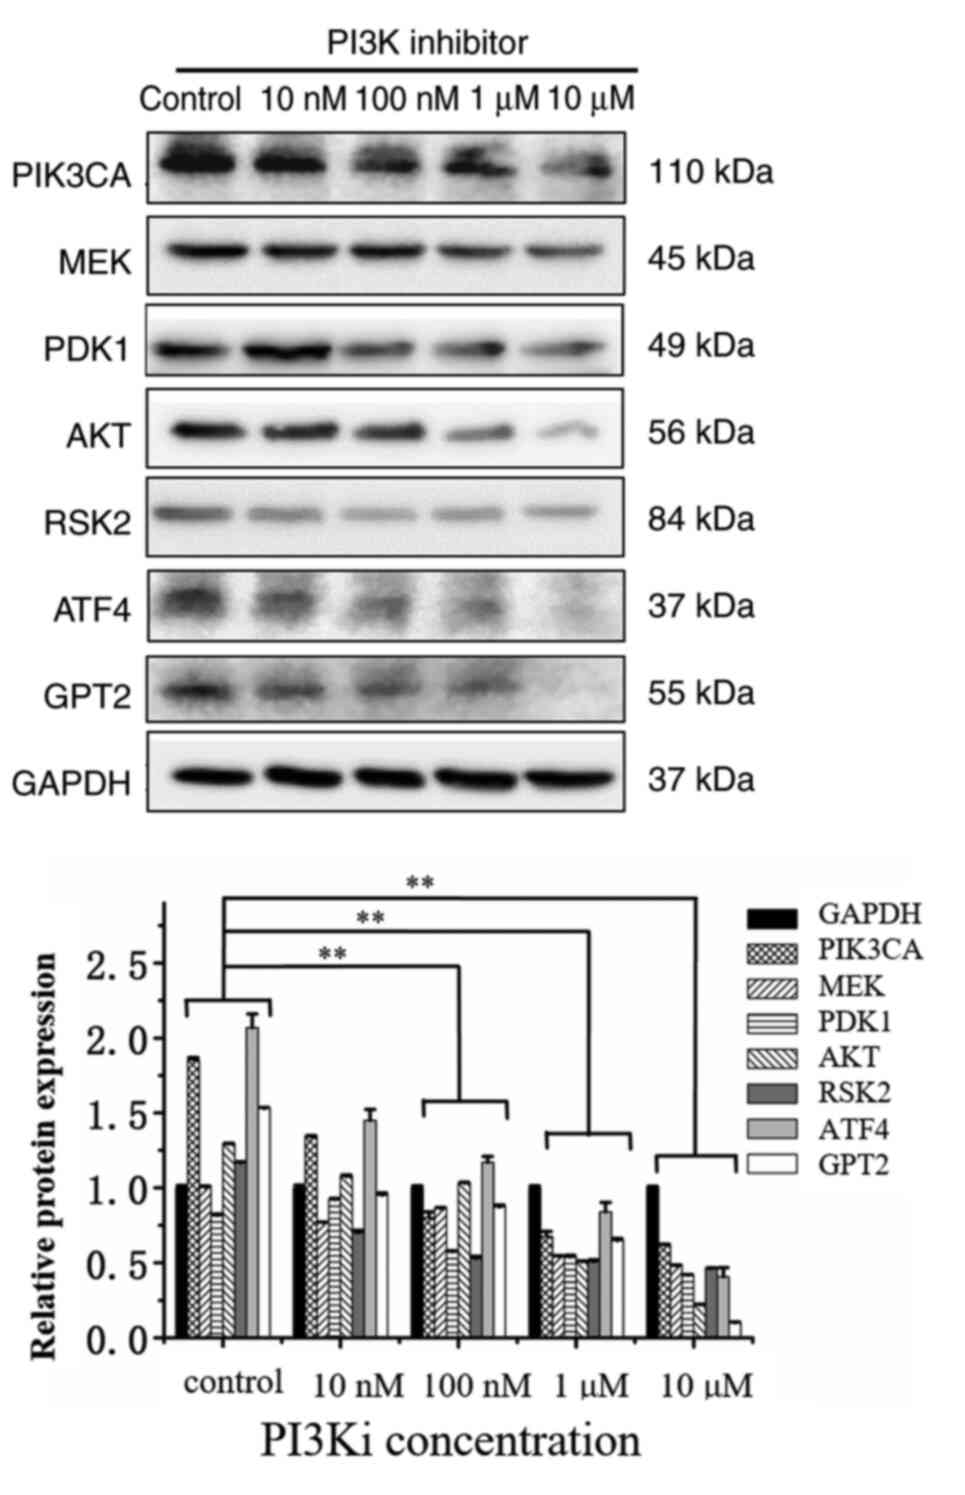 |
Figure 3.
In MUT cells, PI3K inhibitor suppresses 3-phosphoinositide-dependent kinase, serine/threonine-specific protein kinase, mitogen-activated protein kinase, ribosome S6 kinase 2, transcriptional activator 4 and glutamic-pyruvate transaminase 2 signaling pathways molecules. HCT116 cells and MUT cells were seeded on 6-well plates respectively. After overnight incubation, they were replaced into normal medium or medium containing 10, 100 nM, 1 and 10 µM PI3K inhibitor for 12 h. After cell lysis, relevant protein expression was detected. **P<0.01. Each protein in inhibitor group was compared with the same protein in control group. MUT, mutant; PDK1, 3-phosphoinositide-dependent kinase; AKT, serine/threonine-specific protein kinase; MEK, mitogen-activated protein kinase; RSK2, ribosome S6 kinase 2; ATF4, transcriptional activator 4; GPT2, glutamic-pyruvate transaminase 2.
|
Effect of the inhibition of PDK1 and MEK on their downstream signal transduction molecules
In order to study the effect of PDK1 and MEK inhibition on the downstream signal transduction molecules, PDK1 and MEK inhibitors were used to detect the changes of other signaling pathway molecules with western blot analysis. After addition of PDK1 and MEK inhibitors, the protein expression levels of RSK2, ATF4, and GPT2 were significantly decreased, and the inhibition effect was significant between the 10-µM group and the control group (P<0.01) (Fig. 4A and B). However, the inhibition of AKT did not decrease the expression levels of RSK2, GPT2, and ATF4 (Fig. 4C). Moreover, it was revealed that PDK1 and MEK did not affect the protein expression of each other. When the inhibitor concentration reached 10 µM, other signaling pathway molecules(MEK, PDK1 or AKT) did not significantly decrease and it was revealed that there was no compensatory relationship between the three signaling pathways.
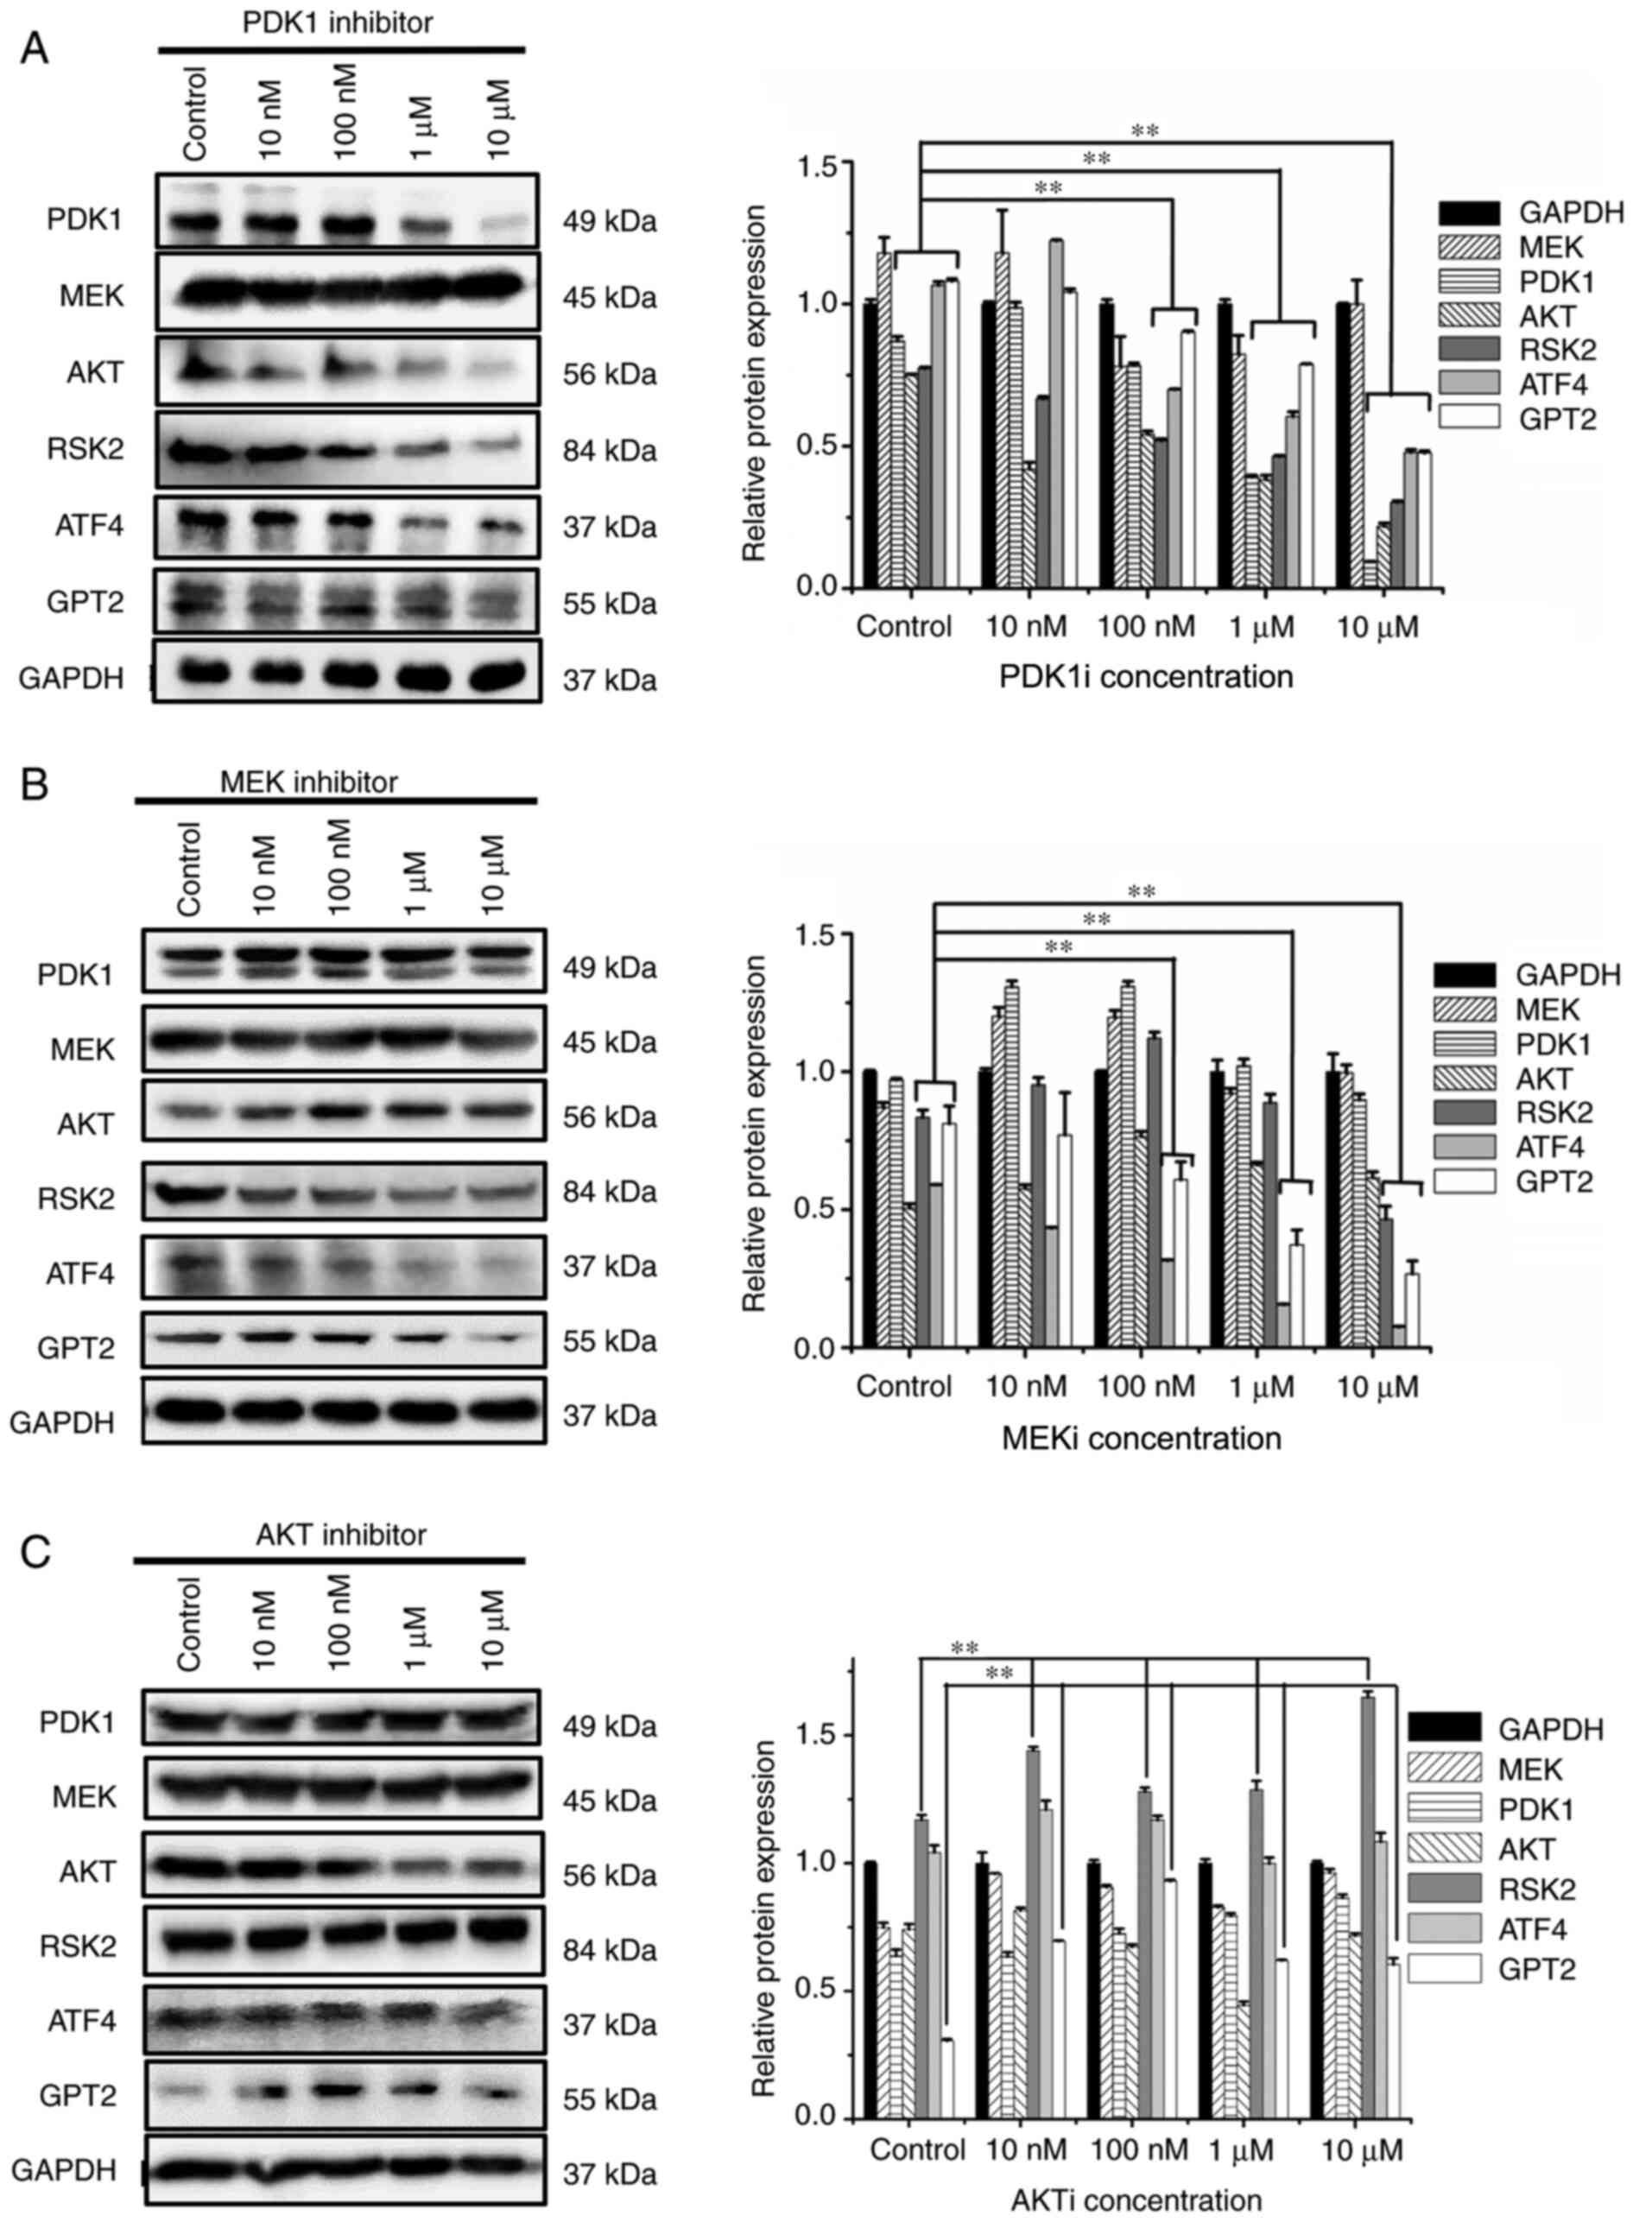 |
Figure 4.
Effects of (A) PDK1 inhibitor, (B) MEK inhibitor and (C) AKT inhibitor on PI3K/PDK1, PI3K/MEK and PI3K/AKT signaling pathways in MUT cells. HCT116 cells and MUT cells were seeded on 6-well plates respectively. Overnight incubation, they were replaced into normal medium or medium containing various inhibitors of 10, 100 nM, 1 and 10 µM for 12 h. After cell lysis, relevant protein content was detected. **P<0.01. Each protein in inhibitor group was compared with the same protein in control group. PDK1, 3-phosphoinositide-dependent kinase; MEK, mitogen-activated protein kinase; AKT, serine/threonine-specific protein kinase; MUT, mutant.
|
Detection of P-Rex1 molecule in HCT116 and MUT cells
To detect the expression levels of P-Rex1 signal transduction molecule in HCT116 cells and MUT cells, western blotting was performed. The results revealed that the expression of this protein in MUT cells was significantly enhanced (Fig. 5A; P<0.01). Then, P-Rex1 expression was detected in MUT cells treated with PI3K, PDK1 and MEK inhibitors at 0 (control), 10, 100 nM, 1 and 10 µM, respectively. When PI3K inhibitor was used, the expression of P-Rex1 protein was significantly suppressed in a dose-dependent manner (P<0.01) (Fig. 5B). When PDK1 and MEK inhibitors were used, P-Rex1 did not decrease (Fig. 5C and D).
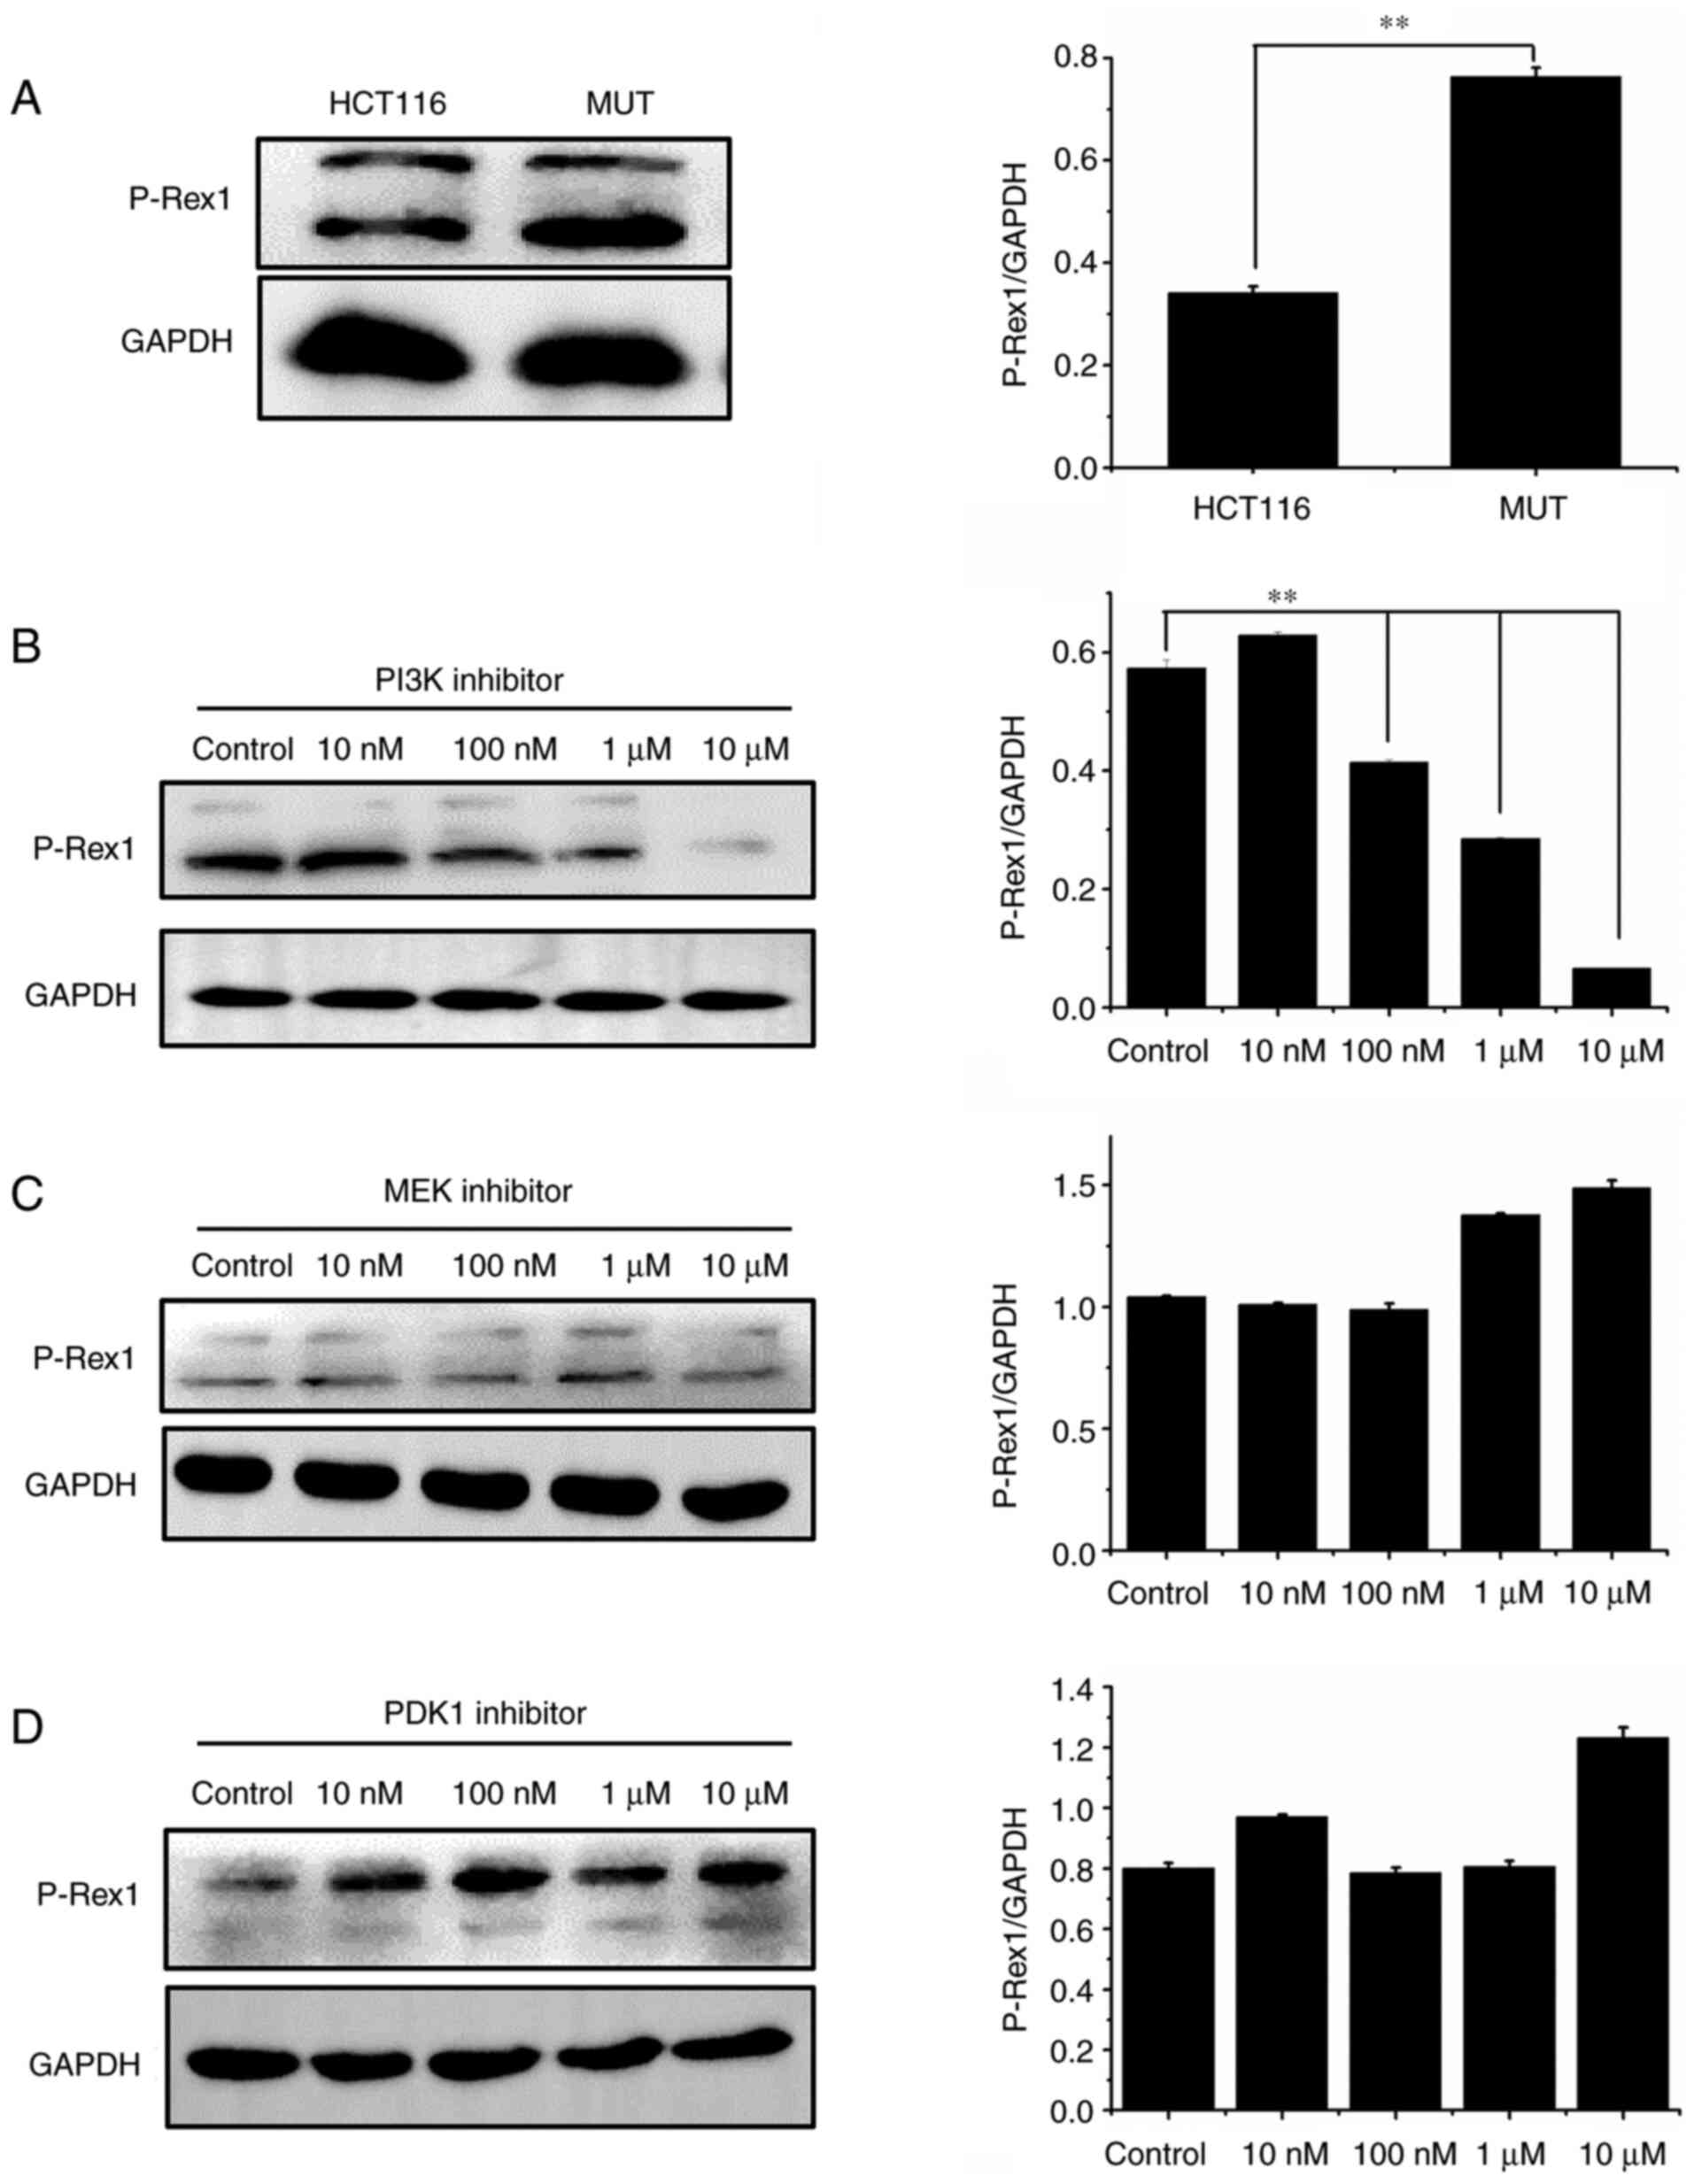 |
Figure 5.
Detection of P-Rex1 molecule in HCT116 cells. (A) After culturing HCT116 cells and MUT cells concurrently, western blotting was used to detect the expression level of P-Rex1 signal transduction molecules. (B-D) HCT116 and MUT cells were seeded on 6-well plates respectively. Overnight incubation, they were replaced into normal medium or medium containing various inhibitors of 10, 100 nM, 1 and 10 µM for 12 h. After cell lysis, relevant protein expression was detected. **P<0.01. MUT, mutant; PDK, phosphoinositide-dependent kinase; MEK, mitogen-activated protein kinase; P-Rex1, phosphatidylinositol 3/4/5 triphosphate dependent RAC exchanger 1.
|
Effect of the inhibition of PI3K, PDK1 and MEK, and the combined application of PDK1 and MEK inhibitors on the proliferation and apoptosis of MUT cells
To verify the changes in cells after H1047R mutation, CCK-8 and flow cytometric assays were used to detect cell proliferation and apoptosis, respectively. The results revealed that the inhibition of PI3K, PDK1 or MEK signaling pathway molecules had an evident inhibitory effect on the proliferation of MUT cells (Fig. 6A-C). Our results revealed that when the PI3K, PDK1 or MEK inhibitor was applied, the proliferation of MUT cells was inhibited. The absorbance when PI3K, MEK or PDK1 inhibitor was used, decreased by 64, 35 and 67%, respectively (Fig. 6A-C). Next, the effects of each inhibitor on the apoptotic rate of the cells was detected, and the results revealed that PI3K, PDK1 and MEK inhibitors increased the apoptotic rate of MUT cells. The apoptotic rate when PI3K inhibitor was used increased from 2.12 to 5.60% when the inhibitor dose reached 10 µM. When PDK1 inhibitor reached 10 µM, the apoptotic rate of MUT cells increased from 1.06 to 3.28%. For the MEK inhibitor, the apoptotic rate increased from 4.79 to 10.98% at the 10-µM dose. Compared with the control group, the apoptotic rate of each group was statistically significant (P<0.01) (Fig. 6E-G). Due to the strong inhibitory effect of PI3K on MUT cells and high cytotoxicity, combined PDK1 and MEK inhibitors were considered. CCK-8 and flow cytometric results revealed that combined inhibition of PDK1 and MEK slowed down the proliferation of MUT cells, reducing the absorbance ~78% (Fig. 6D), and the apoptotic rate increased from 1.63 to 8.01% (Fig. 6H). It is worth noting that when PDK1 and MEK inhibitors were combined, no significant inhibitory effect on proliferation was observed when small concentrations were used on the cells. When the concentration of the inhibitors combined reached 1 µM at 72 h, a slight inhibitory effect on the proliferation of cells was exhibited. When the concentration of the inhibitors combined reached 10 µM at 72 h, the absorbance was significantly decreased. These results revealed that the combined application of PDK1 and MEK inhibitors had a strong suppressive effect on cell proliferation.
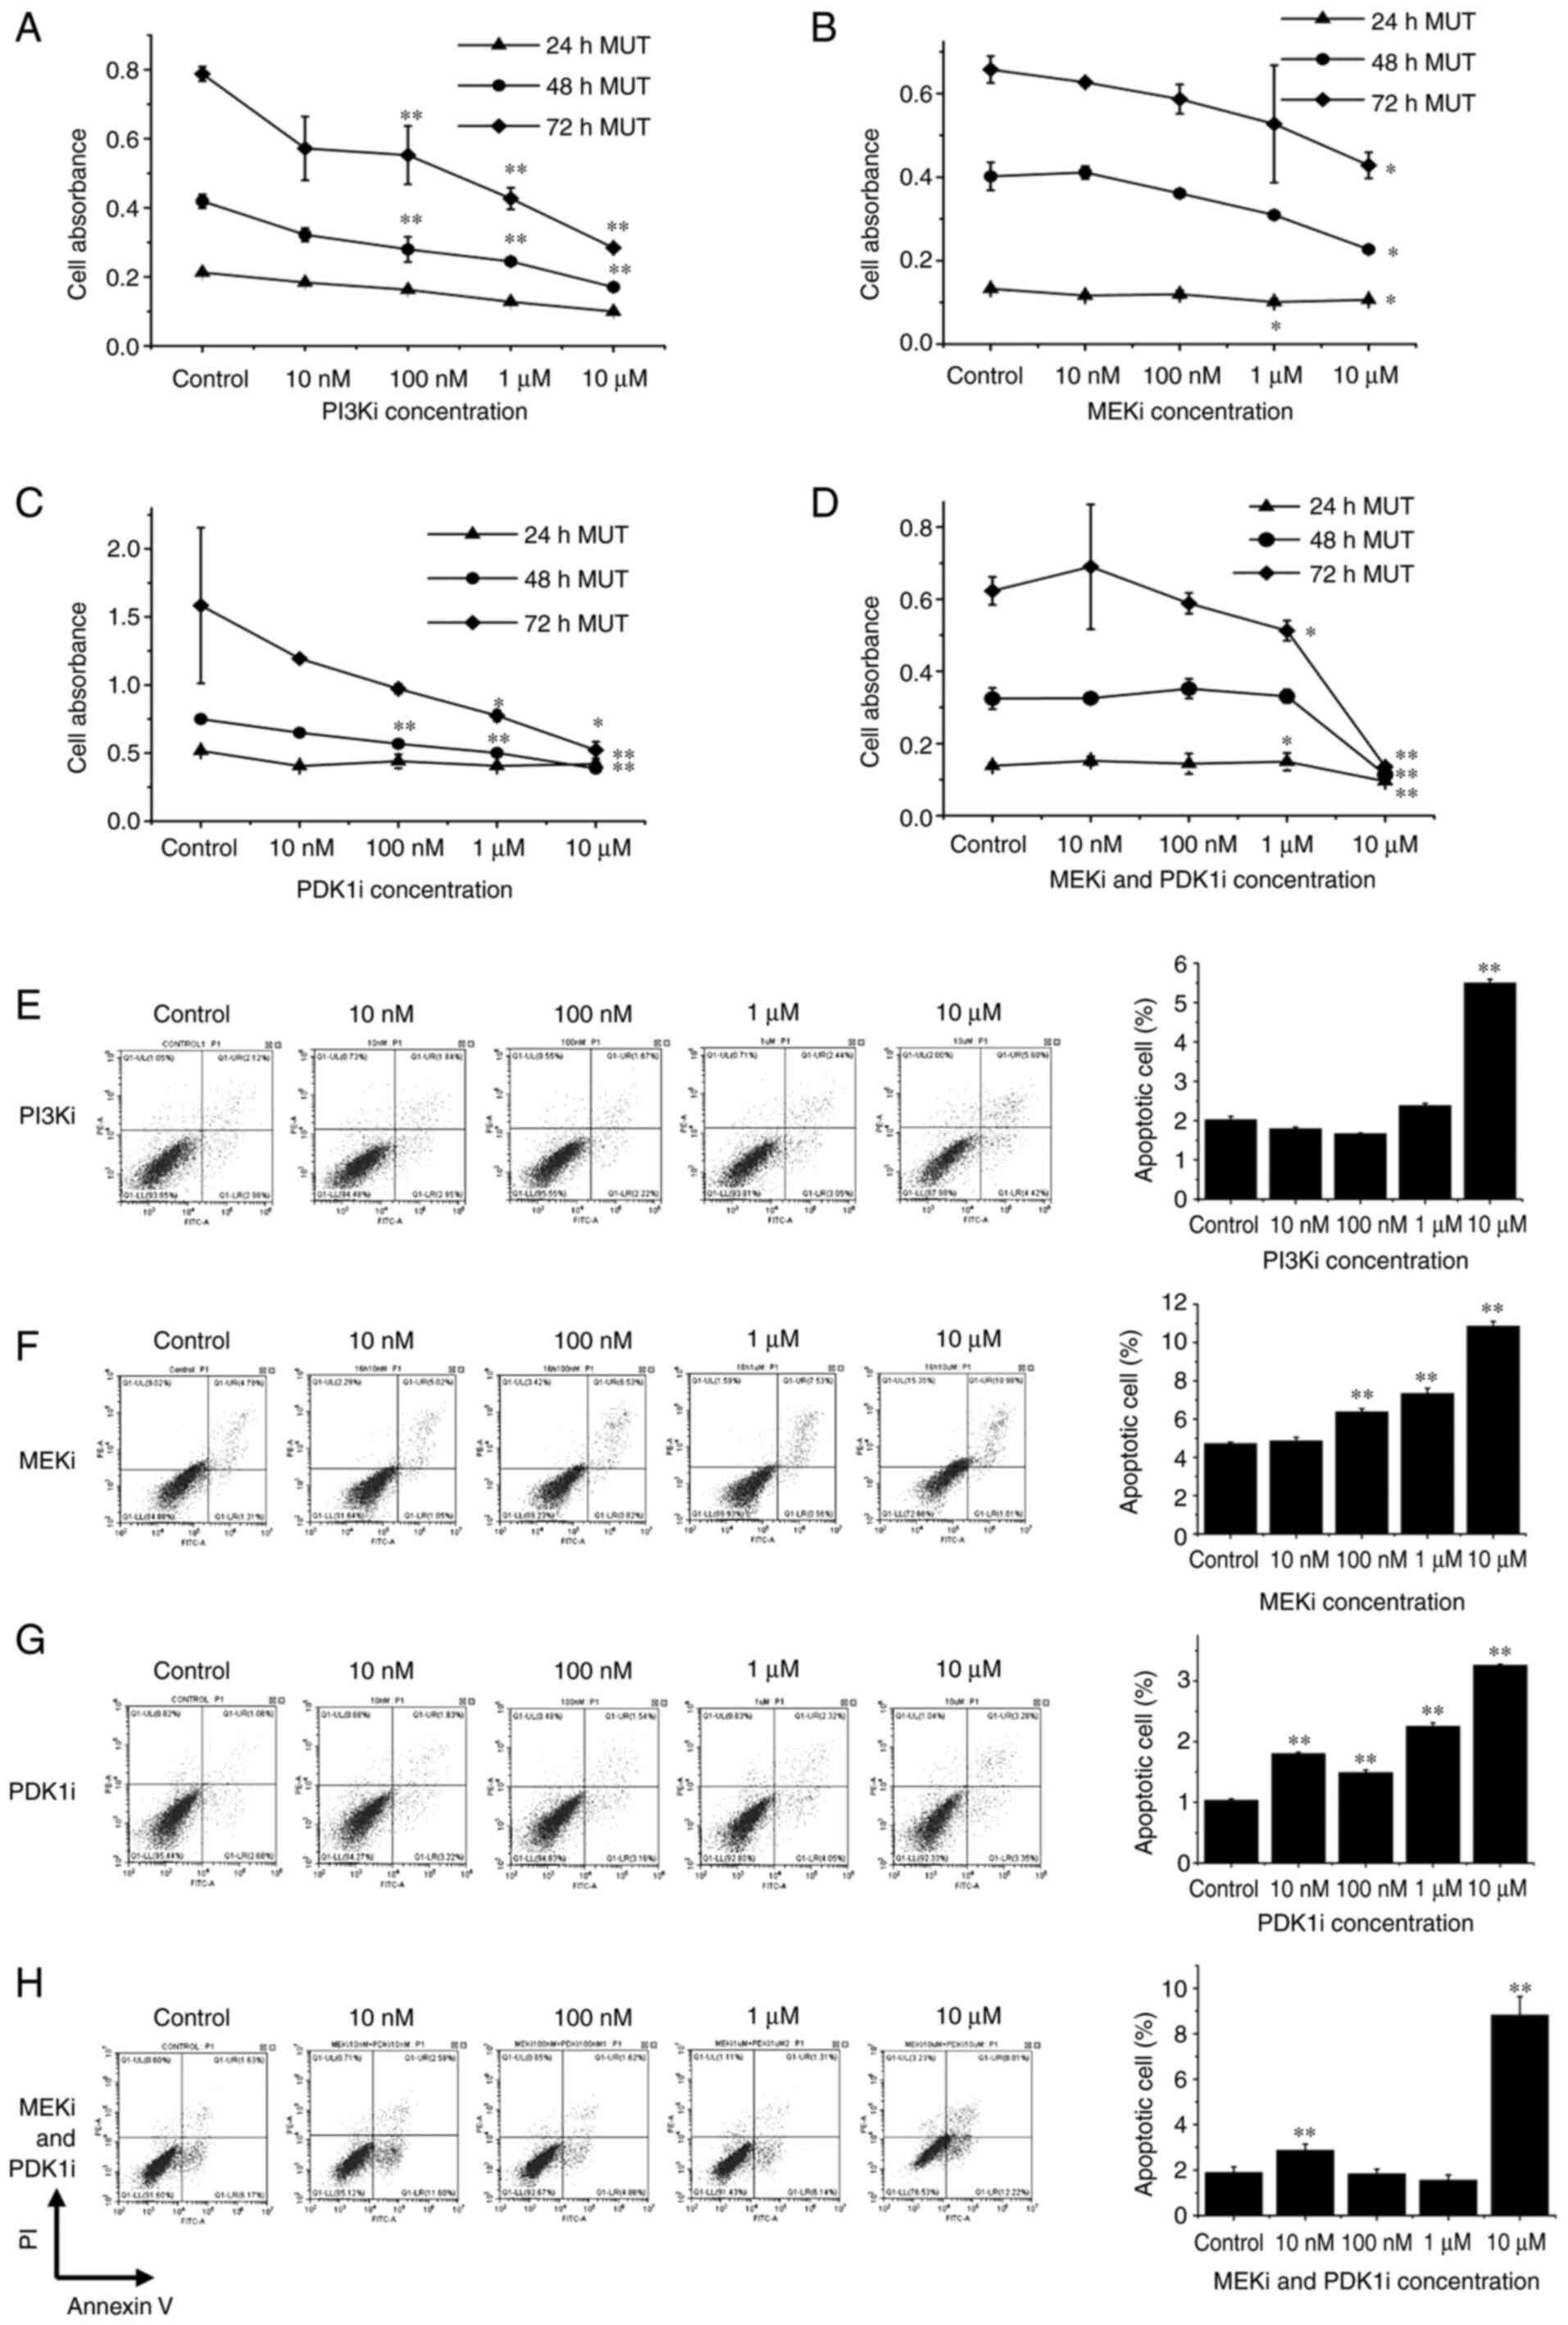 |
Figure 6.
The MUT cells were seeded on 96-well plates, cultured in normal medium or medium containing 10, 100 nM, 1, and 10 µM of inhibitor after overnight incubation. (A-D) Cell Counting Kit-8 working solution was added at 24, 48 and 72 h to detect the absorbance values. PDK1, MEK and PI3K inhibitors had obvious inhibitory effects on cell proliferation. Combined use of PDK1 and MEK inhibitor had a significant inhibitory effect on cell proliferation. (E-H) The MUT cells were seeded on a 12-well plate. Overnight incubation, the cells were replaced with cells containing 10, 100 nM, 1 and 10 µM of inhibitor or cultured in normal medium for 16 h to detect the apoptotic rate. The ability of each inhibitor to induce apoptosis of MUT cells increased with the increase of dose. The ability of combined application of inhibitors to induce apoptosis of both types of cells was evident. *P<0.05 and **P<0.01. MUT, mutant; PDK, phosphoinositide-dependent kinase; MEK, mitogen-activated protein kinase.
|
Inhibitors have suppressive effects on MUT cells in vivo
In order to evaluate the growth of HCT116 and MUT cells in vivo and the effects of each inhibitor in vivo, xenograft studies were further conducted. The results revealed that the tumor growth rate of nude mice inoculated with MUT cells was faster than that of HCT116 cells. The nude mice inoculated with 1×10⁷ MUT cells exhibited tumor growth first, followed by nude mice inoculated with 3×10⁶ MUT, and finally HCT116 cells. Moreover, the tumor growth rate of nude mice inoculated with MUT cells significantly increased in the later stage (Fig. 7A). PI3K, MEK inhibitor or combined application of PDK1 and MEK inhibitors could effectively slow down the growth rate of tumors (P<0.05). However, there was no statistical difference between these 3 groups. The tumor growth rate of nude mice treated with PDK1 inhibitor also slowed down to a certain extent, but individual differences were great and there was no statistical difference (Fig. 7B).
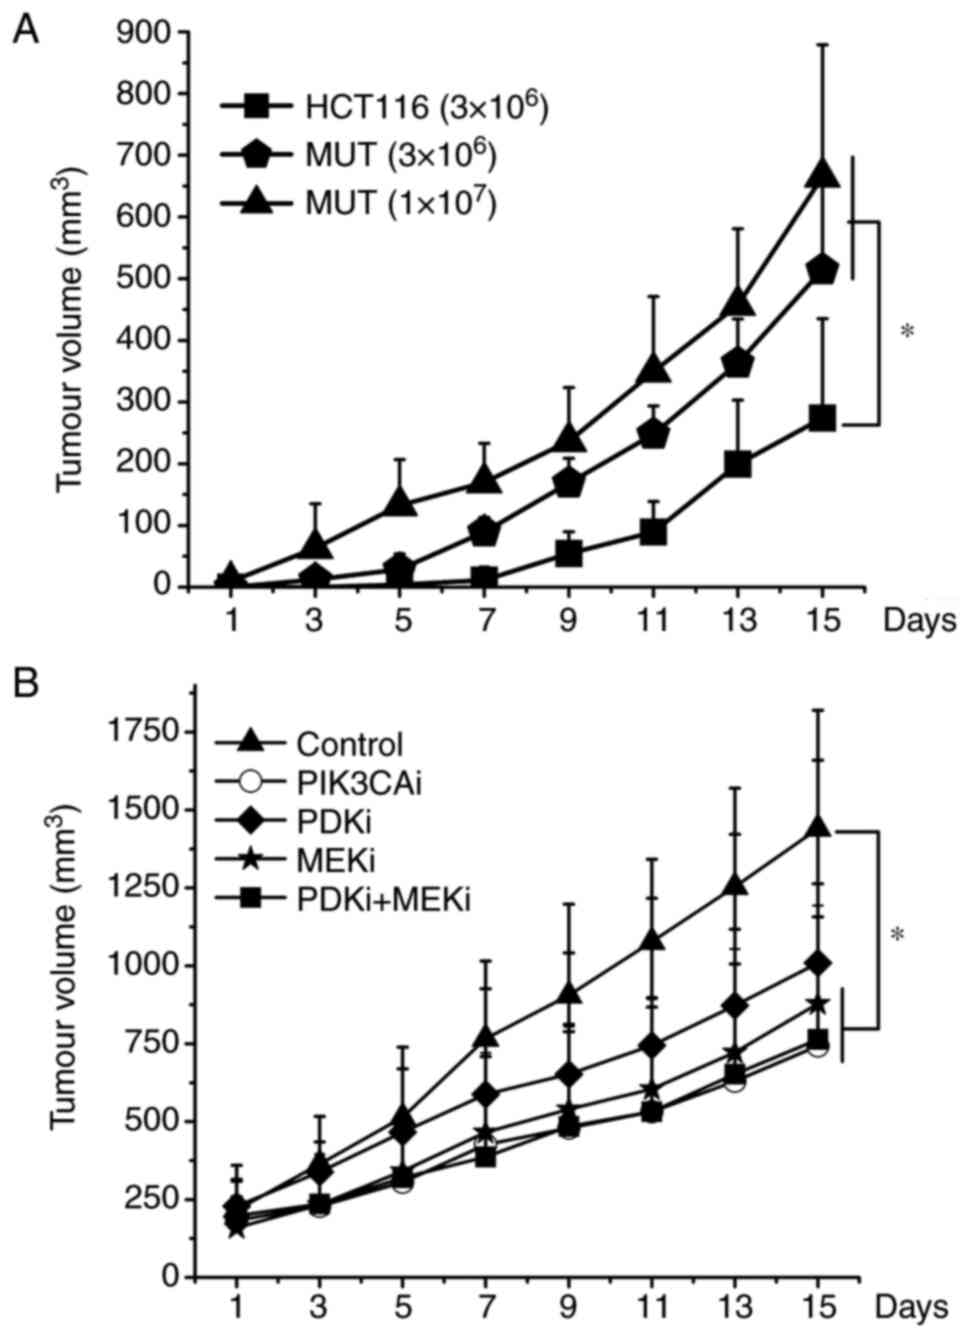 |
Figure 7.
A total of 3×10⁶ or 1×10⁷ cells were injected subcutaneously and bilaterally into athymic nude mice near the right hind leg. Once tumors reached an average size of 200 mm3, 5 mg/kg of PI3K inhibitor, 20 mg/kg of PDK1 inhibitor, 10 mg/kg of MEK inhibitor, combined application of PDK1 and MEK inhibitor was injected intraperitoneally every day for 10 days. The tumor volume was measured every 2 days. In each individual experiment, when the tumor volume reached to 2,000 mm3 or on the 15th day after tumor implantation, mice were sacrificed. (A) HCT116 cells (3×10⁶), MUT cells (3×10⁶), MUT cells (1×10⁷) growth curves were plotted. (B) The various inhibitors suppressed the growth of xenograft tumors formed by MUT. *P<0.05. PDK1, 3-phosphoinositide-dependent kinase; MEK, mitogen-activated protein kinase; MUT, mutant.
|
Discussion
PIK3CA mutation has a high incidence in cells of CRC patients, leading to aberrant regulation of the PI3K signaling pathway at different levels and increased proliferation capacity of CRC cells. However, the molecular mechanism remains unclear. To study the effect of the specific mechanism of PIK3CA mutation on proliferation capacity in CRC HCT116 cells and to provide a theoretical basis for targeting PI3K-MEK/PDK1-GPT2 signal transduction pathways in CRC cells, HCT116 cells mutated with the PIK3CA gene H1047R were constructed, and the changes in cell growth were verified after the mutation by detecting the proliferation and apoptosis. Then the PI3K-related signal transduction pathway was studied.
First, the CRISPR/Cas9 method was used to knock out the PIK3CA gene in HCT116 cells through frameshift mutation to alter the amino acid sequence of the protein, and then a lentivirus was used to overexpress the PIK3CA mutant plasmid. The cells were infected with the lentivirus which overexpressed the PIK3CA mutant plasmid. The transfected plasmid was first sequenced and it was revealed that it contained indeed a point mutation sequence. Since the unmutated bases in the cells accounted for a small proportion, the sequencing only detected the mutated bases. In addition, our western blotting and RT-qPCR results both indicated that the expression of PIK3CA in the MUT cells was increased. However, the expression of PIK3CA in the KO cells was also increased. It was hypothesized that it may be due to the change of the protein, that renders it unable to play its original function, and thus the feedback regulation is generated to increase the synthesis of PIK3CA. Although the protein in the KO group was increased, it was no longer the original protein expressed by PIK3CA, thus it was hypothesized that it should not affect the subsequent experimental results in the present study. On this basis, antibodies that bind to the mutation site were searched and western blot experiments were performed. The results revealed that no bands were detected in the MUT and KO cells. In addition, the results indicated that the proteins expressed by the MUT cells were all mutated PIK3CA. In addition, the protein in the KO group due to the PIK3CA gene had undergone frameshift mutations, the sequence of amino acids had changed, and thus the protein expressed by PIK3CA had also changed. After obtaining PIK3CA MUT cells, the changes in cell growth after the mutation were verified.
First, CCK-8 and flow cytometry were used to detect the proliferation and apoptosis of HCT116 and MUT cells, respectively, in a normal culture environment. CCK-8 results revealed that the proliferation ability of MUT cells was significantly enhanced compared with HCT116 cells. The apoptotic rate of MUT cells was significantly lower than that of HCT116 cells. These results indicated that PIK3CA mutations increased cell proliferation, rendering cells more likely to survive and resist environmental changes. After culturing without glutamine, MUT cell proliferation slowed down and the apoptotic rate of MUT cells significantly increased, indicating that the MUT cells were more glutamine-dependent, and their glutamine-dependent characteristics were confirmed. Finally, the increased expression of GPT2 protein in MUT cells was verified by western blotting. These results indicated that MUT cells had a stronger survival ability and were glutamine-dependent, which mainly depended on the change of GPT2.
Using MUT cells, western blotting results revealed that the level of GPT2 and ATF4 in the cells significantly increased. As a transcription factor, ATF4 plays a key role in the growth and development of normal tissues and regulates the synthesis of a variety of related genes, and participates in apoptosis of cells (28). The expression of ATF4 has been revealed to be significantly increased in various tumor tissues (28). Previous studies revealed that ATF4 was closely related to GPT2, and ATF4 increased with the upregulation of GPT2 (17,29). These data revealed that ATF4 has a particular relationship with GPT2. In the present study, it was also revealed that the protein expression levels of GPT2 and ATF4 in MUT cells were higher than those in HCT116 cells, indicating that PI3K affected the GPT2 signaling pathway through ATF4.
PI3K does not directly affect ATF4 and GPT2, but through signal transduction molecules between them. In classical signal transduction pathways, PI3K often induces signal transduction via AKT or PDK1 (30,31). Our results demonstrated that PI3K could affect the expression of AKT and PDK1, and PDK1 expression was closely related to ATF4 and GPT2 expression, while AKT did not affect ATF4 and GPT2. These results indicated that PI3K affected ATF4 and GPT2 through PDK1 rather than AKT. In addition to PI3K affecting PDK1 and AKT, there appears to be no association between PI3K and MEK in the classical pathway. A previous study has reported that PI3K could induce signal transduction through P-Rex1 rescoping MEK, therefore it was considered that PI3K may also have a specific association with MEK (32). The subsequent results demonstrated our hypothesis that PI3K could affect the downstream signal transduction pathway through MEK, ATF4 and GPT2, indicating that MEK is one of the important downstream transduction molecules of PI3K signal transduction. Furthermore, based on our western blotting and PCR results, it was hypothesized that the effect of PI3K on MEK was related to P-Rex1. PI3K may affect MEK through P-Rex1. Combined with the research results of PI3K/PDK1, PI3K/AKT and other pathways, it was considered that the effect of PI3K on GPT2 mainly occurs through two pathways, the PI3K/PDK1/ATF4/GPT2 and PI3K/MEK/ATF4/GPT2 pathways. Significantly, the PI3K/MEK/ATF4/GPT2 pathway was identified for the first time in the present study.
Next, the most effective targets of inhibitors in the aforementioned pathways were detected through CCK-8 and flow cytometric assays. The results revealed that when PI3K inhibitor decreased the expression levels of RSK2, ATF4 and GPT2 proteins, the proliferation ability of the cells was also significantly decreased. Within 24 h, PI3K inhibitor inhibited ~53% of MUT cells at 10 µM. Compared with HCT116 cells, the inhibitory effect of the PI3K inhibitor was significant, and it had a strong killing effect on the cell lines. Numerous studies have revealed that PI3K inhibitors can induce cell cycle arrest and lead to systemic toxicity, including numerous physiological activities of cells involving growth factors (33,34), indicating that PI3K inhibitors are highly toxic. In addition, PI3K is an upstream signal transduction molecule. Except for PDK1, AKT and MEK in the present study, there may be numerous signal molecules downstream that are involved, such as mTOR, which affect different cell physiological activities (35). If PI3K is directly inhibited, it may have unpredictable effects. Therefore, other signal transduction molecules in the downstream of PI3K, as inhibitor targets were identified, which exhibited less toxicity (36).
To verify our hypothesis, PDK1, MEK or AKT inhibitors were used. The results revealed that when PDK1 and MEK were inhibited, ATF4 and GPT2 signal transduction pathways were also downregulated, inhibiting the proliferation and inducing apoptosis of MUT cells, whereas inhibition of AKT did not inhibit ATF4 and GPT2. These results again verified our previous hypothesis that the PI3K pathway affected GPT2 expression by PDK1 or MEK. Moreover, according to data comparisons, the inhibitory ability of MEK or PDK1 inhibitors on cell proliferation was slightly weaker than that of PI3K inhibitors, and thus MEK inhibitors and PDK1 inhibitors had lower cytotoxicity than PI3K inhibitors.
Single inhibitors are effective, but tumor cells will quickly become resistant to certain single inhibitors and a long-term therapeutic effect will not be achieved. In the research, it was determined that the PI3K/MEK and PI3K/PDK1 signal transduction pathways had no association, and thus combination of PDK1 and MEK inhibitors were used to suppress two different signaling pathways concurrently. Through various assays, it was revealed that combined inhibitor application could suppress the different pathways and achieve a more multifaceted effect to affect various physiological functions including cell proliferation. In vivo, the combined application of PDK1 and MEK inhibitors had the greatest antitumor effect. Moreover, MEK inhibitors exhibited a higher inhibitory effect on the growth of tumors in nude mice than PDK1 inhibitors, indicating that the PI3K/MEK pathway was more important than the PI3K/PDK1 pathway in the proliferation of MUT cells.
To summarize, in addition to the classical PI3K/PDK1 pathway, a new PI3K/MEK/GPT2 pathway was revealed in our study, which affected the metabolism of GPT2 and glutamine. This signaling pathway is a beneficial supplement to the classical PI3K signaling pathway and can further improve the molecular composition and function. Moreover, our study demonstrated that the proliferation of CRC cells could be inhibited by targeting the MEK signaling pathway, and combining the application of MEK and PDK1 inhibitors could achieve an improved antitumor effect. The present findings clarified the molecular mechanism of PIK3CA mutation on HCT116 cell proliferation and may provide new targets for the biotherapy of CRC cells.
Supplementary Material
Supporting Data
Acknowledgements
Not applicable.
Funding
The present study was supported by the National Natural Science Foundation of China Youth Fund Project (grant no. 81402351), the Natural Science Research Project of Anhui Provincial Department of Education (grant no. KJ2019A0415), the Anhui Province University Outstanding Young Talent Support Program (Key Program) (grant no. gxyqZD2019040) and the Reserve Candidates for Academic and Technical Leaders of Wannan Medical College. /p>
Availability of data and materials
The datasets used and/or analyzed during the current study are available from the corresponding author on reasonable request.
Authors' contributions
WC and BD conceived and designed the study. WC, YQ, LW and XH performed the experiments. All authors acquired, interpreted and analyzed the data. WC and BD wrote, reviewed and edited the manuscript for important intellectual content. WC and BD confirm the authenticity of all the raw data. All authors read and approved the manuscript and agree to be accountable for all aspects of the research in ensuring that the accuracy or integrity of any part of the work are appropriately investigated and resolved.
Ethics approval and consent to participate
The experiments conducted in the present study were approved by the Animal Welfare and Ethics Committee of Wannan Medical College (Wuhu, China).
Patient consent for publication
Not applicable.
Competing interests
The authors declare that they have no competing interests.
References
|
1
|
Han Y, Peng Y, Fu Y, Cai C, Guo C, Liu S, Li Y, Chen Y, Shen E, Long K, et al: MLH1 deficiency induces cetuximab resistance in colon cancer via Her-2/PI3K/AKT Signaling. Adv Sci (Weinh). 7:20001122020. View Article : Google Scholar : PubMed/NCBI
|
|
2
|
Samuels Y, Diaz LA Jr, Schmidt-Kittler O, Cummins JM, Delong L, Cheong I, Rago C, Huso DL, Lengauer C, Kinzler KW, et al: Mutant PIK3CA promotes cell growth and invasion of human cancer cells. Cancer Cell. 7:561–573. 2005. View Article : Google Scholar : PubMed/NCBI
|
|
3
|
Spandidos DA and Wilkie NM: Malignant transformation of early passage rodent cells by a single mutated human oncogene. Nature. 310:469–475. 1984. View Article : Google Scholar : PubMed/NCBI
|
|
4
|
Durrant TN and Hers I: PI3K inhibitors in thrombosis and cardiovascular disease. Clin Transl Med. 9:82020. View Article : Google Scholar : PubMed/NCBI
|
|
5
|
Mazloumi Gavgani F, Smith Arnesen V, Jacobsen RG, Krakstad C, Hoivik EA and Lewis AE: Class I Phosphoinositide 3-Kinase PIK3CA/p110α and PIK3CB/p110β isoforms in endometrial cancer. Int J Mol Sci. 19:39312018. View Article : Google Scholar : PubMed/NCBI
|
|
6
|
Blackburn PR, Milosevic D, Marek T, Folpe AL, Howe BM, Spinner RJ and Carter JM: PIK3CA mutations in lipomatosis of nerve with or without nerve territory overgrowth. Mod Pathol. 33:420–430. 2020. View Article : Google Scholar : PubMed/NCBI
|
|
7
|
Murakami K, Kanto A, Sakai K, Miyagawa C, Takaya H, Nakai H, Kotani Y, Nishio K and Matsumura N: Frequent PIK3CA mutations in eutopic endometrium of patients with ovarian clear cell carcinoma. Mod Pathol. doi: https://doi.org/10.1101/2021.02.25.432943. 2021. View Article : Google Scholar
|
|
8
|
Paleari L, Puntoni M, Clavarezza M, DeCensi M, Cuzick J and DeCensi A: PIK3CA mutation, aspirin use after diagnosis and survival of colorectal cancer. A systematic review and meta-analysis of epidemiological studies. Clin Oncol (R Coll Radiol). 28:317–326. 2016. View Article : Google Scholar
|
|
9
|
Tzanikou E, Markou A, Politaki E, Koutsopoulos A, Psyrri A, Mavroudis D, Georgoulias V and Lianidou E: PIK3CA hotspot mutations in circulating tumor cells and paired circulating tumor DNA in breast cancer: A direct comparison study. Mol Oncol. 13:2515–2530. 2019. View Article : Google Scholar : PubMed/NCBI
|
|
10
|
Ikenoue T, Kanai F, Hikiba Y, Obata T, Tanaka Y, Imamura J, Ohta M, Jazag A, Guleng B, Tateishi K, et al: Functional analysis of PIK3CA gene mutations in human colorectal cancer. Cancer Res. 65:4562–4567. 2005. View Article : Google Scholar : PubMed/NCBI
|
|
11
|
Ghodsinia AA, Lego JMT and Garcia RL: Mutation-associated phenotypic heterogeneity in novel and canonical PIK3CA helical and kinase domain mutants. Cells. 9:11162020. View Article : Google Scholar : PubMed/NCBI
|
|
12
|
Sun B, Jiang Y, Cui H, Fang X, Han G, Dai X, Zhou S, Mao H and Wang B: Activating PIK3CA mutation promotes adipogenesis of adipose-derived stem cells in macrodactyly via up-regulation of E2F1. Cell Death Dis. 11:6002020. View Article : Google Scholar : PubMed/NCBI
|
|
13
|
Vasan N, Razavi P, Johnson JL, Shao H, Shah H, Antoine A, Ladewig E, Gorelick A, Lin TY, Toska E, et al: Double PIK3CA mutations in cis increase oncogenicity and sensitivity to PI3Kα inhibitors. Science. 366:714–723. 2019. View Article : Google Scholar : PubMed/NCBI
|
|
14
|
Hong X, Zhong L, Xie Y, Zheng K, Pang J, Li Y, Yang Y, Xu X, Mi P, Cao H, et al: Matrine reverses the Warburg effect and suppresses colon cancer cell growth via negatively regulating HIF-1α. Front Pharmacol. 10:14372019. View Article : Google Scholar : PubMed/NCBI
|
|
15
|
Momi N, Wali RK, Chhaparia A, Calderwood AH, Tiwari A, Ledbetter SE, DeLaCruz M and Roy HK: Su2000 PRDM16 is a novel proto-oncogene in colorectal cancer (CRC): Modulation of the early Warburg effect in field carcinogenesis. Gastroenterology. 150 (Suppl):S6062016. View Article : Google Scholar
|
|
16
|
Giuliani N, Chiu M, Bolzoni M and Bussolati O: Glutamine dependence and PIK3CA mutations in colon-rectal cancer cells: ATF4 enters the stage. Transl Cancer Res. 5 (Suppl 4):S885–S888. 2016. View Article : Google Scholar
|
|
17
|
Hao Y, Samuels Y, Li Q, Krokowski D, Guan BJ, Wang C, Jin Z, Dong B, Cao B, Feng X, et al: Oncogenic PIK3CA mutations reprogram glutamine metabolism in colorectal cancer. Nat Commun. 7:119712016. View Article : Google Scholar : PubMed/NCBI
|
|
18
|
Feng X, Hao Y and Wang Z: Targeting glutamine metabolism in PIK3CA Mutant colorectal cancers. Genes Dis. 3:241–243. 2016. View Article : Google Scholar : PubMed/NCBI
|
|
19
|
Kim M, Gwak J, Hwang S, Yang S and Jeong SM: Mitochondrial GPT2 plays a pivotal role in metabolic adaptation to the perturbation of mitochondrial glutamine metabolism. Oncogene. 38:4729–4738. 2019. View Article : Google Scholar : PubMed/NCBI
|
|
20
|
Elefteriou F, Benson MD, Sowa H, Starbuck M, Liu X, Ron D, Parada LF and Karsenty G: ATF4 mediation of NF1 functions in osteoblast reveals a nutritional basis for congenital skeletal dysplasiae. Cell Metab. 4:441–451. 2006. View Article : Google Scholar : PubMed/NCBI
|
|
21
|
Slattery ML, Lundgreen A, Herrick JS and Wolff RK: Genetic variation in RPS6KA1, RPS6KA2, RPS6KB1, RPS6KB2, and PDK1 and risk of colon or rectal cancer. Mutat Res. 706:13–20. 2011. View Article : Google Scholar : PubMed/NCBI
|
|
22
|
Qiu Q, Jiang J, Lin L, Cheng S, Xin D, Jiang W, Shen J and Hu Z: Downregulation of RSK2 influences the biological activities of human osteosarcoma cells through inactivating AKT/mTOR signaling pathways. Int J Oncol. 48:2508–2520. 2016. View Article : Google Scholar : PubMed/NCBI
|
|
23
|
Tserga A, Chatziandreou I, Michalopoulos NV, Patsouris E and Saetta AA: Mutation of genes of the PI3K/AKT pathway in breast cancer supports their potential importance as biomarker for breast cancer aggressiveness. Virchows Arch. 469:35–43. 2016. View Article : Google Scholar : PubMed/NCBI
|
|
24
|
Cheng H, Liu P, Ohlson C, Xu E, Symonds L, Isabella A, Muller WJ, Lin NU, Krop IE, Roberts TM, et al: PIK3CA(H1047R)- and Her2-initiated mammary tumors escape PI3K dependency by compensatory activation of MEK-ERK signaling. Oncogene. 35:2961–2970. 2016. View Article : Google Scholar : PubMed/NCBI
|
|
25
|
Dillon LM, Bean JR, Yang W, Shee K, Symonds LK, Balko JM, McDonald WH, Liu S, Gonzalez-Angulo AM, Mills GB, et al: P-REX1 creates a positive feedback loop to activate growth factor receptor, PI3K/AKT and MEK/ERK signaling in breast cancer. Oncogene. 34:3968–3976. 2015. View Article : Google Scholar : PubMed/NCBI
|
|
26
|
Toth K, Kuppuswamy M, Shashkova EV, Spencer JF and Wold WS: A fully replication-competent adenovirus vector with enhanced oncolytic properties. Cancer Gene Ther. 17:761–770. 2010. View Article : Google Scholar : PubMed/NCBI
|
|
27
|
Yano S, Takehara K, Miwa S, Kishimoto H, Tazawa H, Urata Y, Kagawa S, Bouvet M, Fujiwara T and Hoffman RM: In vivo isolation of a Highly-aggressive variant of Triple-negative human breast cancer MDA-MB-231 using serial orthotopic transplantation. Anticancer Res. 36:3817–3820. 2016. View Article : Google Scholar : PubMed/NCBI
|
|
28
|
Singleton DC and Harris AL: Targeting the ATF4 pathway in cancer therapy. Expert Opin Ther Targets. 16:1189–1202. 2012. View Article : Google Scholar : PubMed/NCBI
|
|
29
|
Juliana CA, Yang J, Cannon CE, Good AL, Haemmerle MW and Stoffers DA: A PDX1-ATF transcriptional complex governs β cell survival during stress. Mol Metab. 17:39–48. 2018. View Article : Google Scholar : PubMed/NCBI
|
|
30
|
Aoki M and Fujishita T: Oncogenic roles of the PI3K/AKT/mTOR axis. Curr Top Microbiol Immunol. 407:153–189. 2017.PubMed/NCBI
|
|
31
|
Lien EC, Dibble CC and Toker A: PI3K signaling in cancer: Beyond AKT. Curr Opin Cell Biol. 45:62–71. 2017. View Article : Google Scholar : PubMed/NCBI
|
|
32
|
Ebi H, Costa C, Faber AC, Nishtala M, Kotani H, Juric D, Della Pelle P, Song Y, Yano S, Mino-Kenudson M, et al: PI3K regulates MEK/ERK signaling in breast cancer via the Rac-GEF, P-Rex1. Proc Natl Acad Sci USA. 110:21124–21129. 2013. View Article : Google Scholar : PubMed/NCBI
|
|
33
|
Salles B, Calsou P, Frit P and Muller C: The DNA repair complex DNA-PK, a pharmacological target in cancer chemotherapy and radiotherapy. Pathol Biol (Paris). 54:185–193. 2006. View Article : Google Scholar : PubMed/NCBI
|
|
34
|
Bartalucci N, Guglielmelli P and Vannucchi AM: Rationale for targeting the PI3K/Akt/mTOR pathway in myeloproliferative neoplasms. Clin Lymphoma Myeloma Leuk. 13 (Suppl 2):S307–S309. 2013. View Article : Google Scholar : PubMed/NCBI
|
|
35
|
Bao HR, Chen JL, Li F, Zeng XL and Liu XJ: Relationship between PI3K/mTOR/RhoA pathway-regulated cytoskeletal rearrangements and phagocytic capacity of macrophages. Braz J Med Biol Res. 53:e92072020. View Article : Google Scholar : PubMed/NCBI
|
|
36
|
Costa C, Ebi H, Martini M, Beausoleil SA, Faber AC, Jakubik CT, Huang A, Wang Y, Nishtala M, Hall B, et al: Measurement of PIP Levels reveals an unexpected role for p110β in early adaptive responses to p110α-specific inhibitors in luminal breast cancer. Cancer Cell. 27:97–108. 2015. View Article : Google Scholar : PubMed/NCBI
|


