Introduction
Renal cell carcinoma (RCC), which originates from
renal tubular epithelium, has become one of the most commonly
occurring malignant tumors. Over the course of the last 20 years,
the incidence rate of RCC has been on the rise, accounting for
~2–3% of all new cancer patients (1). Renal clear RCC (ccRCC) is the main
subtype of RCC (2). Regrettably,
numerous patients with ccRCC are diagnosed with advanced tumors,
and 25–30% of patients are identified as having tumor metastasis at
the time of diagnosis (3). At
present, the great strides that have been made in terms of
comprehensive treatment strategies have greatly improved the
prognosis of patients with ccRCC, although these treatment schemes
have poor efficacy for certain patients (1,4).
Consequently, there is an urgent need to find novel markers for the
diagnosis and prediction of curative effect of ccRCC.
The development of bioinformatics analysis in recent
years has rendered it possible to explore gene regulatory networks
(5). In the present study,
differentially expressed genes (DEGs) were screened from GSE40435,
protein-protein interaction (PPI) analysis was subsequently used to
determine the interaction between DEGs, and finally a cytoHubba
plug-in was used to identify hub genes in Cytoscape. These hub
genes were verified through multiple databases, which enabled the
target gene enolase (ENO2) to be ultimately selected.
ENO2, also known as neuron specific enolase (NSE),
is mainly distributed in neuroendocrine cells. It is recognized as
a tumor marker that fulfills an important role in tumor development
(6). ENO2 is highly expressed in
glioblastoma cells, wherein it activates the PI3K/Akt and
anti-apoptotic signaling pathways (7,8). In
glioblastoma cells, ENO2 has also been shown to indirectly regulate
the participation of actin in tumor migration (9,10).
In addition, the serum ENO2 level may be used as a prognostic
marker for patients with pancreatic endocrine tumors and melanoma
(11). Another recently published
study reported that ENO2 overexpression impacts the prognosis of
patients with ccRCC through participating in the glycolytic process
of cancer cells in papillary RCC (12). The aim of the present study was to
examine the potential role and function of ENO2 in the immune
microenvironment and in the growth of ccRCC. During the course of
this study, it was identified that ENO2 is highly expressed in
ccRCC, acting as an independent risk factor for predicting the
prognosis of patients. A series of in vitro experiments
showed that knockdown of ENO2 could affect the
epithelial-mesenchymal transition (EMT) process of tumors, and
inhibit the migration and proliferation of ccRCC cell lines.
Finally, it was found that the expression of ENO2 is closely
associated with tumor immune infiltration, and may affect the
effects of immune checkpoint blockade (ICB) in patients with
ccRCC.
Materials and methods
Public data acquisition
The Gene Expression Omnibus (GEO) database
(https://www.ncbi.nlm.nih.gov/geo/)
was used to query the gene expression information of the GSE40435,
GSE46699 and GSE53757 datasets. The clinicopathological data and
RNA-sequencing (RNA-seq) data of 531 patients with ccRCC were
obtained from The Cancer Genome Atlas (TCGA) database (https://portal.gdc.cancer.gov/).
PPI analysis
The STRING website (https://string-db.org/cgi/) was utilized for PPI
analysis (13), and the 30 top hub
genes were identified through Cytoscape (14,15).
Patients and specimens
The present study was approved (approval no.
EHBHKY2021-01-005) by the ethics committee of Second Military
Medical University (Shanghai, China). Written informed consent was
obtained from all patients. Clinical specimens of RCC, together
with paired adjacent tissues, were collected from 191 patients who
underwent surgical treatment in the urology department of Third
Affiliated Hospital of the Second Military Medical University
(Shanghai, China) between October 2014 and February 2019.
Clinicopathological variables of these samples were collected, as
shown in Table SI. Two
pathologists evaluated the pathological characteristics of
ccRCC.
Immunohistochemistry (IHC)
analysis
IHC was performed according to the previously
described protocol (16) using
rabbit anti-ENO2 antibody (1:1,000; cat. no. ab79757; Abcam). The
score of staining intensity was defined as follows: Negative, 0;
weak, 1; moderate, 2; and strong, 3. The frequency of positive
cells was defined as follows: <5, 0; 5–25, 1; 26–50, 2; 51–75,
and 3; >75%, 4. Two independent pathologists calculated the
H-scores.
Cell lines
In the present study, a normal renal tubular
epithelial cell line (HK-2) and RCC cell lines (Caki-1, ACHN, A498,
786-O and 769-P) were purchased from the Chinese Academy of
Sciences (Shanghai, China). All cell lines were cultured in 5%
CO2 at 37°C. The media used were Gibco® McCoy
5A medium, Gibco® RPMI-1640 medium and Dulbecco's
modified Eagle's medium (DMEM) (Thermo Fisher Scientific, Inc.).
The culture medium contained 10% Gibco® fetal bovine
serum and 1% penicillin/streptomycin (Thermo Fisher Scientific,
Inc.).
Reverse transcription-quantitative
(RT-q) PCR
TRIzol™ (Invitrogen; Thermo Fisher Scientific, Inc.)
was used to extract the total RNA of the cell lines, and
PrimeScript™ RT Master Mix (Takara Bio, Inc.) was subsequently used
to reverse-transcribe the RNA into cDNA according to the
manufacturer's instructions. Finally, TB Green® Fast
qPCR Mix (Takara Bio, Inc.) was used for RT-qPCR as follows:
Pre-denaturation at 95°C for 30 sec; 40 cycles of denaturation at
95°C for 5 sec, annealing at 55°C for 30 sec and extension at 72°C
for 30 sec. mRNA expression levels were quantified using the
2−ΔΔCq method (17),
and were standardized against those of β-actin. The primer
sequences were as follows: β-actin forward,
5′-GTACGCCAACACAGTGCTG-3′ and reverse, 5′-CGTCATACTCCTGCTTGCTG-3′;
and ENO2 forward, 5′-AGCCTCTACGGGCATCTATGA-3′ and reverse,
5′-TTCTCAGTCCCATCCAACTCC-3′.
Gene ontology (GO) analysis and gene
set enrichment analysis (GSEA)
According to the median expression level of ENO2,
531 RCC samples from the TCGA cohort were split into groups with
high and low ENO2 expression. The ‘clusterProfiler’ package was
used for GO analysis and GSEA (18) in order to further analyze the
biological functional differences between the two groups of
samples.
Validation of ENO2 function in ccRCC
progression in vitro
The RCC cells were transfected with short hairpin
(sh)RNAs expressing lentivirus, as per the manufacturer's
instructions. The shRNA lentiviral plasmid and its negative control
reagents were purchased from TsingKe Biological Technology. shENO2
cells were obtained by antibiotic selection using puromycin (5
µg/ml). The shRNA sequence was as follows:
5′-GCCGGACATAACTTCCGTAAT-3′. The plasmid used as interference
vector was PDS278_pL-U6-shRNA-GFP-ccdB-puro.
Cell counting Kit-8 (CCK-8) cell
proliferation assay
The cells were inoculated into 96-well plates (2,000
cells per well) and cultured for 0, 24, 48 and 72 h respectively,
prior to evaluation using CCK-8 (10 µl/well, Biosharp Life
Sciences). Next, the cells were incubated at 37°C for 1 h. Finally,
the absorbance was measured at 450 nm.
Transwell and Matrigel assays
The cells were suspended in FBS-free medium, and 200
µl cell suspension was inoculated into the wells of the Transwell
chamber (Corning, Inc.; 1×10⁵ cells per well). For
invasion assay, the Transwell chambers were pre-coated with
Matrigel (Corning, Inc.) and incubated at 37°C for 24 h.
Subsequently, 800 µl medium containing 15% FBS was added at the
bottom of the chamber. After 48 h, the cells were treated with 4%
paraformaldehyde at room temperature for 20 min. Subsequently, the
cells were stained with 0.1% crystal violet at room temperature for
30 min, and finally the cells were washed with PBS. The stained
cells were counted and images were captured under an optical
microscope.
Western blot analysis of the
model
The total protein was extracted from cells by NP-40
Lysis Buffer (Beyotime Institute of Biotechnology, Inc.). The
protein concentrations were measured by BCA P rotein Assay Kit
(Epizyme, Inc.) according to the manufacturer's instructions.
Proteins (30 µg/per lane) were extracted using 10% SDS-PAGE and
transferred to a nitrocellulose membrane (Thermo Fisher Scientific,
Inc.). The membranes were blocked using Protein Free Rapid Blocking
buffer (Epizyme, Inc.) at room temperature for 10 min, and then
incubated overnight at 4°C with the following primary antibodies:
ENO2 (1:1,000; cat. no. ab79757; Abcam), N-cadherin (1:1,000; cat.
no. A19083), VIM (1:1,000; cat. no. A19607) and β-actin (1:50,000;
cat. no. AC026; all from ABclonal Biotech Co., Ltd.). After washing
the membrane, a secondary antibody (horseradish
peroxidase-conjugated goat anti-rabbit (1:5,000; cat. no. BS13278;
Bioworld Technology, Inc.) was added at room temperature for 30
min. Finally, enhanced chemiluminescence reagent (Biosharp Life
Sciences) was used to detect the amounts of proteins.
Immune infiltration analysis
Bindea et al (19) reported various marker genes of
immune cells. The single-sample GSEA (ssGSEA) method was used to
analyze the immune infiltration of TCGA samples (20). Finally, the degree of correlation
between ENO2 and the aforementioned 24 types of immune cells was
analyzed using Pearson's correlation method.
Analysis of the correlation of ENO2
expression with the tumor immune dysfunction and exclusion (TIDE)
score
The samples in TCGA dataset were scored using the
TIDE algorithm, and the efficacy of ICB was predicted by analyzing
the association between ENO2 expression and TIDE score (21).
Statistical methods
The Wilcoxon signed rank test was used for paired
samples, and the Wilcoxon rank sum test was used for unpaired
samples. Survival curves were constructed, and the survival rate
was calculated using the Kaplan-Meier method and the log-rank test.
Univariate and multivariate Cox regression analyses were used to
determine the independent prognostic factors, and the threshold for
the P-value included in multivariate analysis was 0.1. Pearson
correlation analysis was used to determine the correlation between
ENO2 and the expression levels of other genes. The ‘timeROC’
package was used to plot the receiver operating characteristic
(ROC) curves. The mean ± standard deviation (SD) was used to
express numerical data. P<0.05 was considered to indicate a
statistically significant difference. R language (version 4.0.3,
RStudio, lnc.) was used for all statistical analyses.
Results
ENO2 may have a significant role in
ccRCC as a hub gene
R language was used to analyze the GSE40435 dataset,
and 220 DEGs were screened out (Fig.
1A). The correlation between these DEGs was subsequently
analyzed using a string PPI network (Fig. 1B). A total of 30 top genes were
screened for possible hub genes based on the results of the
Cytoscape software (Fig. 1B and
C). The 30 genes were then analyzed according to prognosis in
TCGA database, and 16 prognostic genes were screened out (Fig. 1D). The datasets of GSE46699 and
GSE53757 were selected to perform the difference analysis, and the
top 50 up- and downregulated genes with the highest level of
expression were examined. These were found to intersect with
GSE40435 to screen ENO2 (Fig. 1E and
F), indicating that ENO2 may be a key player in the development
of ccRCC as an oncogene.
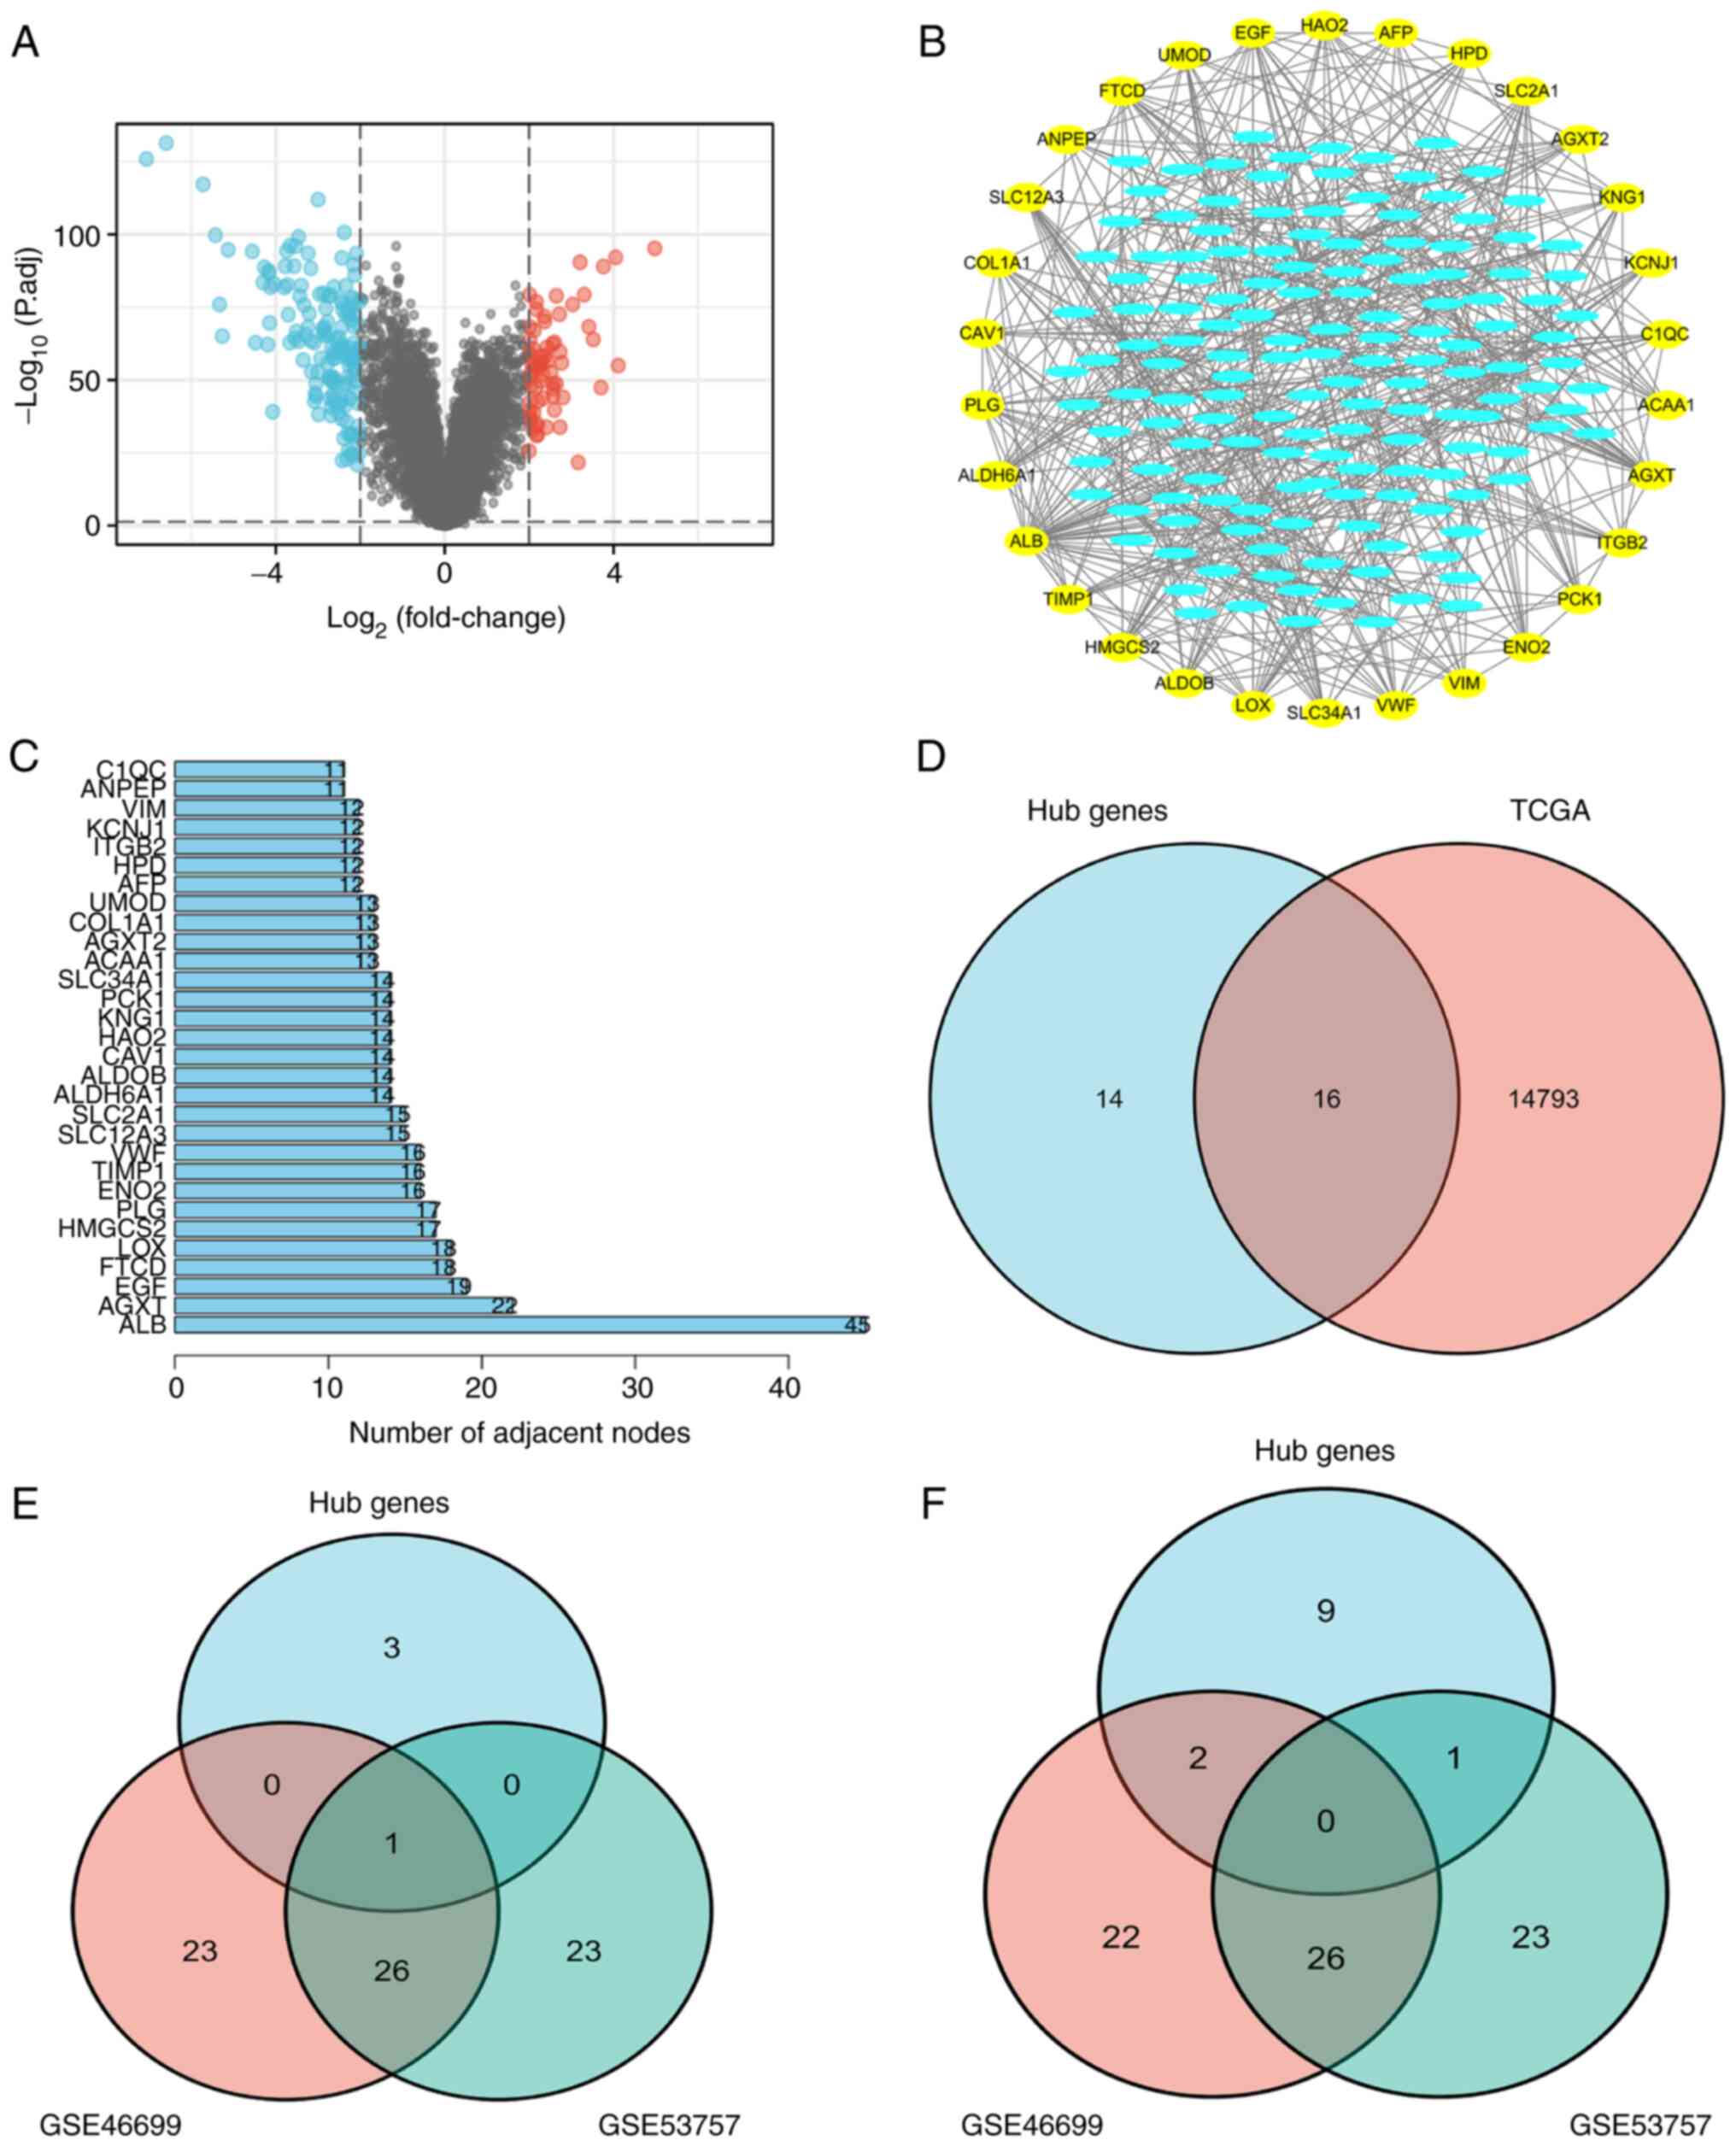 | Figure 1.Screening for differential genes via
TCGA and the GEO database. (A) Screening of 220 upregulated genes
compared with normal tissues in GSE40435 (|log2(FC)|>2,
P<0.05). (B and C) By analyzing the association among the 220
DEGs, a PPI network was established. A total of 30 top hub genes
were finally selected, which are shown in the outer circle. (D) A
total of 16 hub genes associated with prognosis were screened
according to TCGA database. (E) Compared with normal tissues, 50
upregulated genes were screened in GSE46699 and GSE53757
(|log2(FC)|>2, P<0.05), and one target gene was screened out.
(F) Compared with normal tissues, 50 downregulated genes were
screened in GDE46699 and GSE53757 (|log2(FC)|>2, P<0.05), and
no hub genes were screened out. GEO, Gene Expression Omnibus; DEG,
differentially expressed gene; TCGA, The Cancer Genome Atlas; PPI,
protein-protein interaction. |
ENO2 is highly expressed in TCGA and
clinical ccRCC cohorts, and its upregulation is associated with
clinical prognosis
Subsequently, the expression pattern of ENO2 in the
available ccRCC dataset was examined in order to illustrate the
potential impact of ENO2. The results of the paired or unpaired
sample analysis showed that ENO2 expression was more prominent in
ccRCC tissues compared with normal tissues (Fig. 2A and B). Furthermore, low ENO2
expression in patients with ccRCC was associated with improved
overall survival (OS) and disease-free survival rates according to
the prognostic analyses (Fig. 2C and
D). ENO2 expression was identified as a predictor of OS in
patients with ccRCC through univariate and multivariate Cox
analyses (Table I). Time-dependent
ROC analysis revealed that the area under the curve (AUC) was
0.593, 0.626 and 0.679 when the 3-, 5- and 10-year OS rates
respectively were taken as the endpoint of the TCGA cohort
(Fig. 2E).
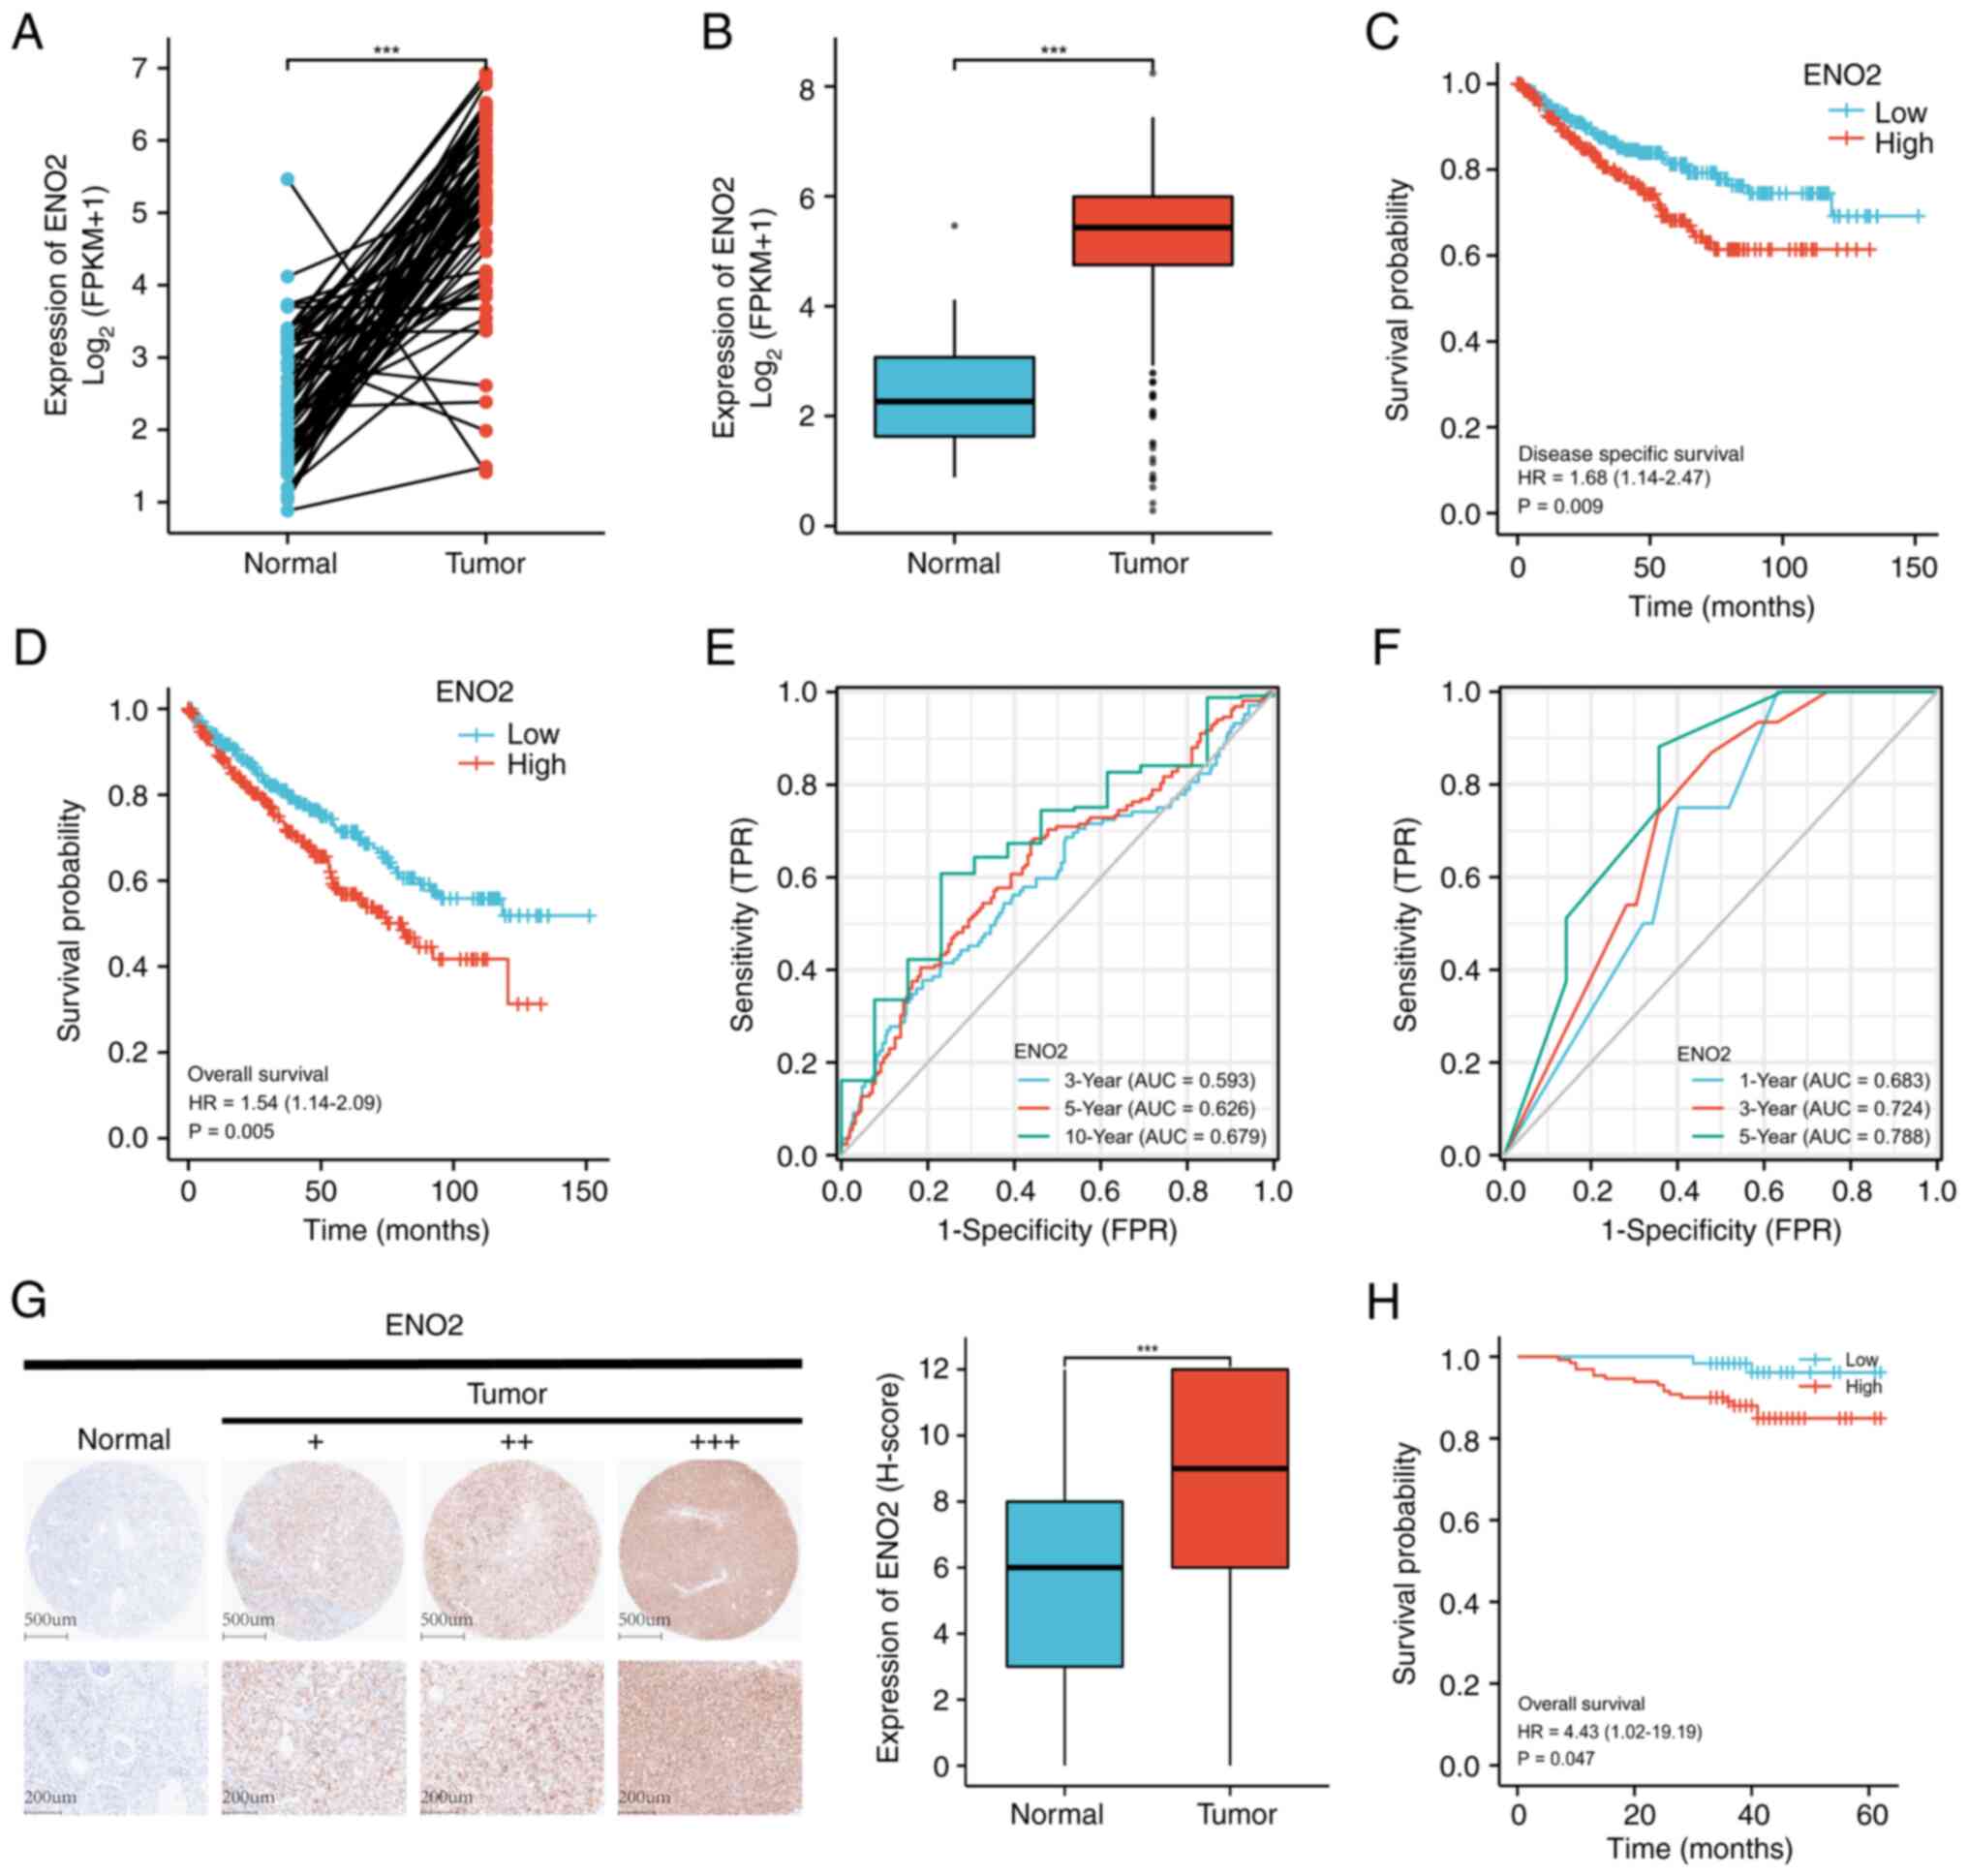 | Figure 2.ENO2 high expression is associated
with clinical prognosis in ccRCC. (A) ENO2 expression levels in
TCGA dataset unpaired samples (P<0.05). (B) ENO2 expression
levels in TCGA dataset paired samples (P<0.05). (C) The TCGA
dataset's DSS analysis of the ENO2 high- and low-expression groups
(P<0.05) is shown. (D) The TCGA dataset's OS analysis of the
ENO2 high- and low-expression groups is shown (P<0.05). (E) The
ROC curves used in the TCGA cohort to predict the 3-, 5-, and
10-year OS rates of patients with ccRCC based on the ENO2 level.
(F) The ROC curves used in the external validation cohort to
predict the 1-, 3-, and 5-year OS of patients with ccRCC based on
the ENO2 level (H-score). (G) ENO2 expression levels in the
external validation cohort (P<0.05) are shown; the IHC images
represent ENO2 protein expression in ccRCC and adjacent tissues.
(H) The external validation cohort dataset's OS analysis of the
ENO2 high- and low-expression groups (P<0.05). ***P<0.001.
ENO2, enolase 2; ccRCC, clear cell renal cell carcinoma; TCGA, The
Cancer Genome Atlas; ROC, receiver operating characteristic; DSS,
disease-free survival; OS, overall survival; IHC,
immunohistochemistry analysis. |
 | Table I.Univariate and multivariate analysis
of the correlation between ENO2 expression and overall survival in
The Cancer Genome Atlas patients with clear cell renal cell
carcinoma. |
Table I.
Univariate and multivariate analysis
of the correlation between ENO2 expression and overall survival in
The Cancer Genome Atlas patients with clear cell renal cell
carcinoma.
|
|
| Univariate
analysis | Multivariate
analysis |
|---|
|
|
|
|
|
|---|
|
Characteristics | Total (n) | Hazard ratio (95%
CI) | P-value | Hazard ratio (95%
CI) | P-value |
|---|
| T stage | 539 |
|
|
|
|
| T1 and
T2 | 349 | Reference |
|
|
|
| T3 and
T4 | 190 | 3.228
(2.382–4.374) | <0.001 | 1.648
(0.723–3.756) | 0.235 |
| N stage | 257 |
|
|
|
|
| N0 | 241 | Reference |
|
|
|
| N1 | 16 | 3.453
(1.832–6.508) | <0.001 | 1.711
(0.857–3.418) | 0.128 |
| M stage | 506 |
|
|
|
|
| M0 | 428 | Reference |
|
|
|
| M1 | 78 | 4.389
(3.212–5.999) |
| 2.861
(1.679–4.875) | <0.001 |
| Pathologic
stage | 536 |
|
|
|
|
| Stages
I and II | 331 | Reference |
|
|
|
| Stages
III and IV | 205 | 3.946
(2.872–5.423) | <0.001 | 1.146
(0.449–2.921) | 0.776 |
| Sex | 539 |
|
|
|
|
|
Female | 186 | Reference |
|
|
|
|
Male | 353 | 0.930
(0.682–1.268) | 0.648 |
|
|
| Age | 539 |
|
|
|
|
|
<=60 | 269 | Reference |
|
|
|
|
>60 | 270 | 1.765
(1.298–2.398) | <0.001 | 1.725
(1.123–2.652) | 0.013 |
| Histologic
grade | 531 |
|
|
|
|
|
G1&G2 | 249 | Reference |
|
|
|
|
G3&G4 | 282 | 2.702
(1.918–3.807) | <0.001 | 1.710
(1.038–2.816) | 0.035 |
|
ENO2 | 539 | 1.317
(1.124–1.544) | <0.001 | 1.263
(1.033–1.545) | 0.023 |
The IHC results revealed that ccRCC tissues (n=191)
exhibited more positive cells and a higher degree of ENO2 antibody
staining compared with the nearby normal tissues (n=177), and a
representative IHC image is shown in Fig. 2G. ENO2 expression was found to be a
predictor of OS in patients with ccRCC through using univariate and
multivariate Cox analyses (Table
II). The optimal cut-off number was 6 (H-score) according to
AUC, which was calculated using 5-year survival data and was 0.788
(Fig. 2F). In accordance with the
cutoff value, the patients were subsequently classified into two
groups: The ENO2 high expression group (n=130) and the ENO2 low
expression group (n=61). Patients with low expression of ENO2 had
superior OS rates according to the Kaplan-Meier analysis (Fig. 2H).
| Table II.Univariate and multivariate analysis
of the correlation between ENO2 expression and overall survival in
Third Affiliated Hospital of the Second Military Medical University
patients with clear cell renal cell carcinoma. |
Table II.
Univariate and multivariate analysis
of the correlation between ENO2 expression and overall survival in
Third Affiliated Hospital of the Second Military Medical University
patients with clear cell renal cell carcinoma.
|
|
| Univariate
analysis | Multivariate
analysis |
|---|
|
|
|
|
|
|---|
|
Characteristics | Total (n) | Hazard ratio (95%
CI) | P-value | Hazard ratio (95%
CI) | P-value |
|---|
| Age | 191 | 1.043
(1.004–1.084) | 0.031 | 1.032
(0.988–1.077) | 0.153 |
| Sex | 191 |
|
|
|
|
|
Male | 130 | Reference |
|
|
|
|
Female | 61 | 0.741
(0.267–2.058) | 0.565 |
|
|
| Fuhrman | 191 |
|
|
|
|
| Furhman
I | 25 | Reference |
|
|
|
| Furhman
II | 128 | 1.086
(0.238–4.962) | 0.916 | 0.922
(0.197–4.310) | 0.918 |
| Furhman
III | 24 | 3.783
(0.762–18.777) | 0.104 | 2.141
(0.388–11.814) | 0.383 |
| Furhman
IV | 14 | 0.935
(0.085–10.316) | 0.956 | 0.449
(0.039–5.126) | 0.519 |
| Stage | 191 |
|
|
|
|
| Stage
1 | 154 | Reference |
|
|
|
| Stage
2 | 14 | 4.373
(1.160–16.486) | 0.029 | 3.578
(0.892–14.349) | 0.072 |
| Stage
3 | 22 | 6.692
(2.426–18.457) | <0.001 | 5.504
(1.897–15.973) | 0.002 |
| Stage
4 | 1 | 137.741
(13.295–1427.065) | <0.001 | 27.013
(2.027–359.924) | 0.013 |
| ENO2 (H-score) | 191 | 1.209
(1.021–1.433) | 0.028 | 1.233
(1.031–1.474) | 0.022 |
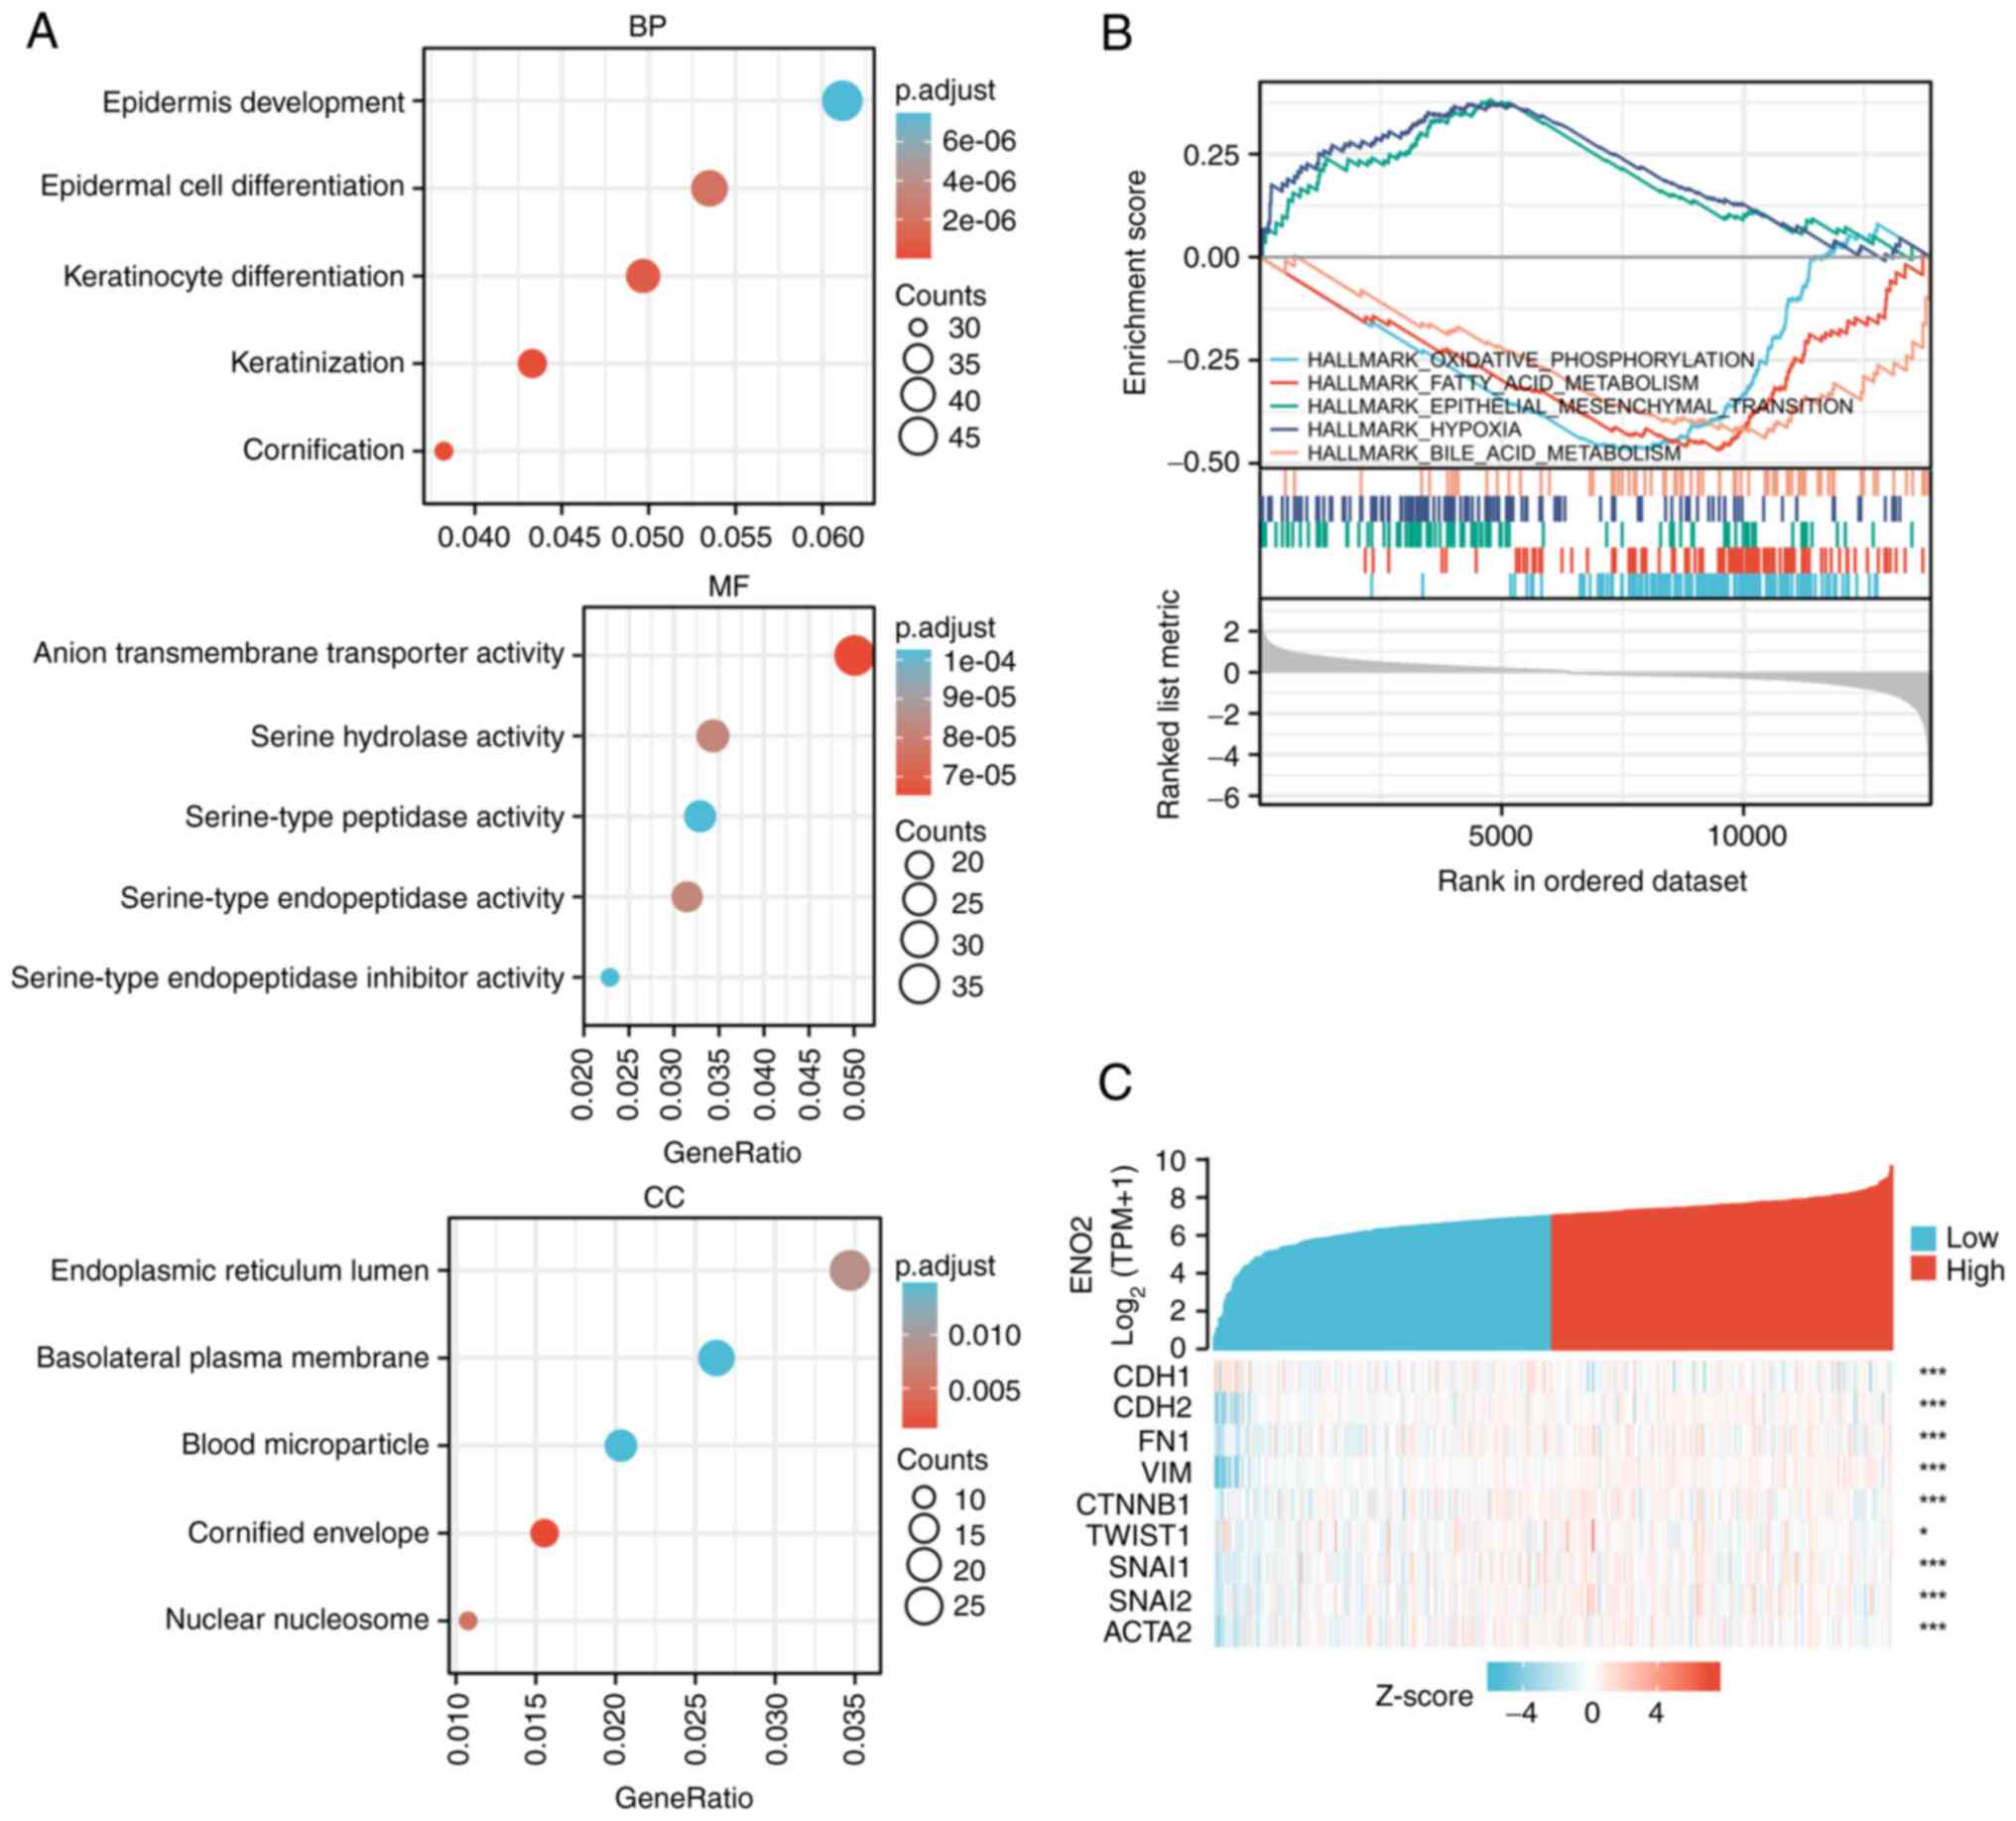
GO and GSEA analysis of ENO2
expression
To further study the underlying molecular mechanism
of ENO2 in the progression of ccRCC, 18,521 DEGs were screened from
TCGA transcriptome data, and the 2,440 genes whose expression
levels were most closely linked with the expression of ENO2 were
then extracted. ENO2 was found to be mainly associated with the
processes of keratinocyte differentiation, keratinization and
epidermal cell differentiation according to GO analysis, and the
intracellular locations where ENO2 was mainly active were the
nuclear nucleosome, endoplasmic reticulum lumen and cornified
envelope (Fig. 3A).
The biological functions associated with ENO2 were
subsequently determined by GSEA. These findings demonstrated that
ENO2 was closely correlated with a number of cancer-associated
pathways, including EMT, oxidative phosphorylation, fatty acid
metabolism, hypoxia and bile acid metabolism (Fig. 3B). Among these, the EMT pathway was
found to have the highest enrichment score. Moreover, public data
of RCC in TCGA showed that ENO2 expression was highly correlated
with multiple currently known EMT marker genes (Fig. 3C).
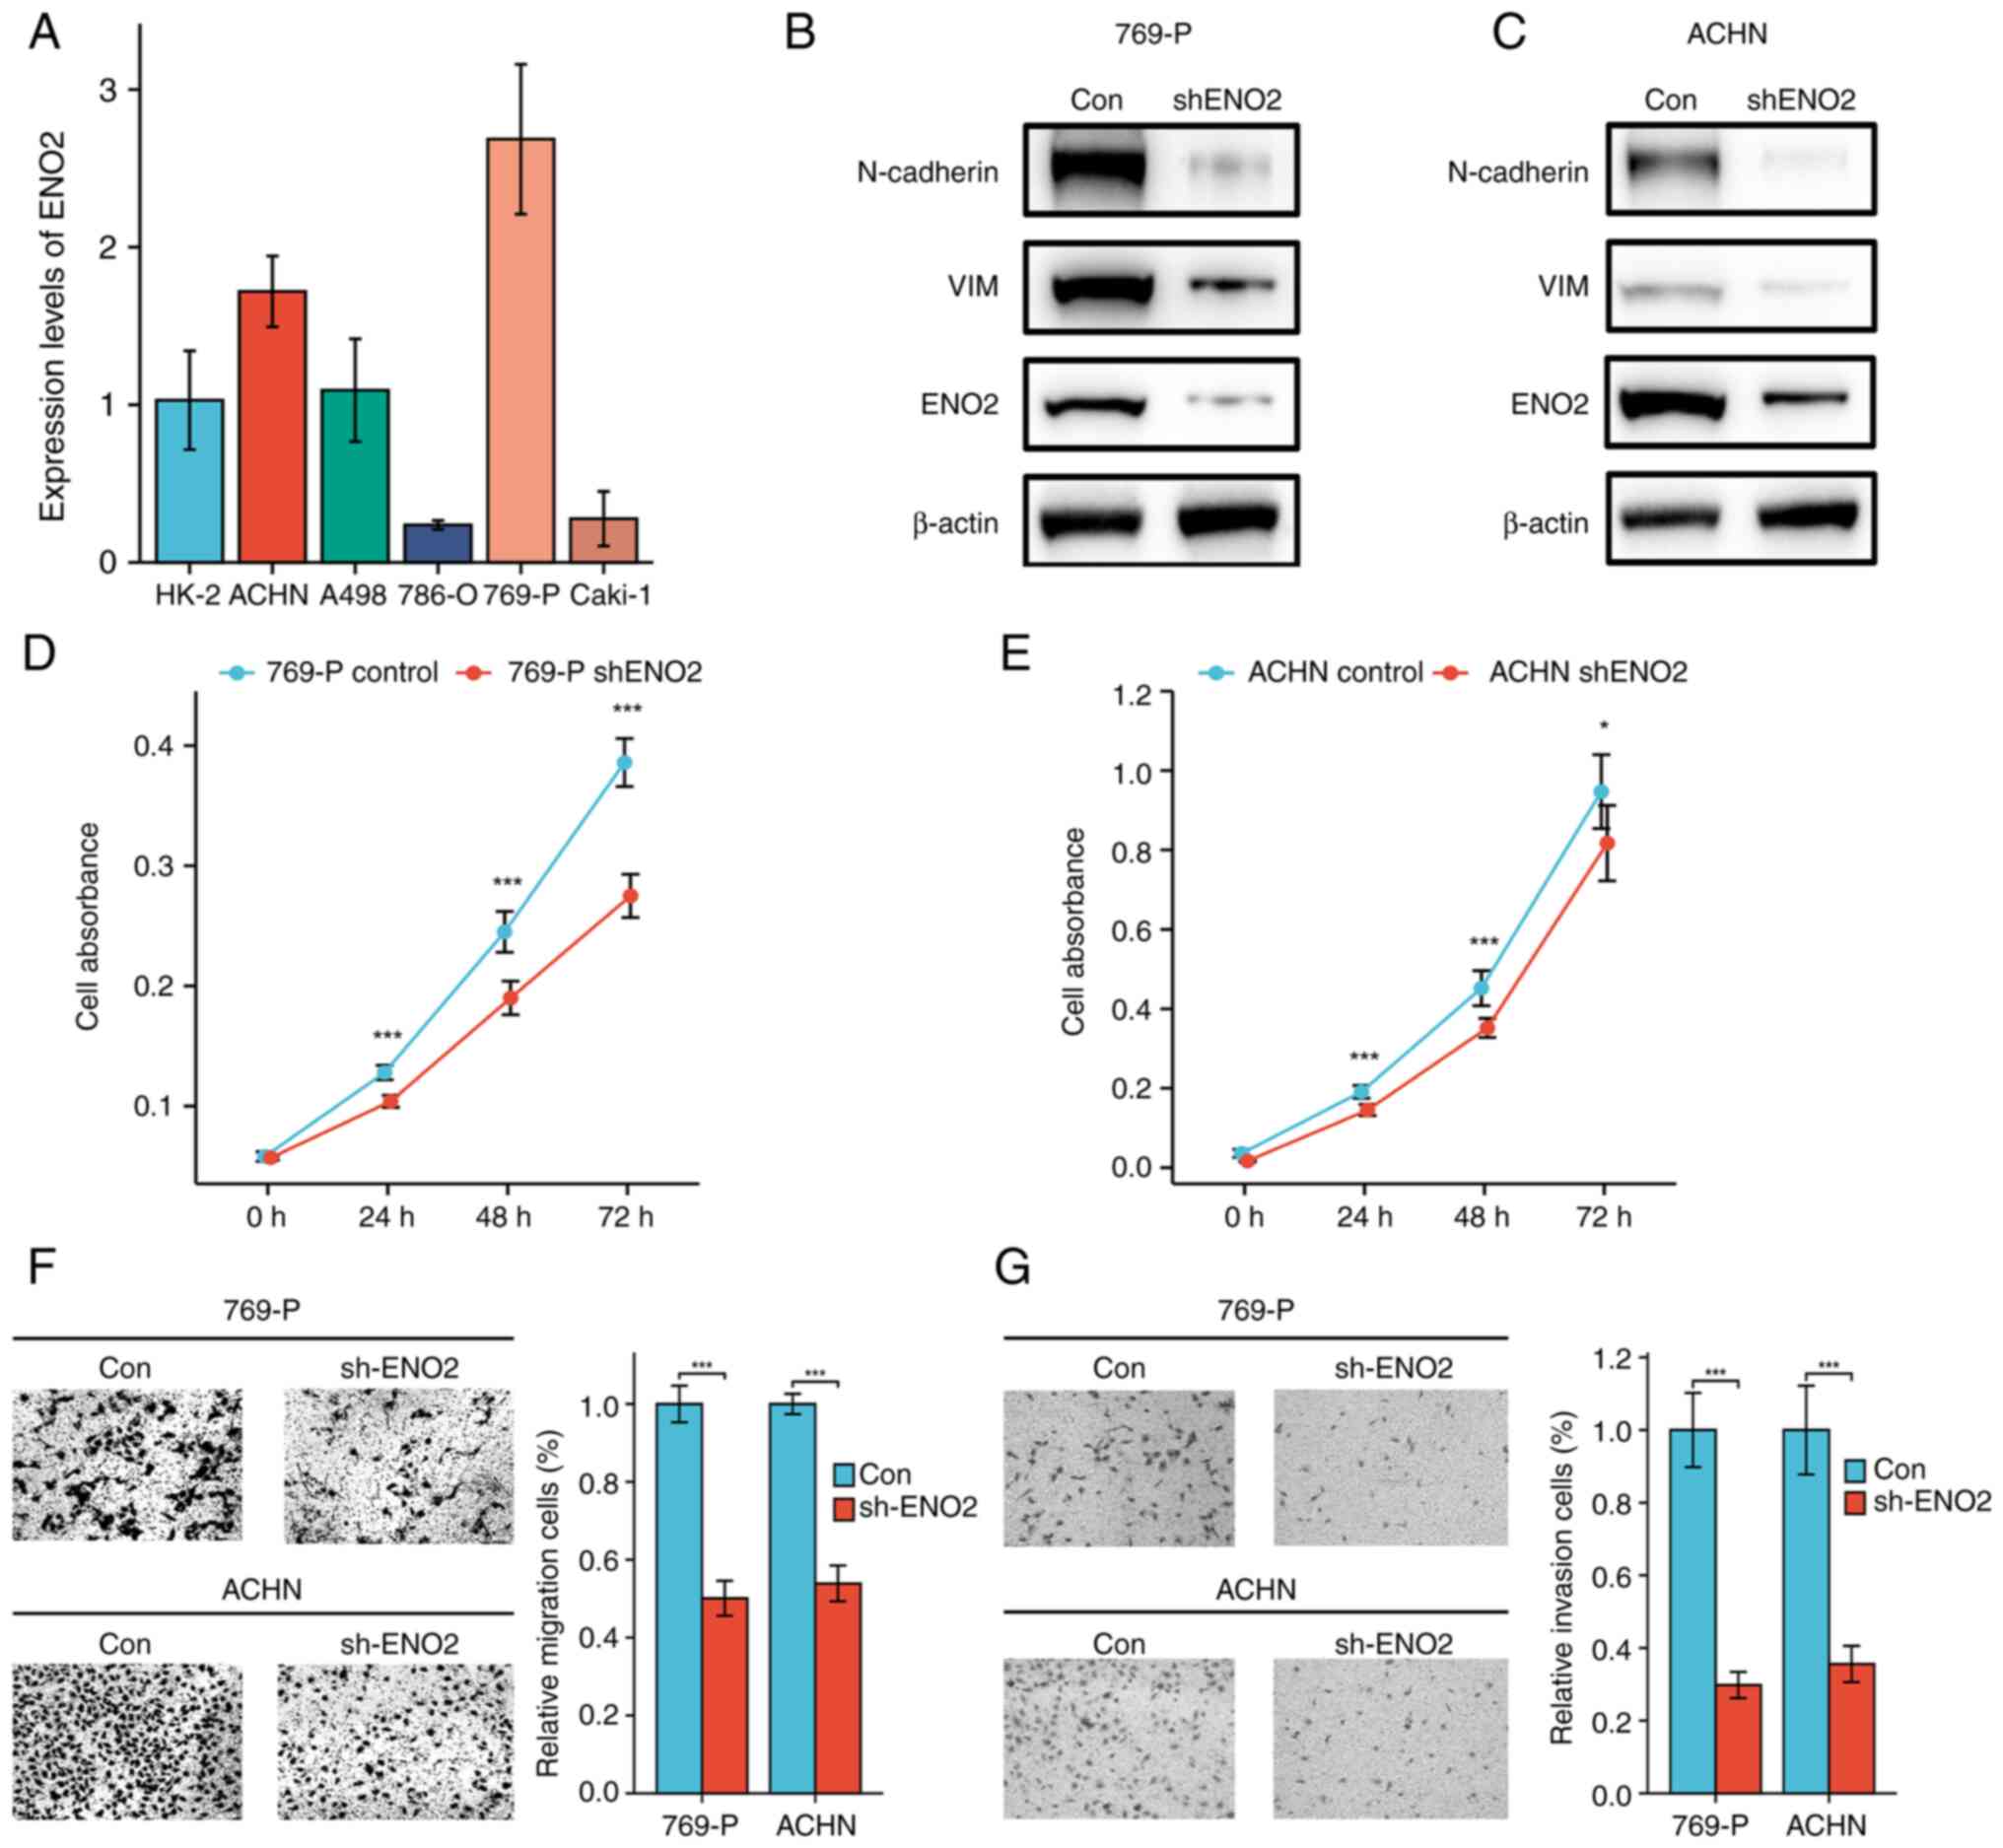
ENO2 knockdown inhibits EMT and ccRCC
progression
To verify the role that ENO2 has in the progression
of EMT and ccRCC, the expression level of ENO2 in human normal
renal tubular epithelial cells (HK2) and in a panel of ccRCC cell
lines (Caki-1, 786-O, 769-P, ACHN and A498) was detected in in
vitro experiments. These experiments showed that ccRCC cells
had considerably greater levels of ENO2 expression compared with
HK2 cells (Fig. 4A), a finding
that was consistent with our results showing that the expression of
ENO2 in ccRCC tissue was greater compared with normal tissue
(Fig. 2B). To determine the role
of ENO2 in ccRCC, ENO2 knockdown in ACHN and 769-P cells was
carried out by performing stable transfections of control shRNA or
ENO2 shRNA using lentiviral vectors. E-cadherin, N-cadherin and the
EMT-induced transcription factor vimentin (VIM) are three proteins
that are often measured to determine the extent of EMT (22). By using western blotting to
identify these crucial EMT-associated molecules, the expression
levels of N-cadherin and vimentin were found to be markedly
decreased when ENO2 was knocked down (Fig. 4B and C). To determine the role of
ENO2 in cell proliferation, CCK-8 analysis was performed, and the
results demonstrated that significantly reduced ENO2 gene activity
led to a reduction in the ability of the RCC cell lines to
proliferate (Fig. 4D and E).
Subsequently, the effect of ENO2 on the migration and invasion of
769-P and ACHN cells was detected using Transwell and Matrigel
assay analysis. When compared with the control group, the results
demonstrated that ENO2 silencing caused a significant decrease in
the migratory and invasive capabilities of the two cell lines
(Fig. 4F and G). The
aforementioned results implied that ENO2 may influence the EMT
process, contributing to the development of ccRCC.
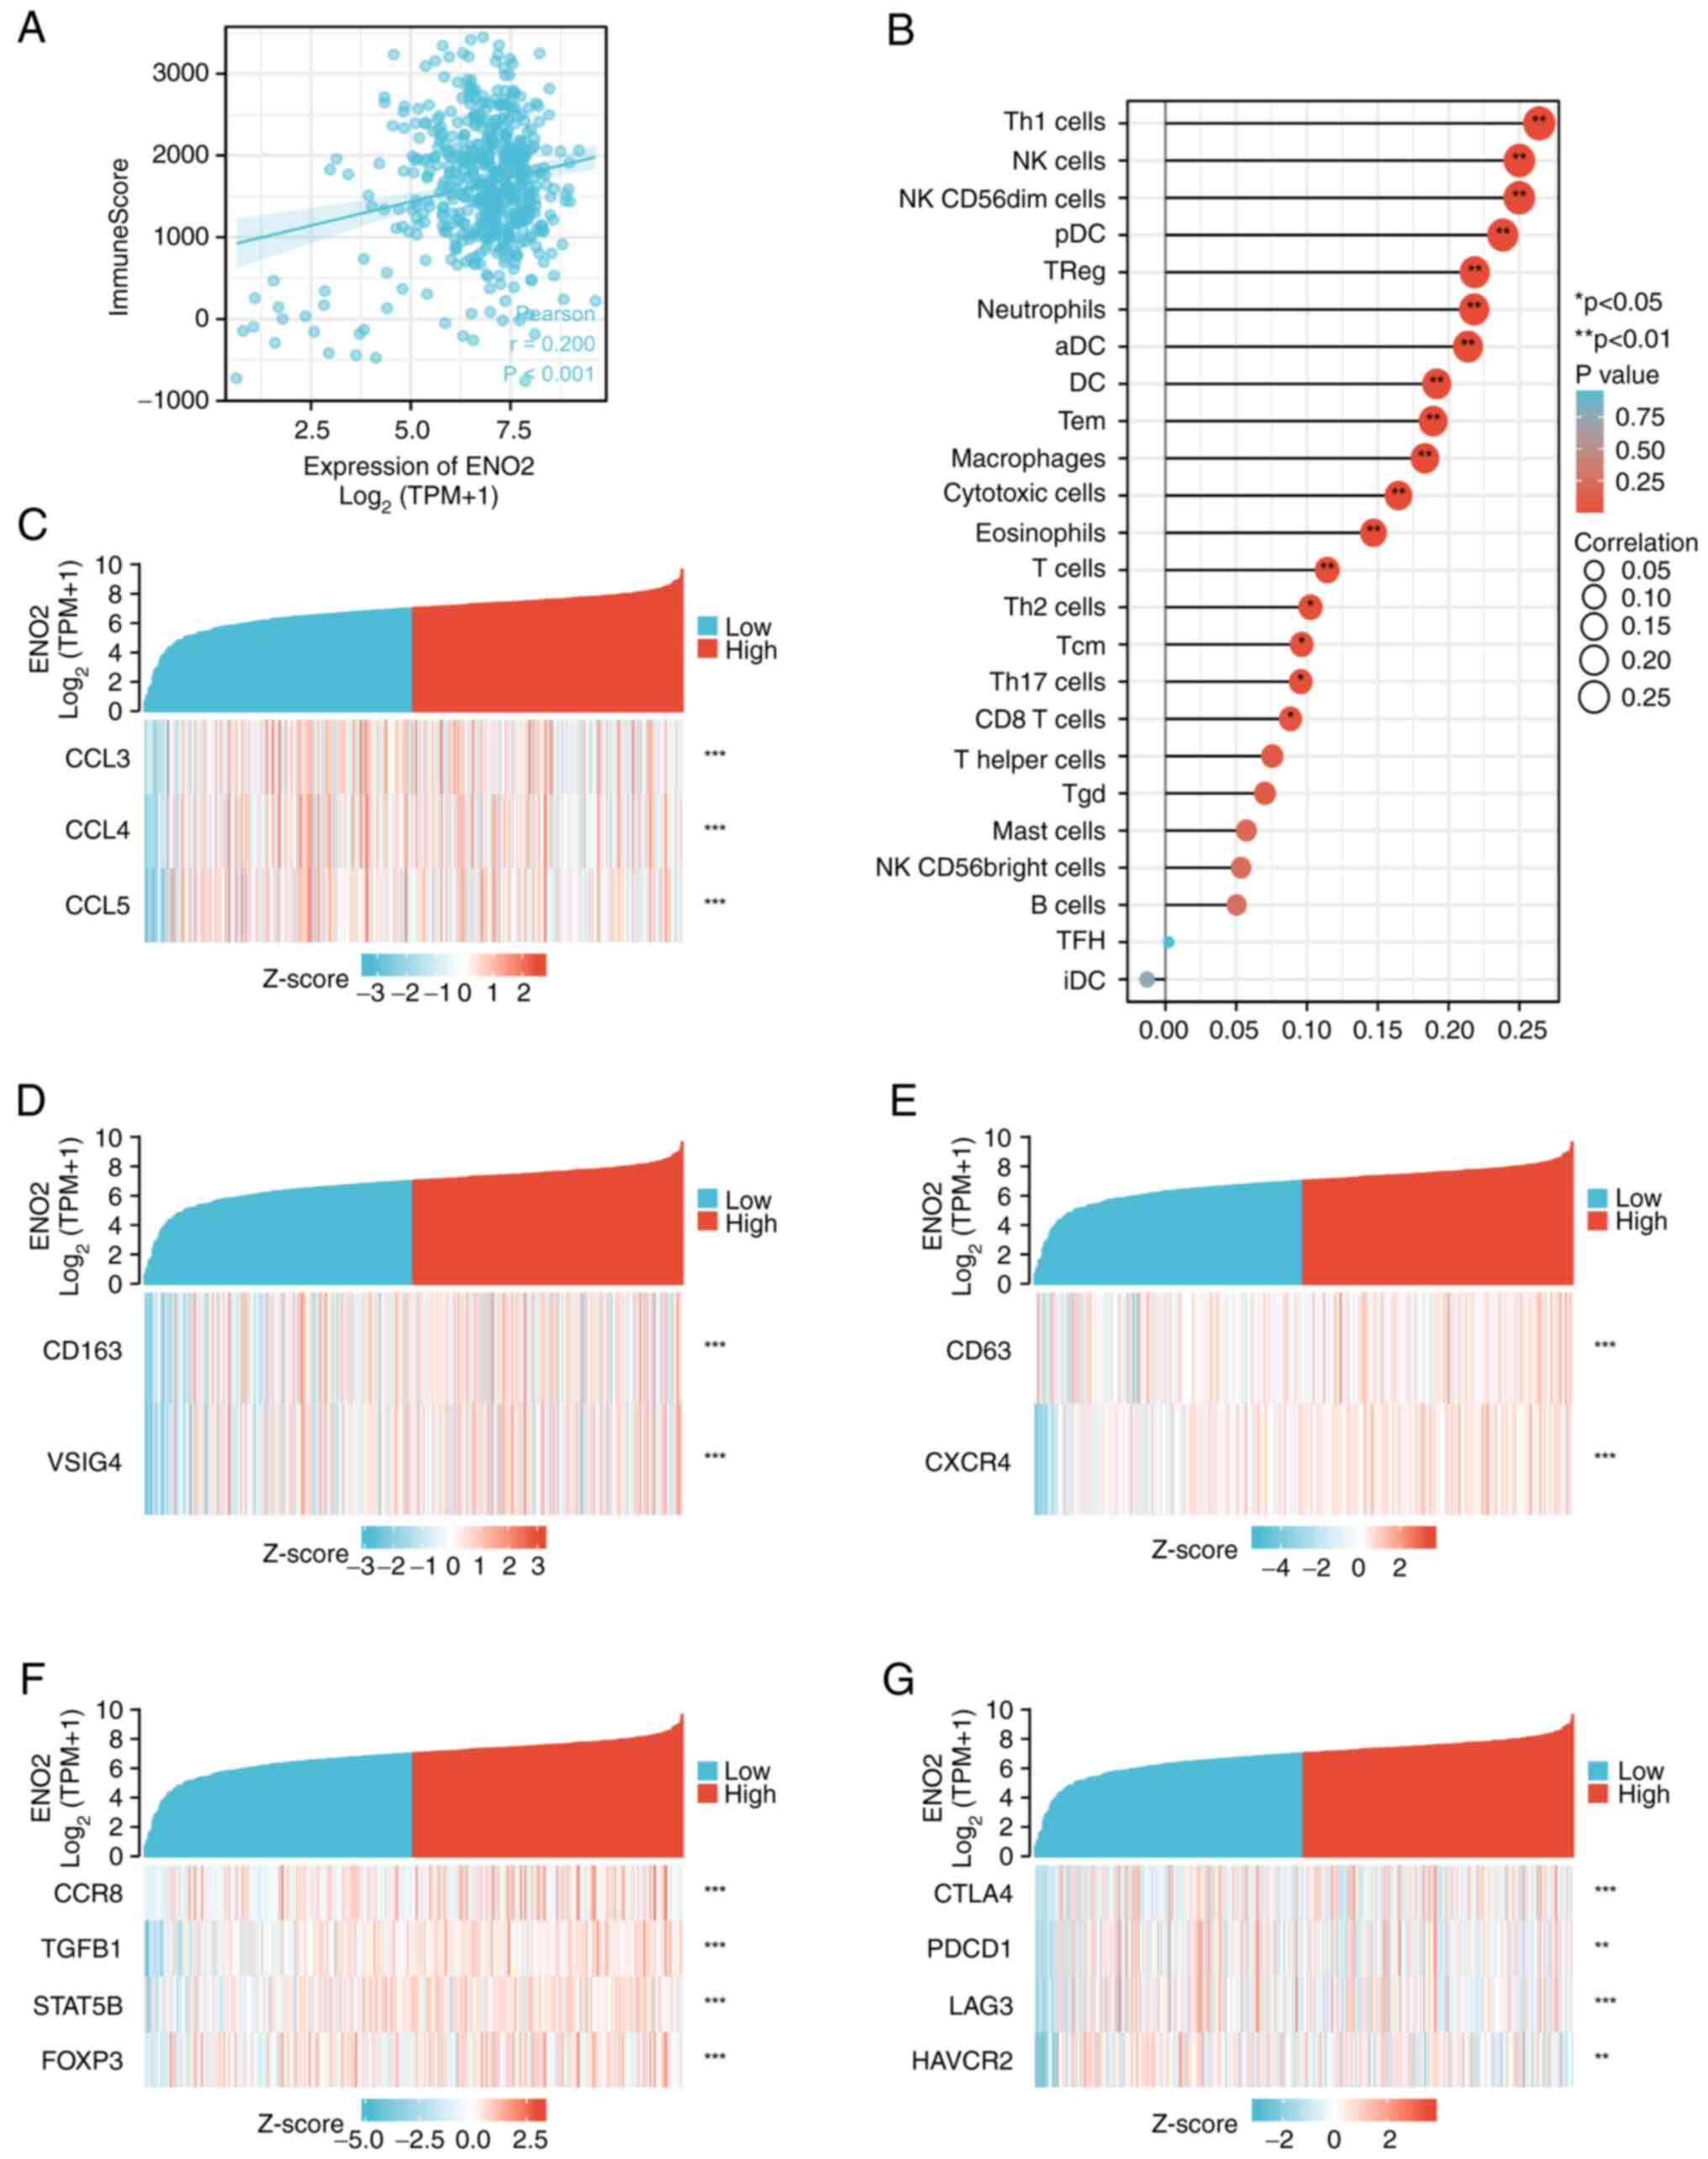
ENO2 is associated with the immune
microenvironment of ccRCC
Immune checkpoint therapy is an important method for
treating RCC. It is well recognized that EMT is important for the
immunosuppression of malignant tumors (23). In the present study, it was
hypothesized that ENO2 was associated in some way with the immune
microenvironment of RCC. According to the transcriptome data
extracted from TCGA ccRCC cohort, the R estimate package was
utilized for the immune score computation (24), and this analysis revealed that the
immune score was higher in clusters with higher expression levels
of ENO2 (Fig. 5A), suggesting that
ENO2 may regulate immune cells in the ccRCC microenvironment.
Immune cell infiltration in the tumor microenvironment (TME) may
affect the efficacy of immunotherapy. Subsequently, the association
between 24 different immune cell types and ENO2 expression in the
TME was assessed using the ssGSEA method. It was found that ENO2
expression was positively correlated with natural killer (NK)
cells, dendritic cells (DCs), CD8 T cells, eosinophils,
macrophages, aDCs, Th1 cells, cytotoxic cells and regulatory T
cells (Treg) (Fig. 5B).
Subsequently, the interactions between ENO2 and numerous key
chemokines were examined in order to elucidate the mechanism via
which ENO2 may be associated with immune cells. These findings
demonstrated a strong correlation between ENO2 expression and the
chemokine ligands CCL3, CCL4 and CCL5 (Fig. 5C), which have been demonstrated to
be effective regulators of tumor-associated macrophages (TAMs)
(25) and tumor-infiltrating
neutrophils (TINs) (26). A total
of 2 phenotypes of TAM are antitumor M1 macrophages and primitive
M2 macrophages. It has been established that a number of
carcinogenic pathways can be activated by M2 macrophage
polarization to assist in the growth of tumors (27). In addition, in human cancers,
neutrophils N1 and N2 perform various roles in different types of
human cancer. As a result, it was possible to hypothesize that ENO2
may promote the infiltration of N2 neutrophils and M2 macrophages.
In the present experiments, it was found that the cell markers for
M2 macrophages and N2 neutrophils were favorably linked with ENO2,
thereby confirming our conjecture (Fig. 5D and E). Subsequently, the possible
correlation between ENO2 and several immunosuppressive markers was
examined. It is worth noting that most correlations were found to
have a high level of significance, including those with M2
macrophages (CD163 and VISG4) (Fig.
5D) and Treg (CCR8, TGFB1, STAT5b and FOXP3) (Fig. 5F). Depleted T cell markers, such as
programmed cell death protein 1 (PDCD1), cytotoxic T-lymphocyte
associated protein 4 (CTLA4), lymphocyte activating 3 (LAG3) and
hepatitis A virus cellular receptor 2 (HAVCR2), were positively
linked with ENO2 expression (Fig.
5G). Collectively, these results suggested that a high
expression of ENO2 may regulate the tumor immune response.
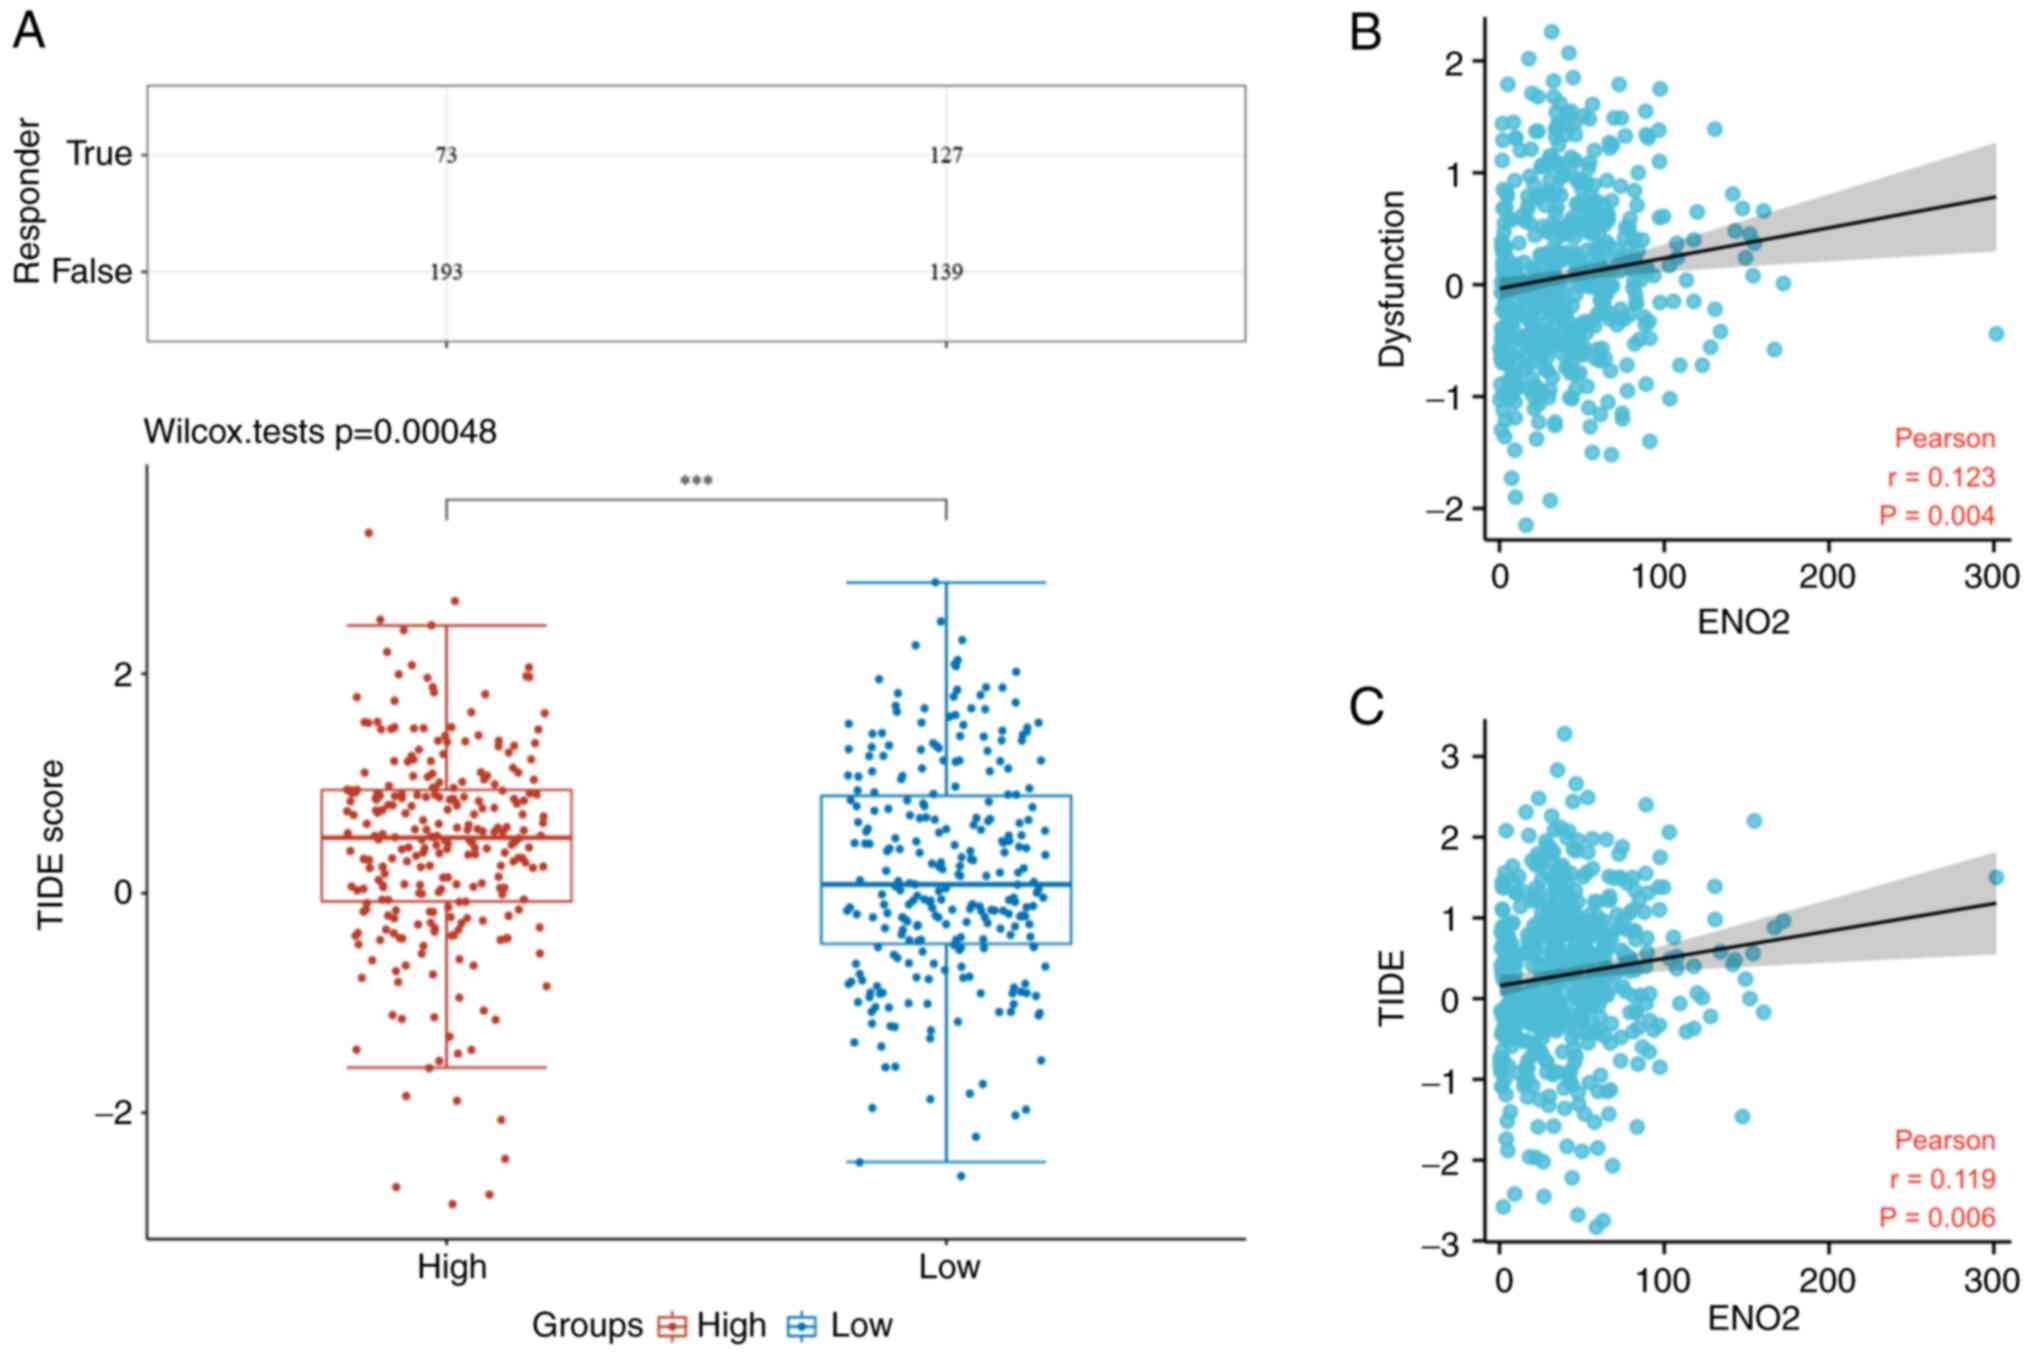
Increased expression of ENO2 is
associated with higher immune dysfunction scores and poorer
efficacy of ICB in patients with ccRCC
To verify the prognostic value of ENO2 for ICB
prognosis, TIDE analysis was performed on 531 cases of ccRCC in the
ccRCC TCGA cohort. According to this analysis, several
immunological checkpoints were found to be significantly associated
with ENO2 expression (Fig. 5G).
The immune responses of the low expression group of ENO2 were
scored more favorably compared with those of the high expression
group (Fig. 6A). In addition,
increased ENO2 expression was found to be associated with higher
immune dysfunction scores, according to Pearson correlation
analysis (Fig. 6B) and the TIDE
scores (Fig. 6C). Similarly, the
high expression of ENO2 was found to predict the poor efficacy of
ICB in patients with ccRCC (27.4 cf. 47.7%) (Fig. 6A).
Discussion
In the present study, it has been shown that ENO2
expression was more prominent in ccRCC tissues compared with normal
tissues, and ENO2 served a critical function in boosting ccRCC cell
migration and proliferation. Moreover, its high expression has been
linked to a poor prognosis for patients with ccRCC. GSEA pathway
analysis revealed that ENO2 could participate in the regulation of
EMT, hypoxia, oxidative phosphorylation, and other pathways in
ccRCC cells. The EMT signaling pathway was specifically studied in
view of the fact that this pathway showed the highest enrichment
score. ‘EMT’ is the term used to describe the biological process
whereby epithelial cells undergo a particular program to change
into cells having a mesenchymal character (28). Through the process of EMT,
epithelial cells obtain infiltration and metastasis characteristics
(29). This constitutes a crucial
stage in the spread of malignancies, and EMT is involved in a
number of different types of malignant cancers (30). In addition, there are studies
reporting that EMT in cancer cells leads to the generation of
cancer stem cells, which may contribute to tumor recurrence
following treatment (31,32). Downregulation of
epithelial-specific markers, a rise in mesenchymal markers, and the
development of an invasive phenotype are among the characteristics
of EMT. During EMT, the levels of key components, such as
E-cadherin, N-cadherin and VIM, are increased significantly
(33). Therefore, it was
hypothesized that ENO2 may regulate the ccRCC phenotype via
regulating the EMT process. The in vitro experiments
performed in the present study demonstrated that downregulation of
the ENO2 gene led to the downregulation of these key factors of
EMT. Knockdown of the ENO2 gene was also shown to significantly
reduce the migration, invasion and proliferation of the different
ccRCC cell lines.
In addition, EMT is also able to regulate the immune
response. In melanoma, EMT has been shown to generate regulatory T
cells, resulting in the poor effectiveness of immunotherapy
(34). Furthermore, numerous
studies have indicated that EMT fulfills a key role in the
immunosuppression of malignant tumors (23). As a result, it was possible to
hypothesize that ENO2 may be involved in modulating the TME of
ccRCC. ccRCC usually has a high level of immune infiltration
(35). A variety of immune cells
enter the TME to create a vital micro-environment that is involved
in numerous aspects of tumorigenesis. Immune cell infiltration in
TME was reported to be linked with the prognosis and response to
ICB treatment in patients with ccRCC (36,37).
In the present study, ENO2 expression was found to be significantly
and positively correlated with aDCs, CD8 T cells, cytotoxic cells,
eosinophils, DCs, macrophages, Th1 cells, NK cells and Treg. The
majority of immune cells in TME congregate in different subsets,
and have varying or even opposing functions, depending on the
degree and type of illness. Two phenotypes of TAM exist, namely
antitumor M1 macrophages and primitive M2 macrophages. A
significant aspect of the development of cancer, as demonstrated by
a wide number of studies, is the switch from the M1- to the M2-like
macrophages (38). N1 and N2
neutrophils fulfill different functions in malignancies. Strong
anticancer activity is demonstrated by N1 neutrophils, and through
secreting cytokines, these cells may aid in CD8+ T cell
recruitment and activation (39).
The present study revealed a favorable correlation between ENO2 and
M2 macrophages and N2 neutrophil markers, suggesting that ENO2 may
be associated with the conversion of TAMs and TINs. To examine the
association between ENO2 and tumor immunity in more detail, Pearson
correlation analysis was used to investigate the correlation
between ENO2 and a number of immunological checkpoint molecules,
including PDCD1, CTLA4, LAG3 and HAVCR2. Immune checkpoints are a
group of molecules that control the level of immune activation, and
abnormalities in their expression or function have a significant
role in the development of tumors. Due to the activation of
immunological checkpoints in tumors, which prevent the antigen
presentation process in the TME, immune cells are unable to perform
their normal functions (40). A
previous study highlighted that ENO2 fulfills an important role in
glycolysis in tumors, and silencing or overexpression of ENO2 can
significantly decrease or increase lactate levels in the TME,
respectively (12). Numerous
studies have revealed that excessive lactate in the TME contributes
to the establishment of an immunosuppressive environment that
favors both tumor cell growth and immune escape (41). Accumulation of lactate in the TME
leads to extracellular acidification, and lactic acidosis impairs
the function of cytotoxic T lymphocytes through inhibiting T cell
receptor-triggered activation of p38 and JNK/c-Jun pathways
(42). In addition, increased
lactate levels in the TME have been shown to directly inhibit the
cytolytic function of NK cells, which are subsequently able to
induce the differentiation of monocytes into DCs with an
immunosuppressive phenotype (43–45).
Moreover, lactic acidosis has been shown to inhibit the function of
M1 macrophages through decreasing the expression of CCL2 and IL-6
(46). Therefore, it was possible
to hypothesize that ENO2 affects tumor immune cell infiltration by
regulating the level of lactic acid in TME, which therefore
fulfills a key role in the immunosuppression of ccRCC.
At the end of the 19th century, the idea of tumor
immunotherapy was initially proposed. It alludes to a form of
therapy that eliminates cancer cells by utilizing the autoimmune
system. However, it is difficult to assess the efficacy of these
blockades (47). The prognosis of
tumor patients is significantly impacted by the immunological
infiltration of various types of immune cells in the tumor
(48). Recent studies have
identified two unique tumor immune evasion pathways (49,50).
Infiltrating T cells are eliminated by immune-suppressive factors
in certain tumors, although in others, significant levels of
cytotoxic T cell infiltration are present (51). Peng et al (21) created a new computational framework
to integrate the two tumor immune escape mechanisms through the
TIDE score. These two distinct tumor immune escape pathways are
assessed by TIDE using a collection of gene expression indicators,
and a higher TIDE score denotes a less effective ICB therapy. A
favorable correlation between the immune dysfunction score and the
TIDE score, and the expression of ENO2 was identified in the
present study. In the present study, the low expression group of
ENO2 was found to have a 20.3% higher response rate to immune
checkpoint therapy compared with the high expression group, which
suggested that patients who express less ENO2 may benefit more from
ICB treatment.
In conclusion, the present study has emphasized the
clinical significance of ENO2 in ccRCC, and its possible mechanism
has been discussed. It was found that ENO2 could regulate the EMT
process and regulate the proliferation, metastasis and invasion of
ccRCC. In addition, ENO2 was shown to be associated with the immune
score of ccRCC. Finally, the present study has disclosed the
correlation between ENO2 and tumor immunosuppression, and has also
suggested that ENO2 may be used as a potential predictor of the
efficacy of ICB.
Supplementary Material
Supporting Data
Acknowledgements
Clinical specimens of RCC were provided by Third
Affiliated Hospital of the Second Military Medical University.
Funding
The present study was sponsored by the National Natural Science
Foundation of China (grant nos. 81974391, 82072806 and 82173265),
the Program of Shanghai Academic/Technology Research Leader (grant
no. 19XD1405100), the Clinical Research Plan of SHDC (grant no.
SHDC2020CR4025), the Shanghai ‘Rising Stars of Medical Talent’
Youth Development Program: Youth Medical Talents-Specialist
Program, the Shanghai Municipal Commission of Health and Family
Planning (grant no. 20204Y0042), the Technology Project of Jiading
Health System (grant no. 2019-QN-03), the Natural Science
Foundation of Shanghai (grant no. 20ZR1470500) and the Hospital
Funded Clinical Research, Xin Hua Hospital Affiliated to Shanghai
Jiao Tong University School of Medicine (grant no. 21XHDB06).
Availability of data and materials
All data generated or analyzed during this study are
included in this published article.
Authors' contributions
XGC, XWP and XS were responsible for the conception
and design of the present study. XWP, WJC, KQD, JXC and WYL were
responsible for the development of the methodology. WJC and WY
performed experiments. WY, MG, YH, DX, WJC, and YQW were
responsible for analysis and interpretation of the data. XGC, XWP
and XS supervised the study. WJC and XWP confirm the authenticity
of all the raw data. All authors have read and approved the final
manuscript.
Ethics approval and consent to
participate
The present study was approved (approval no.
EHBHKY2021-01-005) by the ethics committee of Second Military
Medical University (Shanghai, China). Written informed consent was
obtained from all patients.
Patient consent for publication
Not applicable.
Competing interests
The authors declare that they have no competing
interests.
References
|
1
|
Grivennikov S, Greten F and Karin M:
Immunity, inflammation, and cancer. Cell. 140:883–899. 2010.
View Article : Google Scholar : PubMed/NCBI
|
|
2
|
Baldewijns MM, van Vlodrop IJ, Schouten
LJ, Soetekouw PM, de Bruïne AP and van Engeland M: Genetics and
epigenetics of renal cell cancer. Biochim Biophys Acta.
1785:133–155. 2008.PubMed/NCBI
|
|
3
|
Fisher R, Gore M and Larkin J: Current and
future systemic treatments for renal cell carcinoma. Semin Cancer
Biol. 23:38–45. 2013. View Article : Google Scholar : PubMed/NCBI
|
|
4
|
Fernández-Pello S, Hofmann F, Tahbaz R,
Marconi L, Lam TB, Albiges L, Bensalah K, Canfield SE, Dabestani S,
Giles RH, et al: A systematic review and meta-analysis comparing
the effectiveness and adverse effects of different systemic
treatments for non-clear cell renal cell carcinoma. Eur Urol.
71:426–436. 2017. View Article : Google Scholar : PubMed/NCBI
|
|
5
|
Barretina J, Caponigro G, Stransky N,
Venkatesan K, Margolin AA, Kim S, Wilson CJ, Lehár J, Kryukov GV,
Sonkin D, et al: The cancer cell line encyclopedia enables
predictive modelling of anticancer drug sensitivity. Nature.
483:603–607. 2012. View Article : Google Scholar : PubMed/NCBI
|
|
6
|
Vizin T and Kos J: Gamma-enolase: A
well-known tumour marker, with a less-known role in cancer. Radiol
Oncol. 49:217–226. 2015. View Article : Google Scholar : PubMed/NCBI
|
|
7
|
Levin VA, Panchabhai SC, Shen L, Kornblau
SM, Qiu Y and Baggerly KA: Different changes in protein and
phosphoprotein levels result from serum starvation of high-grade
glioma and adenocarcinoma cell lines. J Proteome Res. 9:179–191.
2010. View Article : Google Scholar : PubMed/NCBI
|
|
8
|
Yan T, Skaftnesmo KO, Leiss L, Sleire L,
Wang J, Li X and Enger PØ: Neuronal markers are expressed in human
gliomas and NSE knockdown sensitizes glioblastoma cells to
radiotherapy and temozolomide. BMC Cancer. 11:5242011. View Article : Google Scholar : PubMed/NCBI
|
|
9
|
Hafner A, Obermajer N and Kos J:
γ-1-Syntrophin mediates trafficking of γ-enolase towards the plasma
membrane and enhances its neurotrophic activity. Neurosignals.
18:246–258. 2010. View Article : Google Scholar : PubMed/NCBI
|
|
10
|
Hafner A, Obermajer N and Kos J: γ-Enolase
C-terminal peptide promotes cell survival and neurite outgrowth by
activation of the PI3K/Akt and MAPK/ERK signalling pathways.
Biochem J. 443:439–450. 2012. View Article : Google Scholar : PubMed/NCBI
|
|
11
|
Sturgeon C: Practice guidelines for tumor
marker use in the clinic. Clin Chem. 48:1151–1159. 2002. View Article : Google Scholar : PubMed/NCBI
|
|
12
|
Sun C, Liu M, Zhang W, Wang S, Qian G,
Wang M and Zhang G: Overexpression of enolase 2 is associated with
worsened prognosis and increased glycikolysis in papillary renal
cell carcinoma. J Cell Physiol. 236:3821–3831. 2021. View Article : Google Scholar : PubMed/NCBI
|
|
13
|
Szklarczyk D, Gable A, Lyon D, Junge A,
Wyder S, Huerta-Cepas J, Simonovic M, Doncheva NT, Morris JH, Bork
P, et al: STRING v11: Protein-protein association networks with
increased coverage, supporting functional discovery in genome-wide
experimental datasets. Nucleic Acids Res. 47(D1): D607–D613. 2019.
View Article : Google Scholar : PubMed/NCBI
|
|
14
|
Chin CH, Chen SH, Wu HH, Ho CW, Ko MT and
Lin CY: cytoHubba: Identifying hub objects and sub-networks from
complex interactome. BMC Syst Biol. 8 (Suppl 4):S112014. View Article : Google Scholar : PubMed/NCBI
|
|
15
|
Maere S, Heymans K and Kuiper M: BiNGO: A
cytoscape plugin to assess overrepresentation of gene ontology
categories in biological networks. Bioinformatics. 21:3448–3449.
2005. View Article : Google Scholar : PubMed/NCBI
|
|
16
|
Wang C, Peng G, Huang H, Liu F, Kong DP,
Dong KQ, Dai LH, Zhou Z, Wang KJ, Yang J, et al: Blocking the
feedback loop between neuroendocrine differentiation and
macrophages improves the therapeutic effects of enzalutamide
(MDV3100) on prostate cancer. Clin Cancer Res. 24:708–723. 2018.
View Article : Google Scholar : PubMed/NCBI
|
|
17
|
Livak KJ and Schmittgen TD: Analysis of
relative gene expression data using real-time quantitative PCR and
the 2(−Delta Delta C(T)) method. Methods. 25:402–408. 2001.
View Article : Google Scholar : PubMed/NCBI
|
|
18
|
Subramanian A, Tamayo P, Mootha VK,
Mukherjee S, Ebert BL, Gillette MA, Paulovich A, Pomeroy SL, Golub
TR, Lander ES and Mesirov JP: Gene set enrichment analysis: A
knowledge-based approach for interpreting genome-wide expression
profiles. Proc Natl Acad Sci USA. 102:15545–15550. 2005. View Article : Google Scholar : PubMed/NCBI
|
|
19
|
Bindea G, Mlecnik B, Tosolini M,
Kirilovsky A, Waldner M, Obenauf AC, Angell H, Fredriksen T,
Lafontaine L, Berger A, et al: Spatiotemporal dynamics of
intratumoral immune cells reveal the immune landscape in human
cancer. Immunity. 39:782–795. 2013. View Article : Google Scholar : PubMed/NCBI
|
|
20
|
Hänzelmann S, Castelo R and Guinney J:
GSVA: Gene set variation analysis for microarray and RNA-seq data.
BMC Bioinformatics. 14:72013. View Article : Google Scholar : PubMed/NCBI
|
|
21
|
Jiang P, Gu S, Pan D, Fu J, Sahu A, Hu X,
Li Z, Traugh N, Bu X, Li B, et al: Signatures of T cell dysfunction
and exclusion predict cancer immunotherapy response. Nat Med.
24:1550–1558. 2018. View Article : Google Scholar : PubMed/NCBI
|
|
22
|
Singh M, Yelle N, Venugopal C and Singh
SK: EMT: Mechanisms and therapeutic implications. Pharmacol Ther.
182:80–94. 2018. View Article : Google Scholar : PubMed/NCBI
|
|
23
|
Jiang Y and Zhan H: Communication between
EMT and PD-L1 signaling: New insights into tumor immune evasion.
Cancer Lett. 468:72–81. 2020. View Article : Google Scholar : PubMed/NCBI
|
|
24
|
Yoshihara K, Shahmoradgoli M, Martínez E,
Vegesna R, Kim H, Torres-Garcia W, Treviño V, Shen H, Laird PW,
Levine DA, et al: Inferring tumour purity and stromal and immune
cell admixture from expression data. Nat Commun. 4:26122013.
View Article : Google Scholar : PubMed/NCBI
|
|
25
|
Eissmann M, Dijkstra C, Jarnicki A, Phesse
T, Brunnberg J, Poh AR, Etemadi N, Tsantikos E, Thiem S, Huntington
ND, et al: IL-33-mediated mast cell activation promotes gastric
cancer through macrophage mobilization. Nat Commun. 10:27352019.
View Article : Google Scholar : PubMed/NCBI
|
|
26
|
Mukaida N, Sasaki SI and Baba T: CCL4
signaling in the tumor microenvironment. Adv Exp Med Biol.
1231:23–32. 2020. View Article : Google Scholar : PubMed/NCBI
|
|
27
|
Lan J, Sun L, Xu F, Liu L, Hu F, Song D,
Hou Z, Wu W, Luo X, Wang J, et al: M2 macrophage-derived exosomes
promote cell migration and invasion in colon cancer. Cancer Res.
79:146–158. 2019. View Article : Google Scholar : PubMed/NCBI
|
|
28
|
Yang J, Antin P, Berx G, Blanpain C,
Brabletz T, Bronner M, Campbell K, Cano A, Casanova J, Christofori
G, et al: Author correction: Guidelines and definitions for
research on epithelial-mesenchymal transition. Nat Rev Mol Cell
Biol. 22:8342021. View Article : Google Scholar : PubMed/NCBI
|
|
29
|
Mittal V: Epithelial mesenchymal
transition in tumor metastasis. Annu Rev Pathol. 13:395–412. 2018.
View Article : Google Scholar : PubMed/NCBI
|
|
30
|
Bai J, Zhang X, Shi D, Xiang Z, Wang S,
Yang C, Liu Q, Huang S, Fang Y, Zhang W, et al: Exosomal miR-128-3p
promotes epithelial-to-mesenchymal transition in colorectal cancer
cells by targeting FOXO4 via TGF-β/SMAD and JAK/STAT3 signaling.
Front Cell Dev Biol. 9:5687382021. View Article : Google Scholar : PubMed/NCBI
|
|
31
|
Morel A, Lièvre M, Thomas C, Hinkal G,
Ansieau S and Puisieux A: Generation of breast cancer stem cells
through epithelial-mesenchymal transition. PLoS One. 3:e28882008.
View Article : Google Scholar : PubMed/NCBI
|
|
32
|
Shibue T and Weinberg RA: EMT, CSCs, and
drug resistance: The mechanistic link and clinical implications.
Nat Rev Clin Oncol. 14:611–629. 2017. View Article : Google Scholar : PubMed/NCBI
|
|
33
|
Thiery JP, Acloque H, Huang RY and Nieto
MA: Epithelial-mesenchymal transitions in development and disease.
Cell. 139:871–890. 2009. View Article : Google Scholar : PubMed/NCBI
|
|
34
|
Kudo-Saito C, Shirako H, Takeuchi T and
Kawakami Y: Cancer metastasis is accelerated through
immunosuppression during Snail-induced EMT of cancer cells. Cancer
Cell. 15:195–206. 2009. View Article : Google Scholar : PubMed/NCBI
|
|
35
|
Díaz-Montero CM, Rini BI and Finke JH: The
immunology of renal cell carcinoma. Nat Rev Nephrol. 16:721–735.
2020. View Article : Google Scholar : PubMed/NCBI
|
|
36
|
Tran Janco JM, Lamichhane P, Karyampudi L
and Knutson KL: Tumor-infiltrating dendritic cells in cancer
pathogenesis. J Immunol. 194:2985–2991. 2015. View Article : Google Scholar : PubMed/NCBI
|
|
37
|
Stanton SR and Disis ML: Clinical
significance of tumor-infiltrating lymphocytes in breast cancer. J
Immunother Cancer. 4:592016. View Article : Google Scholar : PubMed/NCBI
|
|
38
|
Pandey G: Tumor-associated macrophages in
solid tumor: Friend or foe. Ann Transl Med. 8:10272020. View Article : Google Scholar : PubMed/NCBI
|
|
39
|
Fridlender ZG and Albelda SM:
Tumor-associated neutrophils: Friend or foe? Carcinogenesis.
33:949–955. 2012. View Article : Google Scholar : PubMed/NCBI
|
|
40
|
Zeng D, Li M, Zhou R, Zhang J, Sun H, Shi
M, Bin J, Liao Y, Rao J and Liao W: Tumor microenvironment
characterization in gastric cancer identifies prognostic and
immunotherapeutically relevant gene signatures. Cancer Immunol Res.
7:737–750. 2019. View Article : Google Scholar : PubMed/NCBI
|
|
41
|
Wang ZH, Peng WB, Zhang P, Yang XP and
Zhou Q: Lactate in the tumour microenvironment: From immune
modulation to therapy. EBioMedicine. 73:1036272021. View Article : Google Scholar : PubMed/NCBI
|
|
42
|
Xia H, Wang W, Crespo J, Kryczek I, Li W,
Wei S, Bian Z, Maj T, He M, Liu RJ, et al: Suppression of FIP200
and autophagy by tumor-derived lactate promotes naïve T cell
apoptosis and affects tumor immunity. Sci Immunol. 2:eaan46312017.
View Article : Google Scholar : PubMed/NCBI
|
|
43
|
Husain Z, Seth P and Sukhatme VP:
Tumor-derived lactate and myeloid-derived suppressor cells: Linking
metabolism to cancer immunology. Oncoimmunology. 2:e263832013.
View Article : Google Scholar : PubMed/NCBI
|
|
44
|
Erra Díaz F, Ochoa V, Merlotti A, Dantas
E, Mazzitelli I, Gonzalez Polo V, Sabatté J, Amigorena S, Segura E
and Geffner J: Extracellular acidosis and mTOR inhibition drive the
differentiation of human monocyte-derived dendritic cells. Cell
Rep. 31:1076132020. View Article : Google Scholar : PubMed/NCBI
|
|
45
|
Nasi A, Fekete T, Krishnamurthy A, Snowden
S, Rajnavölgyi E, Catrina AI, Wheelock CE, Vivar N and Rethi B:
Dendritic cell reprogramming by endogenously produced lactic acid.
J Immunol. 191:3090–3099. 2013. View Article : Google Scholar : PubMed/NCBI
|
|
46
|
Certo M, Tsai CH, Pucino V, Ho PC and
Mauro C: Lactate modulation of immune responses in inflammatory
versus tumour microenvironments. Nat Rev Immunol. 21:151–161. 2021.
View Article : Google Scholar : PubMed/NCBI
|
|
47
|
Marin-Acevedo JA, Dholaria B, Soyano AE,
Knutson KL, Chumsri S and Lou Y: Next generation of immune
checkpoint therapy in cancer: New developments and challenges. J
Hematol. 11:392018.PubMed/NCBI
|
|
48
|
Gentles AJ, Newman AM, Liu CL, Bratman SV,
Feng W, Kim D, Nair VS, Xu Y, Khuong A, Hoang CD, et al: The
prognostic landscape of genes and infiltrating immune cells across
human cancers. Nat Med. 21:938–945. 2015. View Article : Google Scholar : PubMed/NCBI
|
|
49
|
Gajewski TF, Schreiber H and Fu YX: Innate
and adaptive immune cells in the tumor microenvironment. Nat
Immunol. 14:1014–1022. 2013. View Article : Google Scholar : PubMed/NCBI
|
|
50
|
Joyce JA and Fearon DT: T cell exclusion,
immune privilege, and the tumor microenvironment. Science.
348:74–80. 2015. View Article : Google Scholar : PubMed/NCBI
|
|
51
|
Spranger S and Gajewski TF:
Tumor-intrinsic oncogene pathways mediating immune avoidance.
Oncoimmunology. 5:e10868622016. View Article : Google Scholar : PubMed/NCBI
|