Introduction
Approximately 19 million new cancer cases were
reported globally in 2020, with hepatocellular carcinoma (HCC)
patients accounting for ~900,000. The number of deaths due to liver
cancer annually is ~83,000, which is second only to that due to
lung cancer (1). In recent years,
targeted therapy has rapidly developed. Sorafenib (SF), known as
the first-line drug for patients with advanced HCC, has been
corroborated as not only a multikinase inhibitor but also a
ferroptosis inducer (2,3). However, the underlying mechanism of
SF-induced ferroptosis remains elusive.
Ferroptosis is a form of programmed cell death
mainly characterized by iron and lipid peroxide accumulation
(4). Ferroptosis occurs widely in
various human diseases, such as Parkinson's disease (5), cardiovascular diseases (6), and cancer (7). Ferroptosis is not an independent
process and is associated with endoplasmic reticulum (ER) stress,
autophagy, and apoptosis. Ferroptosis plays a common role in
regulated cell death and is induced by the selective inhibition of
the cystine/glutamate transporter system xC−
(8). In addition, ferritinophagy,
the autophagic degradation of ferritin that leads to ferroptosis,
is mediated by nuclear receptor coactivator 4 (NCOA4) (9). p53, a tumor suppressor, plays an
important role in apoptosis. Accumulating evidence has demonstrated
that p53 regulates metabolism and indirectly regulates ferroptosis
(10).
Polypyrimidine tract-binding protein 1 (PTBP1)
shuttles between the nucleus and cytoplasm and has a molecular
weight of 58 kDa (11). PTBP1 is
not only involved in the regulation of mRNA splicing and
translation but also participates in mRNA transport and metabolism
(12). PTBP1 has diverse functions
in numerous biological processes. In the nervous system, PTBP1 is
involved in regulating neuron development and growth (13). PTBP1 also mediates immune
regulation. PTBP1 is involved in CD4+ cell activation
(14), the alternative splicing of
CD46 (15), and the production of
antibodies to B-cell receptors (16). PTBP1 plays an important role in
cholesterol synthesis and glycolysis. PTBP1 regulates cholesterol
synthesis through the low-density lipoprotein receptor (LDLR).
PTBP1 is involved in the process of glycolysis by upregulating PKM2
(17).
However, the specific function and mechanism of
PTBP1 in ferroptosis remain unclear. Therefore, it was investigated
whether PTBP1 could regulate ferroptosis in SF-treated liver cancer
cells and investigated its molecular mechanism and function.
Materials and methods
Culture of cell lines and
transfection
Cellcook Biotech Company provided 4 cell lines used
in the study, including Huh-7 (cat. no. CC0102), Hep3B (cat. no.
CC0103), HepG2 (cat. no. CC0118), and 293T (cat. no. CC4003). The
Huh-7, HepG2 and Hep3B cell lines used in the present study were
authenticated by STR profiling. All cells were cultured in DMEM or
MEM, (Gibco; Thermo Fisher Scientific, Inc.) in an incubator at
37°C under 5% CO2. Additionally, 10% fetal bovine serum
and 1% penicillin-streptomycin solution (both from Gibco;
ThermoFisher Scientific, Inc.) were added to the medium.
Small-interfering RNAs (siRNAs) targeting PTBP1 and the
NCOA4-overexpression plasmid (pcDNA 3.1; NM_001145262.2) were
obtained from Shanghai GenePharma Co., Ltd. Huh-7 and HepG2 cells
(5×10⁵) seeded in six-well plates were transfected with
si-PTBP1 or si-NC (75 pmol/well) and oe-NCOA4 or pcDNA 3.1 (5
µg/well), and LipofectamineTM 2000 reagent (7.5 µl/well)
was used to enhance the transfection according to the
manufacturer's instructions. The sequences of these siRNAs or
shRNAs are provided in Table SI.
Short hairpin RNAs (shRNAs) against PTBP1 were synthesized
by Shanghai Genechem Co., Ltd. Overexpression or knockdown was
confirmed by western blot analysis (WB) or reverse
transcription-quantitative polymerase chain reaction (RT-qPCR)
analyses. Cells were treated with 5 µM SF or dimethyl sulfoxide
(DMSO) for 24 h before use in the subsequent experiments.
RNA extraction and RT-qPCR
The cell and tissue samples were lysed, and the
total RNA was extracted with TRIzol reagent (Invitrogen; Thermo
Fisher Scientific, Inc.). After genomic DNA extraction, Hiscript RT
superMix was used to obtain cDNA according to the manufacturer's
instructions. Two-step RT-qPCR (Vazyme Biotech Co., Ltd.) was
performed on a real-time fluorescence quantitative PCR system
(CFX96; BioRad Laboratories, Inc.) according to the manufacturer's
instructions for ChamQ Universal SYBR qPCR Master Mix (Vazyme
Biotech Co., Ltd.). The qPCR amplification protocol was as follows:
95°C for 30 sec and followed by 40 cycles at 95°C for 10 sec; and
60°C for 30 sec. The 2−ΔΔCq method was used to quantify
the relative expression levels, with GAPDH selected as the
reference gene (18). The primer
sequences (5′-3′) are listed in Table
SII.
WB
Radioimmunoprecipitation lysis buffer (Beyotime
Institute of Biotechnology) was used to extract proteins from the
tissues and cells. The BCA assay method was performed to determine
protein concentration. The proteins were fully denatured for 5 min.
A total of 10 µl protein per lane was loaded for gel
electrophoresis and 10% sodium dodecyl sulfate polyacrylamide gel
electrophoresis was used for protein separation. Next, the proteins
were transferred onto polyvinylidene difluoride (PVDF) membranes
(MilliporeSigma) and the membranes were blocked with 5% fat-free
milk at room temperature for 2 h. The membranes were then incubated
overnight at 4°C with primary antibodies, washed three times, and
then incubated with goat anti-rabbit IgG HRP-conjugated secondary
antibodies (cat. no. E-AB-1003; 1:5,000 dilution; Elabscience
Biotechnology, Inc.) for 1 h at room temperature. The following
antibodies were used: anti-PTBP1 (cat. no. 72669; 1:1,000; Cell
Signaling Technology, Inc.), anti-ferritin heavy chain 1 (FTH1;
cat. no. ab75973; 1:1,000; Abcam), anti-NCOA4 (cat. no. 66849;
1:1,000; Cell Signaling Technology, Inc.), anti-GAPDH (cat. no.
5174; 1:1,000; Cell Signaling Technology, Inc.), and
anti-glutathione peroxidase 4 (cat. no. ab231174; GPX4; 1:1,000;
Abcam). The membranes were detected by chemiluminescence
(MilliporeSigma). ImageJ software (version 1.53; National
Institutes of Health) was used for densitometric analysis.
Cell Counting Kit-8 (CCK-8) and
bioinformatics analyses
Cell survival of Huh-7 and HepG2 was detected with
Cell Counting Kit-8 (cat. no. E-CK-A362; Elabscience Biotechnology,
Inc.) according to the manufacturer's instructions. Cells
(5×10³) were seeded into 96-well plates and treated with
SF or DMSO for 24 h. A total of 10 µl of CCK-8 reagent was added to
each well and incubation followed for 3 h at 37°C in a 5%
CO2 incubator. The OD value at 450 nm was measured using
a microplate spectrophotometer (BioTek Instruments, Inc.) and the
cell survival rate was calculated.
The 33 candidate genes were selected to explore the
specific mechanism of PTBP1 in ferroptosis using the Kyoto
Encyclopedia of Genes and Genomes (KEGG) database (https://www.kegg.jp). In addition, RBPmap (http://rbpmap.technion.ac.il; version 1.2) was used to
identify a potential binding region of PTBP1.
C11-BODIPY 581/591 fluorescent probe
staining
According to the instructions, C11-BODIPY 581/591
(cat. no. RM02821; ABclonal Biotech Co., Ltd.) was diluted at
1:200, added to a Petri dish, and incubated at 37°C for 1 h. Huh-7
or HepG2 cells were then incubated with 4% paraformaldehyde (Wuhan
Servicebio Technology, Co., Ltd.) for 10 min in the dark. The
fluorescence intensity of the sample was observed under a confocal
microscope (Nikon A1+; Nikon Corporation).
Lipid peroxidation assay
Lipid peroxidation was evaluated with a lipid
peroxidation [malondialdehyde (MDA)] assay kit (cat. no. ab118970;
Abcam) according to the manufacturer's instructions. After the
Huh-7 and HepG2 cells were completely lysed with MDA lysis buffer,
the supernatant was extracted by centrifugation for 10 min, and a
part of the sample was stored for protein quantification.
Subsequently, 600 µl thiobarbituric acid (TBA) solution was added
to the samples, and the samples were incubated at 95°C for 60 min.
Finally, 200 µl of each sample were added to a 96-well plate. The
experiment was performed three times. After measuring the
absorbance of the sample, the MDA concentration was calculated
based on the standard curve.
Glutathione assay
The treated Huh-7 and HepG2 cells were detected with
a glutathione (GSH) detection kit (cat. no. A006-2-1); Nanjing
Jiancheng Bioengineering Institute) according to the manufacturer's
instructions, mixed well, and incubated for 5 min at room
temperature. The absorbance was measured at 405 nm. Moreover, the
protein concentration in the samples was determined according to
the standard curve determined by a BCA assay. The GSH content was
calculated based on the standard curve.
Intracellular iron
An iron assay kit (cat. no. ab83366; Abcam) was used
to test the intracellular iron levels according to the
manufacturer's instructions. Following the addition of 200 µl of
iron assay buffer, the samples were incubated for 10 min at room
temperature to completely lyse the Huh-7 and HepG2 cells. An
ultrasonic cell wall-breaking apparatus (JY-IIN; Ningbo Scientz
Biotechnology Co., Ltd.) was used to lyse the cells, which were
then centrifuged at 12,000 × g for 10 min at 4°C, and 150 µl of the
supernatant were collected. After adding 100 µl of iron probe, the
sample was incubated at room temperature for 1 h, and the
absorbance was measured at 593 nm.
RNA immunoprecipitation (RIP)
assay
The RIP assay was performed using an EZ-Magna RIP
kit (cat. no. 17-700; MilliporeSigma) according to the
manufacturer's instructions. Huh-7 cells were lysed on ice for 5
min. Immunoprecipitation was performed by adding 100 µl of magnetic
beads protein A/G and 5 µg of anti-PTBP1 (cat. no. 32-4800; Thermo
Fisher Scientific, Inc.), and the samples were incubated at room
temperature for 30 min. The samples were added to the
immunoprecipitated magnetic bead complex, incubated overnight at
4°C, treated with protease K buffer, and incubated at 55°C for 30
min for protein digestion, and 400 µl of phenol, chloroform, and
isoamyl alcohol solution were added for RNA purification. The
obtained RNA was sequenced by RT-qPCR, and the DNA amplified by
qPCR was analyzed by agarose gel electrophoresis. Additionally, 1%
agarose gels were selected for electrophoresis and ethidium bromide
(1 µg/ml) solution was applied for staining of the agarose gel for
20 min at room temperature.
Dual-luciferase reporter assay
Psi-check2 luciferase vector (Promega Corporation)
with or without NCOA4 and pcDNA3.1 or oe-PTBP1 were co-transfected
into 293T cells with the aid of LipofectamineTM 2000
reagent. The cells were collected 48 h post-transfection to detect
luciferase activity. After the cells were lysed, 100 µl Stop &
Glo® Reagent (Promega Corporation) were added to the
samples. The Renilla luciferase and firefly luciferase
values were determined by dual-luciferase reporter system (part no.
E1910; Promega Corporation) and the method of comparison with
firefly luciferase activity was adopted to normalize luciferase
activity.
Pull-down assay
The constructed biotin-labeled NCOA4 mRNA
5′-untranslated region (UTR) fragment and the negative control
fragment were obtained from Viagene Biotechnology Biotech, Inc. The
probe sequence for the NCOA4 mRNA pulldown was as follows:
Biotin-5′-GGUUAUGCUUUUAAUGGAAGCAGAUACAAAAU; negative control
sequence Biotin-5′-CGATATAGAGACGATTGGCTGGGCCCCTG. Huh-7 cells were
lysed using IP lysis buffer (cat. no. 87787; Thermo Fisher
Scientific, Inc.) and centrifuged at 12,000 × g for 10 min at 4°C.
The 100-µl lysates were subsequently added to the biotinylated
probe and co-incubated at room temperature for at least 30 min. The
complexes were isolated using prepared strepavidin-coupled
Dynabeads according to the manufacturer's instructions (cat. no.
11205D; Thermo Fisher Scientific, Inc.). Following the addition of
1X protein sample loading buffer, the samples were incubated at
95°C for 10 min and the products were analyzed using WB with
antibodies against PTBP1 (cat. no. 72669; 1:1,000; Cell Signaling
Technology, Inc.).
Cycloheximide (CHX) chase assay
To evaluate whether PTBP1 influenced the stability
of NCOA4, Huh-7 cells were transfected with PTBP1 siRNAs, incubated
for 24 h, treated with 20 µg/µl CHX (Sigma-Aldrich; Merck KGaA) for
the indicated time-points (0, 15, 30, 60 and 120 min) to inhibit
protein synthesis, and subjected to WB.
Nascent protein analysis
A new protein synthesized analysis was performed
using Click-iT AHA for Nascent Protein Synthesis (cat. no. C10102;
Invitrogen; Thermo Fisher Scientific, Inc.) and Click-iT Biotin
protein analysis detection kits (cat. no. C33372; Invitrogen;
Thermo Fisher Scientific, Inc.) according to the manufacturer's
instructions. Methionine-free medium was added to the cells to
deplete methionine reserves and AHA for 4 h. After Huh-7 cells
lysed, the samples were prepared for the Click-iT®
detection reaction. Nascent proteins were pulled down and analyzed
by WB.
Mouse xenograft model
A total of eight male BALB/c nude mice (4–5 weeks
old; weight, 13–18 g) were obtained from Beijing Vital River
Laboratories. The mice were raised in specific pathogen-free
conditions with food and water ad libitum, and the rearing
environment was maintained with a 12-h light/dark cycle at a
temperature of 26–28°C and a relative humidity of 50±10%. All
animal experiments were approved by the Animal Care and Use
Committee of Shandong Provincial Qianfoshan Hospital (approval no.
S725). The mice were randomly divided into the following two
groups: The NC + SF and sh-PTBP1 + SF groups. Hep3B cells
(2×10⁶) were subcutaneously injected into the right
flank of each mouse. The mice were injected intraperitoneally with
SF (10 mg/kg) every 2 days for 2 weeks. The mice were sacrificed by
CO2 euthanasia four weeks later, and the tumors were
harvested. The tumor volume was calculated as follows: V=0.5
(length × width2). A portion of the hepatic tumor tissue
was extracted to measure the iron, MDA, and GSH levels.
Statistical analyses
The statistical analyses were performed using
GraphPad 8 software (GraphPad Software, Inc.). The data are
presented as line charts or bar charts. The differences between two
independent samples were compared using an independent-samples
t-test. All experiments were repeated three times. P<0.05
was considered to indicate a statistically significant
difference.
Results
Silencing of PTBP1 positively
regulates the sensitivity of liver cancer cells to ferroptosis
For a preliminary verification of whether PTBP1 was
associated with ferroptosis in liver cancer, Huh-7 and HepG2 cells
were treated with SF (5 µM) for 24 h. RT-qPCR and WB were performed
to observe the relative expression of PTBP1. PTBP1 was
significantly increased in the SF groups compared with the blank
and DMSO groups in the HepG2 and Huh-7 cell lines (Fig. 1A and B). These results suggest that
PTBP1 is a key factor in SF-induced ferroptosis. The CCK-8 results
revealed that liver cancer cells viability significantly decreased
under SF induction. Compared with the NC + SF group, the cell
viability was higher in the si-PTBP1 group, suggesting that the
sensitivity to ferroptosis decreased after silencing of PTBP1
(Fig. 1C and D). Next, the iron,
MDA, and GSH levels were detected. The MDA and iron levels were
significantly reduced in the si-PTBP1+ SF group compared with those
in the NC + SF group (Fig. 1E and
F). Additionally, cells transfected with si-PTBP1 showed an
increase in intracellular GSH levels after SF treated for 24 h
(Fig. 1G). The liquid peroxide
levels were observed using C11 BODIPY 581/591. When C11-BODIPY is
oxidized, the fluorescence signal changes from red (nonoxidized) to
green (oxidized) (19). The green
fluorescence signal intensity (oxidized) was significantly weakened
after transfection of si-PTBP1, as observed under a confocal
microscope (Fig. 1H).
Correspondingly, these results indicate that decreased PTBP1
expression reduced the sensitivity to ferroptosis.
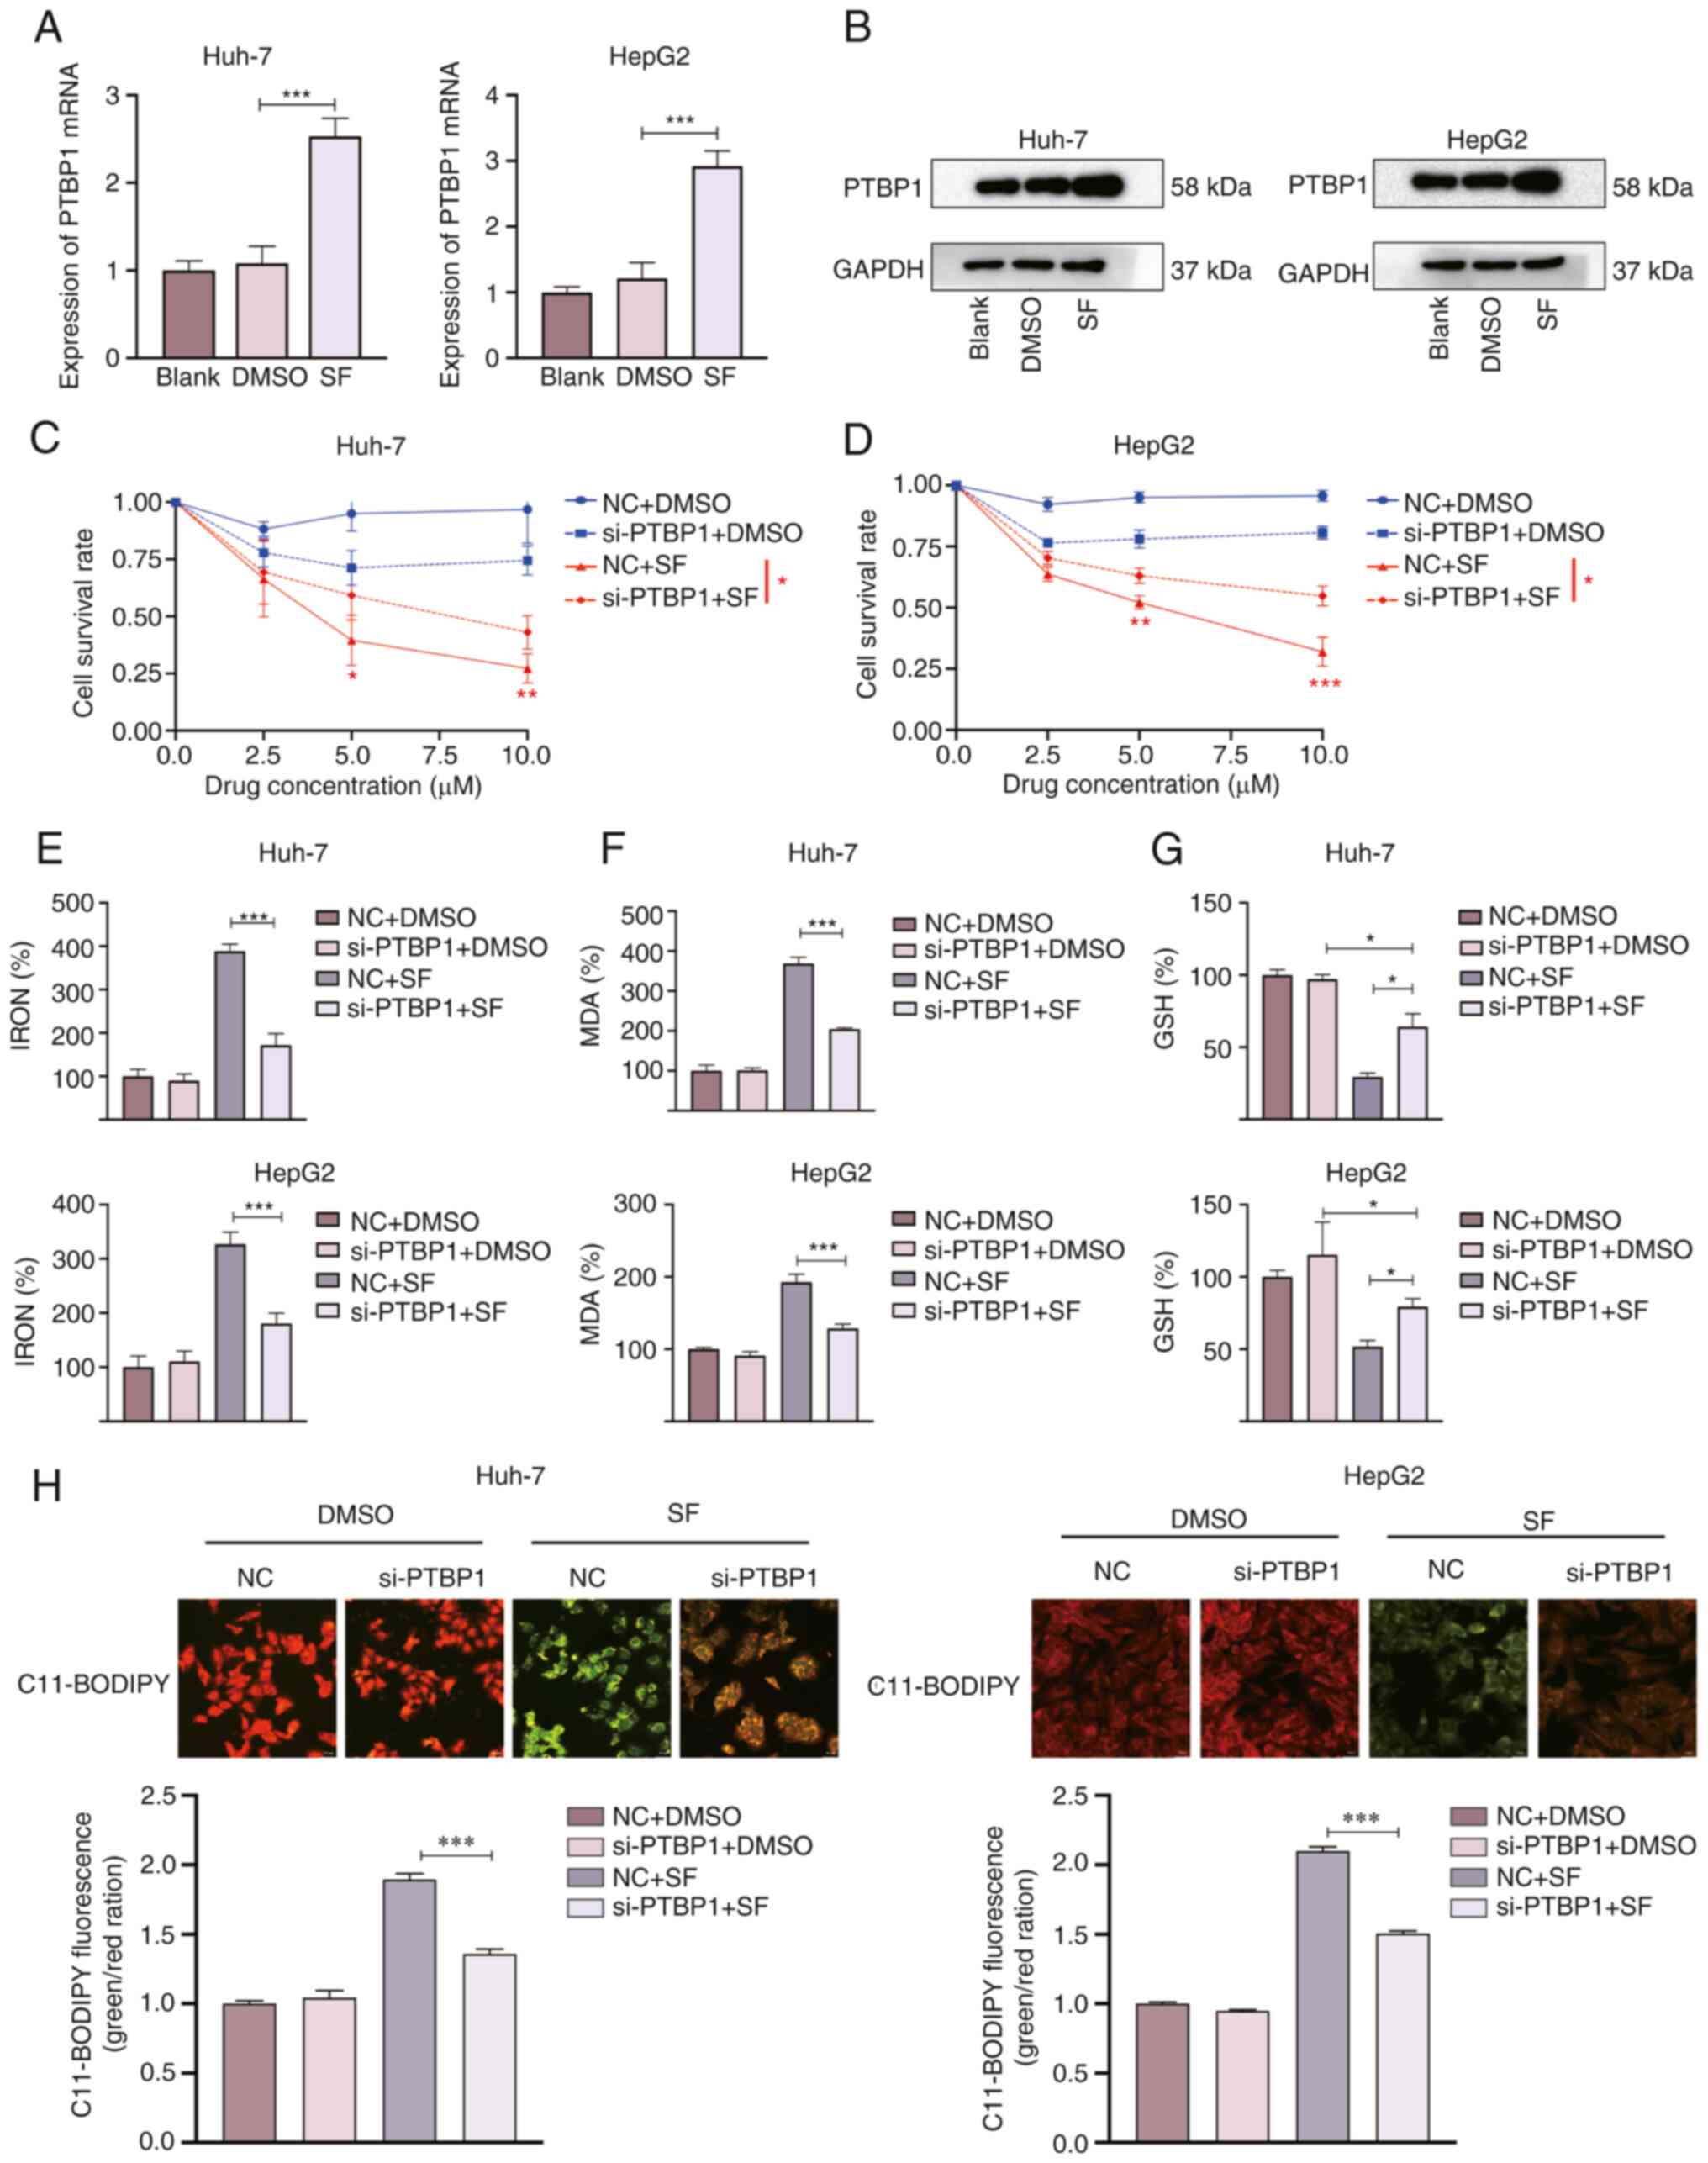 | Figure 1.PTBP1 knockdown decreases the
sensitivity of SF-treated liver cancer cells to ferroptosis. PTBP1
(A) mRNA and (B) protein level changes following SF treatment (5
µM, 24 h). (C and D) SF inhibited the growth of liver cancer cells
as revealed by the results of the CCK-8 assay. (E-G) Changes in the
levels of ferroptosis indicators in liver cancer cells after SF
treatment. Following silencing of PTBP1, the levels of (E)
iron and (F) MDA significantly decreased, whereas that of (G)
intracellular GSH significantly increased. (H) Representative
confocal microscopic images of C11-BODIPY 581/591 staining in
SF-treated liver cancer cells. *P<0.05, **P<0.01 and
***P<0.001 (Student's t-test). PTBP1, polypyrimidine
tract-binding protein 1; SF, sorafenib; CCK-8, Cell Counting Kit-8;
MDA, malondialdehyde; GSH, glutathione; NC, negative control; si-,
small interfering RNA. |
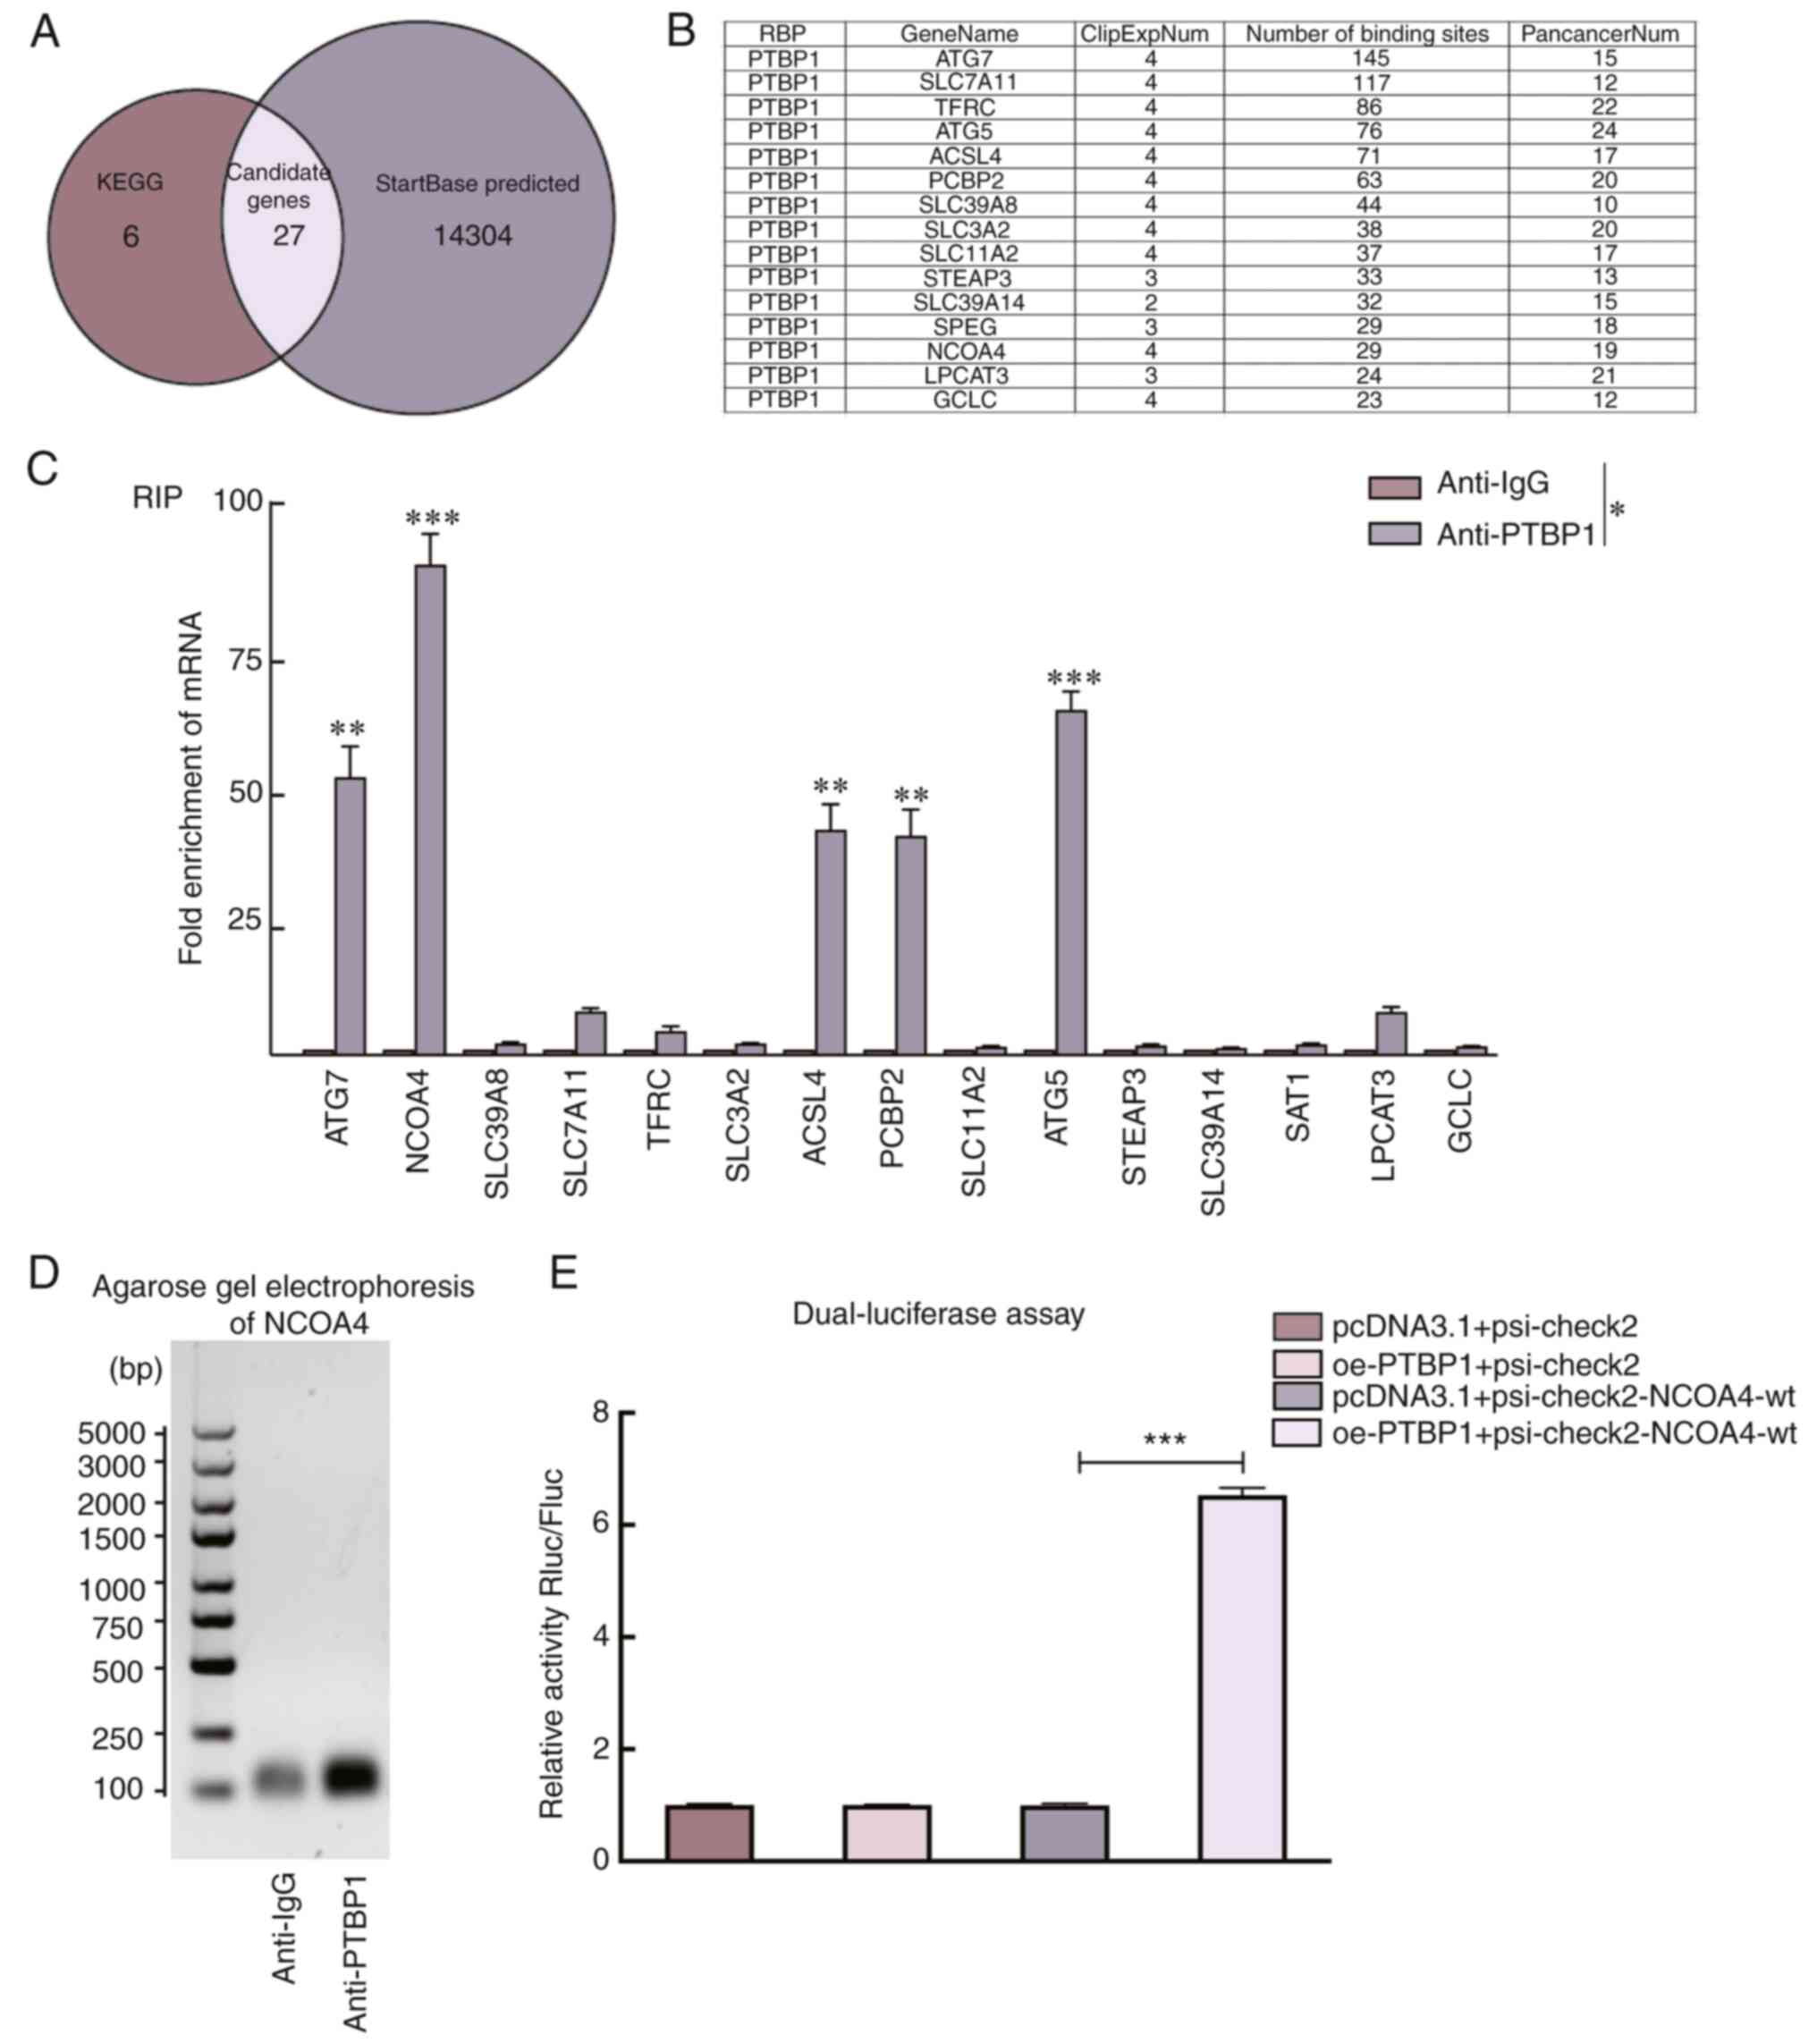
PTBP1 targets NCOA4 and regulates
ferroptosis in liver cancer cells
To explore the specific mechanism of PTBP1 in
ferroptosis, 33 genes in the ferroptosis pathway (map04216) were
first selected using the KEGG database as candidate molecules
(Table SIII). Subsequently, 14,331
downstream genes of PTBP1 were predicted by StarBase v2.0
(http://starbase.sysu.edu.cn) (Fig. 2A). Finally, 15 key genes were
identified as PTBP1 targets (number of binding sites >20)
(Fig. 2B). The downstream binding
sites of PTBP1 were further verified using a RIP-qPCR assay. The
fold changes of NCOA4, ATG7, ATG5, ACSL4 and PCBP2
enriched by anti-PTBP1 were significantly higher than those in the
anti-IgG group (Fig. 2C). NCOA4 was
finally selected as the major target because of the highest fold
change among the 15 candidate genes. The RT-qPCR amplification
products of NCOA4 were subjected to nucleic acid gel
electrophoresis. The results revealed that PTBP1 interacts with
NCOA4 mRNA (Fig. 2D). To
verify the direct interaction between PTBP1 and NCOA4, a
dual-luciferase assay was performed and it was revealed that PTBP1
overexpression increased luciferase activity in 293T cells
transfected with psi-check2-NCOA4 but not in those
transfected with pcDNA3.1, suggesting that PTBP1 can directly
interact with NCOA4 (Fig.
2E).
PTBP1 regulates the translation of
NCOA4 by targeting the NCOA4 mRNA 5′-UTR
The relative NCOA4 mRNA levels in Huh-7 cells
showed no significant change after PTBP1 silencing (Fig. 3A), whereas NCOA4 protein expression
was significantly reduced (Fig.
3B). NCOA4 stability remained unaffected after the cells were
treated with CHX (20 µg/µl) (Fig.
3C). Nascent protein of NCOA4 was detected, and it was observed
that NCOA4 was significantly decreased after the PTBP1
knockdown (Fig. 3D). To identify a
potential binding region of PTBP1, the sites matching PBTP1 were
predicted with an RBPmap. The results showed that two binding sites
strongly matched to the 5′-UTR (Fig.
3E). Biotinylated segments of the 5′-UTR of NCOA4 mRNA
were then synthesized to perform pull-down assays, and the products
were analyzed using WB. It was observed that PTBP1 expression was
markedly enhanced in the NCOA4 5′-UTR group in Huh-7 cells
(Fig. 3F). These results indicate
that the PTBP1-binding region was in the 5′-UTR of the NCOA4
mRNA sequence and that PTBP1 promotes NCOA4 translation by
interacting with the NCOA4 mRNA 5′-UTR. To explore the
specific role of PTBP1 in the ferroptosis pathway, WB was
performed. GPX4 and FTH1 expression increased after transfecting
si-PTBP1 into SF-induced liver cancer cells (Fig. 3G). GPX4 converts potentially toxic
lipid hydroperoxides (L-OOH) to nontoxic lipid alcohols (L-OH),
while GPX4 inhibition causes the accumulation of lipid
hydroperoxides, increasing ferroptosis sensitivity (4).
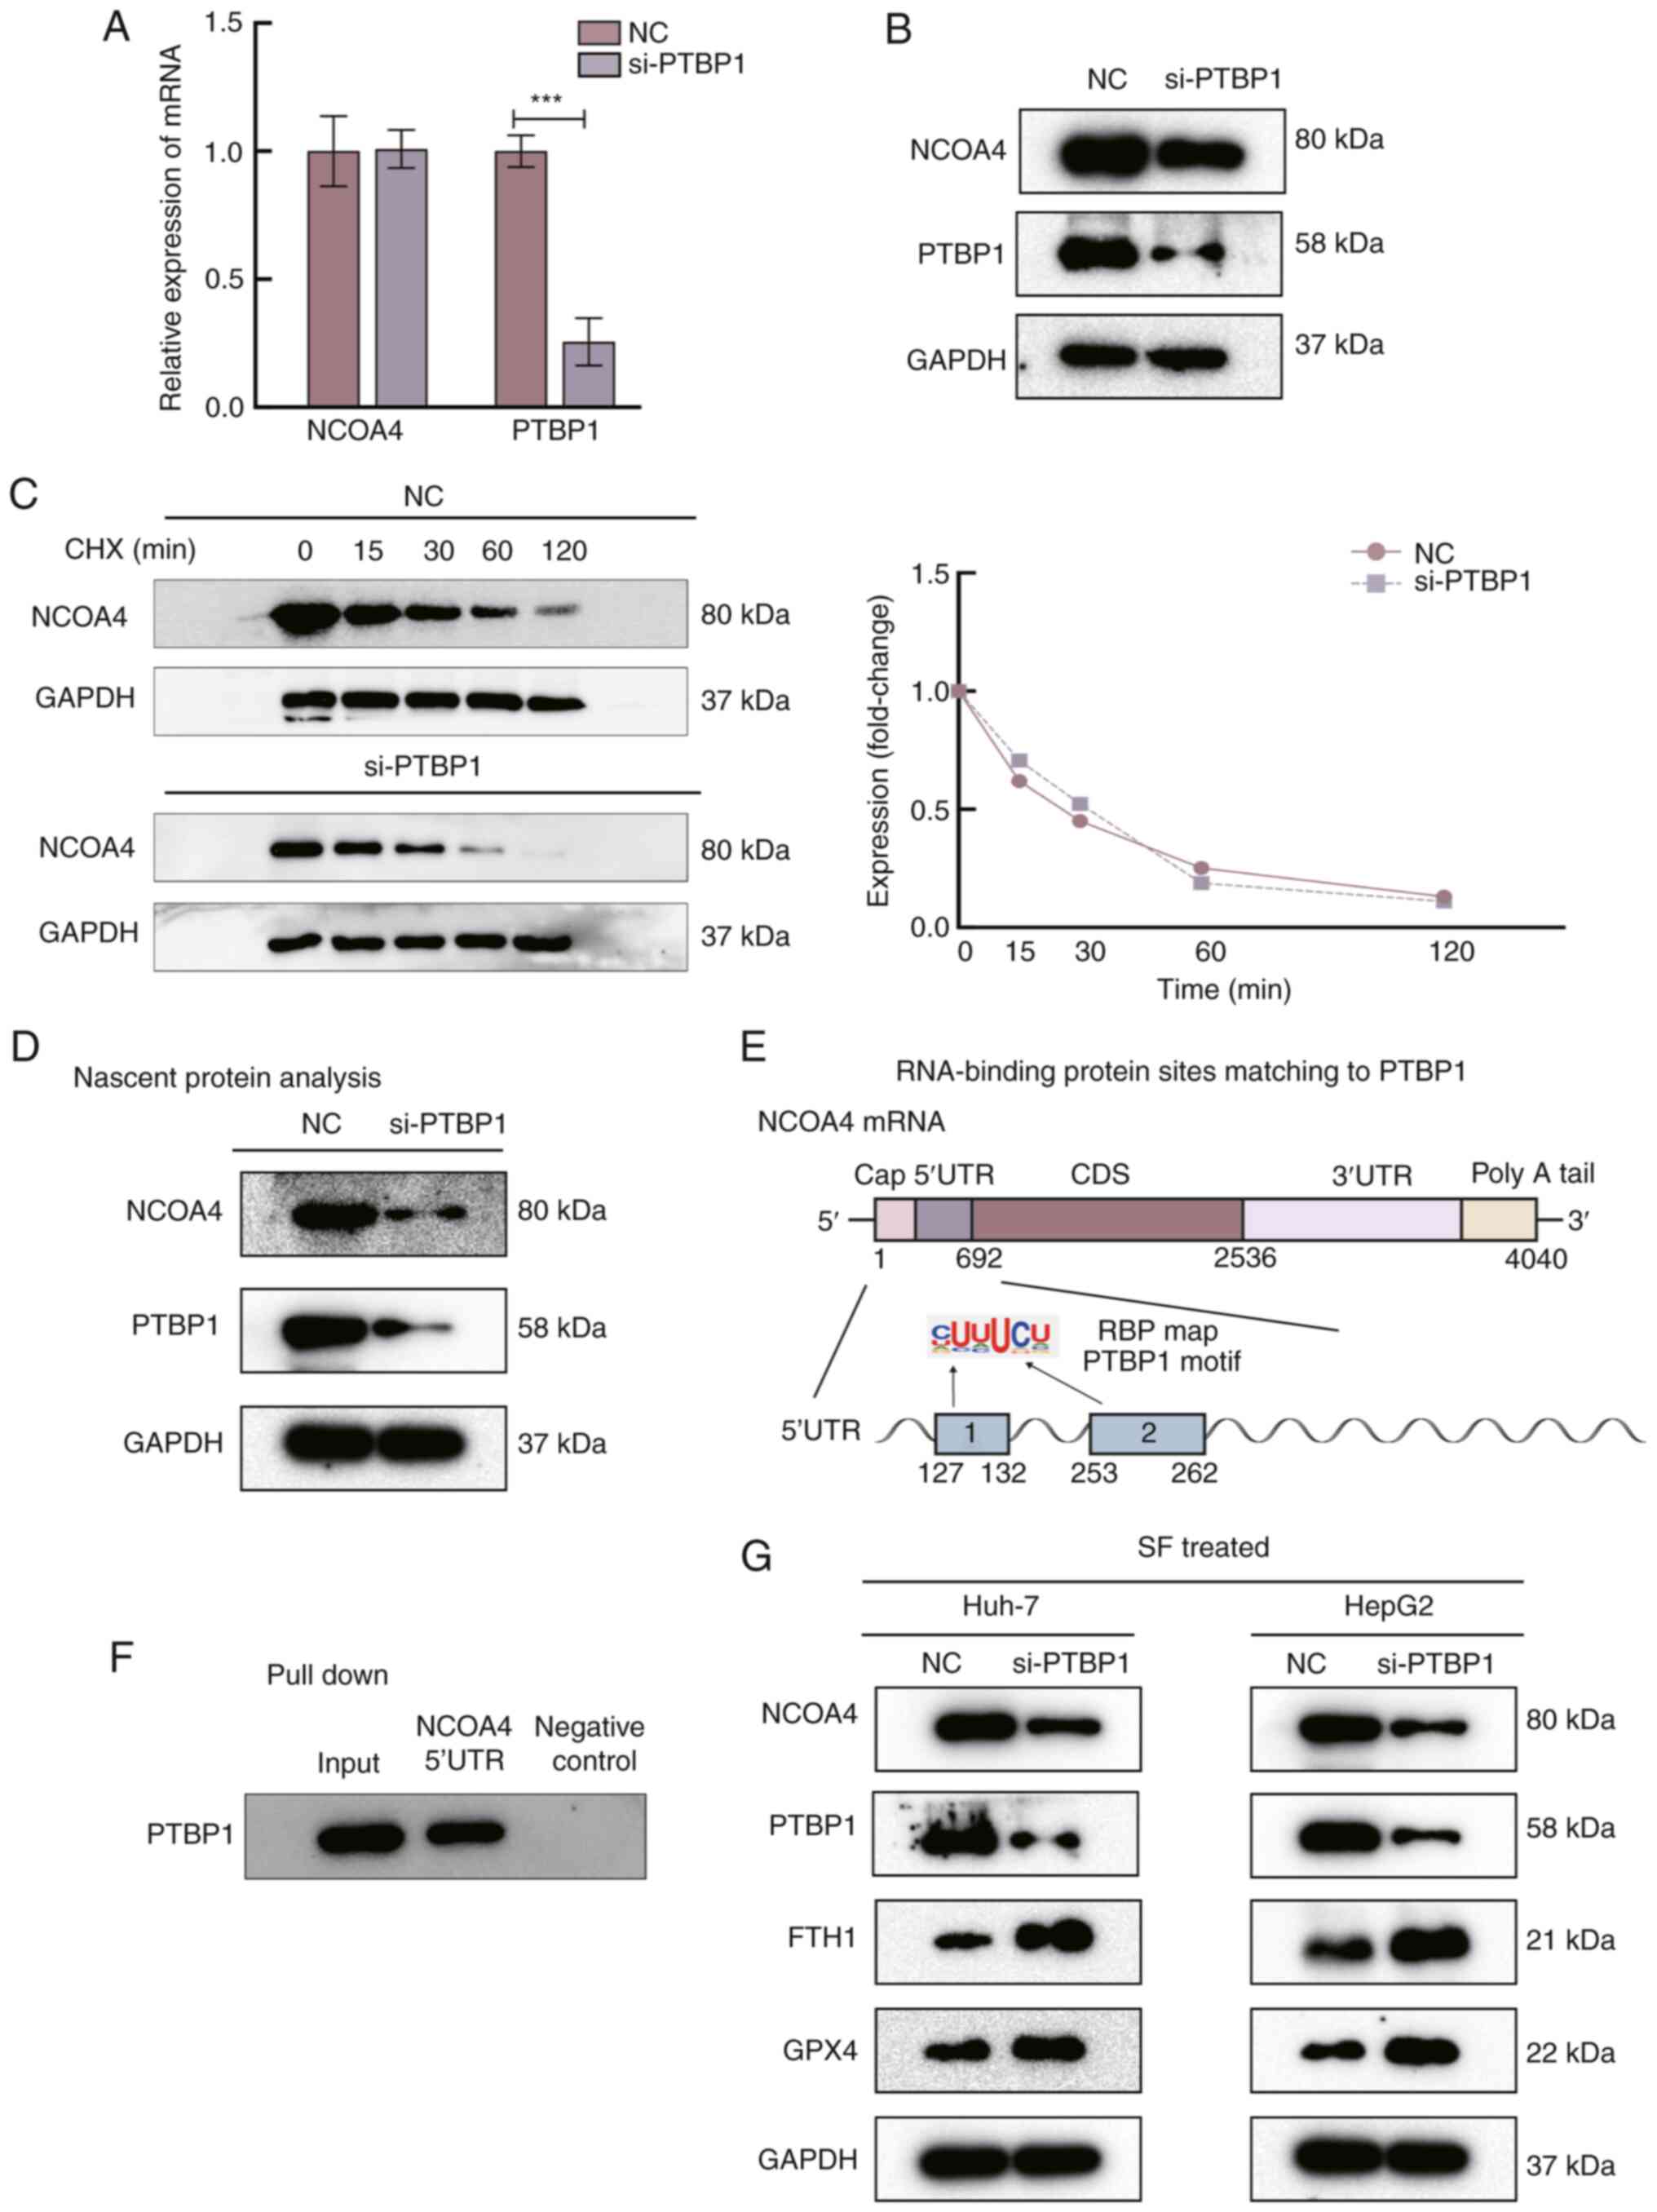 | Figure 3.PTBP1 promotes ferroptosis by
regulating the translation of NCOA4. (A) Silencing of PTBP1
did not significantly alter the mRNA levels of NCOA4. (B) The
protein level of NCOA4 was significantly decreased after
transfection with si-PTBP1 for 48 h. (C) Evaluation of NCOA4
stability in Huh-7 cells treated with cycloheximide. (D) Nascent
translation of NCOA4 in Huh-7 cells. The protein level of NCOA4
markedly decreased after silencing of PTBP1. (E) RNA-binding
protein sites of PTBP1 were predicted by RBP mapping. (F) The
results of the biotin pull-down analysis revealed the interaction
between PTBP1 and the NCAO4 mRNA 5′-UTR. Biotinylated
GAPDH 3′-UTR was included as a negative control. (G)
Function of PTBP1 in the ferroptosis pathway. Western blot analysis
of the protein levels of PTBP1, NCOA4, FTH1 and GPX4, with GAPDH as
a negative control. ***P<0.001 (Student's t-test). PTBP1,
polypyrimidine tract-binding protein 1; NCOA4, nuclear
receptor coactivator 4; si-, small interfering RNA; RBP,
RNA-binding protein; FTH1, ferritin heavy chain 1; GPX4,
glutathione peroxidase 4; NC, negative control; CHX,
cycloheximide. |
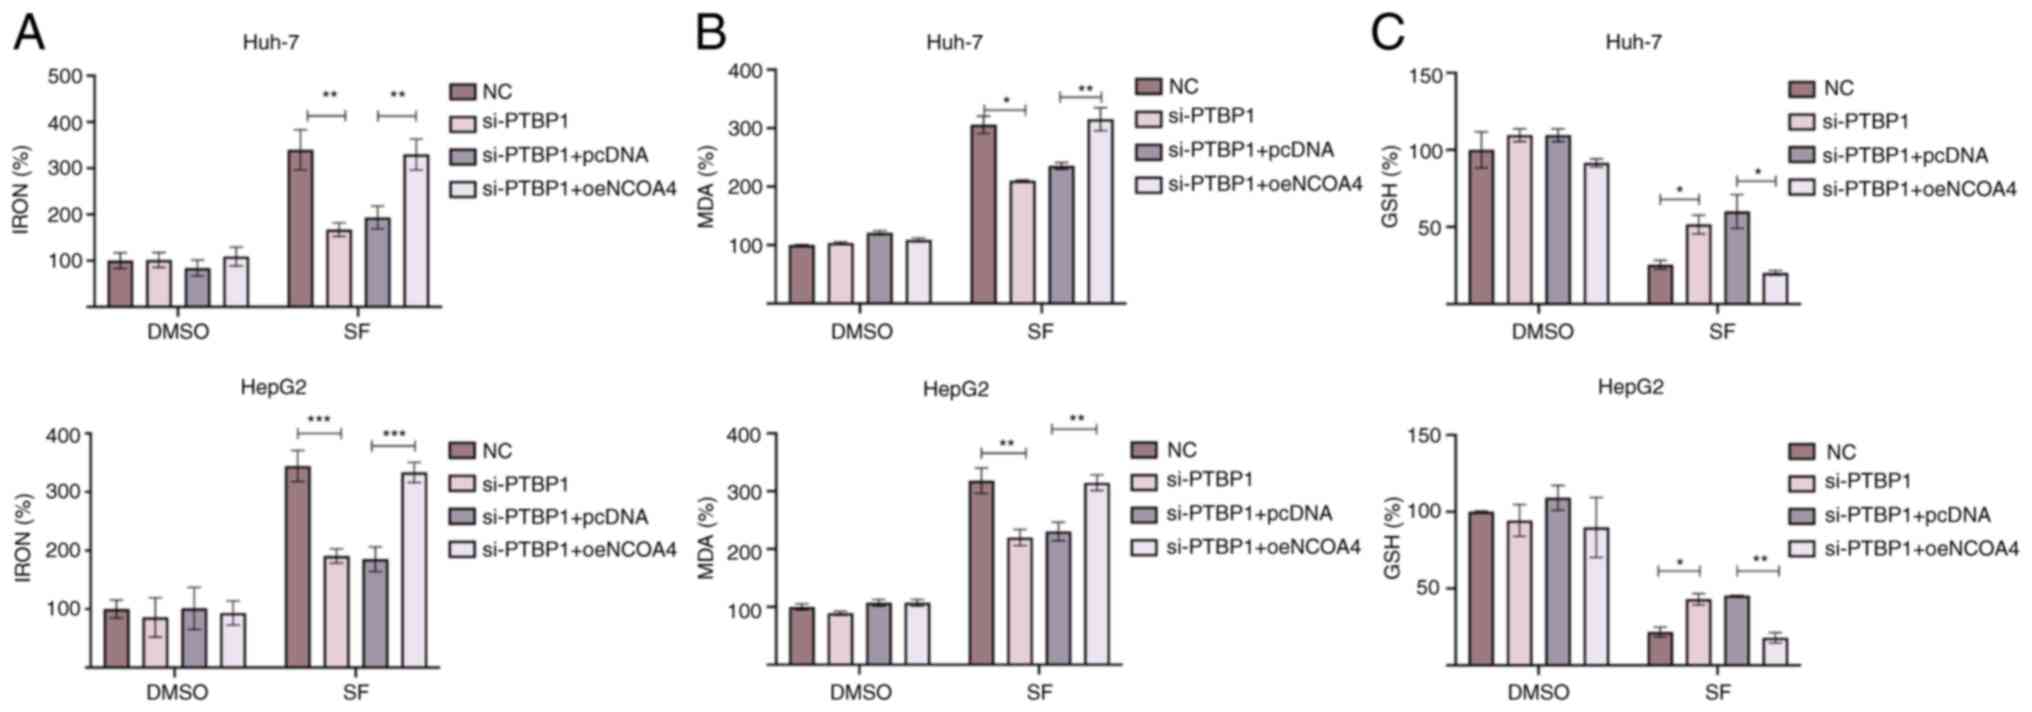
NCOA4 overexpression increases
sensitivity to SF-induced ferroptosis
A previous study revealed that NCOA4 is a key
ferroptosis regulator that promotes iron accumulation in cells
(20). To verify whether PTBP1
regulates SF-induced ferroptosis by mediating NCOA4 translation,
rescue experiments were performed. The levels of iron, MDA, and GSH
in liver cancer cells were detected. The levels of iron and MDA
were significantly reduced following si-PTBP1 transfection. The
NCOA4 overexpression successfully reversed the decreased
intracellular levels of iron and MDA in liver cancer cells
(Fig. 4A and B). In addition, it
was observed that the increased levels of GSH following
transfection with si-PTBP1 were decreased after the overexpression
of NCOA4 (Fig. 4C). Collectively,
the findings indicated that NCOA4 may be a key downstream
target of PTBP1 in ferroptosis regulation. Under SF-induced
conditions, PTBP1 promoted NCOA4 translation, accelerated FTH1
degradation, prompted a rapid increase in the intracellular iron
levels, and stimulated intracellular reactive oxygen species (ROS)
accumulation.
PTBP1 promotes sensitivity to
ferroptosis in vivo
To explore whether PTBP1 regulates ferroptosis in
xenograft models, four-week-old mice were randomly allocated into
NC + SF and sh-PTBP1 + SF groups (Fig.
5A). The tumor volumes were recorded every 3–4 days, and the
mice were observed for four weeks. The tumor volumes were
significantly reduced in the NC + SF group (Fig. 5B), whereas the mean tumor weight was
increased in the sh-PTBP1 + SF group (Fig. 5C). Next, the relative levels of MDA,
GSH, and iron were detected. The levels of MDA and iron in the
tumors were significantly decreased after the knockout of PTBP1.
The GSH depletion was rescued compared with that in the NC + SF
group (Fig. 5D). Moreover, proteins
were extracted from randomly selected tumor specimens to perform
WB. The expression of FTH1 and GPX4 was increased in Hep3B cells
transfected with sh-PTBP1 (Fig.
5E). These results suggest that PTBP1 promotes SF-induced
ferroptosis and reveal the biological role of PTBP1 in ferroptosis
progression in vivo.
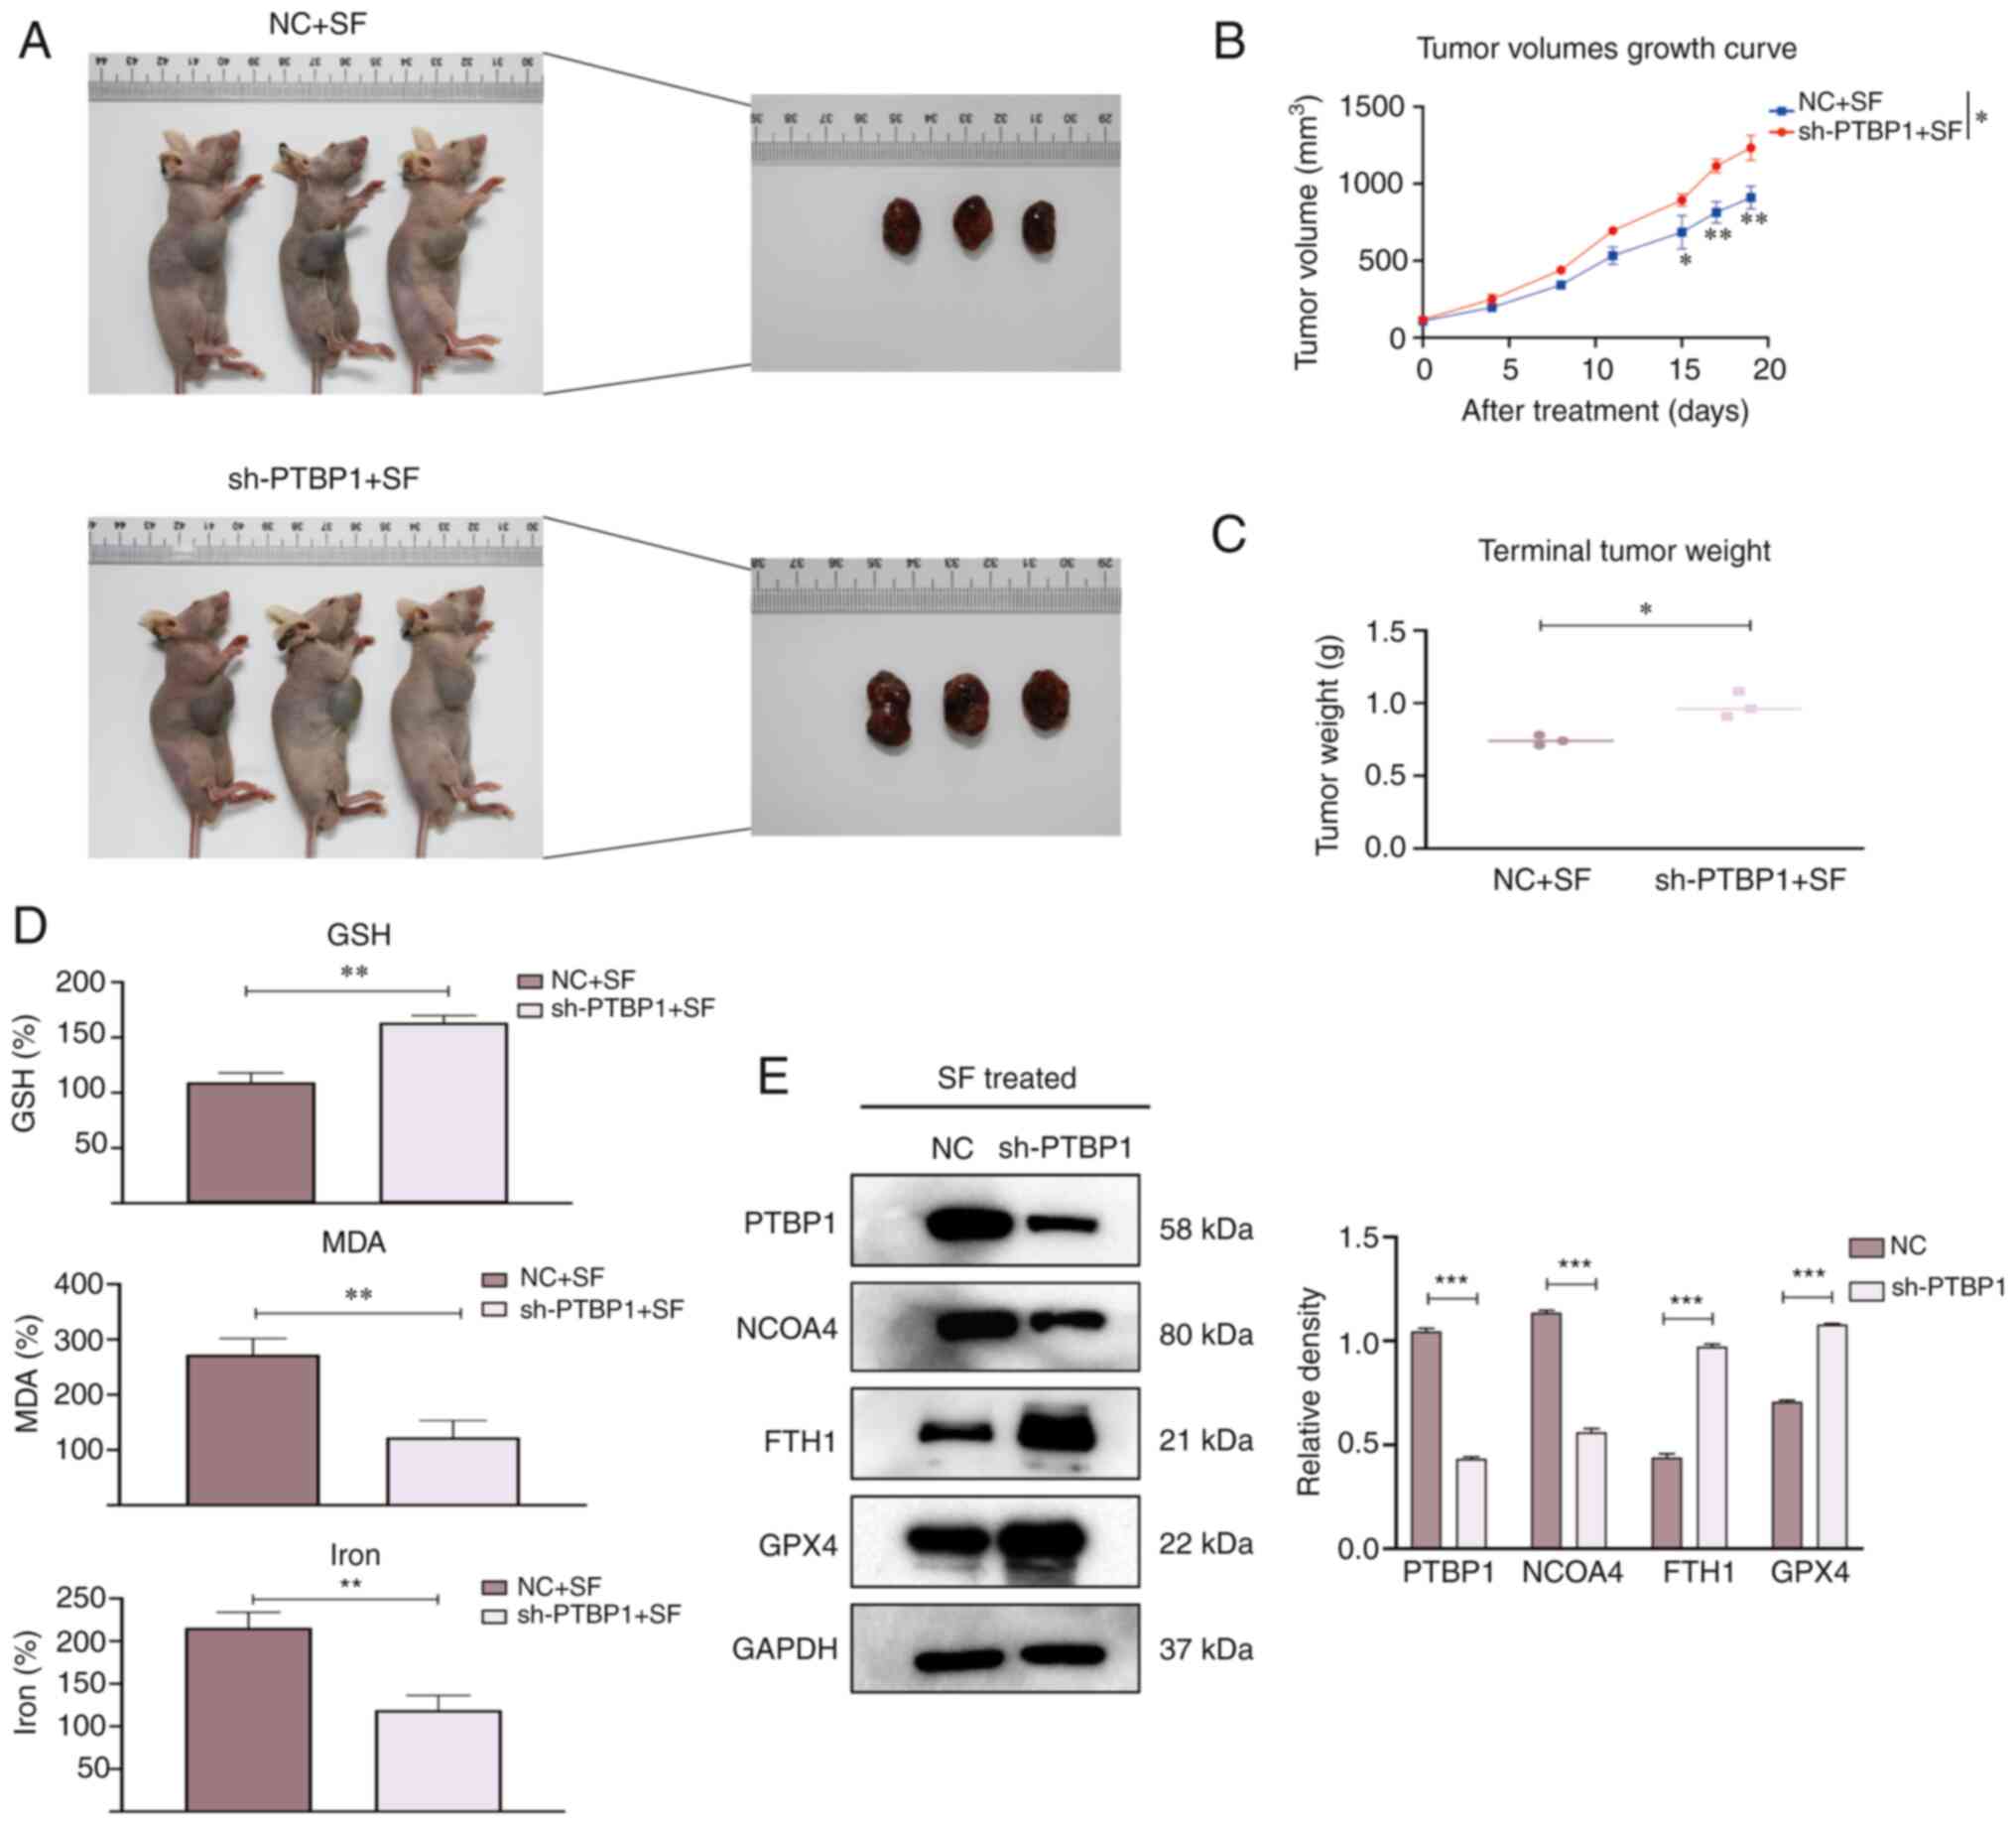 | Figure 5.Biological role of PTBP1 in
vivo. Mice were divided into two groups, namely, the NC + SF
group and the sh-PTBP1 + SF group. (A) Representative images of
nude mice after various treatments (mice that had succumbed and/or
were deemed inelegible were excluded). (B) The tumor volume was
measured every 3–4 days. An increase in the mean tumor volume was
observed after silencing of PTBP1. (C) The mean tumor weight
was decreased in the NC + SF group compared with that in the
sh-PTBP1 + SF group after SF treatment for two weeks. (D) The
relative levels of ferroptosis indicators, including GSH, MDA, and
iron. (E) Proteins were extracted from random mouse specimens, and
the levels of PTBP1, FTH1, GPX4 and NCOA4 were assessed by a
western blot analysis, with GAPDH as the internal reference.
*P<0.05, **P<0.01 and ***P<0.001 (Student's
t-test). PTBP1, polypyrimidine tract-binding protein 1; NC,
negative control; SF, sorafenib; sh-, short hairpin RNA; GSH,
glutathione; MDA, malondialdehyde; FTH1, ferritin heavy chain 1;
GPX4, glutathione peroxidase 4; NCOA4, nuclear receptor coactivator
4. |
Discussion
Previous studies have reported that ferroptosis
plays a key role in SF resistance and combination therapy.
Increased MT-1G expression was revealed to reduce intracellular GSH
depletion, inhibits ferroptosis, and promote SF resistance
(21). GSTZ1 deletion activated the
NRF2 pathway and increased GPX4 expression, thus suppressing
SF-induced ferroptosis (22).
YAP/TAZ was revealed to depend on TEAD to upregulate SLC7A11
expression and synergistically induce SLC7A11 expression by
maintaining the stability of the ATF4 protein. High SLC7A11
expression inhibited ferroptosis and promoted SF resistance
(23). Disulfiram (DSF) was
demonstrated to significantly activate p62 phosphorylation,
resulting in the accumulation of iron and lipid peroxides in cells
and induction of ferroptosis. DSF enhanced the cytotoxicity of SF
via ferroptosis and inhibited the growth of HCC cells (24). In the present study, it was
demonstrated that SF upregulated the expression of PTBP1 in liver
cancer cells. Compared with the control group, it was determined
that the levels of iron and MDA were decreased after silencing of
PTBP1. PTBP1 enhanced the sensitivity of liver cancer cells to
ferroptosis and helped solve the issue of SF resistance.
RBPs are active in ferroptosis. In colorectal
cancer, SFRS9 enhanced its expression by binding GPX4 mRNA
and inhibited SF and erastin-induced ferroptosis (25). hnRNPA1 induced cancer-associated
fibroblasts to secrete miR-522 exosomes, resulting in ALOX15
inhibition and ROS accumulation in cancer cells and ultimately
reducing ferroptosis sensitivity (26). ZFP36 inhibited TAG6L1 mRNA
stability and activated ferritinophagy to regulate ferroptosis
sensitivity in hepatic stellate cells (27).
PTBP1, an RNA-binding protein, also plays an
important role in ferroptosis in liver cancer cells. A previous
study reported that PTBP1 was involved in autophagy regulation. The
binding of lncRNA ZNF649-AS1 to PTBP1 enhanced the stability of
ATG5 mRNA and promoted autophagy in breast cancer cells (28). Hou et al reported that
silencing ATG5 and ATG7 significantly decreased the level of
intracellular iron and weakened the sensitivity to ferroptosis
(29). In the present study, it was
further hypothesized that PTBP1 regulates ferroptosis through
ferritinophagy. The results in the present study indicated an
interaction between PTBP1 and NCOA4 mRNA through RIP and
dual-luciferase gene reporter assays. It was confirmed that PTBP1
regulates ferroptosis by interacting with NCOA4.
In 1996, NCOA4 was first discovered, and its
614-amino acid sequence was detected for the first time. The
calculated molecular weight was 70 kDa (30). The two transcript isoforms of NCOA4
in humans are NCOA4α and NCOA4β, both of which have an N-terminal
coiled-coil domain. NCOA4β only has a partial C-terminal domain,
which also leads to some functional differences (31).
Research has reported that the binding sites of
NCOA4 and FTH1 are located in the NCOA4α C-terminal domain but not
in NCOA4β (32). Initially, NCOA4
was considered a steroid receptor coactivator widely distributed in
humans (30). As research
progressed, NCOA4 was identified as a cargo receptor that targets
ferritin to autophagosomes during selective autophagy (33). The process of selective autophagy
involves specific receptor proteins that target selected cargoes
for autophagic degradation. As a selective autophagy receptor
protein, NCOA4 plays an important role in ferroptosis.
Ferritinophagy plays a key role in ferroptosis.
Ferritinophagy mainly mediates ferritin degradation and enhances
ferroptosis sensitivity (29,34).
PTBP1 promotes ‘ferritinophagy’ by upregulating NCOA4 expression.
In the present study the interaction between PTBP1 and the
NCOA4 mRNA 5′-UTR was confirmed by a pulldown assay using
biotin-labeled RNA fragments. The eukaryotic 5′-UTR plays an
important role in controlling translation efficiency (35). The qPCR results showed that the
NCOA4 mRNA levels were unchanged after PTBP1
silencing. However, NCOA4 protein expression was significantly
reduced. It was inferred that PBTP1 is involved in the positive
regulation of NCOA4 translation and contributes to the sensitivity
of liver cancer cells to ferroptosis. NCOA4 binds ferritin via its
C-terminal domain and interacts with LC3B to deliver selective
cargo to autophagosomes (36).
Ferritinophagy mainly recruits ferritin for degradation in the
lysosome and the release of free iron. When iron accumulates in
cells, ROS are generated via the Fenton reaction, which can lead to
ferroptosis (37). As a feedback
mechanism, the NCOA4 expression level is closely related to the
cytoplasmic iron levels (33). In
previous research it was revealed that when the intracellular iron
level was high, NCOA4 was degraded via the HERC2-mediated
proteasomal degradation pathway (32).
In the present study, the effect of PTBP1 on
ferroptosis was verified in liver cancer cells. However, whether
PTBP1 plays the same role under the stimulation of ferroptosis
inducers, such as RSL3 and erastin, remains to be determined.
Further investigation is required. In addition, whether PTBP1 is
involved in regulating ferroptosis by mediating other genes in the
ferroptosis pathway remains unclear.
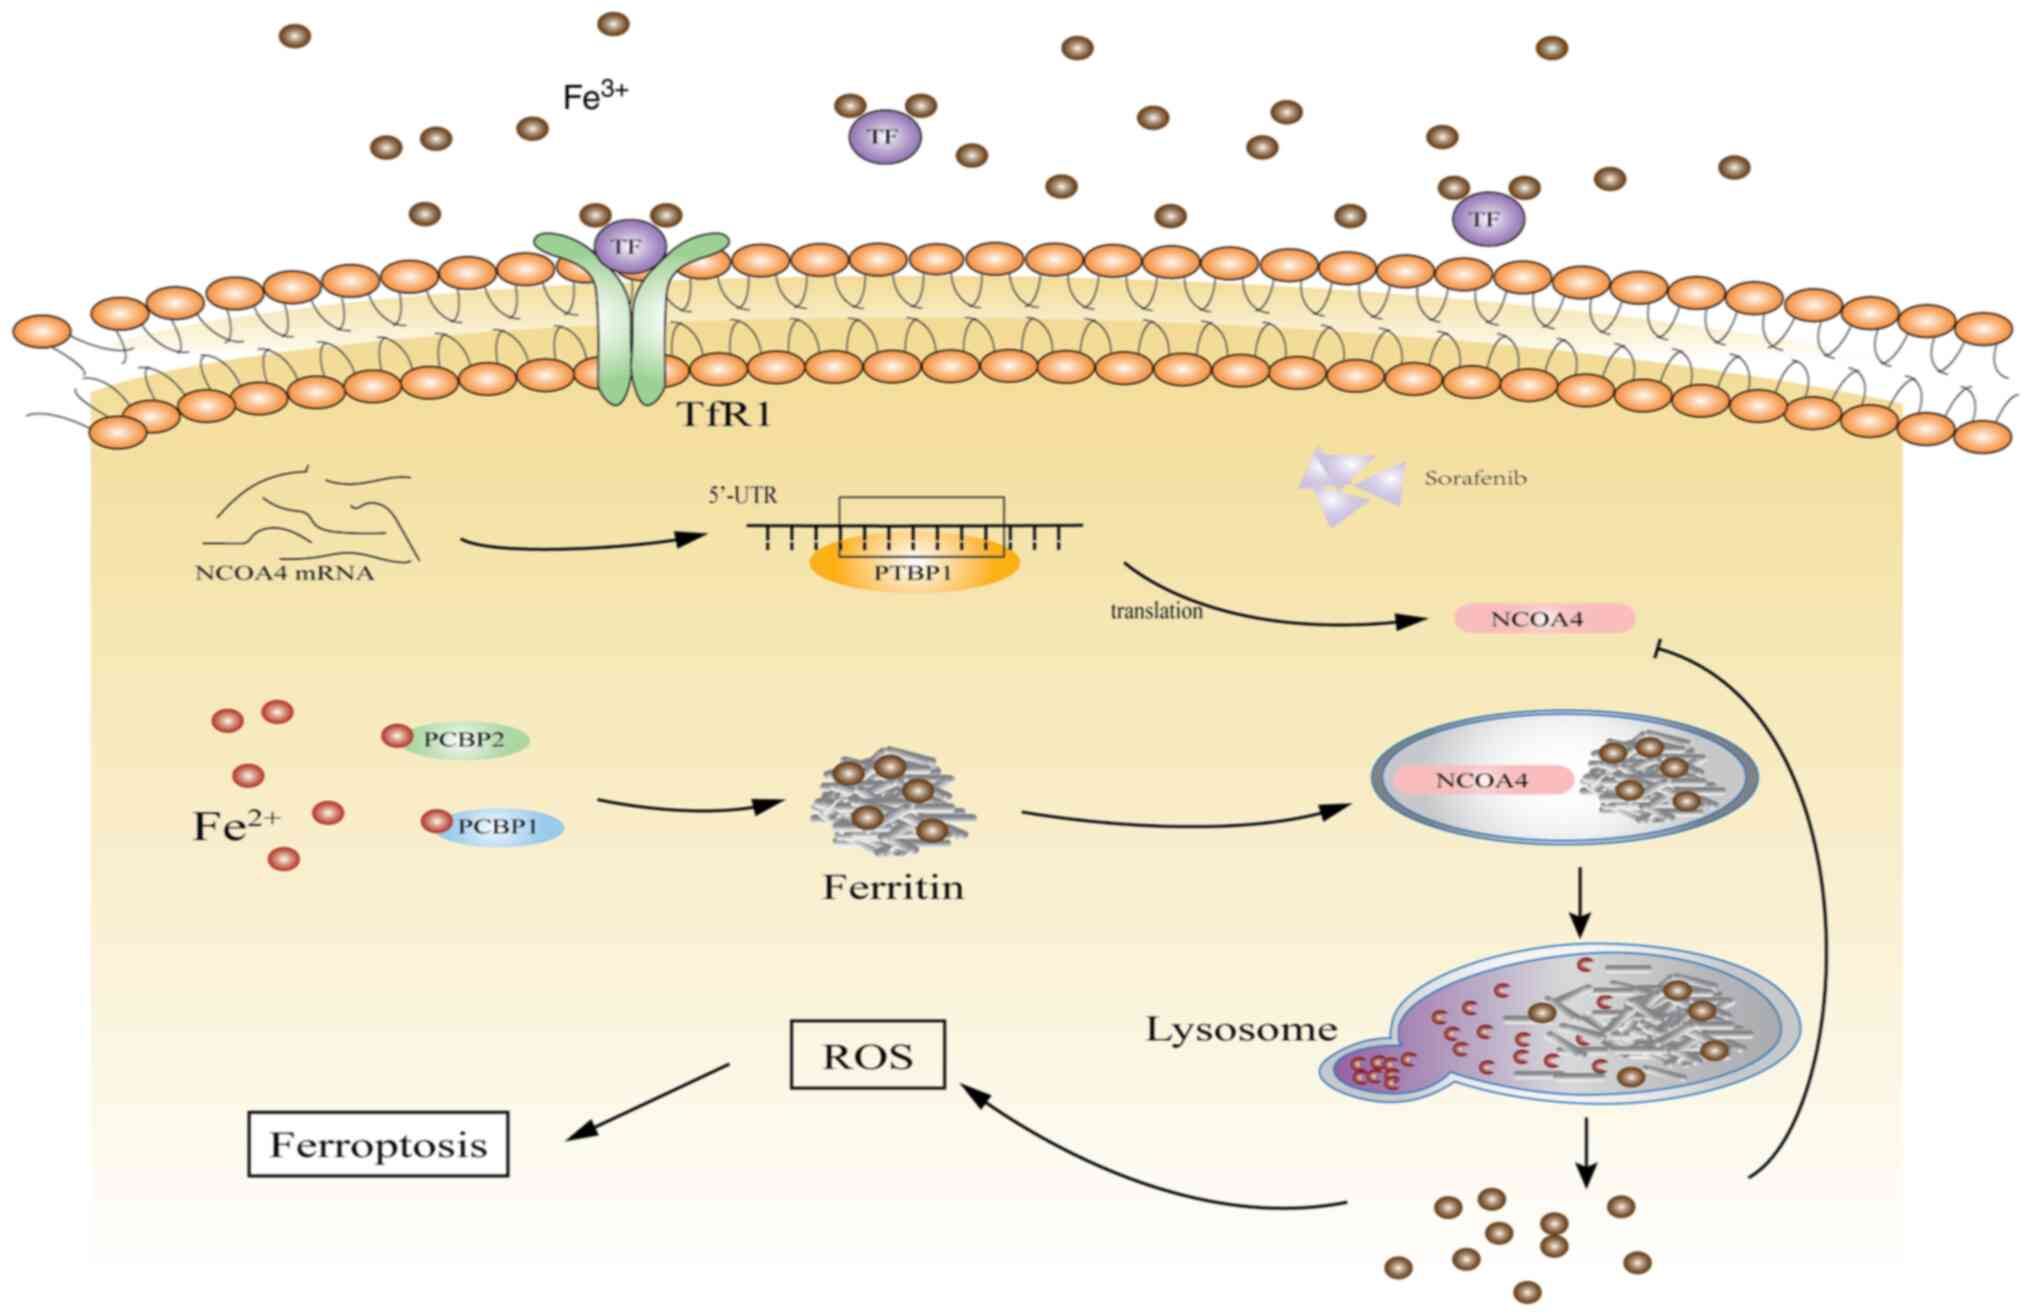
Overall, ferroptosis provides a new direction for
tumor treatment. In the present study, the interaction between
PTBP1 and NCOA4 significantly promoted the activation of
ferritinophagy, enhanced the degradation of ferritin, and
accelerated the accumulation of intracellular iron (Fig. 6). The findings of the present study
revealed the function of PTBP1 in ferroptosis. Furthermore,
studying the specific mechanism of SF in liver cancer may aid in
solving the issue of SF resistance.
Supplementary Material
Supporting Data
Acknowledgements
Not applicable.
Funding
The present study was supported by the National Natural Science
Foundation of China (grant nos. 82172830 and 82002504), and the
Shandong Provincial Key Research and Development Program (grant no.
2019GSF108053).
Availability of data and materials
The datasets used during the present study are
available from the corresponding author upon reasonable
request.
Authors' contributions
HY performed the experiments, and contributed to
data curation, formal analysis and writing of the original draft,
as well as review and editing of the manuscript. JL and ZL
contributed to design of the study, funding acquisition and
writing, review and editing. WS and TB contributed to western
blotting and writing of the original draft. QW, WW and YX
contributed to cell culture and interpreted some of the data. JL
and ZL confirm the authenticity of all the raw data. All authors
read and approve the final manuscript.
Ethics approval and consent to
participate
All animal experiments were approved (approval no.
S725) by the Animal Care and Use Committee of Shandong Provincial
Qianfoshan Hospital (Jinan, China).
Patient consent for publication
Not applicable.
Competing interests
The authors declare that they have no competing
interests.
References
|
1
|
Sung H, Ferlay J, Siegel RL, Laversanne M,
Soerjomataram I, Jemal A and Bray F: Global cancer statistics 2020:
GLOBOCAN estimates of incidence and mortality worldwide for 36
cancers in 185 countries. CA Cancer J Clin. 71:209–249. 2021.
View Article : Google Scholar : PubMed/NCBI
|
|
2
|
Forner A, Reig M and Bruix J:
Hepatocellular carcinoma. Lancet. 391:1301–1314. 2018. View Article : Google Scholar : PubMed/NCBI
|
|
3
|
Lachaier E, Louandre C, Godin C, Saidak Z,
Baert M, Diouf M, Chauffert B and Galmiche A: Sorafenib induces
ferroptosis in human cancer cell lines originating from different
solid tumors. Anticancer Res. 34:6417–6422. 2014.PubMed/NCBI
|
|
4
|
Stockwell BR, Friedmann Angeli JP, Bayir
H, Bush AI, Conrad M, Dixon SJ, Fulda S, Gascón S, Hatzios SK,
Kagan VE, et al: Ferroptosis: A regulated cell death nexus linking
metabolism, redox biology, and disease. Cell. 171:273–285. 2017.
View Article : Google Scholar : PubMed/NCBI
|
|
5
|
Mahoney-Sanchez L, Bouchaoui H, Ayton S,
Devos D, Duce JA and Devedjian JC: Ferroptosis and its potential
role in the physiopathology of Parkinson's Disease. Prog Neurobiol.
196:1018902021. View Article : Google Scholar : PubMed/NCBI
|
|
6
|
Hong M, Rong J, Tao X and Xu Y: The
emerging role of ferroptosis in cardiovascular diseases. Front
Pharmacol. 13:8220832022. View Article : Google Scholar : PubMed/NCBI
|
|
7
|
Liang C, Zhang X, Yang M and Dong X:
Recent progress in ferroptosis inducers for cancer therapy. Adv
Mater. 31:e19041972019. View Article : Google Scholar : PubMed/NCBI
|
|
8
|
Dixon SJ, Patel DN, Welsch M, Skouta R,
Lee ED, Hayano M, Thomas AG, Gleason CE, Tatonetti NP, Slusher BS
and Stockwell BR: Pharmacological inhibition of cystine-glutamate
exchange induces endoplasmic reticulum stress and ferroptosis.
Elife. 3:e025232014. View Article : Google Scholar : PubMed/NCBI
|
|
9
|
Santana-Codina N and Mancias JD: The role
of NCOA4-mediated ferritinophagy in health and disease.
Pharmaceuticals (Basel). 11:1142018. View Article : Google Scholar : PubMed/NCBI
|
|
10
|
Liu Y and Gu W: p53 in ferroptosis
regulation: The new weapon for the old guardian. Cell Death Differ.
29:895–910. 2022. View Article : Google Scholar : PubMed/NCBI
|
|
11
|
Zhu W, Zhou BL, Rong LJ, Ye L, Xu HJ, Zhou
Y, Yan XJ, Liu WD, Zhu B, Wang L, et al: Roles of PTBP1 in
alternative splicing, glycolysis, and oncogensis. J Zhejiang Univ
Sci B. 21:122–136. 2020. View Article : Google Scholar : PubMed/NCBI
|
|
12
|
Han W, Wang L, Yin B and Peng X:
Characterization of a novel posttranslational modification in
polypyrimidine tract-binding proteins by SUMO1. BMB Rep.
47:233–238. 2014. View Article : Google Scholar : PubMed/NCBI
|
|
13
|
Vuong JK, Lin CH, Zhang M, Chen L, Black
DL and Zheng S: PTBP1 and PTBP2 serve both specific and redundant
functions in neuronal pre-mRNA splicing. Cell Rep. 17:2766–2775.
2016. View Article : Google Scholar : PubMed/NCBI
|
|
14
|
La Porta J, Matus-Nicodemos R,
Valentin-Acevedo A and Covey LR: The RNA-binding protein,
polypyrimidine tract-binding protein 1 (PTBP1) is a key regulator
of CD4 T cell activation. PLoS One. 11:e01587082016. View Article : Google Scholar : PubMed/NCBI
|
|
15
|
Tang SJ, Luo S, Ho JXJ, Ly PT, Goh E and
Roca X: Characterization of the regulation of CD46 RNA alternative
splicing. J Biol Chem. 291:14311–14323. 2016. View Article : Google Scholar : PubMed/NCBI
|
|
16
|
Monzón-Casanova E, Screen M, Díaz-Muñoz
MD, Coulson RMR, Bell SE, Lamers G, Solimena M, Smith CWJ and
Turner M: The RNA-binding protein PTBP1 is necessary for B cell
selection in germinal centers. Nat Immunol. 19:267–278. 2018.
View Article : Google Scholar : PubMed/NCBI
|
|
17
|
Shan S, Shi J, Yang P, Jia B, Wu H, Zhang
X and Li Z: Apigenin restrains colon cancer cell proliferation via
targeted blocking of pyruvate kinase M2-dependent glycolysis. J
Agric Food Chem. 65:8136–8144. 2017. View Article : Google Scholar : PubMed/NCBI
|
|
18
|
Livak KJ and Schmittgen TD: Analysis of
relative gene expression data using real-time quantitative PCR and
the 2(−Delta Delta C(T)) method. Methods. 25:402–408. 2001.
View Article : Google Scholar : PubMed/NCBI
|
|
19
|
Carlsen CU, Kurtmann L, Bruggemann DA,
Hoff S, Risbo J and Skibsted LH: Investigation of oxidation in
freeze-dried membranes using the fluorescent probe
C11-BODIPY(581/591). Cryobiology. 58:262–267. 2009. View Article : Google Scholar : PubMed/NCBI
|
|
20
|
Liu MZ, Kong N, Zhang GY, Xu Q, Xu Y, Ke P
and Liu C: The critical role of ferritinophagy in human disease.
Front Pharmacol. 13:9337322022. View Article : Google Scholar : PubMed/NCBI
|
|
21
|
Sun X, Niu X, Chen R, He W, Chen D, Kang R
and Tang D: Metallothionein-1G facilitates sorafenib resistance
through inhibition of ferroptosis. Hepatology. 64:488–500. 2016.
View Article : Google Scholar : PubMed/NCBI
|
|
22
|
Wang Q, Bin C, Xue Q, Gao Q, Huang A, Wang
K and Tang N: GSTZ1 sensitizes hepatocellular carcinoma cells to
sorafenib-induced ferroptosis via inhibition of NRF2/GPX4 axis.
Cell Death Dis. 12:4262021. View Article : Google Scholar : PubMed/NCBI
|
|
23
|
Gao R, Kalathur RKR, Coto-Llerena M, Ercan
C, Buechel D, Shuang S, Piscuoglio S, Dill MT, Camargo FD,
Christofori G and Tang F: YAP/TAZ and ATF4 drive resistance to
Sorafenib in hepatocellular carcinoma by preventing ferroptosis.
EMBO Mol Med. 13:e143512021. View Article : Google Scholar : PubMed/NCBI
|
|
24
|
Ren X, Li Y, Zhou Y, Hu W, Yang C, Jing Q,
Zhou C, Wang X, Hu J, Wang L, et al: Overcoming the compensatory
elevation of NRF2 renders hepatocellular carcinoma cells more
vulnerable to disulfiram/copper-induced ferroptosis. Redox Biol.
46:1021222021. View Article : Google Scholar : PubMed/NCBI
|
|
25
|
Wang R, Xing R, Su Q, Yin H, Wu D, Lv C
and Yan Z: Knockdown of SFRS9 inhibits progression of colorectal
cancer through triggering ferroptosis mediated by GPX4 reduction.
Front Oncol. 11:6835892021. View Article : Google Scholar : PubMed/NCBI
|
|
26
|
Zhang H, Deng T, Liu R, Ning T, Yang H,
Liu D, Zhang Q, Lin D, Ge S, Bai M, et al: CAF secreted miR-522
suppresses ferroptosis and promotes acquired chemo-resistance in
gastric cancer. Mol Cancer. 19:432020. View Article : Google Scholar : PubMed/NCBI
|
|
27
|
Zhang Z, Guo M, Li Y, Shen M, Kong D, Shao
J, Ding H, Tan S, Chen A, Zhang F and Zheng S: RNA-binding protein
ZFP36/TTP protects against ferroptosis by regulating autophagy
signaling pathway in hepatic stellate cells. Autophagy.
16:1482–1505. 2020. View Article : Google Scholar : PubMed/NCBI
|
|
28
|
Han M, Qian X, Cao H, Wang F, Li X, Han N,
Yang X, Yang Y, Dou D, Hu J, et al: lncRNA ZNF649-AS1 induces
trastuzumab resistance by promoting ATG5 expression and autophagy.
Mol Ther. 28:2488–2502. 2020. View Article : Google Scholar : PubMed/NCBI
|
|
29
|
Hou W, Xie Y, Song X, Sun X, Lotze MT, Zeh
HJ III, Kang R and Tang D: Autophagy promotes ferroptosis by
degradation of ferritin. Autophagy. 12:1425–1428. 2016. View Article : Google Scholar : PubMed/NCBI
|
|
30
|
Yeh S and Chang C: Cloning and
characterization of a specific coactivator, ARA70, for the androgen
receptor in human prostate cells. Proc Natl Acad Sci USA.
93:5517–5521. 1996. View Article : Google Scholar : PubMed/NCBI
|
|
31
|
Alen P, Claessens F, Schoenmakers E,
Swinnen JV, Verhoeven G, Rombauts W and Peeters B: Interaction of
the putative androgen receptor-specific coactivator ARA70/ELE1alpha
with multiple steroid receptors and identification of an internally
deleted ELE1beta isoform. Mol Endocrinol. 13:117–128. 1999.
View Article : Google Scholar : PubMed/NCBI
|
|
32
|
Mancias JD, Pontano Vaites L, Nissim S,
Biancur DE, Kim AJ, Wang X, Liu Y, Goessling W, Kimmelman AC and
Harper JW: Ferritinophagy via NCOA4 is required for erythropoiesis
and is regulated by iron dependent HERC2-mediated proteolysis.
Elife. 4:e103082015. View Article : Google Scholar : PubMed/NCBI
|
|
33
|
Mancias JD, Wang X, Gygi SP, Harper JW and
Kimmelman AC: Quantitative proteomics identifies NCOA4 as the cargo
receptor mediating ferritinophagy. Nature. 509:105–109. 2014.
View Article : Google Scholar : PubMed/NCBI
|
|
34
|
Kang R and Tang D: Autophagy and
ferroptosis-what's the connection? Curr Pathobiol Rep. 5:153–159.
2017. View Article : Google Scholar : PubMed/NCBI
|
|
35
|
Hinnebusch AG, Ivanov IP and Sonenberg N:
Translational control by 5′-untranslated regions of eukaryotic
mRNAs. Science. 352:1413–1416. 2016. View Article : Google Scholar : PubMed/NCBI
|
|
36
|
Goodall M and Thorburn A: Identifying
specific receptors for cargo-mediated autophagy. Cell Res.
24:783–784. 2014. View Article : Google Scholar : PubMed/NCBI
|
|
37
|
Liu J, Kuang F, Kroemer G, Klionsky DJ,
Kang R and Tang D: Autophagy-dependent ferroptosis: Machinery and
regulation. Cell Chem Biol. 27:420–435. 2020. View Article : Google Scholar : PubMed/NCBI
|