Introduction
Kidney cancer is one of the deadliest and most
common diseases of the urology system, with ~179,368 deaths and
431,288 new cases worldwide as of 2020 (1). The most common type of kidney cancer
is clear cell renal cell carcinoma (ccRCC), which accounts for
~70–75% of cases (2). ccRCC is
characterized by aggressive tumors with a high metastatic rate and
degree of immune infiltration, with tumor recurrence in 30% of
patients who receive total nephrectomy (3,4).
Immune therapies show great promise for patients with ccRCC.
However, immunotherapy may not be appropriate for all patients,
owing to low response rates (5).
Therefore, identification of effective tumor immune-related
therapeutic targets is of great clinical importance for treating
metastatic ccRCC.
Guanylate-binding protein 2 (GBP2) is a member of
the guanylate-binding protein (GBP) family (molecular weight of
65–67 kDa) and belongs to the dynamin superfamily of
interferon-induced large GTPases (6,7). The
GBP family is highly influential in mediating host defenses against
cellular pathogens, parasites and viruses (8). Research has increasingly shown GBP2 to
play an essential part in cancer. Several studies have revealed
high rates of GBP2 expression in glioblastoma (9), pancreatic adenocarcinoma (10) and renal cell cancers (11), all of which share a poor prognostic
outcome.
Immunosuppressive cell infiltration is a marker of
altered therapeutic efficacy in ccRCC (12). Several studies have shown that
degree of GBP2 expression is correlated with rate of tumor immune
infiltration in breast cancer (13), colorectal cancer (14), pancreatic carcinoma (15) and sarcomas (16), indicating that GBP2 shapes the tumor
immune microenvironment. High GBP2 expression may correlate with a
favorable response to anti-PD-1 therapy and tumor-infiltrating T
cell, with predicting favorable outcomes in breast cancer,
colorectal cancer and sarcomas (13,14,16).
On the contrary, GBP2 is correlated with acidosis-related high-risk
group representing more tumor immune dysfunction and fewer
immunotherapeutic responders in pancreatic carcinoma (15). These studies have illustrated that
GBP2 can affect the prognosis of various tumors through regulating
tumor immune microenvironment. However, the function of GBP2 in
immune infiltration, as well as its molecular regulatory mechanism
in ccRCC, remain unclear.
GBP2, whose expression is significantly increased
after interferon-γ (IFN-γ) treatment, is an interferon-stimulated
gene (17). IFN-γ promotes tumor
immune escape by upregulating programmed death ligand 1 (PD-L1)
expression via the signal transducer and activator of transcription
1 (STAT1) pathway (18). According
to several studies, PD-L1 expression positively correlates with
metastasis and poor outcomes in ccRCC (19,20). A
recent study indicated that GBP5 regulates PD-L1 expression levels
in triple-negative breast cancer (21). Taken together, it was hypothesized
that GBP2 may regulate PD-L1 expression via the STAT1 pathway,
thereby promoting immune evasion in ccRCC.
In the present study, the potential role of GBP2 in
immune infiltration of ccRCC along with its possible molecular
roles were explored. To the best of our knowledge, this is the
first study to demonstrate that GBP2 regulates PD-L1 expression via
the STAT1 pathway. This finding expands our understanding of GBP2
immune infiltration mechanisms in ccRCC and provides a potential
immunotherapeutic target.
Materials and methods
Cancer cell line encyclopedia (CCLE)
database
The CCLE dataset (https://portals.broadinstitute.org/ccle) is an online
database that provides analysis and visualization of more than
1,000 cell lines (22). The CCLE
dataset provides information related to DNA mutations and gene
expression. Based on this database, GBP2 expression levels in
cancer cell lines were assessed (access date: 05/16/2021).
Gene expression profiling interactive
analysis 2 (GEPIA 2) analysis
The online database GEPIA2 (http://gepia2.cancer-pku.cn/) is a website for
analyzing differential gene expression, based on RNA sequencing
data of 9,736 tumors and 8,587 normal samples from The Cancer
Genome Atlas (TCGA) and Genotype-Tissue Expression (GTEx) (23). In the present study, the GBP2
expression level data on tumor and normal renal tissues and the
correlation between GBP2 and PD-L1 were analyzed by this tool
(access dates: 05/21/2021 and 05/03/2022).
Gene expression omnibus (GEO) dataset
selection
Two microarray datasets were gained from the GEO
database (http://www.ncbi.nlm.nih.gov/geo). Specifically,
GSE6344 contains data for GBP2 mRNA between 20 ccRCC samples and 20
normal samples (24). GSE53757
contains data of GBP2 mRNA in 72 ccRCC and 72 normal samples
(25). These two datasets were used
to analyze the GBP2 mRNA levels in ccRCC and the dataset (GSE53757)
to evaluate the correlation of GBP2 with PD-L1 (access date:
05/02/2022).
Kaplan-Meier (KM) plotter
KM plotter (https://kmplot.com/analysis) is able to evaluate the
correlation between the expression of all genes and survival in 21
tumor types (26). The correlation
between overall survival (OS) and GBP2 in ccRCC was performed using
this online tool (access time: 05/16/2021).
UALCAN database
UALCAN (http://ualcan.path.uab.edu/index.html) is an online
web with data obtained from 31 tumor types of TCGA project
(27). The GBP2 expression in
kidney renal clear cell carcinoma (KIRC) patients with different
individual tumor stages, tumor grades, patient age, patient's sex
and KIRC subtypes was analyzed using UALCAN (access date:
05/19/2021).
LinkedOmics database analysis
The LinkedOmics database (http://www.linkedomics.org/) is a public portal, which
has the clinical data and multi-omics for 32 cancer types from TCGA
(28). In the present study, the
relation between GBP2 and KIRC was mainly evaluated. First, all
genes co-expressed with GBP2 were obtained and showed as volcano
plots. The top 50 genes that were positively and negatively
associated with GBP2 were displayed in heat-maps (access date:
05/17/2021).
Metascape
Metascape (http://metascape.org) is a public online portal
integrating a variety of bioinformatics knowledge databases for
annotation and analysis of functional enrichment, gene annotation
and protein-protein interaction (29). In the current study, based on
GBP2-positively correlated genes (386 genes), Metascape was
utilized to analyze the Gene Ontology (GO) and Kyoto Encyclopedia
of Genes and Genomes (KEGG) of GBP2 gene (access date:
03/12/2022).
GeneMANIA database analysis
GeneMANIA (http://www.genemania.org) is a public online tool
server used for analysis of genetic and protein interactions,
co-expression, pathways and co-localization of target genes
(30). The relationship between
GBP2 and its interacting genes was analyzed using the aformentioned
database (access date: 06/21/2021).
Tumor immune estimation resource
(TIMER) database analysis
TIMER (https://cistrome.shinyapps.io/timer/) uses six
state-of-the-art algorithms to assess immune infiltration levels
(31). In the present study, the
different expression GBP2 in tumors and adjacent tissues was first
examined. Then, the correlations between the expression levels of
GBP2 and infiltrating immune cells in KIRC were assessed. TIMER2.0
(http://timer.comp-genomics.org/) was
also used to analyze the association between the expression of GBP2
and diverse immune cells gene markers in KIRC (access date:
06/20/2021) (32).
Clinical samples
The present study was approved [approval no.
PJ-YX2022-016(F1)] by the Ethics Committee of the First Affiliated
Hospital of Anhui Medical University (Hefei, China), which was
conducted in accordance with the guidelines of the Declaration of
Helsinki of 1975, as revised in 2000. The clinical sample included
40 specimens of ccRCC tissues, along with matched normal adjacent
specimens, that were obtained from patients who received care at
our hospital between January 2021 and August 2022. The patient
donors (sex distribution, 67.5% men and 32.5% women; age range,
53–78 years) at the time of biopsy had not been treated with
radiotherapy or chemotherapy. Written informed consent was provided
by all patients. All of the tissue samples (paraffin-embedded) were
used for immunohistochemistry (IHC); of these, six (gained with
liquid nitrogen) were used in western blotting.
Cell cultures
Human 786-O and ACHN cell lines were purchased from
Procell Life Sciences & Technology Co., Ltd. and were
maintained in RPMI-1640 (Gibco; Thermo Fisher Scientific, Inc.)
complete medium. A human proximal tubular epithelial cell line
(HK2), along with human Caki-2, and Caki-1 cell lines were
purchased from iCell Bioscience, Inc. The former was maintained in
DMEM (Gibco; Thermo Fisher Scientific, Inc.), while the latter were
maintained in McCoy's 5A (Procell Life Sciences & Technology
Co., Ltd.) complete medium. Caki-1 (https://www.cellosaurus.org/CVCL_0234) and 786-O
(https://www.cellosaurus.org/CVCL_1051) were described
as RCC. ACHN (https://www.cellosaurus.org/CVCL_1067) and Caki-2
(https://www.cellosaurus.org/CVCL_0235) were described
as papillary RCC (33,34). All complete medium was prepared with
10% fetal bovine serum (Gibco; Thermo Fisher Scientific, Inc.) and
1% antibiotics (100 µg/ml streptomycin and 100 U/ml penicillin).
All cell lines were free of mycoplasma contamination and were
cultivated in a 5% CO2 incubator at 37°C. All cancer
cell lines were identified with STR identification.
For inhibitor treatment, after GBP2 overexpressing,
relevant cells were treated with 50 µM fludarabine (cat. no. T1038;
TargetMol), a STAT1 inhibitor, for 36 h.
Construction and transfection of
lentivirus
Lentivirus containing GBP2 shRNA and non-silencing
(NS) control shRNA (shNS), as well as GBP2 overexpression (GBP2 OE)
and negative control (vector) lentivirus, were produced by Shanghai
GeneChem Co., Ltd. The shRNA target sequences were as follows:
non-silencing (NS) control shRNA (shNS), 5′-TTCTCCGAACGTCACGT-3′;
GBP2-RNAi (shGBP2#1), 5′-CTTTAGAAGAAGATGTCAA-3′; and GBP2-RNAi
(shGBP2#2), 5′-TTTCGCTAAAGCTAAGAAA-3′. Transfection of the Caki-1
and 786-O cells was performed in accordance with manufacturer's
instructions. Puromycin (2.0 µg/ml) was used to screen the infected
cells for one week, and then analysis of silencing efficiency of
target genes was performed by reverse transcription-quantitative
PCR (RT-q) PCR and western blotting.
RNA interference
To knock down STAT1, Caki-1 and 786-O cells with
GBP2 overexpression were transfected with small interfering (siRNA)
using GP-Transfect-Mate (a transfection reagent; Shanghai
GenePharma Co., Ltd.) according to the manufacturer's instructions.
The sequences of siRNA (20 µM) used to target STAT1 and negative
control, as customizing by Shanghai GenePhama Co., Ltd. were as
follows: negative control (siNC), sense:
5′-UUCUCCGAACGUGUCACGUTT-3′, antisense:
5′-ACGUGACACGUUCGGAGAATT-3′; siSTAT1#1, sense:
5′-GCUGGAUGAUCAAUAUAGUTT-3′, antisense:
5′-ACUAUAUUGAUCAUCCAGCTT-3′; siSTAT1#2, sense
5′-G:ACCAUGCCUUUGGAAAGUTT-3′, antisense:
5′-ACUUUCCAAAGGACUGGUCTT-3′. Analysis of silencing efficiency of
target genes was performed by western blotting.
RT-qPCR
The RNA from cells was extracted using
TRIzol® (cat. no. R0016; Beyotime Institute of
Biotechnology). RNA purity (OD260 nm/OD280 nm=1.8-2.2) was
evaluated using NanoDrop 2000 (Thermo Fisher Scientific, Inc.) and
reversely transcribed to cDNA with a reverse transcription kit
(cat. no. 11139ES10; Yeasen Biotechnology Co., Ltd.) according to
the manufacturer's instructions. qPCR was performed using SYBR
Green Master Mix (cat. no. 11203ES03; Yeasen Biotechnology Co.,
Ltd.) in a fluorescence quantitative PCR instrument (CFX; Bio-Rad
Laboratories, Inc.). The thermal cycling program was as follows:
pre-denaturation for 30 sec at 95°C, denaturation for 15 sec at
95°C, and annealing and extension for 30 sec at 60°C, with
repetition for 40 cycles. The primer sequences were as follows:
GBP2 forward, 5′-CAGTTGGAAGCAAGGCGAGAT-3′ and reverse,
5′-GCACCTCTTTGGCCTGTATCC-3′; PD-L1 forward,
5′-GCCGAAGTCATCTGGACAAGC-3′ and reverse,
5′-GTGTTGATTCTCAGTGTGCTGGTCA-3′; and β-actin forward,
5′-CACCCAGCACAATGAAGATCAAGAT-3′ and reverse,
5′-CCAGTTTTTAAATCCTGAGTCAAGC-3′. Relative expressions levels were
normalized to those of human β-actin. 2−ΔΔCq method was
used to analyze the data (35).
Western blotting
Protein lysates of tissues and cells were isolated
using radioimmunoprecipitation assay buffer (cat. no. P0013B;
Beyotime Institute of Biotechnology) containing protease and
phosphatase inhibitors (cat. no. P1048; Beyotime Institute of
Biotechnology), using the bicinchoninic acid (BCA) method (cat. no.
P0012; Beyotime Institute of Biotechnology). The extracted protein
lysate (10–50 µg) was transferred to nitrocellulose (NC) membranes
(cat. no. 66485; Pall Life Sciences) after 8–10% SDS-PAGE
electrophoresis. The NC membranes were blocked in 5% skimmed milk
for 1 h at 20–25°C and were incubated for 8–12 h at 4°C with
specific primary antibodies against STAT1 (1:1,000; cat. no.
R25799), phosphorylated (p)-STAT1 (Ser727) (1:1,000; cat. no.
R25797; both from Zen BioScience), PD-L1 (1:5,000; cat. no.
381830), β-actin (1:5,000; cat. no. 66009-1-lg), Flag (1:6,000;
cat. no. 20543-1-AP) and GBP2 (1:1,000; cat. no. 27299-1-AP; all
from Proteintech Group, Inc.). After incubation of the NC membranes
with the secondary antibody (HRP-conjugated goat anti-rabbit IgG
(1:5,000; cat. no. 511203); HRP-conjugated goat anti-mouse IgG
(1:5,000; cat. no. 511103); both from Zen BioScience) for 2 h at
20–25°C, protein band signals were acquired using a Tanon 5200
system (Tanon Technology Co., Ltd.) and quantified with ImageJ
software (version 1.40 g; National Institutes of Health).
IHC
Paraffin sections (3–5 µm) were immersed in xylene
and ethanol in turn dewaxed and rehydrated and the antigen was
repaired using 10 mM sodium citrate buffer (pH 6.0).
H2O2 (3%) was added to the slices, which were
incubated for 20 min at room temperature. After washing with
phosphate buffered saline (PBS), the sections were incubated at 4°C
for 8–12 h with the following primary antibodies: GBP2 (1:200; cat.
no. 27299-1-AP), PD-1 (1:400; cat. no. 18106-1-AP) and CD8A (1:800;
cat. no. 66868-1-lg; all from Proteintech Group, Inc.). After
further PBS washing, the specimens were incubated with the
secondary antibodies (1:1; MaxVision™ HRP-Polymer anti-Mouse/Rabbit
IHC kit; cat. no. 5010; Fuzhou Maixin Biotech Co., Ltd.) at 37°C
for 1 h. The sections were stained brown with 3,3′-Diaminobenzidine
(DAB) solution (cat. no. PR30010; Proteintech Group, Inc.). After
rinsing with tap water, the nuclei were stained with hematoxylin.
After rinsing with tap water, slices were dehydrated and sealed
with gum. Results were observed under a microscope (VS200, Olympus
Corporation) and positive staining rate was determined. The
expression levels of GBP2, CD8A, and PD-1 in the pathological
tissue samples were evaluated based on the intensity of staining
and the percentage of positively stained cells. A total of five
fields per slice were randomly examined under a light microscope at
×400 magnification. IHC results were evaluated by two pathologists
using a blind test. The scoring system involved multiplying the
staining intensity by the number of cells with positive scores.
Staining intensity: 0, no positive cells; 1, yellow staining; 2,
light brown staining; and 3, dark brown staining. Percentage of
cells with positive scores: 1, <25%; 2, 25–50%; 3, 51–75%; 4,
>75%. Scores 0, 1, 2 and 3 indicated low expression levels,
while scores 4, 6, 8, 9 and 12 indicated high expression
levels.
Co-immunoprecipitation (CO-IP)
assay
For each immunoprecipitation assay (IP), the
proteins extracted from Caki-1 and 786-O cells cultured in 10-cm
dishes were processed using a CO-IP kit (cat. no. P2181S; Beyotime
Institute of Biotechnology) according to the manufacturer's
protocol. Western blotting was used to detect the protein signals
with appropriate antibodies.
Statistical analysis
GraphPad Prism 7.0 software (GraphPad Software, Inc.
and SPSS 25.0 (IBM Corp.) were used for statistical analysis. Every
experiment was repeated three times, and continuous variables were
expressed as the mean ± standard deviation (SD). Differences
between two groups were evaluated with two-tailed Student's t-tests
(unpaired or paired) and one-way analyses of variance (ANOVA) were
used to compare values across multiple groups, whose post hoc test
is Tukey's multiple comparisons test. Spearman and Pearson
correlation coefficient was utilized for correlation analysis.
Pearson's χ2 tests were performed on IHC data to analyze
the correlation of GBP2 with PD-1 and CD8A. P<0.05 was
considered to indicate a statistically significant difference. The
significance of statistic was as follows: *P<0.05, **P<0.01
and ***P<0.001.
Results
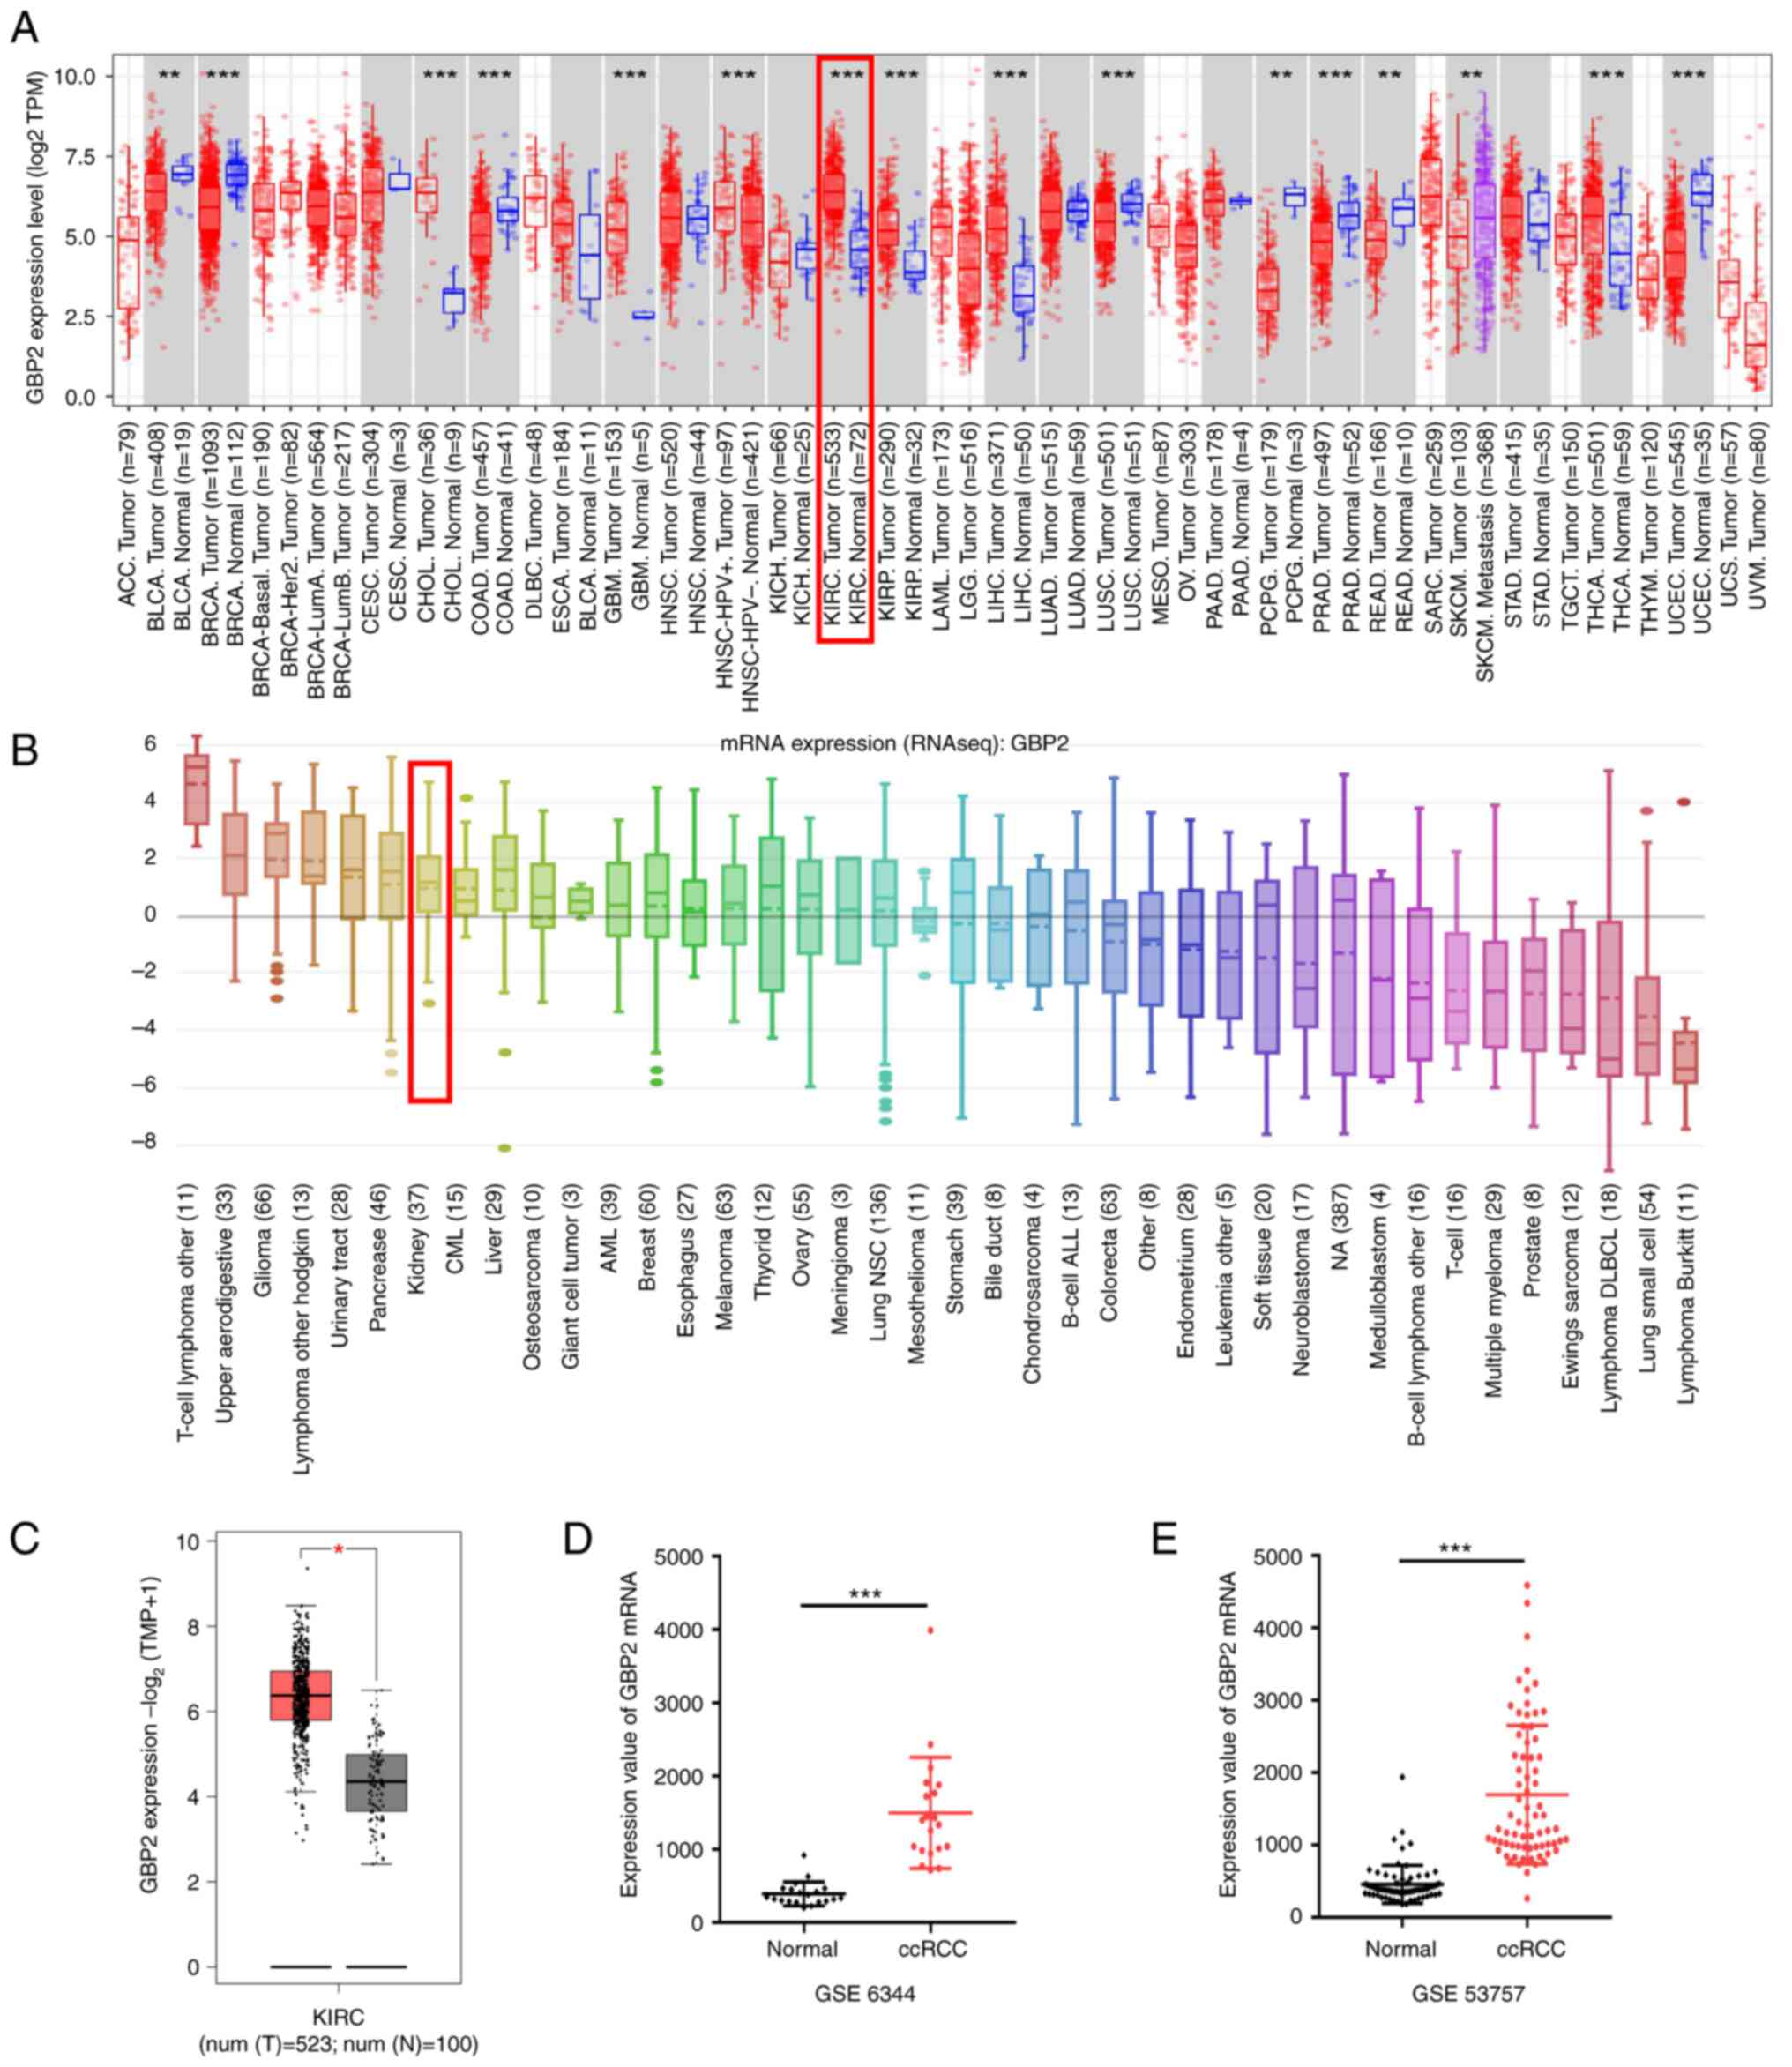
Overexpression of GBP2 in ccRCC
First, TIMER data were used to assess the mRNA
expression of GBP2 in different tumors and matched normal tissues.
The results revealed that GBP2 expression was significantly higher
in most tumors, including ccRCC (P<0.01) (Fig. 1A, shown in the red frame). CCLE
analysis revealed that GBP2 was distinctively overexpressed in
renal cancer cell lines, with GBP2 mRNA expression level ranking
seventh among multiple cancer cell lines (Fig. 1B, shown in the red frame). To
further identify the expression of GBP2 in the TCGA dataset and
GTEx projects, GEPIA2 was used with results indicating that GBP2
expression in ccRCC (red box) was higher than that in normal tissue
(grey box) (Fig. 1C). To further
validate these data, GBP2 expression levels in the ccRCC samples
were evaluated using the GEO datasets. The same change in trends as
aforementioned were observed (Fig. 1D
and E), specifically thatGBP2 mRNA levels in ccRCC tissue was
overexpressed compared with adjacent normal tissues. These data
demonstrated that upregulation of GBP2 expression may be a vital
part of ccRCC progression.
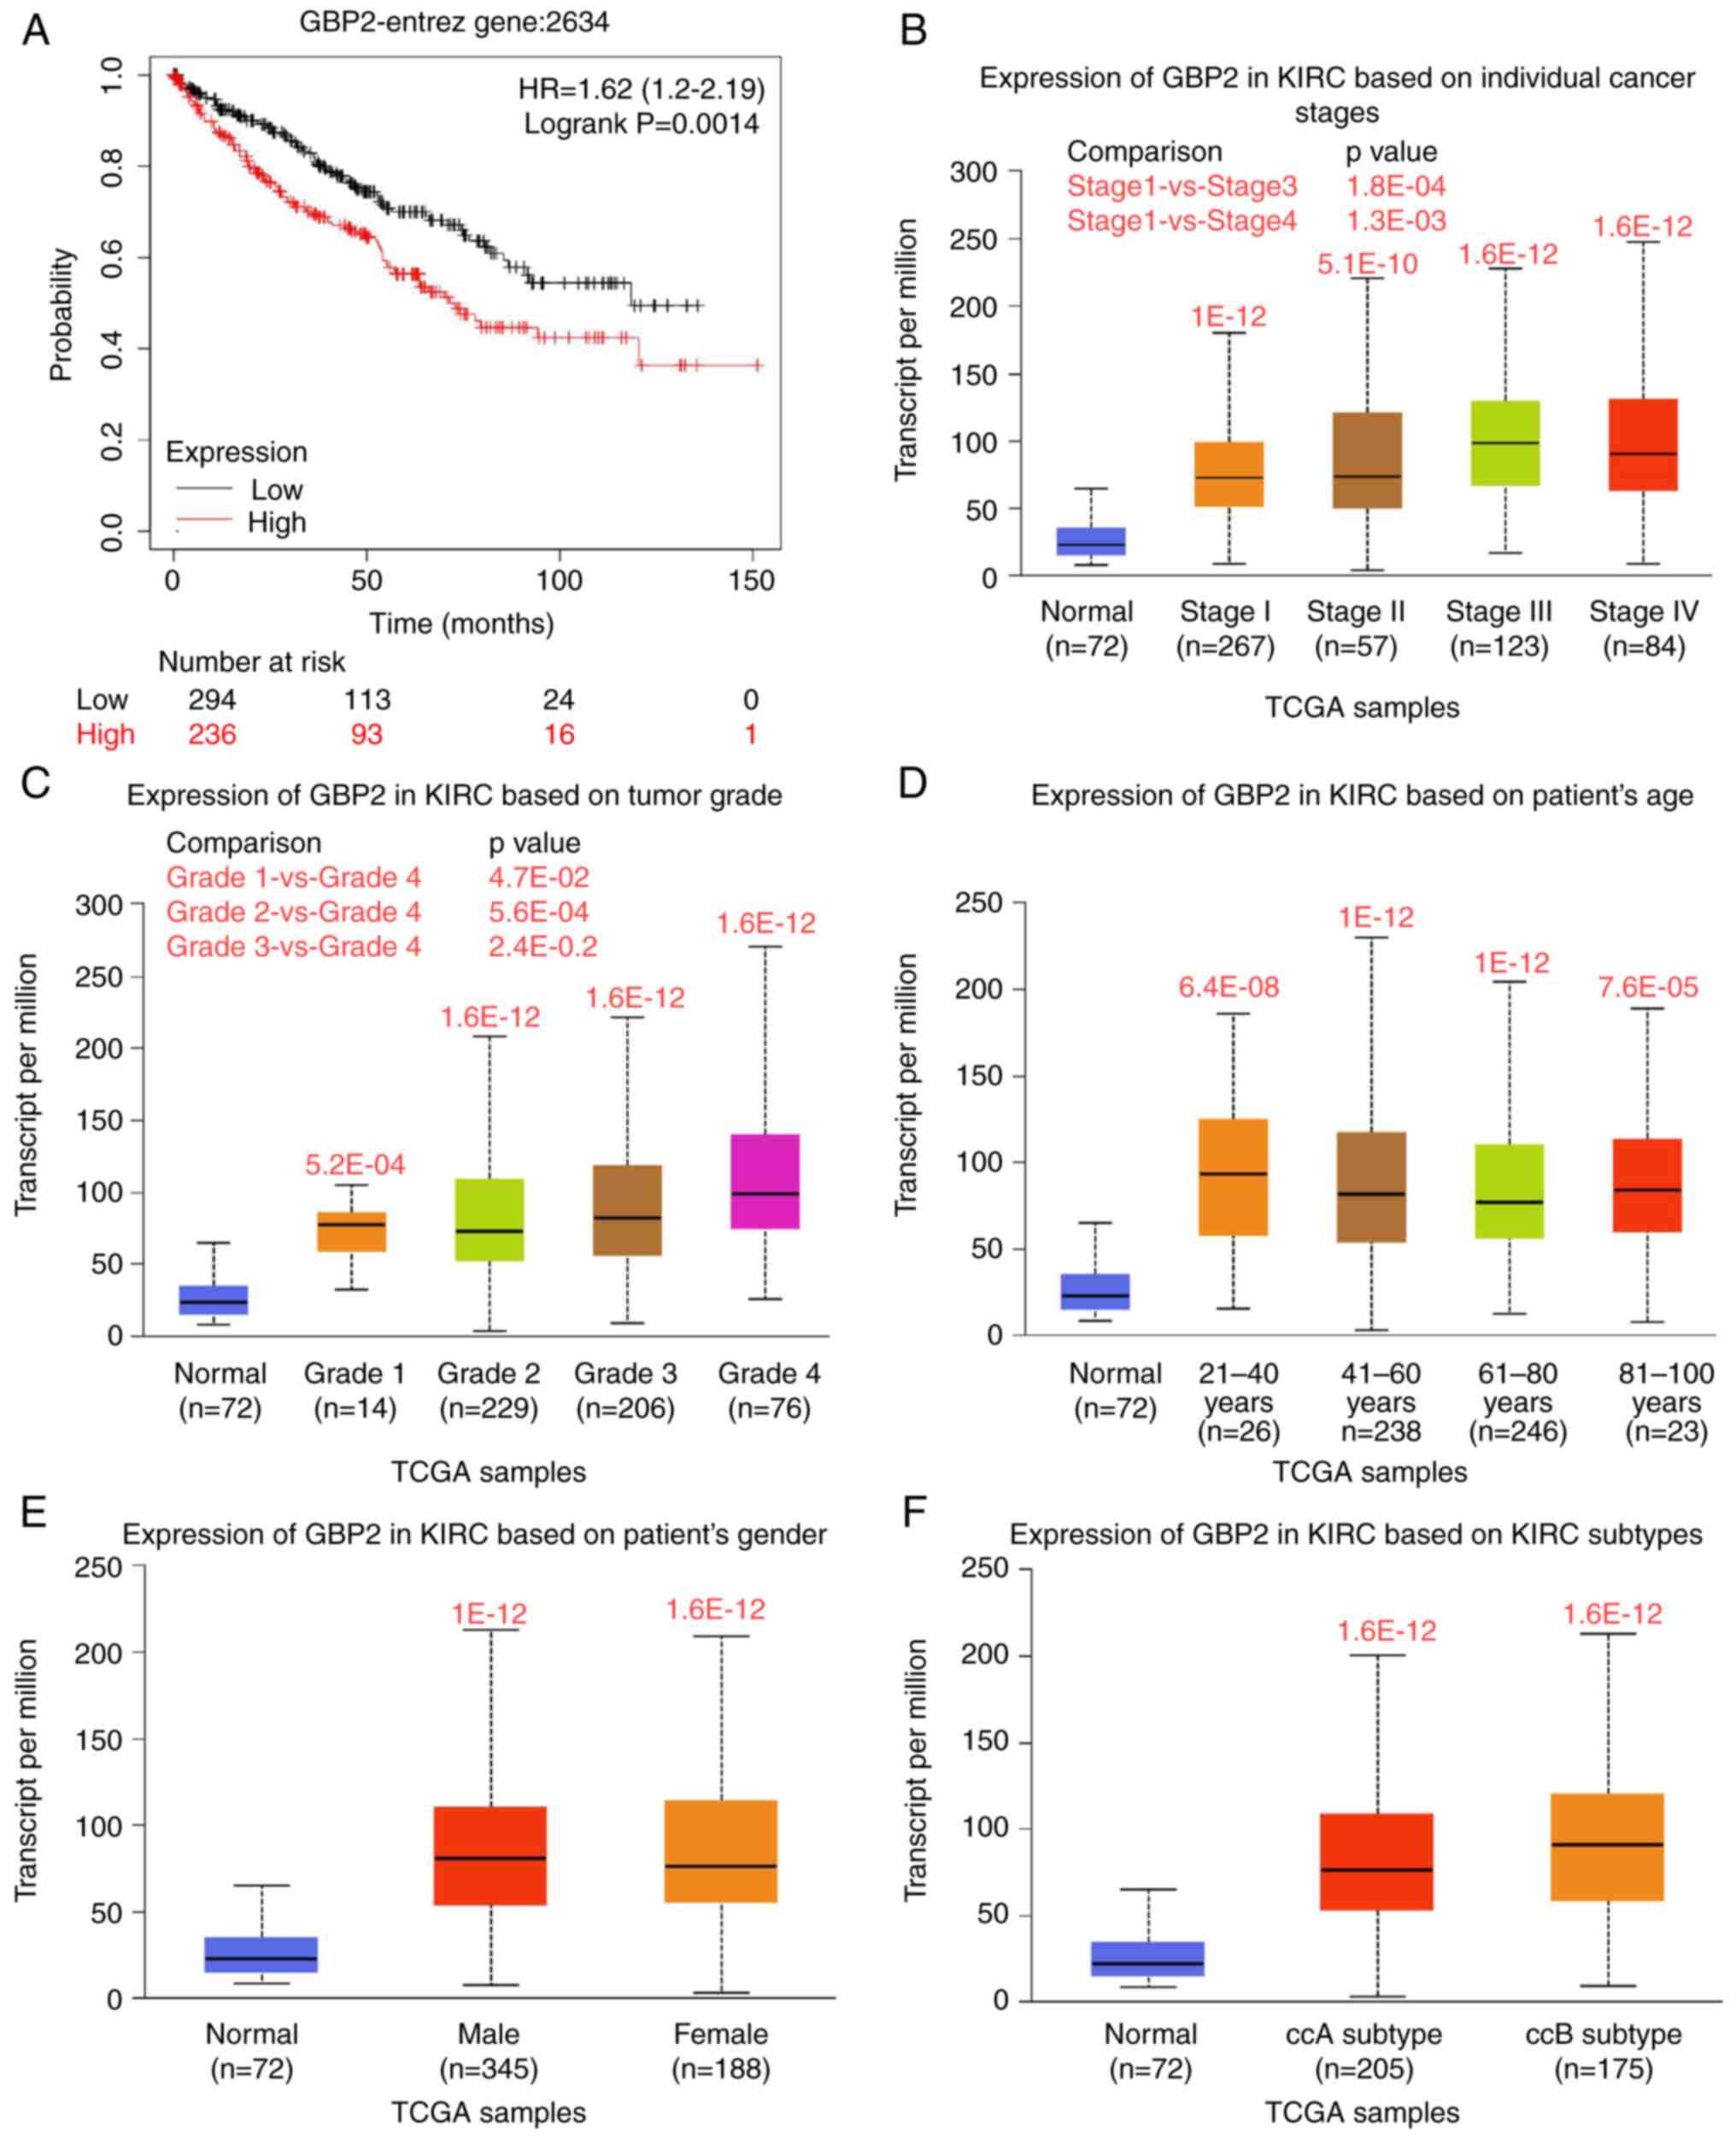
GBP2 expression is associated with the
clinical characteristics of ccRCC patients
To explore the effects of GBP2 on ccRCC prognosis,
an analysis of OS was performed using the KM plotter database.
These data suggested that upregulation of GBP2 mRNA is associated
with shorter OS in patients with ccRCC (P=0.0014) (Fig. 2A), implicating GBP2 in tumor growth
in ccRCC. To further characterize the specificity of GBP2 in ccRCC,
various clinicopathological features of KIRC samples from the TCGA
database were analyzed using the UALCAN online tool. It was found
that GBP2 is differentially expressed in tissue of different stages
and tumor grade (Fig. 2B and C).
GBP2 expression was also revealed to vary as a function of patient
age and sex as well as KIRC subtypes of ccRCC (P<0.05) (Fig. 2D-F). Hence, GBP2 may serve as a
potential diagnostic and prognostic biomarker in patients with
ccRCC.
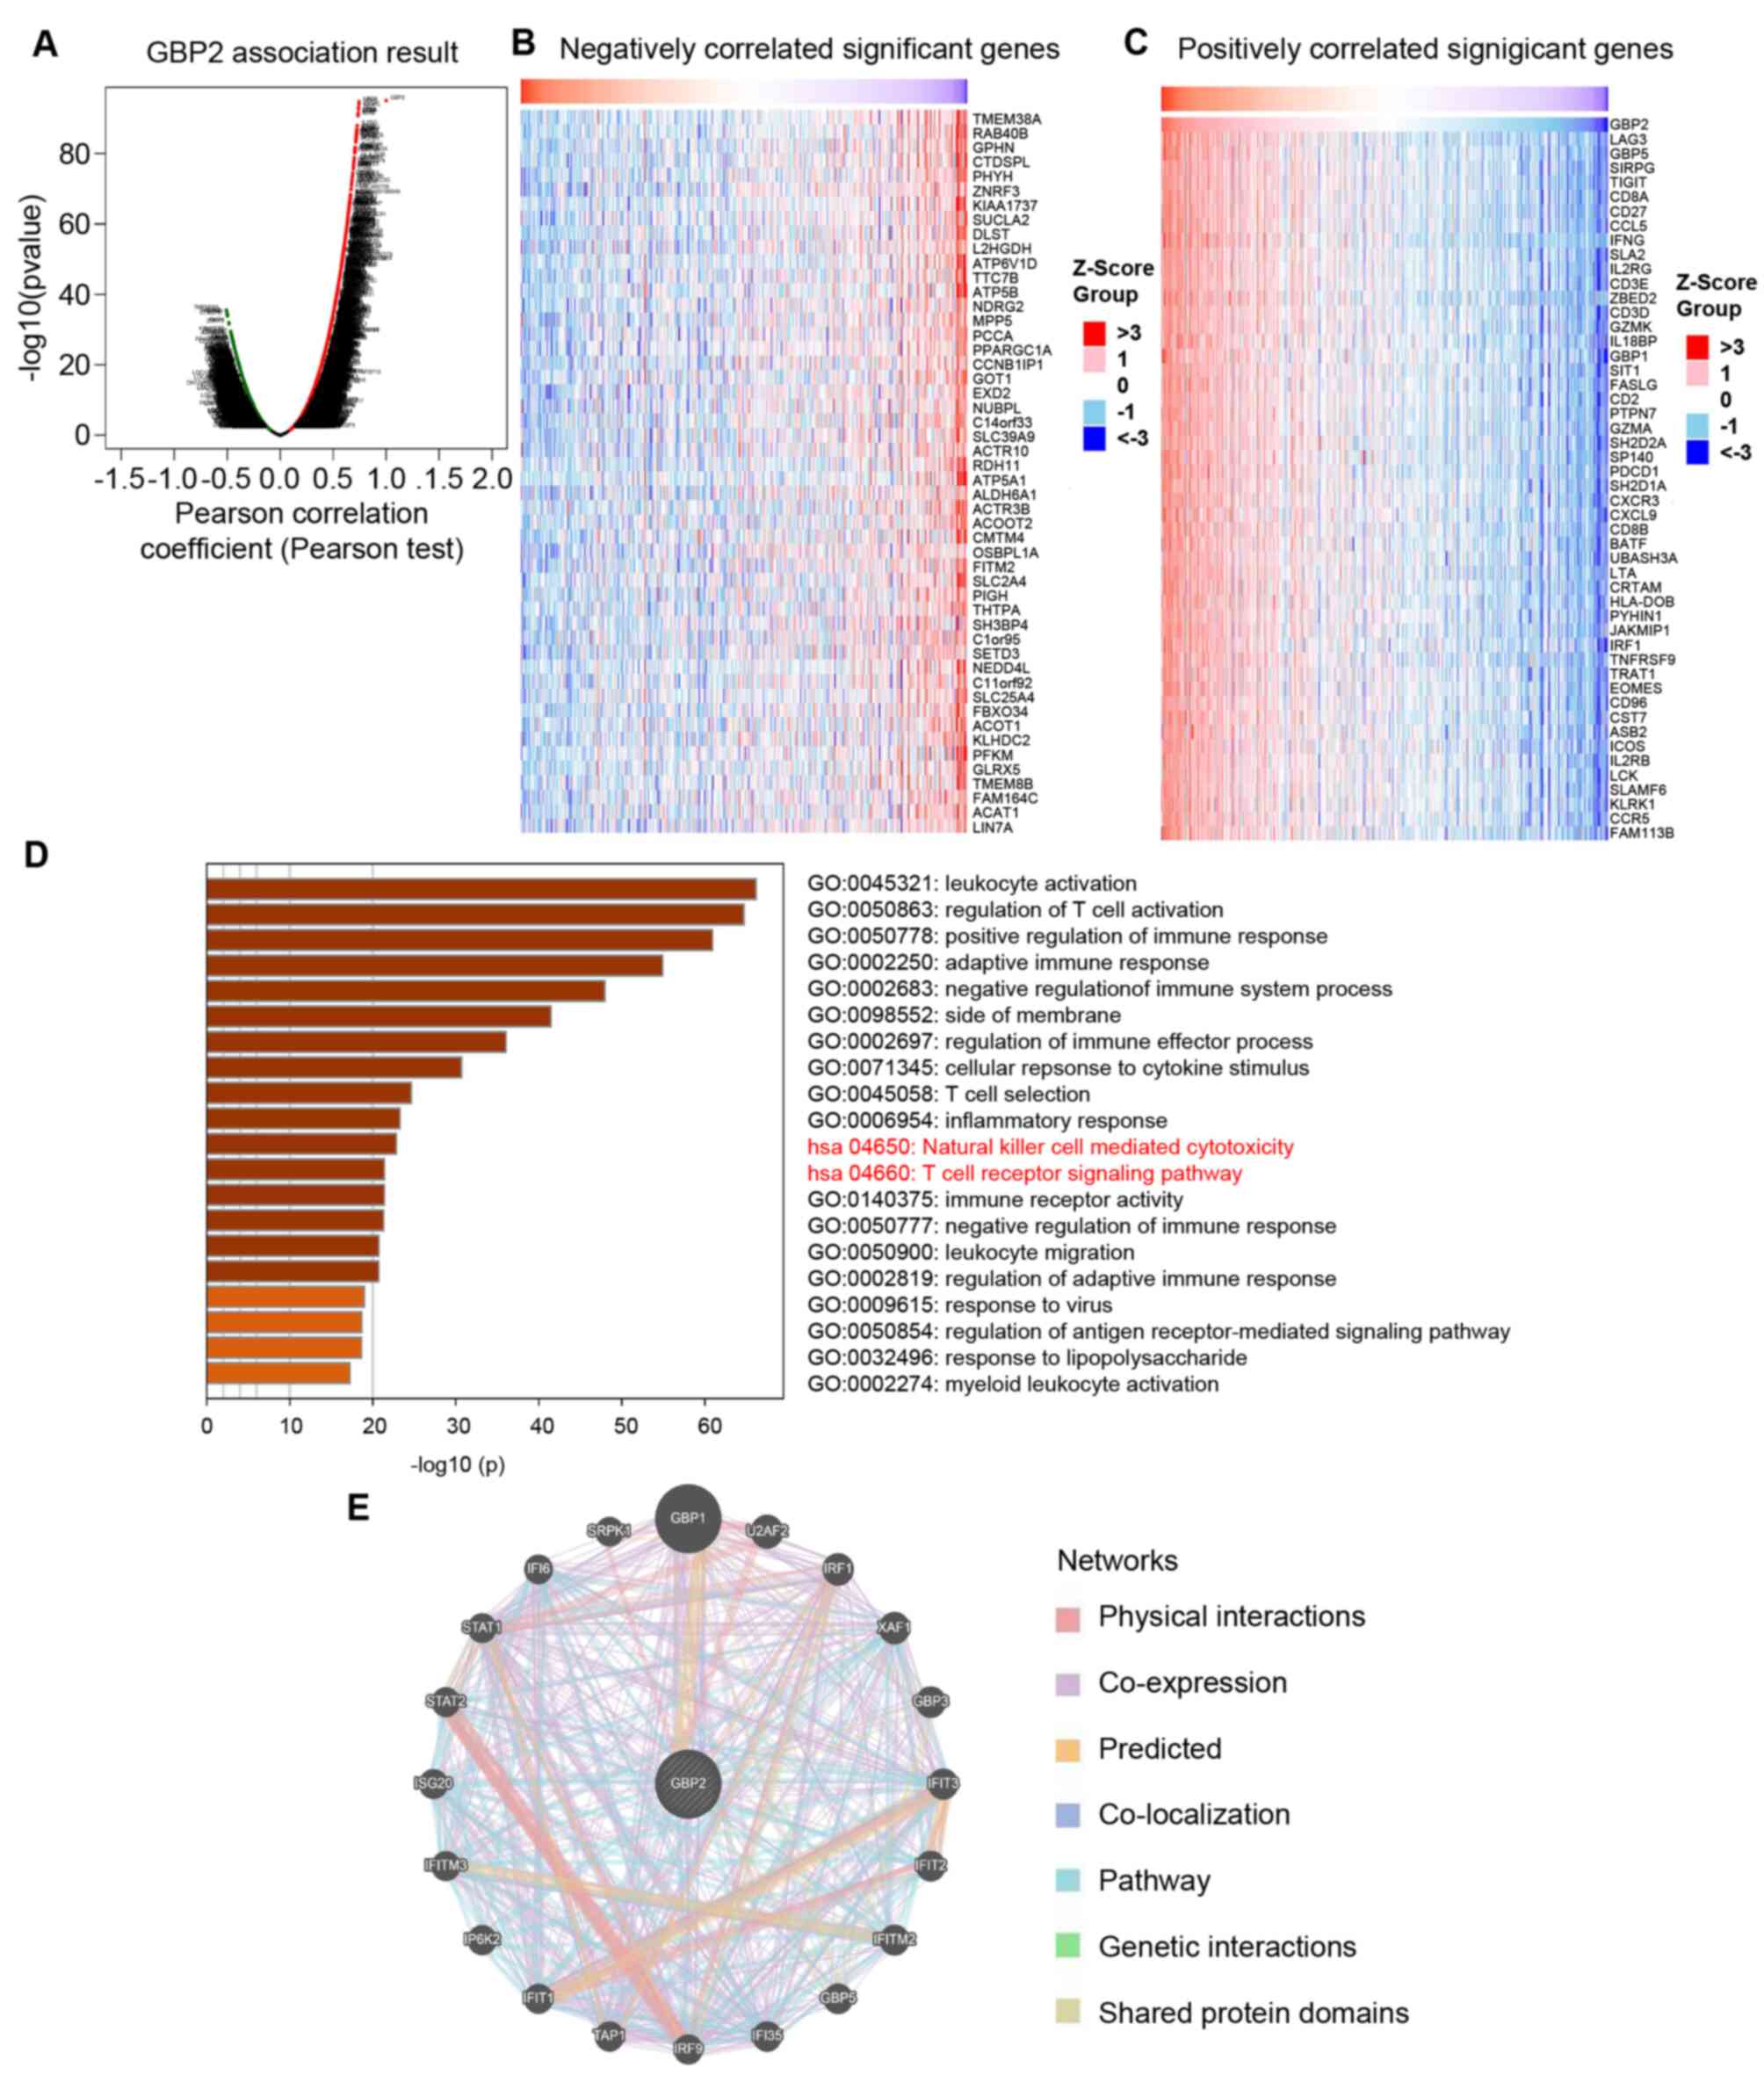
GBP2 co-expression genes and
protein-protein interaction (PPI) networks in ccRCC
To explore the molecular regulatory mechanism of
GBP2 in ccRCC, the LinkedOmics online tool was utilized to analyze
the GBP2 co-expression pattern within the ccRCC cohort. As revealed
in the volcano plot (Fig. 3A), GBP2
was positively and negatively associated with 6846 genes (dark red
dots) and 4705 genes (dark green dots), respectively. The top 50
genes with positive and negative associations with GBP2 are
demonstrated in the heat maps (Fig. 3B
and C). The majority of 50 positively correlation genes
belonged to the immunosuppressive related gene (LAG3, TIGIT, PDCD1)
and IFN-γ related genes (IFNG, CXCR3, CXCL9, IRF1). This outcome is
congruent with the data we obtained from GO and KEGG pathway
analysis with Metascape when predicting the biological role and
pathway enrichment of GBP2 and its related genes. More
specifically, GO analysis identified that GBP2 and its associated
genes are mainly involved in the regulation of T-cell activation
and adaptive immune response. The KEGG pathway analysis revealed
that GBP2 and its related genes were principal influence to natural
killer cell-mediated cytotoxicity and the T-cell receptor signaling
pathway (Fig. 3D). By expanding the
T-cell receptor signaling pathway, it was found that GBP2 KEGG
analysis was involved in PD-L1 expression and the PD-1 checkpoint
pathway in cancer (Table SI),
suggesting that GBP2 high expression is associated with immune
infiltration in ccRCC.
Next, a PPI network for GBP2 was constructed using
the GeneMANIA online tool to determine the scope of GBP2
involvement in carcinogenesis. The results revealed that GBP2 was
strongly co-expressed with GBP1, STAT1, STAT2, IRF1 and other genes
(Fig. 3E), suggesting that GBP2 may
interact with these genes to promote tumor progression. These
results demonstrated that GBP2 plays a potentially positive
significant role in immune infiltration, leading to a poor
prognosis for ccRCC.
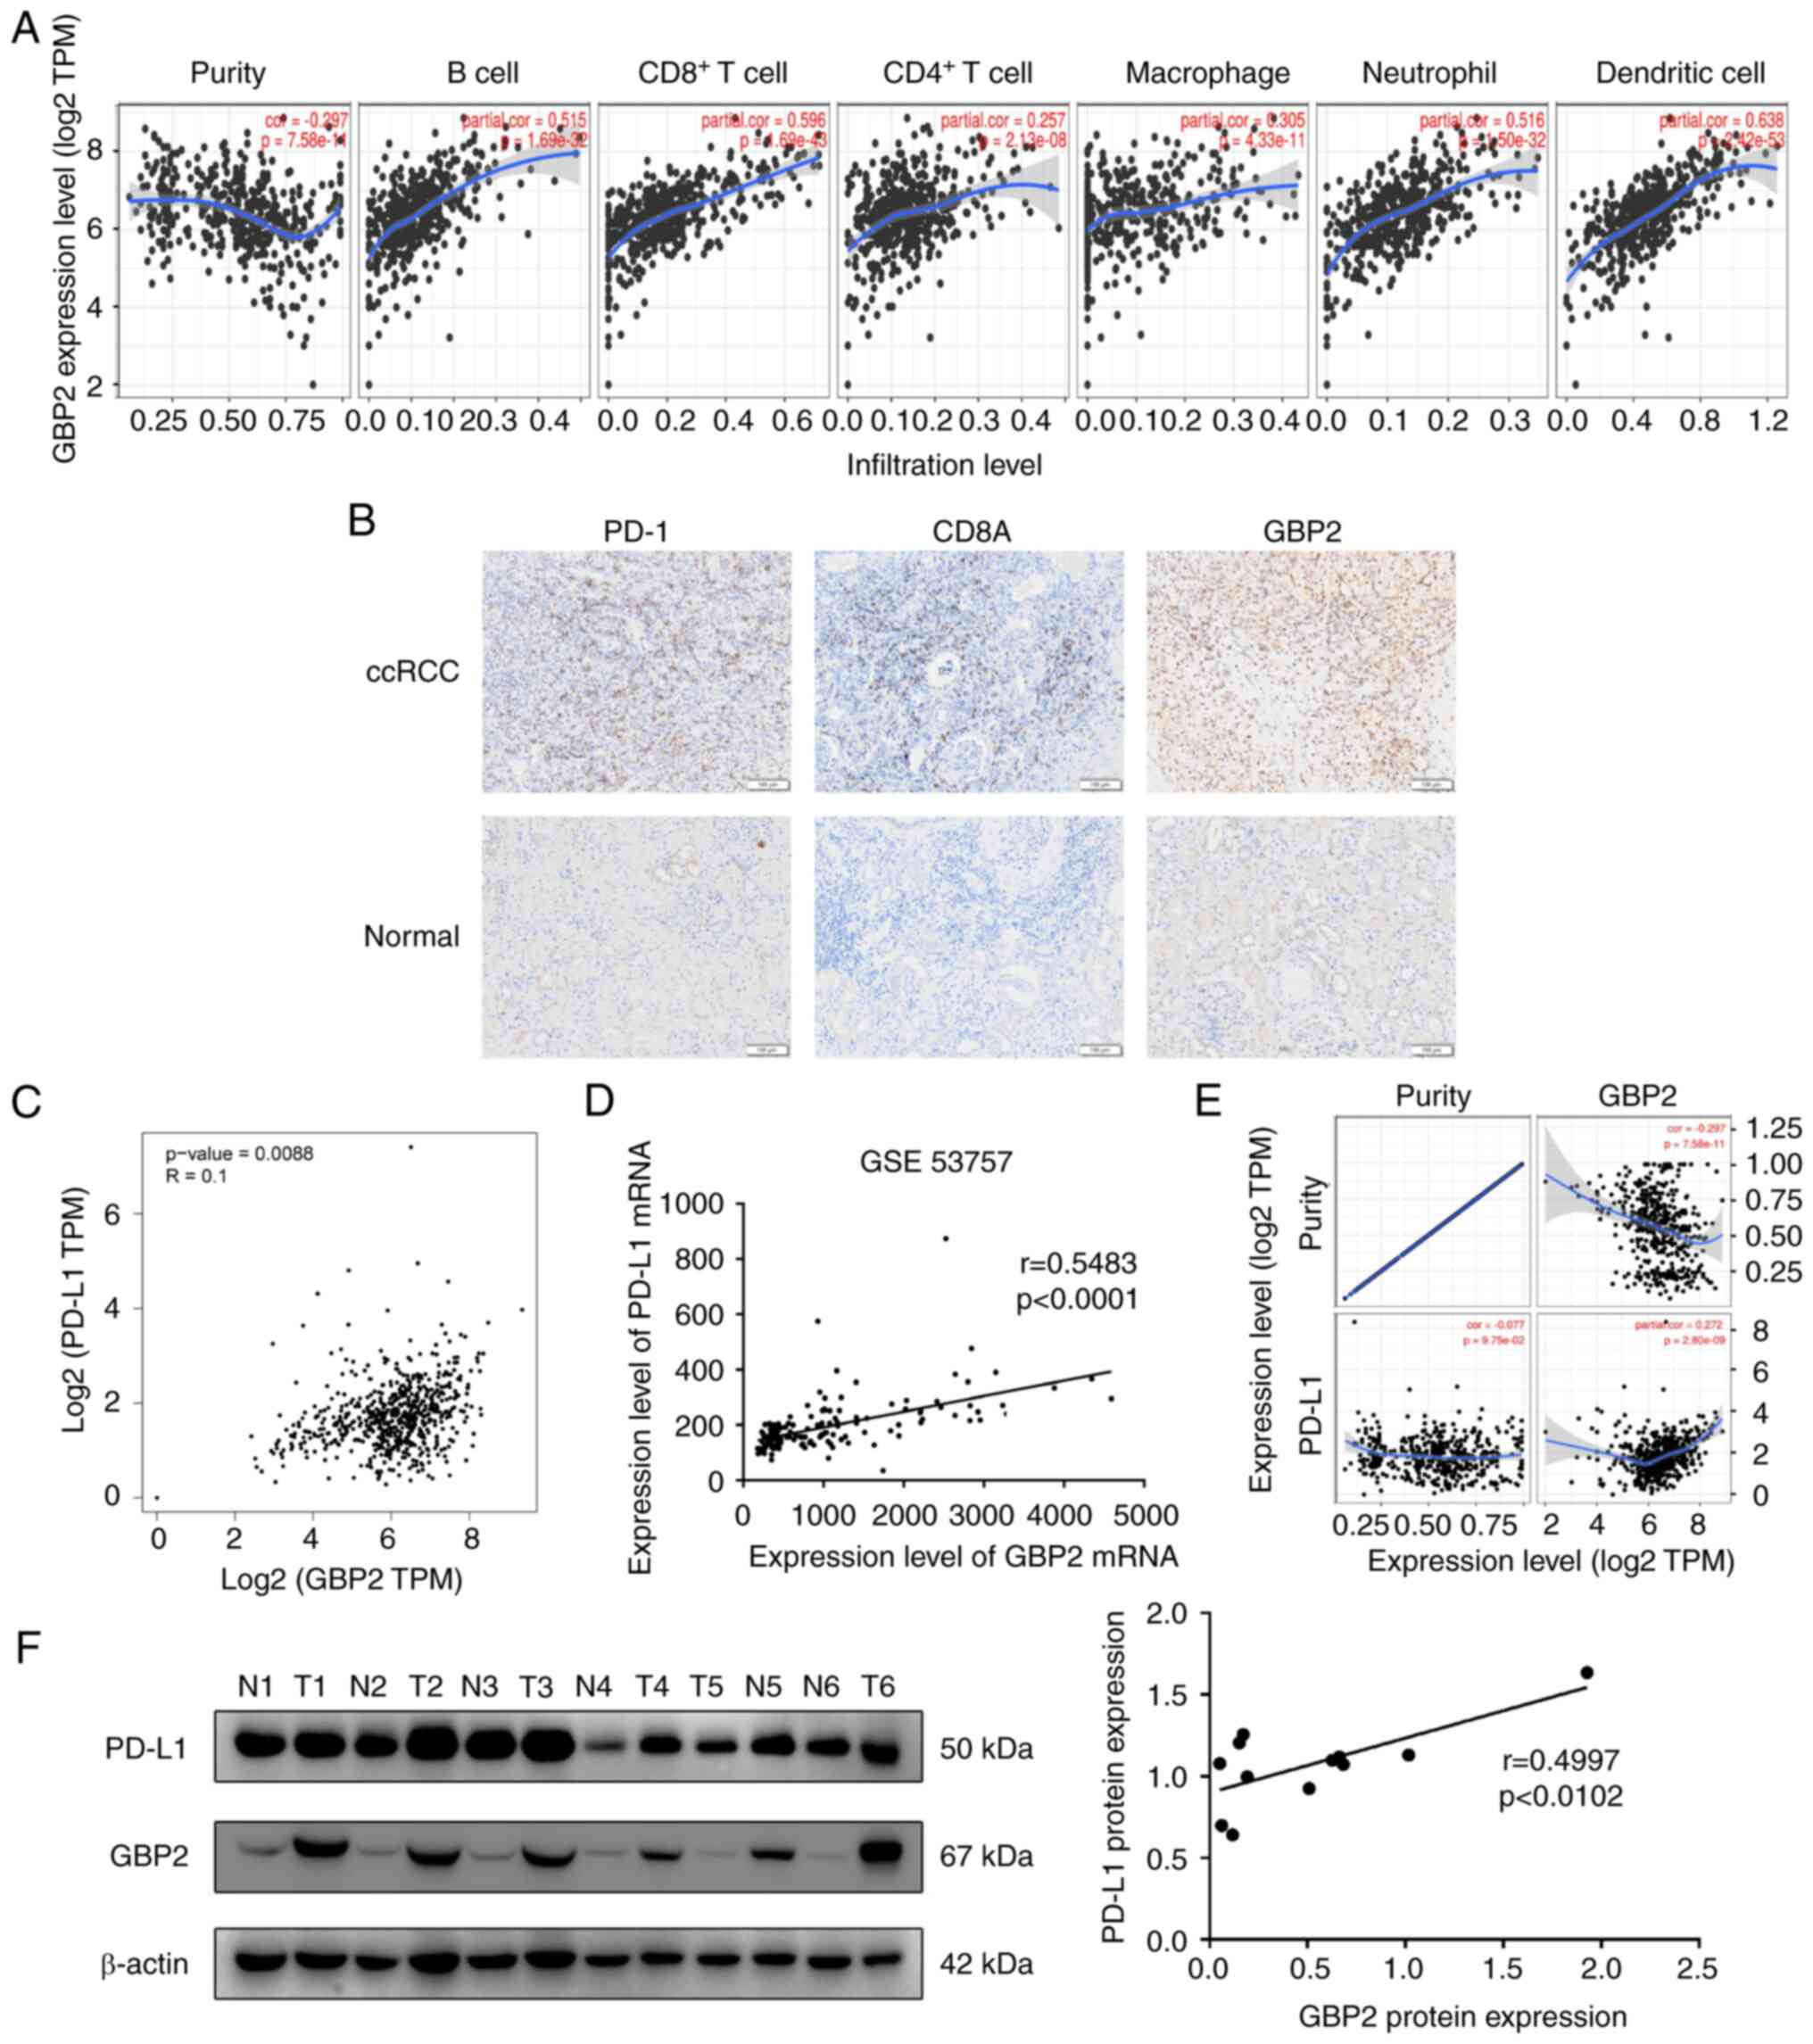
Correlation between GBP2 and immune
infiltration in ccRCC
To verify whether GBP2 influences immune
infiltration in ccRCC, the association between GBP2 and different
levels of immune cell functioning was investigated using the TIMER
online tool. It was found that GBP2 is a positively correlated with
concentrations of immune cells in ccRCC (B cell:
P=1.69×10⁻³²; CD8+ T cell:
P=1.69×10−43; CD4+ T cell:
P=2.13×10⁻⁸; macrophage: P=4.33×10⁻¹¹;
neutrophil: P=1.50×10⁻³²; and dendritic cell:
P=2.42×10−53) (Fig. 4A),
suggesting that GBP2 may participate in the immune immersion
mechanism in ccRCC. TIMER2.0 was next used to analyze association
of GBP2 with the expression of multiple immune cell markers
(Table I). The outcomes verified
the positive association between GBP2 and ccRCC-relevant gene
markers for CD8+ T cells, T-cells (general) and T-cell
exhaustion.
 | Table I.Correlation analysis between
guanylate-binding protein 2 and markers of immune cells in Tumor
Immune Estimation Resource 2.0 database. |
Table I.
Correlation analysis between
guanylate-binding protein 2 and markers of immune cells in Tumor
Immune Estimation Resource 2.0 database.
|
|
| Kidney renal clear
cell carcinoma |
|---|
|
|
|
|
|---|
|
|
| None | Purity |
|---|
|
|
|
|
|
|---|
| Description | Gene markers | Correlation
coefficient | P-value | Correlation
coefficient | P-value |
|---|
| CD8+ T
cell | CD8A | 0.720 | <0.001 | 0.69 | <0.001 |
|
| CD8B | 0.677 | <0.001 | 0.648 | <0.001 |
| T cell
(general) | CD3D | 0.686 | <0.001 | 0.645 | <0.001 |
|
| CD3E | 0.702 | <0.001 | 0.667 | <0.001 |
|
| CD2 | 0.704 | <0.001 | 0.662 | <0.001 |
| B cell | CD19 | 0.390 | <0.001 | 0.33 | <0.001 |
|
| CD79A | 0.430 | <0.001 | 0.382 | <0.001 |
| Monocyte | CD86 | 0.558 | <0.001 | 0.517 | <0.001 |
|
| CD115 (CSF1R) | 0.441 | <0.001 | 0.375 | <0.001 |
| TAM | CCL2 | 0.007 | 0.869 | −0.062 | 0.183 |
|
| CD68 | 0.363 | <0.001 | 0.343 | <0.001 |
|
| IL10 | 0.489 | <0.001 | 0.420 | <0.001 |
| M1 Macrophage | INOS (NOS2) | 0.100 | <0.01 | 0.063 | 0.175 |
|
| IRF5 | 0.224 | <0.001 | 0.187 | <0.001 |
|
| COX2 (PTGS2) | 0.062 | 0.150 | 0.009 | 0.844 |
| M2 Macrophage | CD163 | 0.389 | <0.001 | 0.358 | <0.001 |
|
| VSIG4 | 0.394 | <0.001 | 0.335 | <0.001 |
|
| MS4A4A | 0.416 | <0.001 | 0.368 | <0.001 |
| Neutrophils | CD66b
(CEACAM8) | −0.020 | 0.651 | −0.040 | 0.397 |
|
| CD11b (ITGAM) | 0.394 | <0.001 | 0.343 | <0.001 |
|
| CCR7 | 0.472 | <0.001 | 0.409 | <0.001 |
| Dendritic cell | HLA-DPB1 | 0.590 | <0.001 | 0.574 | <0.001 |
|
| HLA-DQB1 | 0.454 | <0.001 | 0.400 | <0.001 |
|
| HLA-DRA | 0.589 | <0.001 | 0.579 | <0.001 |
|
| HLA-DPA1 | 0.618 | <0.001 | 0.602 | <0.001 |
|
| BDCA-1 (CD1C) | 0.187 | <0.001 | 0.112 | <0.05 |
|
| BDCA-4 (NRP1) | 0.147 | <0.001 | 0.110 | <0.05 |
|
| CD11c (ITGAX) | 0.364 | <0.001 | 0.328 | <0.001 |
| Th1 | T-bet (TBX21) | 0.396 | <0.001 | 0.348 | <0.001 |
|
| STAT4 | 0.472 | <0.001 | 0.404 | <0.001 |
|
| STAT1 | 0.662 | <0.001 | 0.642 | <0.001 |
|
| IFN-γ (IFNG) | 0.723 | <0.001 | 0.689 | <0.001 |
|
| TNF-α (TNF) | 0.320 | <0.001 | 0.255 | <0.001 |
| Th2 | GATA3 | 0.361 | <0.001 | 0.356 | <0.001 |
|
| STAT6 | 0.095 | <0.05 | 0.111 | <0.05 |
|
| STAT5A | 0.518 | <0.001 | 0.459 | <0.001 |
|
| IL13 | 0.079 | 0.067 | 0.039 | 0.480 |
| Tfh | BCL6 | 0.184 | <0.001 | 0.175 | <0.001 |
|
| IL21 | 0.224 | <0.001 | 0.210 | <0.001 |
| Th17 | STAT3 | 0.293 | <0.001 | 0.271 | <0.001 |
|
| IL17A | 0.004 | 0.918 | −0.034 | 0.464 |
| Treg | FOXP3 | 0.547 | <0.001 | 0.489 | <0.001 |
|
| CCR8 | 0.554 | <0.001 | 0.515 | <0.001 |
|
| STAT5B | 0.135 | <0.01 | 0.146 | <0.01 |
|
| TGFβ | 0.237 | <0.001 | 0.205 | <0.001 |
| T cell
exhaustion | PDCD1 | 0.674 | <0.001 | 0.644 | <0.001 |
|
| CTLA4 | 0.568 | <0.001 | 0.512 | <0.001 |
|
| LAG3 | 0.700 | <0.001 | 0.660 | <0.001 |
|
| TIM-3 (HAVCR2) | 0.295 | <0.001 | 0.277 | <0.001 |
|
| GZMB | 0.411 | 0.366 | 0.366 | <0.001 |
It was identified that GBP2 is highly correlated
with CD8+ T-cell and T-cell exhaustion. Therefore, the
relationship between GBP2 and CD8A (CD8+ T-cell marker
gene) and PD-1 (T-cell exhaustion gene marker gene) was mainly
explored using IHC. The results showed that GBP2, PD-1 and CD8A
levels were greater in ccRCC samples than in the adjacent-normal
reference samples (Fig. 4B). In
addition, the expression levels of PD-1 (χ2=4.821,
P=0.028) and CD8A (χ2=6.513, P=0.011) in the GBP2
high-expression group were significantly greater than those in the
GBP2 low-expression group (Table
II). Collectively, these data suggested that the oncogenic
effect of GBP2 is relevant to antitumor immunity.
| Table II.The Pearson χ2 test of
GBP2, PD-1 and CD8A. |
Table II.
The Pearson χ2 test of
GBP2, PD-1 and CD8A.
|
|
| GBP2 high
(n=19) | GBP2 low
(n=21) | χ2 | P-value |
|---|
| PD-1 | High (n=18) | 12 | 6 | 4.821 | 0.028 |
|
| Low (n=22) | 7 | 15 |
|
|
| CD8A | High (n=21) | 14 | 7 | 6.513 | 0.011 |
|
| Low (n=19) | 5 | 14 |
|
|
Correlation between GBP2 and PD-L1 in
ccRCC
Given that GBP2 was revealed to be highly correlated
with T-cell exhaustion markers, the relationship between PD-L1 and
GBP2 was further explored in the GEPIA2.0 database. Using the GEO
dataset GSE53757, a significant positive correlation was detected
between GBP2 and PD-L1 (GEPIA2: P=0.0088; GSE53757: P<0.0001)
(Fig. 4C and D). After adjusting
for tumor purity, the same results were obtained in the TIMER
database (P=1.30×10⁻³) (Fig.
4E). To verify the aforementioned results, western blotting was
performed on six pairs of ccRCC. GBP2 was found to be highly
expressed in ccRCC tissue and positively correlated with
concentration of PD-L1 (P=0.0102) (Fig.
4F).
GBP2 regulation of PD-L1
expression
To investigate the effect of GBP2 protein on ccRCC,
several in vitro experiments were conducted. First, GBP2
expression was examined in RCC cell lines using western blotting.
The data indicated that, compared with normal renal tubular
epithelial cells, GBP2 is overexpressed in renal cancer cells
(P<0.05) (Fig. 5A). To assess
the effect of GBP2 on PD-L1 expression, GBP2 was knocked down or
overexpressed in the Caki-1 and 786-O cell lines. To determine the
efficiency of knockdown and overexpression, mRNA and GBP2
expression levels were verified with RT-qPCR and western blotting,
respectively (Fig. S1A-H). Next, the
mRNA expression of PD-L1 was examined using RT-qPCR in GBP2
knockdown and overexpressing cells. It was demonstrated that mRNA
expression of PD-L1 in ccRCC cells was significantly decreased in
the Caki-1 and 786-O cells with GBP2 knockdown (P<0.01)
(Fig. 5B). This change was reversed
after overexpression of GBP2 (P<0.001) (Fig. 5C). Furthermore, western blotting
results also showed that PD-L1 expression was regulated by GBP2
expression levels after GBP2 knockdown and overexpression in Caki-1
and 786-O cells (P<0.05) (Fig. 5D
and E). These data suggested that GBP2 may regulate the
expression of PD-L1 at the transcriptional level.
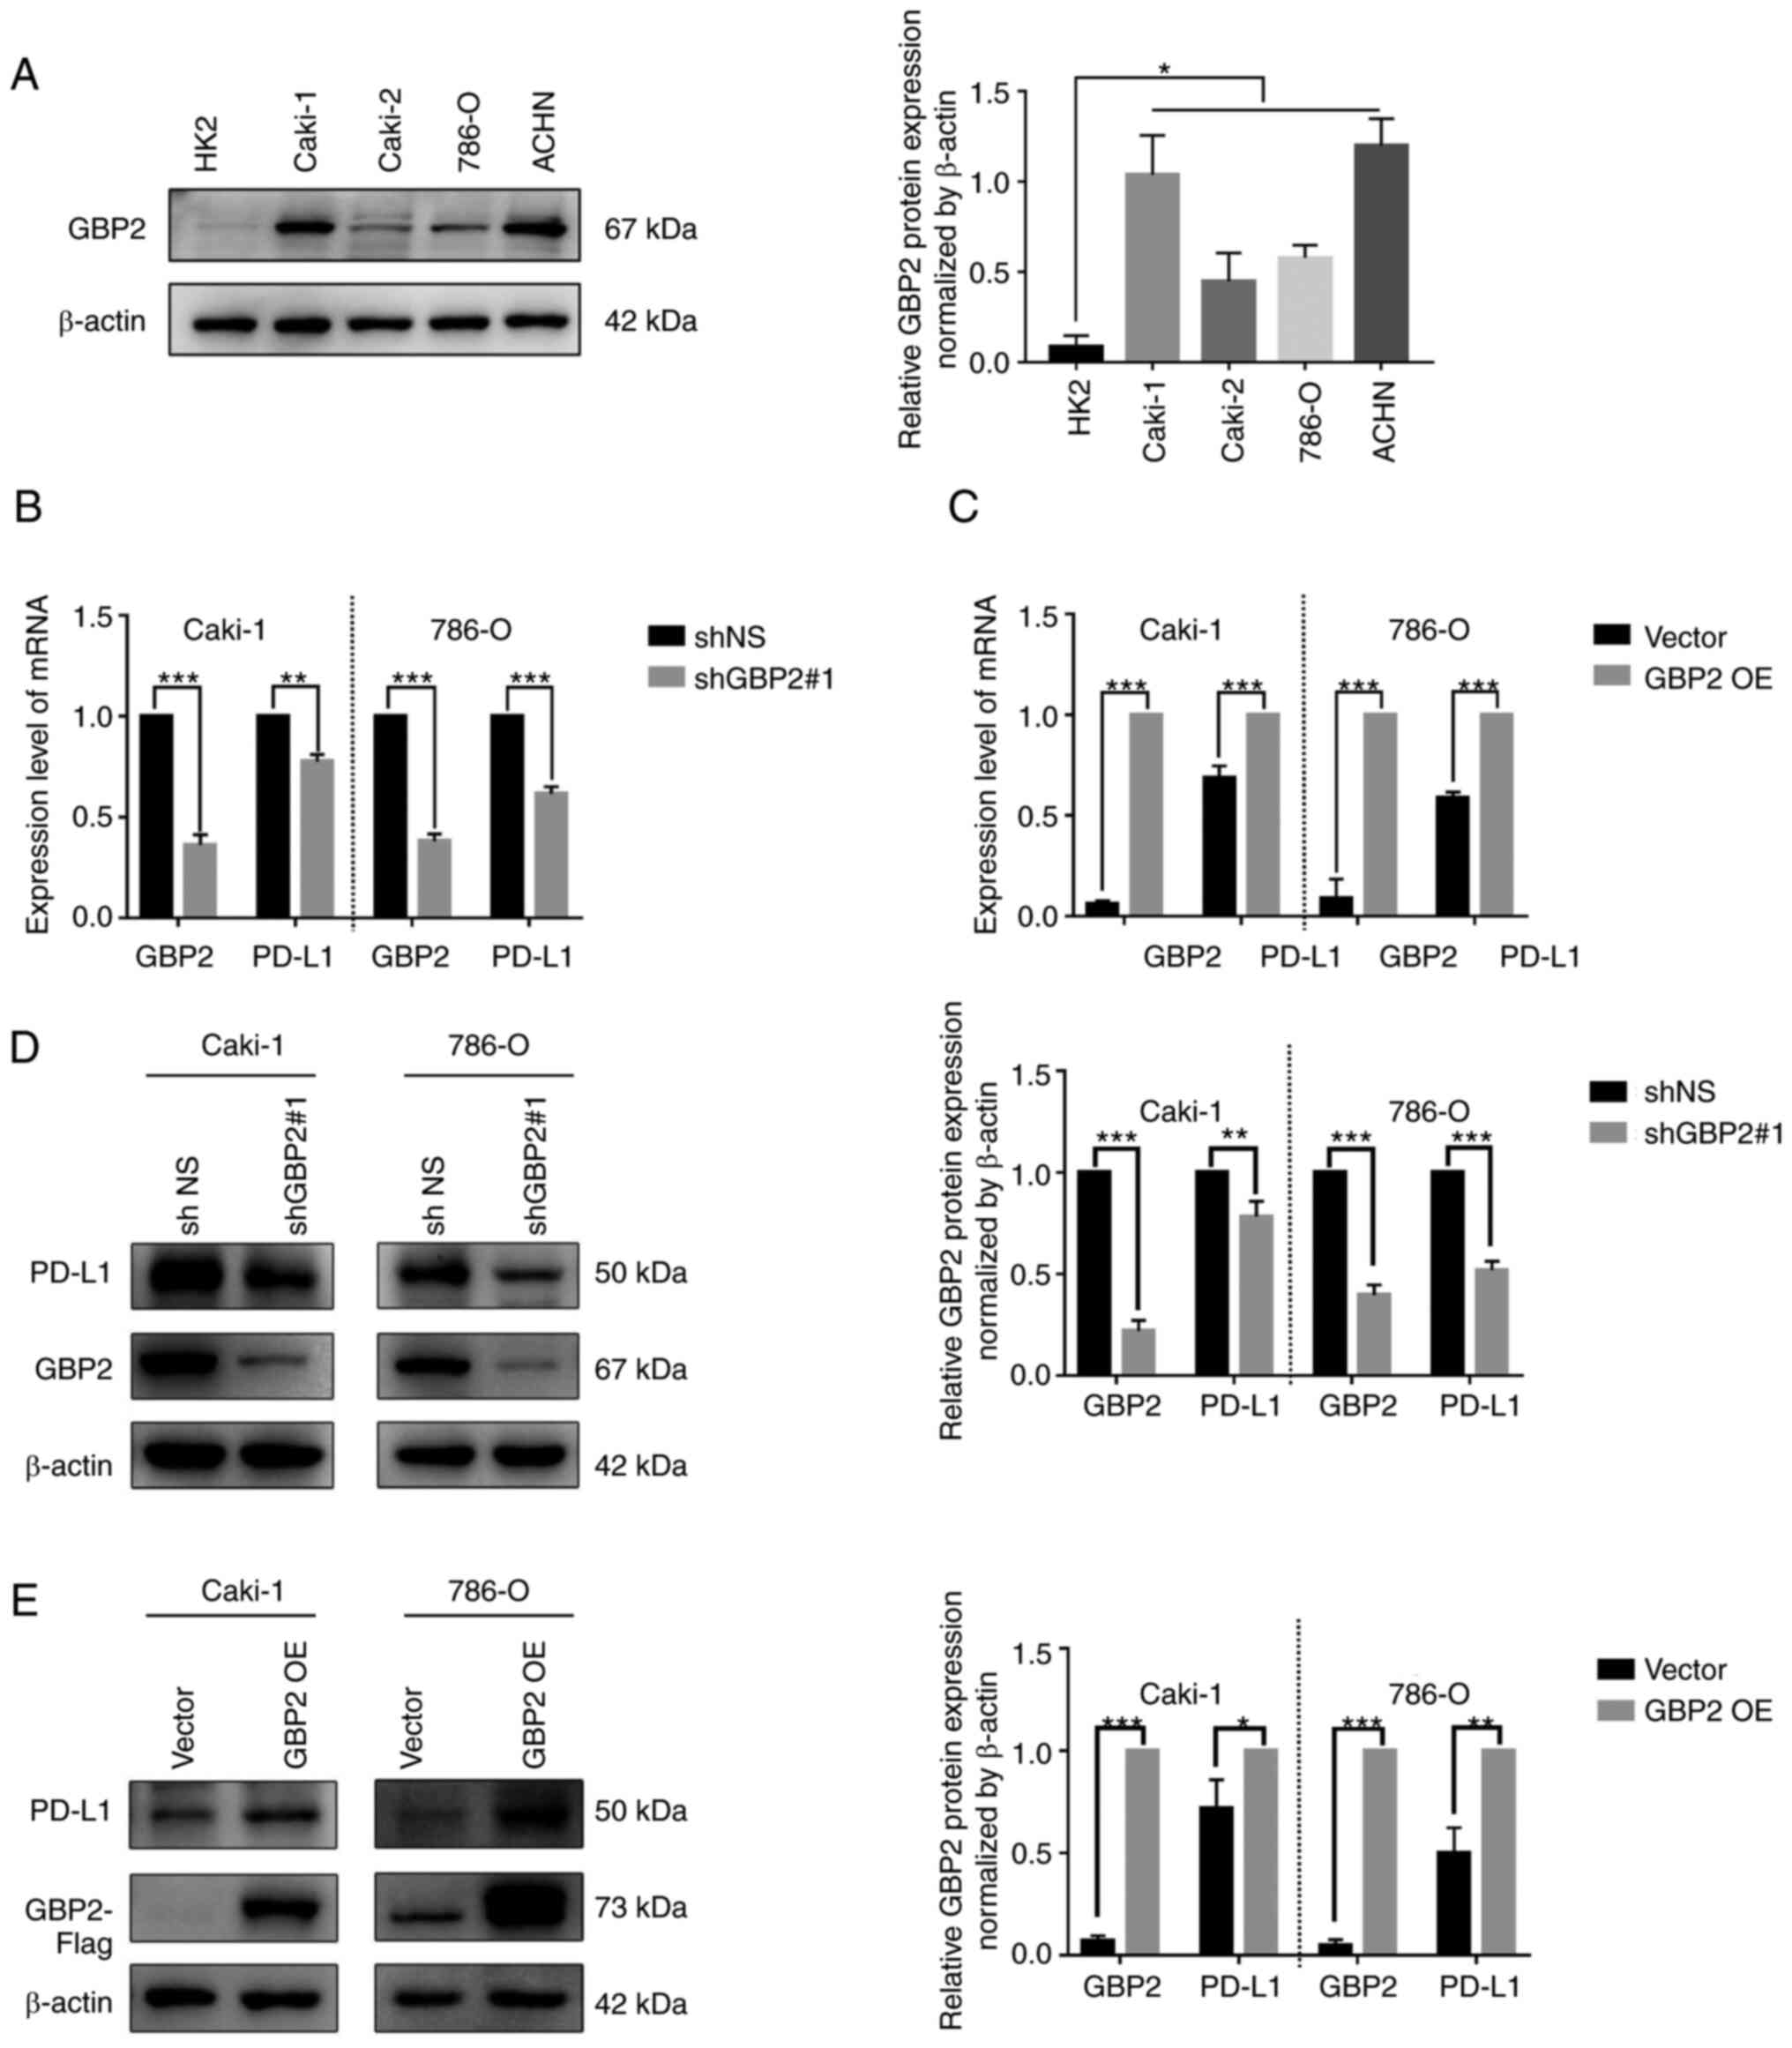 | Figure 5.GBP2 regulates PD-L1 expression at
mRNA and protein levels. (A) GBP2 expression in HK-2, Caki-1,
Caki-2, 786-O, and ACHN was detected using western blotting. (B)
PD-L1 and GBP2 mRNA expression were detected by RT-qPCR with shNS
and shGBP2#1 in Caki-1 and 786-O cell lines. (C) PD-L1 and GBP2
mRNA expression were detected by RT-qPCR with vector and GBP2 OE in
Caki-1 and 786-O. (D) PD-L1 and GBP2 protein expression were
detected by western blotting with shNS and shGBP2#1 in Caki-1 and
786-O cell lines. (E) PD-L1 and GBP2 protein levels were detected
by western blotting with vector and GBP2 OE in Caki-1 and 786-O
cell lines. Data are expressed as the mean ± SD of three
independent experiments. *P<0.05, **P<0.01 and ***P<0.001.
GBP 2, guanylate-binding protein 2; PD-L1, programmed death-ligand
1; RT-qPCR, reverse transcription-quantitative PCR; OE,
overexpression; sh-, short hairpin. |
GBP2 regulates PD-L1 expression by
interacting with STAT1
Next, the mechanism by which GBP2 regulates PD-L1
expression was investigated. Since it was found that GBP2 has a
strong correlation with STAT1, and given that STAT1 has been
revealed to promote the expression of PD-L1 (36,37),
the effect of GBP2 on STAT1 was first investigated. Western blot
analysis suggested that p-STAT1 (Ser 727) was downregulated after
GBP2 knockdown in Caki-1 and 786-O cells (Fig. 6A). Furthermore, increased STAT1
phosphorylation was observed in Caki-1 and 786-O cells
overexpressing GBP2 (Fig. 6B). To
determine whether STAT1 is involved in GBP2 regulation of PD-L1,
the GBP2-overexpressing cell lines were cultured with a STAT1
inhibitor (Fludarabine, 50 µM) and DMSO for 36 h. RT-qPCR data
indicated that STAT1 inhibition weakened PD-L1 mRNA expression in
Caki-1 and 786-O cells after GBP2 overexpression (P<0.01)
(Fig. 6C). Furthermore, western
blotting results suggested that PD-L1 levels were partially reduced
when STAT1 was blocked (P<0.01) (Fig. 6D). To determine whether STAT1 plays
a role in GBP2 regulation of PD-L1, STAT1 was silenced using siRNA
in Caki-1 and 786-O cells. Western blotting was performed to
determine the efficiency of STAT1 knockdown (Fig. S1I). Similarly, by knocking down STAT1
in Caki-1 and 786-O cells overexpressing GBP2, it was found that
upregulation of PD-L1 was reversed (P<0.05) (Fig. 6E). Importantly, the interaction
between STAT1 and GBP2 was demonstrated by immunoprecipitation and
western blot analysis in Caki-1 and 786-O cells overexpressing GBP2
(Fig. 6F). Based on these results,
it was considered that GBP2 interacts with STAT1 and upregulates
PD-L1 expression, which leads to tumor immune evasion and worsens
the prognosis of patients with ccRCC (Fig. 6G).
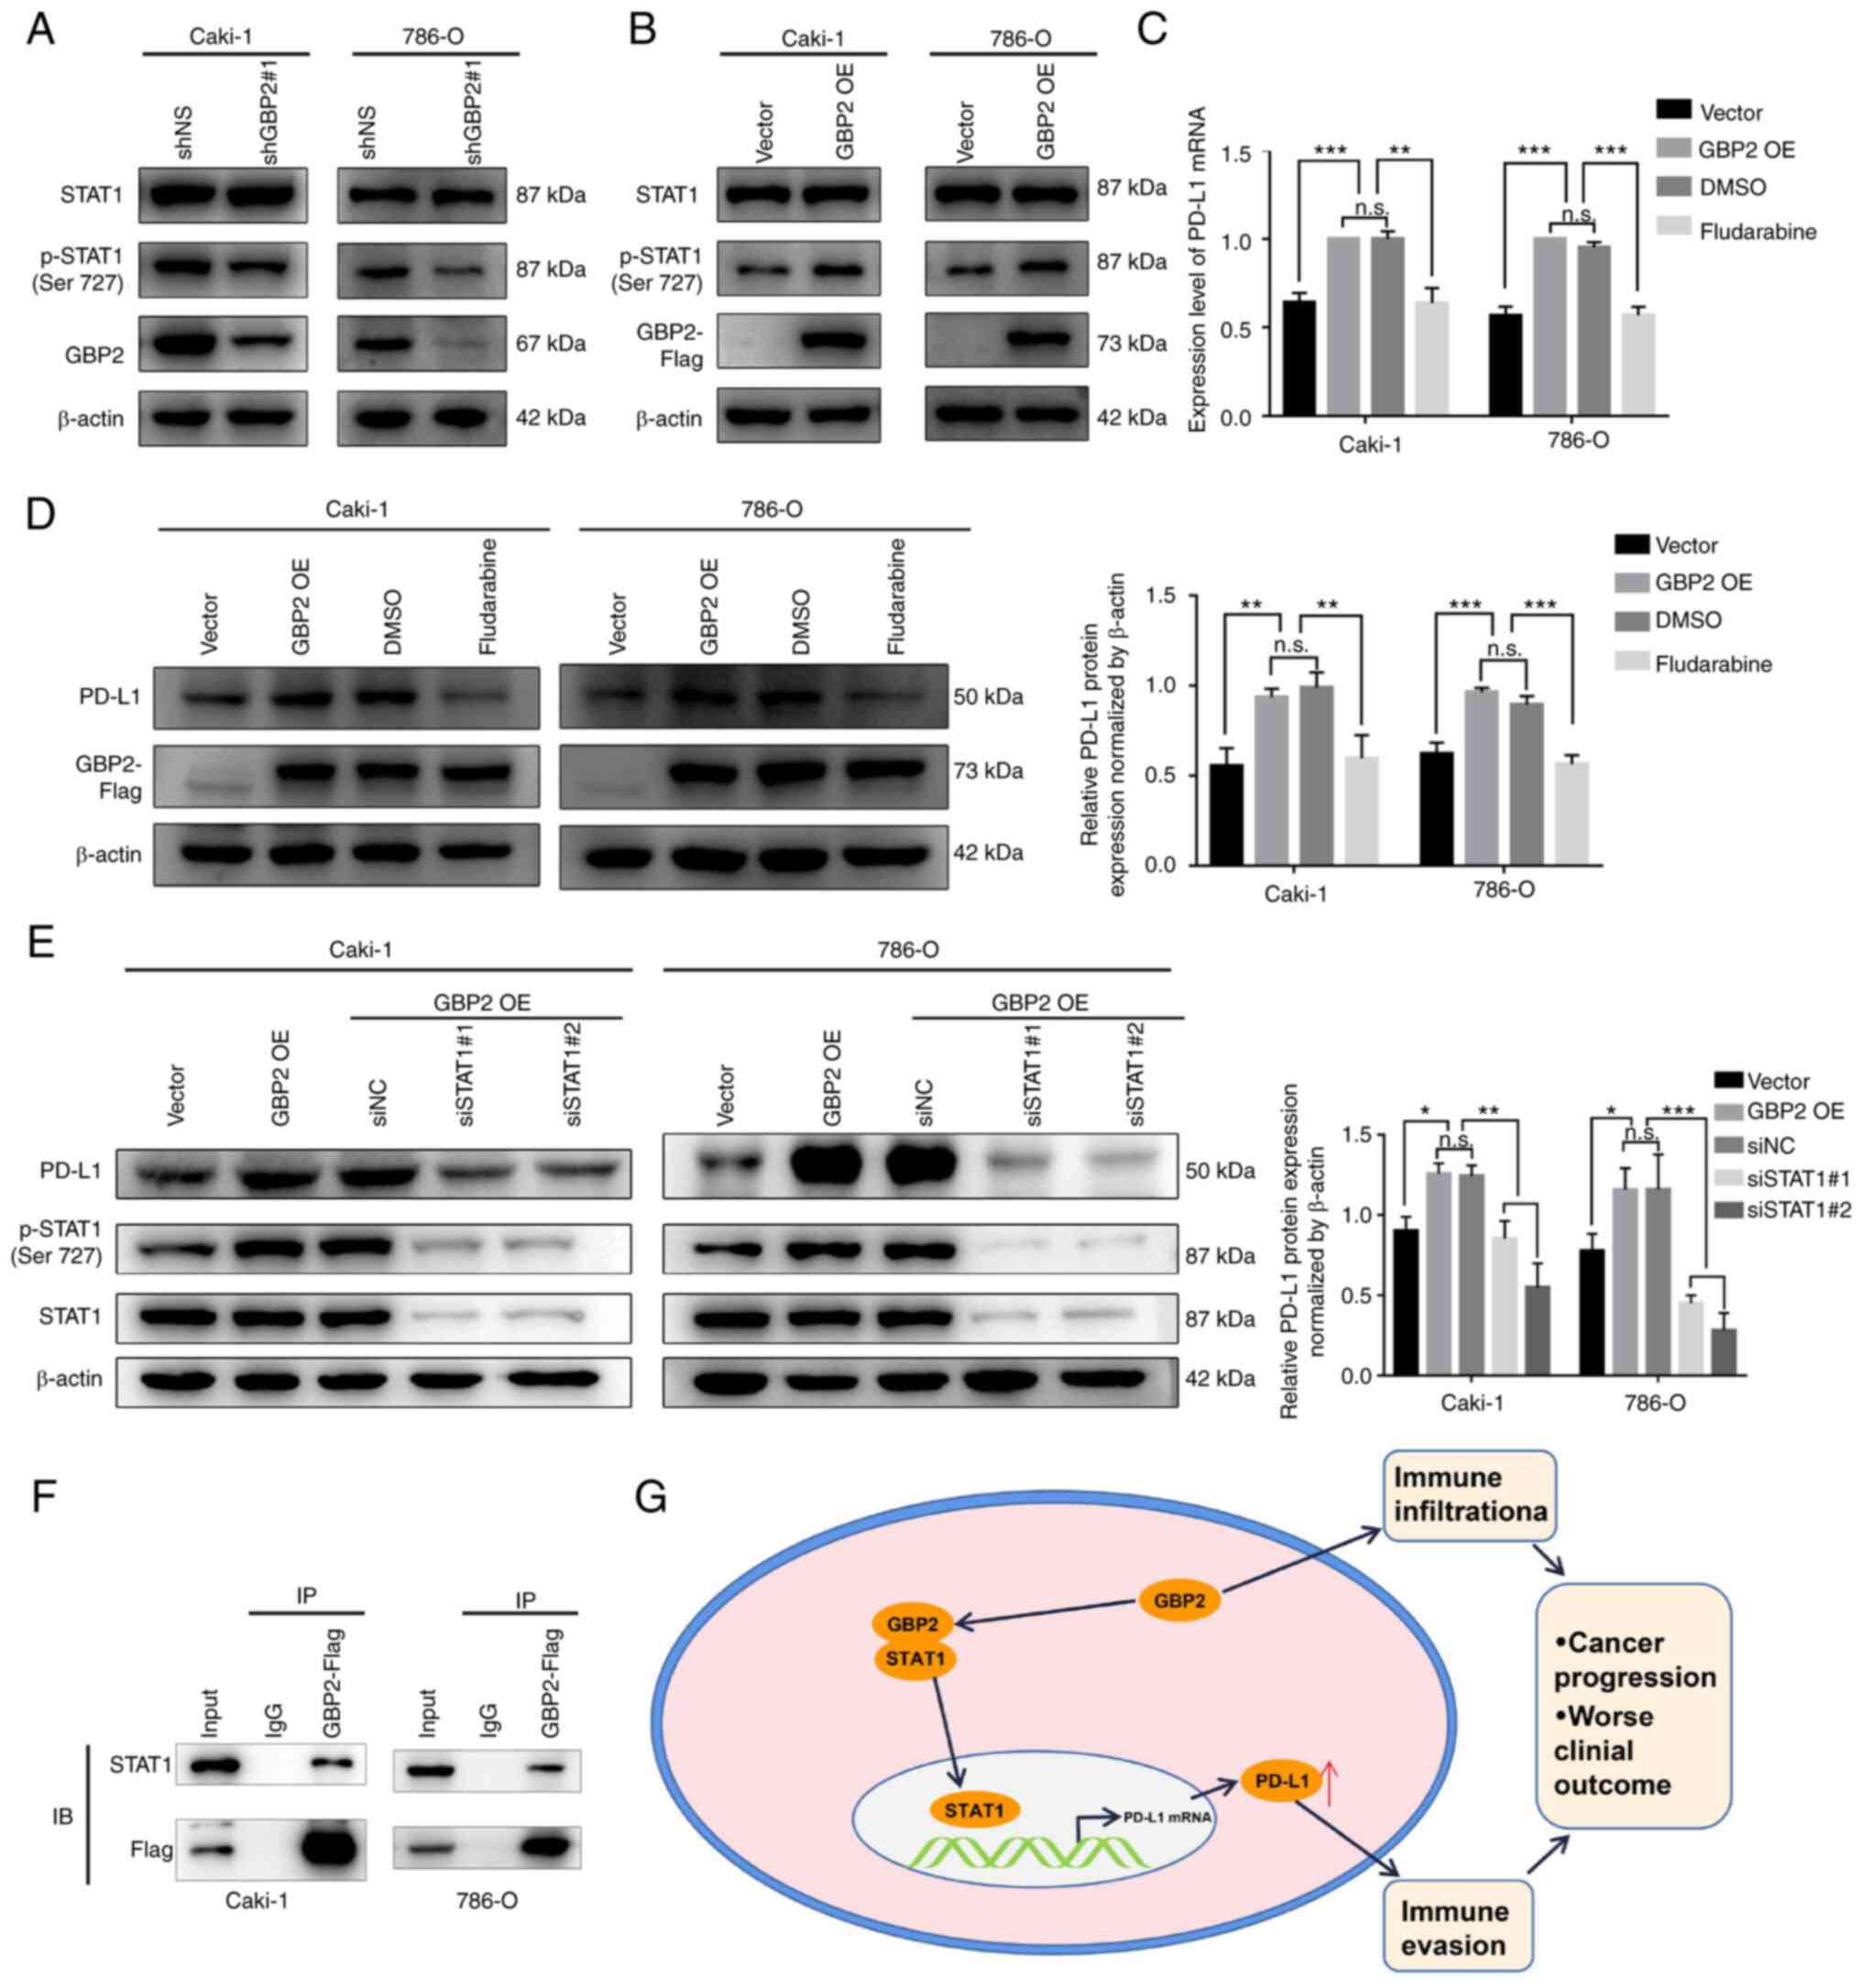 | Figure 6.GBP2 regulates PD-L1 expression by
interacting with STAT1. (A) Protein levels of GBP2, STAT1 and
p-STAT1 (Ser 727) were examined by western blotting with shNS and
shGBP2#1 in Caki-1 and 786-O cell lines. (B) Protein expression of
GBP2, STAT1 and p-STAT1 (Ser 727) were examined by western blotting
with vector and GBP2 OE in Caki-1 and 786-O cells. (C) Caki-1 and
786-O cells were treated with DMSO or Fludarabine (50 µM) for 36 h
prior examining PD-L1 mRNA levels by reverse
transcription-quantitative PCR. (D) Caki-1 and 786-O cells were
treated with DMSO or Fludarabine (50 µM) for 36 h prior to
immunoblot analysis of PD-L1 and GBP2 levels. (E) Concentrations of
PD-L1, STAT1 and p-STAT1 were examined by western blotting in
Caki-1 and 786-O (vector, GBP2 OE and GBP2 OE cells transfected
with siNC or siSTAT1#1 and siSTAT1#2). (F) The protein-protein
interaction between GBP2 and STAT1 was validated using
immunoprecipitations followed by western blot analyses with
indicated antibodies in Caki-1 cells and 786-O cells. IgG was used
as an immunoprecipitation control. (G) A possible mechanism for
GBP2-promoted PD-L1 upregulation and immunosuppression in clear
cell renal cell carcinoma. Data are expressed as the mean ± SD of
three independent experiments. *P<0.05, **P<0.01 and
***P<0.001. GBP 2, guanylate-binding protein 2; PD-L1,
programmed death-ligand 1; p-, phosphorylated; sh-, short hairpin;
OE, overexpression; si-, small interfering; NC, negative control;
n.s., not significant. |
Discussion
ccRCC, which is the main subtype of RCC, has a poor
prognosis and lacks effective biological markers. Low rates of
early diagnosis and scarcity of efficient therapies for patients
with advanced or metastatic status are the leading causes of
mortality in ccRCC (38,39). Therefore, validated early diagnosis,
prognostic biomarkers and effective therapies are necessary to
improve ccRCC outcomes. In the present study, GBP2 was identified
as a new ccRCC biomarker and demonstrated that GBP2 acts in crucial
ways in ccRCC. It was found that GBP2 is overexpressed in ccRCC
tissue, suggesting poor prognosis, and that GBP2 overexpression, in
turn, is correlated with immune infiltration. As revealed in the
cell experiments, it was demonstrated that GBP2 regulates PD-L1
expression through the STAT1 pathway, thereby promoting tumor
immune evasion and resulting in worse prognosis for ccRCC. In
brief, the current results revealed that GBP2 may be a potential
immunotherapeutic target in ccRCC.
Innate and adaptive immune cells interact with tumor
cells through direct contact or through chemokine and cytokine
signaling to shape the behavior of the tumor and its response to
therapy (40). Tumor-infiltrating
immune cells have been identified as potential biomarkers for
cancer treatments (41). The
present results revealed that GBP2 co-expressed genes are
associated with features of the immune microenvironment of tumor
cells as well as the immune response. In addition, GBP2 expression
is moderately to highly correlated with a variety of immune cell
markers, including CD8+ T cells, monocytes, M2
macrophages, Th2, Treg and T-cell exhaustion. This is consistent
with the present IHC results, in which GBP2 was found to be
correlated with PD-1 and CD8A expression in ccRCC. Previous studies
have shown that patients with ccRCC who have a high degree of
PD1+, CD8+ T cells and Treg immune cells
infiltration have a poor prognosis (42–44).
Paradoxically, in the tumor microenvironment of ccRCC, highly
infiltrating CD8+ T cells could not improve prognosis,
possibly due to exhaustion of CD8+ T cells (45).
In the present study, bioinformatics analysis
revealed a high correlation between GBP2 and STAT1, and cell
experiments indicated that GBP2 affects the phosphorylation of
STAT1 in vitro. Activation of the STAT1 pathway in multiple
tumor tissues indicates worse clinical outcomes, and STAT1
inhibition is sensitive to radiotherapy and chemotherapy in RCC
(46,47). The aforementioned analysis indicated
that GBP2 may activate STAT1 and lead to poor prognosis in
ccRCC.
The immune checkpoint PD-L1 plays a vital role in
promoting tumor immune escape (48). PD-L1 expression is regulated by
multiple mechanisms; notably, STAT1 binds to the PD-L1 promoter and
upregulates PD-L1 expression at the transcriptional level, thereby
promoting tumor progression (36,49,50).
In the present study, it was found that GBP2 regulates PD-L1
expression through the STAT1 pathways at the transcriptional and
protein levels, and, moreover, that GBP2 interacts with STAT1,
which was similar to certain previous studies (36,51).
The aforementioned analysis suggested that GBP2 influences tumor
escape by upregulating PD-L1 expression, thereby promoting tumor
progression and worsening clinical prognosis in ccRCC.
However, the present study has certain limitations.
Firstly, the public data information on ccRCC used in the current
analysis was insufficient and could lead to potential
errors/biases. Second, the tumor-promoting effect of GBP2 was only
verified through in vitro experiments, without corollary
in vivo data. Third, since PD-L1 is regulated by multiple
mechanisms, additional research is needed to determine whether
STAT1 binds to PD-L1 promoter and GBP2 governs PD-L1 expression
beyond the STAT1 pathway in ccRCC.
Through a range of bioinformatics analyses and in
vitro experiments, it was demonstrated that GBP2 is
overexpressed in ccRCC. Furthermore, GBP2 overexpression is
correlated with immune infiltration in renal cancer cells. It was
further indicated that GBP2-mediated signaling via STAT1 induces
PD-L1 expression, which may play an essential role in immune
evasion in ccRCC. Hence, GBP2 may serve as an adverse prognostic
marker and a potential immunotherapeutic target in ccRCC.
Supplementary Material
Supporting Data
Supporting Data
Acknowledgements
Not applicable.
Funding
The present study was supported by the Scientific Research
Foundation of Anhui Academy of Translational Medicine (grant nos.
2017zhyx16 and 2021zhyx-C73) and the Health Commission of Anhui
Province (grant no. AHWJ2022a033).
Availability of data and materials
The datasets used and/or analyzed during the current
study are available from the corresponding author on reasonable
request.
Authors' contributions
SY, SL and GL conceived the idea and wrote the
manuscript and confirm the authenticity of all the raw data. SY, LQ
and HZ performed bioinformatics analysis. SY, WZ, BL and XH
performed experimental validation. NY, XL, ZR and GL performed
certain of the experiments in this study, revised the manuscript
and supervised the study, as well as provided experimental
technical support. All authors participated in the manuscript
preparation, proofreading and submission. All authors read,
confirmed, and approved the final version of the manuscript and
agree to take responsibility for the contents of the article.
Ethics approval and consent to
participate
The present study was approved [approval no.
PJ-YX2022-016(F1)] by the Ethics Committee of the First Affiliated
Hospital of Anhui Medical University (Hefei, China) and carried out
in accordance with ethical standards of the Declaration of
Helsinki. Written informed consent was obtained from each
patient.
Patient consent for publication
Not applicable.
Competing interests
The authors declare that they have no competing
interests.
References
|
1
|
Sung H, Ferlay J, Siegel RL, Laversanne M,
Soerjomataram I, Jemal A and Bray F: Global cancer statistics 2020:
GLOBOCAN estimates of incidence and mortality worldwide for 36
cancers in 185 countries. CA Cancer J Clin. 71:209–249. 2021.
View Article : Google Scholar : PubMed/NCBI
|
|
2
|
Shuch B, Amin A, Armstrong AJ, Eble JN,
Ficarra V, Lopez-Beltran A, Martignoni G, Rini BI and Kutikov A:
Understanding pathologic variants of renal cell carcinoma:
Distilling therapeutic opportunities from biologic complexity. Eur
Urol. 67:85–97. 2015. View Article : Google Scholar : PubMed/NCBI
|
|
3
|
Braun DA, Hou Y, Bakouny Z, Ficial M,
Sant' Angelo M, Forman J, Ross-Macdonald P, Berger AC, Jegede OA,
Elagina L, et al: Interplay of somatic alterations and immune
infiltration modulates response to PD-1 blockade in advanced clear
cell renal cell carcinoma. Nat Med. 26:909–918. 2020. View Article : Google Scholar : PubMed/NCBI
|
|
4
|
Choueiri TK and Motzer RJ: Systemic
therapy for metastatic renal-cell carcinoma. N Engl J Med.
376:354–366. 2017. View Article : Google Scholar : PubMed/NCBI
|
|
5
|
Choueiri TK, Fishman MN, Escudier B,
McDermott DF, Drake CG, Kluger H, Stadler WM, Perez-Gracia JL,
McNeel DG, Curti B, et al: Immunomodulatory activity of nivolumab
in metastatic renal cell carcinoma. Clin Cancer Res. 22:5461–5471.
2016. View Article : Google Scholar : PubMed/NCBI
|
|
6
|
Praefcke GJK and McMahon HT: The dynamin
superfamily: Universal membrane tubulation and fission molecules?
Nat Rev Mol Cell Biol. 5:133–147. 2004. View Article : Google Scholar : PubMed/NCBI
|
|
7
|
Vestal DJ: The guanylate-binding proteins
(GBPs): Proinflammatory cytokine-induced members of the dynamin
superfamily with unique GTPase activity. J Interferon Cytokine Res.
25:435–443. 2005. View Article : Google Scholar : PubMed/NCBI
|
|
8
|
Tretina K, Park ES, Maminska A and
MacMicking JD: Interferon-induced guanylate-binding proteins:
Guardians of host defense in health and disease. J Exp Med.
216:482–500. 2019. View Article : Google Scholar : PubMed/NCBI
|
|
9
|
Yu S, Yu X, Sun L, Zheng Y, Chen L, Xu H,
Jin J, Lan Q, Chen CC and Li M: GBP2 enhances glioblastoma invasion
through Stat3/fibronectin pathway. Oncogene. 39:5042–5055. 2020.
View Article : Google Scholar : PubMed/NCBI
|
|
10
|
Liu B, Huang R, Fu T, He P, Du C, Zhou W,
Xu K and Ren T: GBP2 as a potential prognostic biomarker in
pancreatic adenocarcinoma. Peerj. 9:e114232021. View Article : Google Scholar : PubMed/NCBI
|
|
11
|
Liu QY, Hoffman RM, Song J, Miao S, Zhang
J, Ding D and Wang D: Guanylate-binding protein 2 expression is
associated with poor survival and malignancy in clear-cell renal
cell carcinoma. Anticancer Res. 42:2341–2354. 2022. View Article : Google Scholar : PubMed/NCBI
|
|
12
|
Diaz-Montero CM, Rini BI and Finke JH: The
immunology of renal cell carcinoma. Nat Rev Nephrol. 16:721–735.
2020. View Article : Google Scholar : PubMed/NCBI
|
|
13
|
Junjun S, Yangyanqiu W, Jing Z, Jie P,
Jian C, Yuefen P and Shuwen H: Prognostic model based on six PD-1
expression and immune infiltration-associated genes predicts
survival in breast cancer. Breast Cancer. 29:666–676. 2022.
View Article : Google Scholar : PubMed/NCBI
|
|
14
|
Wang H, Zhou Y, Zhang Y, Fang S, Zhang M,
Li H, Xu F, Liu L, Liu J, Zhao Q and Wang F: Subtyping of
microsatellite stability colorectal cancer reveals guanylate
binding protein 2 (GBP2) as a potential immunotherapeutic target. J
Immunother Cancer. 10:e0043022022. View Article : Google Scholar : PubMed/NCBI
|
|
15
|
Tang P, Qu W, Wu D, Chen S, Liu M, Chen W,
Ai Q, Tang H and Zhou H: Identifying and validating an
acidosis-related signature associated with prognosis and tumor
immune infiltration characteristics in pancreatic carcinoma. J
Immunol Res. 2021:38210552021. View Article : Google Scholar : PubMed/NCBI
|
|
16
|
Chen H, Song Y, Deng C, Xu Y, Xu H, Zhu X,
Song G, Tang Q, Lu J and Wang J: Comprehensive analysis of immune
infiltration and gene expression for predicting survival in
patients with sarcomas. Aging (Albany NY). 13:2168–2183. 2020.
View Article : Google Scholar : PubMed/NCBI
|
|
17
|
Haque M, Siegel RJ, Fox DA and Ahmed S:
Interferon-stimulated GTPases in autoimmune and inflammatory
diseases: Promising role for the guanylate-binding protein (GBP)
family. Rheumatology (Oxford). 60:494–506. 2021. View Article : Google Scholar : PubMed/NCBI
|
|
18
|
Chen S, Crabill GA, Pritchard TS, McMiller
TL, Wei P, Pardoll DM, Pan F and Topalian SL: Mechanisms regulating
PD-L1 expression on tumor and immune cells. J Immunother Cancer.
7:3052019. View Article : Google Scholar : PubMed/NCBI
|
|
19
|
Iacovelli R, Nolè F, Verri E, Renne G,
Paglino C, Santoni M, Cossu Rocca M, Giglione P, Aurilio G, Cullurà
D, et al: Prognostic role of PD-L1 expression in renal cell
carcinoma. A systematic review and meta-analysis. Target Oncol.
11:143–148. 2016. View Article : Google Scholar : PubMed/NCBI
|
|
20
|
Thompson RH, Dong H and Kwon ED:
Implications of B7-H1 expression in clear cell carcinoma of the
kidney for prognostication and therapy. Clin Cancer Res.
13:709s–715s. 2007. View Article : Google Scholar : PubMed/NCBI
|
|
21
|
Cheng SW, Chen PC, Lin MH, Ger TR, Chiu HW
and Lin YF: GBP5 repression suppresses the metastatic potential and
PD-L1 expression in triple-negative breast cancer. Biomedicines.
9:3712021. View Article : Google Scholar : PubMed/NCBI
|
|
22
|
Ghandi M, Huang FW, Jané-Valbuena J,
Kryukov GV, Lo CC, McDonald ER III, Barretina J, Gelfand ET,
Bielski CM, Li H, et al: Next-generation characterization of the
cancer cell line encyclopedia. Nature. 569:503–508. 2019.
View Article : Google Scholar : PubMed/NCBI
|
|
23
|
Tang Z, Kang B, Li C, Chen T and Zhang Z:
GEPIA2: An enhanced web server for large-scale expression profiling
and interactive analysis. Nucleic Acids Res. 47((W1)): W556–W560.
2019. View Article : Google Scholar : PubMed/NCBI
|
|
24
|
Gumz ML, Zou H, Kreinest PA, Childs AC,
Belmonte LS, LeGrand SN, Wu KJ, Luxon BA, Sinha M, Parker AS, et
al: Secreted frizzled-related protein 1 loss contributes to tumor
phenotype of clear cell renal cell carcinoma. Clin Cancer Res.
13:4740–4749. 2007. View Article : Google Scholar : PubMed/NCBI
|
|
25
|
von Roemeling CA, Radisky DC, Marlow LA,
Cooper SJ, Grebe SK, Anastasiadis PZ, Tun HW and Copland JA:
Neuronal pentraxin 2 supports clear cell renal cell carcinoma by
activating the AMPA-selective glutamate receptor-4. Cancer Res.
74:4796–4810. 2014. View Article : Google Scholar : PubMed/NCBI
|
|
26
|
Lánczky A and Győrffy B: Web-based
survival analysis tool tailored for medical research (KMplot):
Development and implementation. J Med Internet Res. 23:e276332021.
View Article : Google Scholar : PubMed/NCBI
|
|
27
|
Chandrashekar DS, Bashel B, Balasubramanya
SAH, Creighton CJ, Ponce-Rodriguez I, Chakravarthi BVSK and
Varambally S: UALCAN: A portal for facilitating tumor subgroup gene
expression and survival analyses. Neoplasia. 19:649–658. 2017.
View Article : Google Scholar : PubMed/NCBI
|
|
28
|
Vasaikar SV, Straub P, Wang J and Zhang B:
LinkedOmics: Analyzing multi-omics data within and across 32 cancer
types. Nucleic Acids Res. 46(D1): D956–D963. 2018. View Article : Google Scholar : PubMed/NCBI
|
|
29
|
Zhou Y, Zhou B, Pache L, Chang M,
Khodabakhshi AH, Tanaseichuk O, Benner C and Chanda SK: Metascape
provides a biologist-oriented resource for the analysis of
systems-level datasets. Nat Commun. 10:15232019. View Article : Google Scholar : PubMed/NCBI
|
|
30
|
Warde-Farley D, Donaldson SL, Comes O,
Zuberi K, Badrawi R, Chao P, Franz M, Grouios C, Kazi F, Lopes CT,
et al: The GeneMANIA prediction server: Biological network
integration for gene prioritization and predicting gene function.
Nucleic Acids Res. 38((Web Server Issue)): W214–W220. 2010.
View Article : Google Scholar : PubMed/NCBI
|
|
31
|
Li T, Fan J, Wang B, Traugh N, Chen Q, Liu
JS, Li B and Liu XS: TIMER: A web server for comprehensive analysis
of tumor-infiltrating immune cells. Cancer Res. 77:e108–e110. 2017.
View Article : Google Scholar : PubMed/NCBI
|
|
32
|
Li T, Fu J, Zeng Z, Cohen D, Li J, Chen Q,
Li B and Liu XS: TIMER2.0 for analysis of tumor-infiltrating immune
cells. Nucleic Acids Res. 48((W1)): W509–W514. 2020. View Article : Google Scholar : PubMed/NCBI
|
|
33
|
Brodaczewska KK, Szczylik C, Fiedorowicz
M, Porta C and Czarnecka AM: Choosing the right cell line for renal
cell cancer research. Mol Cancer. 15:832016. View Article : Google Scholar : PubMed/NCBI
|
|
34
|
Furge KA, Chen J, Koeman J, Swiatek P,
Dykema K, Lucin K, Kahnoski R, Yang XJ and The BT: Detection of DNA
copy number changes and oncogenic signaling abnormalities from gene
expression data reveals MYC activation in high-grade papillary
renal cell carcinoma. Cancer Res. 67:3171–3176. 2007. View Article : Google Scholar : PubMed/NCBI
|
|
35
|
Livak KJ and Schmittgen TD: Analysis of
relative gene expression data using real-time quantitative PCR and
the 2 (−Delta Delta C(T)) method. Methods. 25:402–408. 2001.
View Article : Google Scholar : PubMed/NCBI
|
|
36
|
Cerezo M, Guemiri R, Druillennec S,
Girault I, Malka-Mahieu H, Shen S, Allard D, Martineau S, Welsch C,
Agoussi S, et al: Translational control of tumor immune escape via
the eIF4F-STAT1-PD-L1 axis in melanoma. Nat Med. 24:1877–1886.
2018. View Article : Google Scholar : PubMed/NCBI
|
|
37
|
Cha JH, Chan LC, Li CW, Hsu JL and Hung
MC: Mechanisms controlling PD-L1 expression in cancer. Mol Cell.
76:359–370. 2019. View Article : Google Scholar : PubMed/NCBI
|
|
38
|
Cerbone L, Cattrini C, Vallome G, Latocca
MM, Boccardo F and Zanardi E: Combination therapy in metastatic
renal cell carcinoma: Back to the future? Semin Oncol. 47:361–366.
2020. View Article : Google Scholar : PubMed/NCBI
|
|
39
|
Braun DA, Bakouny Z, Hirsch L, Flippot R,
Van Allen EM, Wu CJ and Choueiri TK: Beyond conventional
immune-checkpoint inhibition-novel immunotherapies for renal cell
carcinoma. Nat Rev Clin Oncol. 18:199–214. 2021. View Article : Google Scholar : PubMed/NCBI
|
|
40
|
Wu T and Dai Y: Tumor microenvironment and
therapeutic response. Cancer Lett. 387:61–68. 2017. View Article : Google Scholar : PubMed/NCBI
|
|
41
|
Gajewski TF, Schreiber H and Fu YX: Innate
and adaptive immune cells in the tumor microenvironment. Nat
Immunol. 14:1014–1022. 2013. View Article : Google Scholar : PubMed/NCBI
|
|
42
|
Dai S, Zeng H, Liu Z, Jin K, Jiang W, Wang
Z, Lin Z, Xiong Y, Wang J, Chang Y, et al: Intratumoral
CXCL13+CD8+T cell infiltration determines
poor clinical outcomes and immunoevasive contexture in patients
with clear cell renal cell carcinoma. J Immunother Cancer.
9:e0018232021. View Article : Google Scholar : PubMed/NCBI
|
|
43
|
Giraldo NA, Becht E, Pagès F, Skliris G,
Verkarre V, Vano Y, Mejean A, Saint-Aubert N, Lacroix L, Natario I,
et al: Orchestration and prognostic significance of immune
checkpoints in the microenvironment of primary and metastatic renal
cell cancer. Clin Cancer Res. 21:3031–3040. 2015. View Article : Google Scholar : PubMed/NCBI
|
|
44
|
Giraldo NA, Becht E, Vano Y, Petitprez F,
Lacroix L, Validire P, Sanchez-Salas R, Ingels A, Oudard S, Moatti
A, et al: Tumor-infiltrating and peripheral blood T-cell
immunophenotypes predict early relapse in localized clear cell
renal cell carcinoma. Clin Cancer Res. 23:4416–4428. 2017.
View Article : Google Scholar : PubMed/NCBI
|
|
45
|
Braun DA, Street K, Burke KP, Cookmeyer
DL, Denize T, Pedersen CB, Gohil SH, Schindler N, Pomerance L,
Hirsch L, et al: Progressive immune dysfunction with advancing
disease stage in renal cell carcinoma. Cancer Cell. 39:632–648.e8.
2021. View Article : Google Scholar : PubMed/NCBI
|
|
46
|
Verhoeven Y, Tilborghs S, Jacobs J, De
Waele J, Quatannens D, Deben C, Prenen H, Pauwels P, Trinh XB,
Wouters A, et al: The potential and controversy of targeting STAT
family members in cancer. Semin Cancer Biol. 60:41–56. 2020.
View Article : Google Scholar : PubMed/NCBI
|
|
47
|
Zhu H, Wang Z, Xu Q, Zhang Y, Zhai Y, Bai
J, Liu M, Hui Z and Xu N: Inhibition of STAT1 sensitizes renal cell
carcinoma cells to radiotherapy and chemotherapy. Cancer Biol Ther.
13:401–407. 2012. View Article : Google Scholar : PubMed/NCBI
|
|
48
|
Kornepati AVR, Vadlamudi RK and Curiel TJ:
Publisher correction: Programmed death ligand 1 signals in cancer
cells. Nat Rev Cancer. 22:1902022. View Article : Google Scholar : PubMed/NCBI
|
|
49
|
Yi M, Niu M, Xu L, Luo S and Wu K:
Regulation of PD-L1 expression in the tumor microenvironment. J
Hematol Oncol. 14:102021. View Article : Google Scholar : PubMed/NCBI
|
|
50
|
Zhang H, Zhu C, He Z, Chen S, Li L and Sun
C: LncRNA PSMB8-AS1 contributes to pancreatic cancer progression
via modulating miR-382-3p/STAT1/PD-L1 axis. J Exp Clin Cancer Res.
39:1792020. View Article : Google Scholar : PubMed/NCBI
|
|
51
|
Miao Q, Ge M and Huang L: Up-regulation of
GBP2 is associated with neuronal apoptosis in rat brain cortex
following traumatic brain injury. Neurochem Res. 42:1515–1523.
2017. View Article : Google Scholar : PubMed/NCBI
|