Introduction
Colorectal cancer (CRC) is the third most prevalent
and deadly malignant disease worldwide (1). Despite improvements in diagnosis and
treatment in recent years, the average survival time of patients
with advanced CRC remains poor, with distant invasion and
metastasis accounting for 90% of CRC-related deaths (2).
Forkhead box (FOX) proteins, which regulate a wide
variety of cellular pathways during cancer development, including
the TGF-β cascade, Wnt pathway, Sonic-Hedgehog pathway and MAPK
pathway, are a superfamily of evolutionarily conserved
transcription factors (3).
Accumulating evidence has indicated that FOX proteins may act as
critical nodes in cellular networks, allowing cross-talk among
biological pathways (4,5). FOXD1 is a member of the FOX family
(6). In our previous study, the
expression levels of FOXD1 were examined using immunohistochemical
staining, and the association between FOXD1 expression and
clinicopathologic features was assessed. Notably, FOXD1 expression
was revealed to be an independent prognostic factor in patients
with CRC (7). It has also been
demonstrated that FOXD1 serves a key role in the development,
progression and metastasis of numerous malignancies (8). For example, high FOXD1 expression has
been reported to be associated with poor survival in non-small cell
lung cancer (9). Furthermore, FOXD1
promotes breast cancer growth and resistance to chemotherapeutic
agents (10). By contrast,
knockdown of FOXD1 has been shown to attenuate CRC cell
proliferation, migration and invasion (11). Reports on the relationship between
FOXD1 and tumors has resulted in FOXD1 now being recognized as a
potential target for anticancer therapy. However, the mechanisms
underlying the effects of FOXD1 on promoting cell stemness and
chemotherapy resistance remain to be investigated.
Cancer stem cells (CSCs) are a characteristic class
of cells that are capable of self-renewal in tumors with
anti-apoptosis, asymmetric cell division and high metastatic
capacity (12), and genetic
heterogeneity, which has been reported to be associated with poor
prognosis of cancer (13). Given
these characteristics, research on cancer cell stemness has great
clinical relevance: CSCs show more resistance to conventional
chemotherapeutic agents used for anticancer treatment (14), and CSCs undergo
epithelial-mesenchymal transition (EMT), which is responsible for
tumor recurrence and metastasis (15). Particularly from a clinical point of
view, the study of the molecular regulatory mechanisms of CSCs is
crucial for the development of effective treatments to improve
patient prognosis. Therefore, these aforementioned findings on CSCs
may provide a novel direction in the study of CRC.
The aim of the present study was to further validate
the effect of FOXD1 on the proliferation and migration of CRC
cells, and to delve into the possible potential of FOXD1 in the
clinical treatment of CRC.
Materials and methods
Access to public databases
The data analyzed in the present study are publicly
available in The Cancer Genome Atlas (TCGA; http://cancergenome.nih.gov/). Pan-cancer analysis was
performed to assess the differences in FOXD1 expression between
tumor tissue and paired normal tissue from 33 types of cancer in
TCGA database. Data from 111,60 patients were examined using Gene
Expression Profiling Interactive Analysis (http://gepia.cancer-pku.cn/). A total of 537 CRC tumor
tissue samples downloaded from TCGA were divided into high and low
FOXD1 expression groups (247 patients/group) based on the median
geometric mean expression value.
Specimens and
immunohistochemistry
CRC tumor tissues and paired normal tissues (>5
cm distance from the margin of the resection) were collected during
surgery and used to generate a CRC tissue microarray (TMA). The TMA
was generated by Shanghai Outdo Biotech Co., Ltd. Continuous
sections (4 µm) were cut from the paraffin-embedded TMA. A total of
131 post-surgical patients with CRC who underwent surgery between
2009 and 2012 at the Shanghai Ruijin Hospital (Shanghai, China)
were enrolled in this retrospective study. The patients were aged
35–80 years (average age, 60.8±2.7 years) and there was a
male/female sex ratio of 0.926. Patients who received preoperative
treatment, such as radiotherapy or chemotherapy, were excluded from
the study. Human tissue collection and experiments using human
tissue were approved by the Institutional Review Board of Ruijin
Hospital Ethics Committee (institutional approval no. 2018-07-015;
Shanghai Jiao Tong University School of Medicine). The tissue was
fixed at room temperature in 10% formaldehyde for 30–60 min. The
tissue was then sequentially dehydrated in ethanol solutions and
washed with xylene, before being embedded in paraffin (4 µm). The
sections were permeabilized with 0.2% Triton X-100 and blocked with
3% bovine serum albumin (BSA; Gibco; Thermo Fisher Scientific,
inc.) for 30–60 min at room temperature. Subsequently, the slides
were incubated with a primary antibody against FOXD1 (1:200; cat.
no. A20240; ABclonal Biotech Co., Ltd.) at 4°C overnight, followed
by a 30–60 min incubation with a HRP Goat Anti-Rabbit IgG (H+L)
secondary antibody (1:200; cat. no. ab205718; Abcam) at room
temperature. Tissues were counterstained with hematoxylin for 5–10
min at room temperature and were observed under a light
microscope.
Immunohistochemical score
Two independent pathologists scored the intensity of
immunohistochemical staining of FOXD1 in tumor tissues according to
a semi-quantitative immunoreactivity scoring system. The percentage
of immunoreactive cells was scored as follows: 0, 0%; 1, 1–10%; 2,
11–50%; 3, 51–80%; and 4, >80%. The staining intensity was
scored as follows: 0, No staining; 1, weak staining; 2, moderate
staining; 3, intense staining. These values were multiplied
together to provide a single score ranging between 0 and 12 for
each case.
Cell culture and reagents
A total of seven different CRC cell lines were used
in the present study: SW620, HT29, SW480, HCT116, LOVO, DLD1 and
RKO. All human CRC cell lines were purchased from the American Type
Culture Collection and stored at the Shanghai Institute of
Gastrointestinal Surgery. All CRC cell lines were cultured in
RPMI-1640 medium (Dalian Meilun Biology Technology Co., Ltd.)
supplemented with 10% newborn calf serum (NBS; Gibco; Thermo Fisher
Scientific, Inc.). The cells were cultured at 37°C in a 5%
CO2 environment.
The following primary antibodies were used: Rabbit
anti-FOXD1 (cat. no. A20240; ABclonal Biotech Co., Ltd.), rabbit
anti- histone H3 antibody (cat. no. A2348; ABclonal Biotech Co.,
Ltd.), rabbit anti-E-cadherin (cat. no. 3195T; Cell Signaling
Technology, Inc.), rabbit anti-N-cadherin (cat. no. 13116T; Cell
Signaling Technology, Inc.), rabbit anti-vimentin (cat. no.
ab92547; Abcam), rabbit anti-β-catenin (cat. no. ab32572; Abcam),
rabbit anti-leucine rich repeat containing G protein-coupled
receptor 5 (LGR5) (cat. no. ab75850; Abcam), rabbit anti-Oct4 (cat.
no. ab19857; Abcam), rabbit anti-Sox2 (cat. no. ab92494; Abcam),
rabbit anti-Nanog (cat. no. ab109250; Abcam) and mouse anti-GAPDH
(cat. no. ab8245; Abcam).
XAV-939 (MedChemExpress) is a potent and
cell-permeable small molecule inhibitor that selectively inhibits
tankyrase activity and thereby suppresses Wnt/β-catenin signaling
pathway-mediated transcription. CRC cells were treated with 2
nmol/l XAV-939 at 37°C for 24 h.
Generation of stable
gene-overexpressing and knockdown cells
Generation of stable gene-overexpressing and
knockdown cells was performed using standard methods (16). The EF1a-GFP/Puro-FOXD1 lentiviral
plasmid (lentiviral vector, LV5; Shanghai GenePharma Co., Ltd.) and
short hairpin (sh)RNA pGLV-h1-GFP/Puro-shFOXD1 lentiviral plasmid
(lentiviral vector, LV3; Shanghai GenePharma Co., Ltd.) were used
to generated gene-overexpressing and knockdown cells. The 2nd
generation system was used. Briefly, 293T cells (American Type
Culture Collection; stored at the Shanghai Institute of
Gastrointestinal Surgery) were transfected with 10 µg lentiviral
plasmid in a 10-cm dish; the ratio used for the lentivirus,
packaging and envelope plasmids was 4:3:1. Cells were transfected
for 48 h at 37°C using Lipofectamine® 2000 transfection
reagent (cat. no. 11668030; Invitrogen; Thermo Fisher Scientific,
Inc.). Polyethylene glycol was used to collect the lentiviral
particles and a multiplicity of infection of 5 was used to infect
the CRC cells for 72 h at 37°C, and there was a 72-h interval
between transduction and subsequent experimentation. Puromycin was
used for selection (8 µg/ml) and for maintenance (5 µg/ml) of
transduced cells. The targeting sequence of shRNA-FOXDA (shFOXD1)
was 5′-TGTCCAGTGTCGAGAACTTTA-3′. Briefly, 3×10⁵ cells
were seeded into each well of a six-well plate 1 day before
transfection. When the cells reached 70% confluence, the culture
medium was replaced with fresh normal medium. In each well, 50 µl
primary lentivirus solution was diluted in 400 µl normal medium and
polybrene was added at a final concentration of 5 µg/ml.
Subsequently, the mixture was added to each well. After 24 h, the
medium in each well was replaced. A total of 48 h after
transfection, puromycin was used to screen stable cell clones, and
72 h after transfection, the overexpression and interfering effect
of these vectors/shRNAs were evaluated by western blotting. Empty
vectors were used as a control for sh-FOXD1-induced knockdown and
FOXD1 overexpression.
Western blotting
Western blot analysis was performed using standard
methods (16). Proteins were
extracted from tissues and cells using RIPA Lysis Buffer
(MedChemExpress). Briefly, 50 µg protein/lane was separated by
SDS-PAGE on 12.5% gels and transferred to polyvinylidene fluoride
membranes. The membranes were blocked with 5% BSA for 2 h at room
temperature and then incubated with primary antibodies (1:2,000) at
4°C overnight. Subsequently, the membranes were incubated with the
corresponding secondary antibody Goat Anti-Rabbit IgG H&L (HRP)
(1:10,000; ab6721; Abcam) at room temperature for 1 h and the
protein bands were visualized using an enhanced chemiluminescence
detection system (Amersham; Cytiva). ImageJ (version 1.8.0;
National Institutes of Health) was used for
semi-quantification.
NE-PER Nuclear Extraction Reagent (Thermo Fisher
Scientific, Inc.) was used to isolate and extract nuclear proteins,
respectively. Specific detailed steps were performed as described
previously (17).
Wound-healing and Transwell
assays
CRC cells (1×10⁵/well) were cultured in
6-well plates. After 16 h, the culture medium was replaced with
low-serum fresh medium (2%). After cells had reached 90%
confluence, the cells in each well were scratched using a 200-µl
pipette tip to create consistent wounds. Specific detailed steps
were performed as described previously (18). Images of the scratch areas were
captured under an inverted light microscope at 0 and 24 h at 37°C.
The assays were repeated three times. Wound width was calculated as
the average distance between the edges of the scratch. Relative
migration distance=final wound width/initial wound width ×100.
Migration was examined using Boyden chamber plates
(pore size, 8 µm). Cells (1×10⁵) were resuspended in
medium without NBS (200 µl) and were added to the upper chamber,
with medium containing 20% NBS added to the lower chamber. After 24
h at 37°C, the cells were fixed with 4% paraformaldehyde for 20 min
at room temperature and stained with 0.1% crystal violet staining
solution for 5 min at room temperature, and six randomly selected
areas were examined under a light microscope. The cell numbers were
counted and statistically analyzed.
Tumor sphere formation
The cells were detached from culture flasks with
0.25% trypsin and suspended in sphere formation medium (50 ml
DMEM/F12 containing 100 mg/ml EGF, 100 mg/ml bFGF and 1 ml
B-27® Supplement; Gibco; Thermo Fisher Scientific,
Inc.). The cells were then filtered into a single-cell suspension
and seeded. Cells (200 cells/well) were seeded in ultra-low
adherence 96-well plates (Corning, Inc.) and were cultured in
NBS-free medium for 14 days and the spheroids were observed under a
light microscope.
Cell Counting Kit-8 (CCK-8) and colony
formation assays
Cell viability was examined using a CCK-8 assay
(Sevenbio). Cells were seeded in 96-well plates at a density of
4×10³ cells/well in 200 µl medium for 1–5 days at 37°C.
The absorbance was detected at 450 nm after the cells were treated
with 10% CCK-8 at 37°C for 2 h. Cell proliferation was calculated
as a ratio of optical density values of drug-treated samples to
those of controls.
Colony formation was examined to determine
transformation and anchorage-independent growth (19). The cells were detached from culture
flasks with 0.25% trypsin and suspended in sphere formation medium.
The cells were then filtered into a single-cell suspension and
seeded. Cells (1,000 cells/well) were then seeded in 6-well plates
(Corning, Inc.), cultured for 14 days at 37°C, and colonies (>50
cells and >0.3 mm in diameter) were counted and images were
captured.
Immunofluorescence (IF) staining
Cells (1×10⁴/well) were cultured on
coverslips in 24-well plates for 24 h at 37°C, fixed with 4%
formaldehyde at room temperature, blocked with 5% BSA at room
temperature and permeabilized with 0.5% Triton X-100 at room
temperature. Cells that adhered to coverslips were then incubated
with rabbit anti-E-cadherin (1:1,000; cat. no. 3195T; Cell
Signaling Technology, Inc.), rabbit anti-N-cadherin (1:500; cat.
no. 13166T; Cell Signaling Technology, Inc.), rabbit anti-vimentin
(1:200; cat. no. ab92547; Abcam) and rabbit anti-β-catenin (1:200;
cat. no. ab32572; Abcam) primary antibodies for 4–6 h at room
temperature, followed by incubation with an
allophycocyanin-conjugated anti-rabbit secondary antibody (1:2,000;
cat. no. F0111; Bio-Techne Corporation) for 1 h in the dark at room
temperature. After incubation with DAPI (Biosharp Life Sciences)
for 5 min, the cells were observed under a fluorescence microscope
within 4 h.
Co-immunoprecipitation (Co-IP)
After transfection, cells were collected and lysed
using lysis buffer (Gibco; Thermo Fisher Scientific, Inc.). After
centrifugation of 10 µl precleared cell lysate at 300 × g for 15
min at 4°C, the protein concentration in the supernatant was
determined using a bicinchoninic acid assay. A total of 30 µg
protein A or protein G agarose/sepharose (MilliporeSigma), and 5 µg
anti-flag antibody (cat. no. F7425; MilliporeSigma) were added to
the 1 ml supernatants (protein concentration, 2 µg/µl) at 4°C,
which were subsequently incubated with a control immunoglobulin-G
(IgG) (1:200; AC005; ABclonal Biotech Co., Ltd.) or anti-FOXD1
antibodies (1:200; A20240; ABclonal Biotech Co., Ltd.) in the
presence of protein A or G agarose/sepharose beads overnight at 4°C
with gentle shaking. Following incubation, agarose/sepharose beads
were collected and washed five times with lysis buffer.
Subsequently, the complex was eluted at 100°C for 4 min. The eluate
was collected and subjected to SDS-PAGE and western blot
analysis.
Chemotherapy sensitivity assay
Oxaliplatin is one of the most widely used
chemotherapeutic agents for the treatment of CRC (20), thus the present study evaluated the
sensitivity of the FOXD1-overexpressing SW620 cells,
sh-FOXD1-transfected HT29 cells and control cells to this drug. The
sensitivity of cells to oxaliplatin was examined using a CCK-8
assay (Dojindo Laboratories, Inc.). Briefly, several concentrations
of oxaliplatin (cat. no. T0164; Shandong TopScience Biotech Co.,
Ltd.) (0.25, 0.5, 1, 2, 4, 8, 16, 32 and 500 µM) in RPMI-1640
medium were used, and the cells (3×10³/well) were seeded
in 96-well plates before being incubated with the drug for 36 h at
37°C. The inhibition rate (%) was calculated as follows:
(Absorbance control- Absorbance experiment)/Absorbance control
×100.
To evaluate the resistance of SW620 cells
overexpressing FOXD1, sh-FOXD1-transfected HT29 cells and control
cells, a colony formation assay was performed. Briefly, cells
(1,000 cells/well) were seeded in 6-well plates (Corning, Inc.),
cultured for 14 days at 37°C and colonies were counted (>50
cells, >0.3 mm in diameter). The number of colonies in normal
RPMI-1640 medium was compared with the number of colonies in
RPMI-1640 medium containing 4 µM oxaliplatin. The resistance to
oxaliplatin was determined by comparing the reduction in colony
number(%)=(1-number of colonies after oxaliplatin treatment/number
of colonies control) ×100.
Apoptosis assay
Cell apoptosis analyses were performed using the
Annexin V-fluorescein isothiocyanate (FITC)-propidium iodide (PI)
apoptosis detection kit (MilliporeSigma) according to the
manufacturer's instructions. Transiently transfected cells were
washed with PBS and trypsinized for 3–4 min. Cells were collected
by centrifugation at 300 × g for 5 min at 4°C and washed twice with
ice-cold 1X PBS. On ice, cell pellets were resuspended in 100 µl 1X
Annexin binding buffer, followed by staining with Annexin V-FITC
and PI for 15 min in the dark at 4°C. Cells were collected by
centrifugation at 300 × g for 5 min at 4°C, resuspended in 500 µl
1X Annexin binding buffer, and analyzed immediately by flow
cytometry. A total of 10,000 cells from each event were scanned
using a FACSCalibur flow cytometer (BD Biosciences) using the
standard configuration and parameters. Data from quadrants
demarcating unstained cells, PI-positive cells, Annexin
V-FITC-positive cells, and PI- and Annexin V-FITC-positive cells
were collected and analyzed using CellQuest 3.0 software (BD
Biosciences).
Tumor xenograft and metastasis in
vivo
Male Balb/c nude mice (age, 6 weeks; weight, 20–25
g; n=60 mice, 5 mice/cage) were supplied by Phenotek Biotechnology
(Shanghai) Co., Ltd. Mice were subcutaneously injected with
SW620NC, SW620OE, HT29NC and HT29sh cells (1×10⁶
cells/mouse; n=5 mice/group) to generate the SW620NC, SW620OE,
HT29NC and HT29sh groups. Mice were sacrificed after 2 weeks and
the subcutaneous tumors were harvested, and then measured and
weighed. The maximum tumor diameter permitted was 15 mm. The mice
were anesthetized with chloral hydrate (4%, 400 mg/kg mouse body
weight) and sacrificed by cervical dislocation, and then their
tumor tissues were collected. Subsequently, immunohistochemistry,
and hematoxylin and eosin (H&E) staining of tumor tissue
sections were performed.
The lung metastasis models were induced by tail vein
injection (1×10⁶ cells/mouse; n=5 mice/group). The liver
metastasis models were induced by spleen injection
(1×10⁶ cells/mouse; n=5 mice/group). The lung and liver
metastasis model mice were split into the following groups,
depending on the cells injected: SW620NC, SW620OE, HT29NC and
HT29sh groups. The mice were anesthetized with chloral hydrate (4%,
400 mg/kg mouse body weight) and sacrificed by cervical
dislocation, and then their lung and liver tissues were collected
after 4–6 weeks. Subsequently, H&E staining of lung and liver
tissue sections was performed.
H&E staining
Specimens were fixed in 4% paraformaldehyde for 2–3
days at room temperature, embedded in paraffin, serially sectioned
(4 µm) and stained with H&E for 5 min at room temperature.
Sections were observed under a light microscope.
Tumor stemness and oxaliplatin
resistance in vivo
Male Balb/c nude mice (age, 6 weeks; weight, 20–25
g; n=36 mice, 3 mice/cage) were supplied by Phenotek Biotechnology
(Shanghai) Co., Ltd. Xenograft models were induced by
subcutaneously injecting the nude mice with SW620NC, SW620OE,
HT29NC and HT29sh cells (n=3 mice/group) to generate the SW620NC,
SW620OE, HT29NC and HT29sh groups. The limiting dilution test
refers to the subcutaneous injection of cells in different
concentration gradients to construct a subcutaneous xenogeneic
tumor model and can be used to test the stemness of the cells.
Subgroups consisting of three different concentrations
(1×10⁶, 1×10⁵ or 1×10⁴
cells/mouse) of four different cell lines (SW620NC, SW620OE, HT29NC
and HT29sh) were injected subcutaneously into mice and xenografts
were measured every 2–3 days.
Male Balb/c nude mice (age, 6 weeks; weight, 20–25
g; n=24 mice, 5 mice/cage) were supplied by Phenotek Biotechnology
(Shanghai) Co., Ltd. Mice were subcutaneously injected with
SW620NC, SW620OE, HT29NC and HT29sh cells (1×10⁶
cells/mouse; n=3 mice/group) to generate the SW620NC, SW620OE,
HT29NC and HT29sh groups. Treatment started on day 7 after
injection of stably transfected cells. Murine isotype control (PBS)
or oxaliplatin (5 mg/kg) were administered intraperitoneally every
second day. After completing three drug injections, the mice were
sacrificed, and the subcutaneous tumors were harvested and
measured. Reduction in tumor volume (%) was calculated as follows:
Volume of tumor after oxaliplatin treatment/volume of tumor control
×100.
Laboratory animals
The strain of nude mice used was Balb/c and the
total number of mice used was 120. The animal study protocol was
approved by the Institutional Review Board of Ruijin Hospital
Ethics Committee (institutional approval no. 2019-01-047; Shanghai
Jiao Tong University School of Medicine). The temperature of the
mice rearing room was 20–26°C and the relative humidity of the
rearing room was 50–60%. The light intensity of the rearing room
was 15–20 lx and the mice were maintained under a 12-h light/dark
cycle. The drinking water and food were sterilized and were freely
available. The humane endpoints for the animal study included, but
were not limited to: A tumor burden >10% body weight, tumors
that ulcerate, become necrotic or infected; tumors that interfere
with eating or impair ambulation. In addition, tumors were not
allowed to exceed 15 mm in any one dimension.
Statistical analysis
All experiments were performed independently at
least three times. Statistical analyses were performed using SPSS
statistical software (version 26; IBM Corp.) and GraphPad Prism
software (version 9; Dotmatics). The Shapiro-Wilk test was used to
analyze whether quantitative variables followed a normal
distribution. Normally distributed data are presented as the mean ±
standard deviation, whereas non-normally distributed data are
presented as the median and interquartile range. The difference
between groups of normally distributed data was assessed by
independent samples t-test or paired t-test, when tumor tissues and
paired normal samples from the same patient were assessed, whereas
the difference between two groups of non-normally distributed data
was assessed by the Mann-Whitney U test. For long-term outcomes,
Kaplan-Meier curves were plotted, and patients with high and low
FOXD1 expression were compared using the log-rank test. P<0.05
was considered to indicate a statistically significant
difference.
Results
FOXD1 expression is markedly higher in
tumor tissues than in normal tissues, and high FOXD1 expression is
associated with poor prognosis
Pan-cancer analysis was performed to assess
differences in FOXD1 expression between tumor tissue and paired
normal tissue in 33 types of cancer. Data from 11,160 patients were
obtained from TCGA database and were examined using Gene Expression
Profiling Interactive Analysis. The results indicated that FOXD1
was notably upregulated in tumor tissues compared with in paired
normal tissues (Fig. 1A)
Furthermore, a total of 537 tumor tissue samples downloaded from
TCGA were divided into high and low FOXD1 expression groups (247
patients/group) based on the median geometric mean expression
value. Kaplan-Meier analysis indicated that high FOXD1 expression
was associated with poor prognosis in patients with CRC (Fig. 1B). To further verify FOXD1
expression in tumor tissues, tumor tissues and matched normal
tissues from 131 patients with CRC in a TMA were analyzed using
immunochemistry. The FOXD1 expression in the tumor tissues was
markedly higher than that in adjacent normal tissues (Fig. 1C and D). Positive expression of
FOXD1 was observed in 96 (73.3%) tumor tissues, whereas positive
expression was observed in only 35 (26.7%) matched normal
colorectal tissues (Fig. 1D). FOXD1
protein expression in cancerous and matched noncancerous tissues
was confirmed by western blot analysis (Fig. 1E and F). Subsequently, the
expression levels of FOXD1 in CRC cell lines were screened, and it
was revealed that SW620 cells exhibited lower levels than the other
cell lines, whereas the levels in HT29 cells were higher than those
in the other cell lines (Fig.
1G).
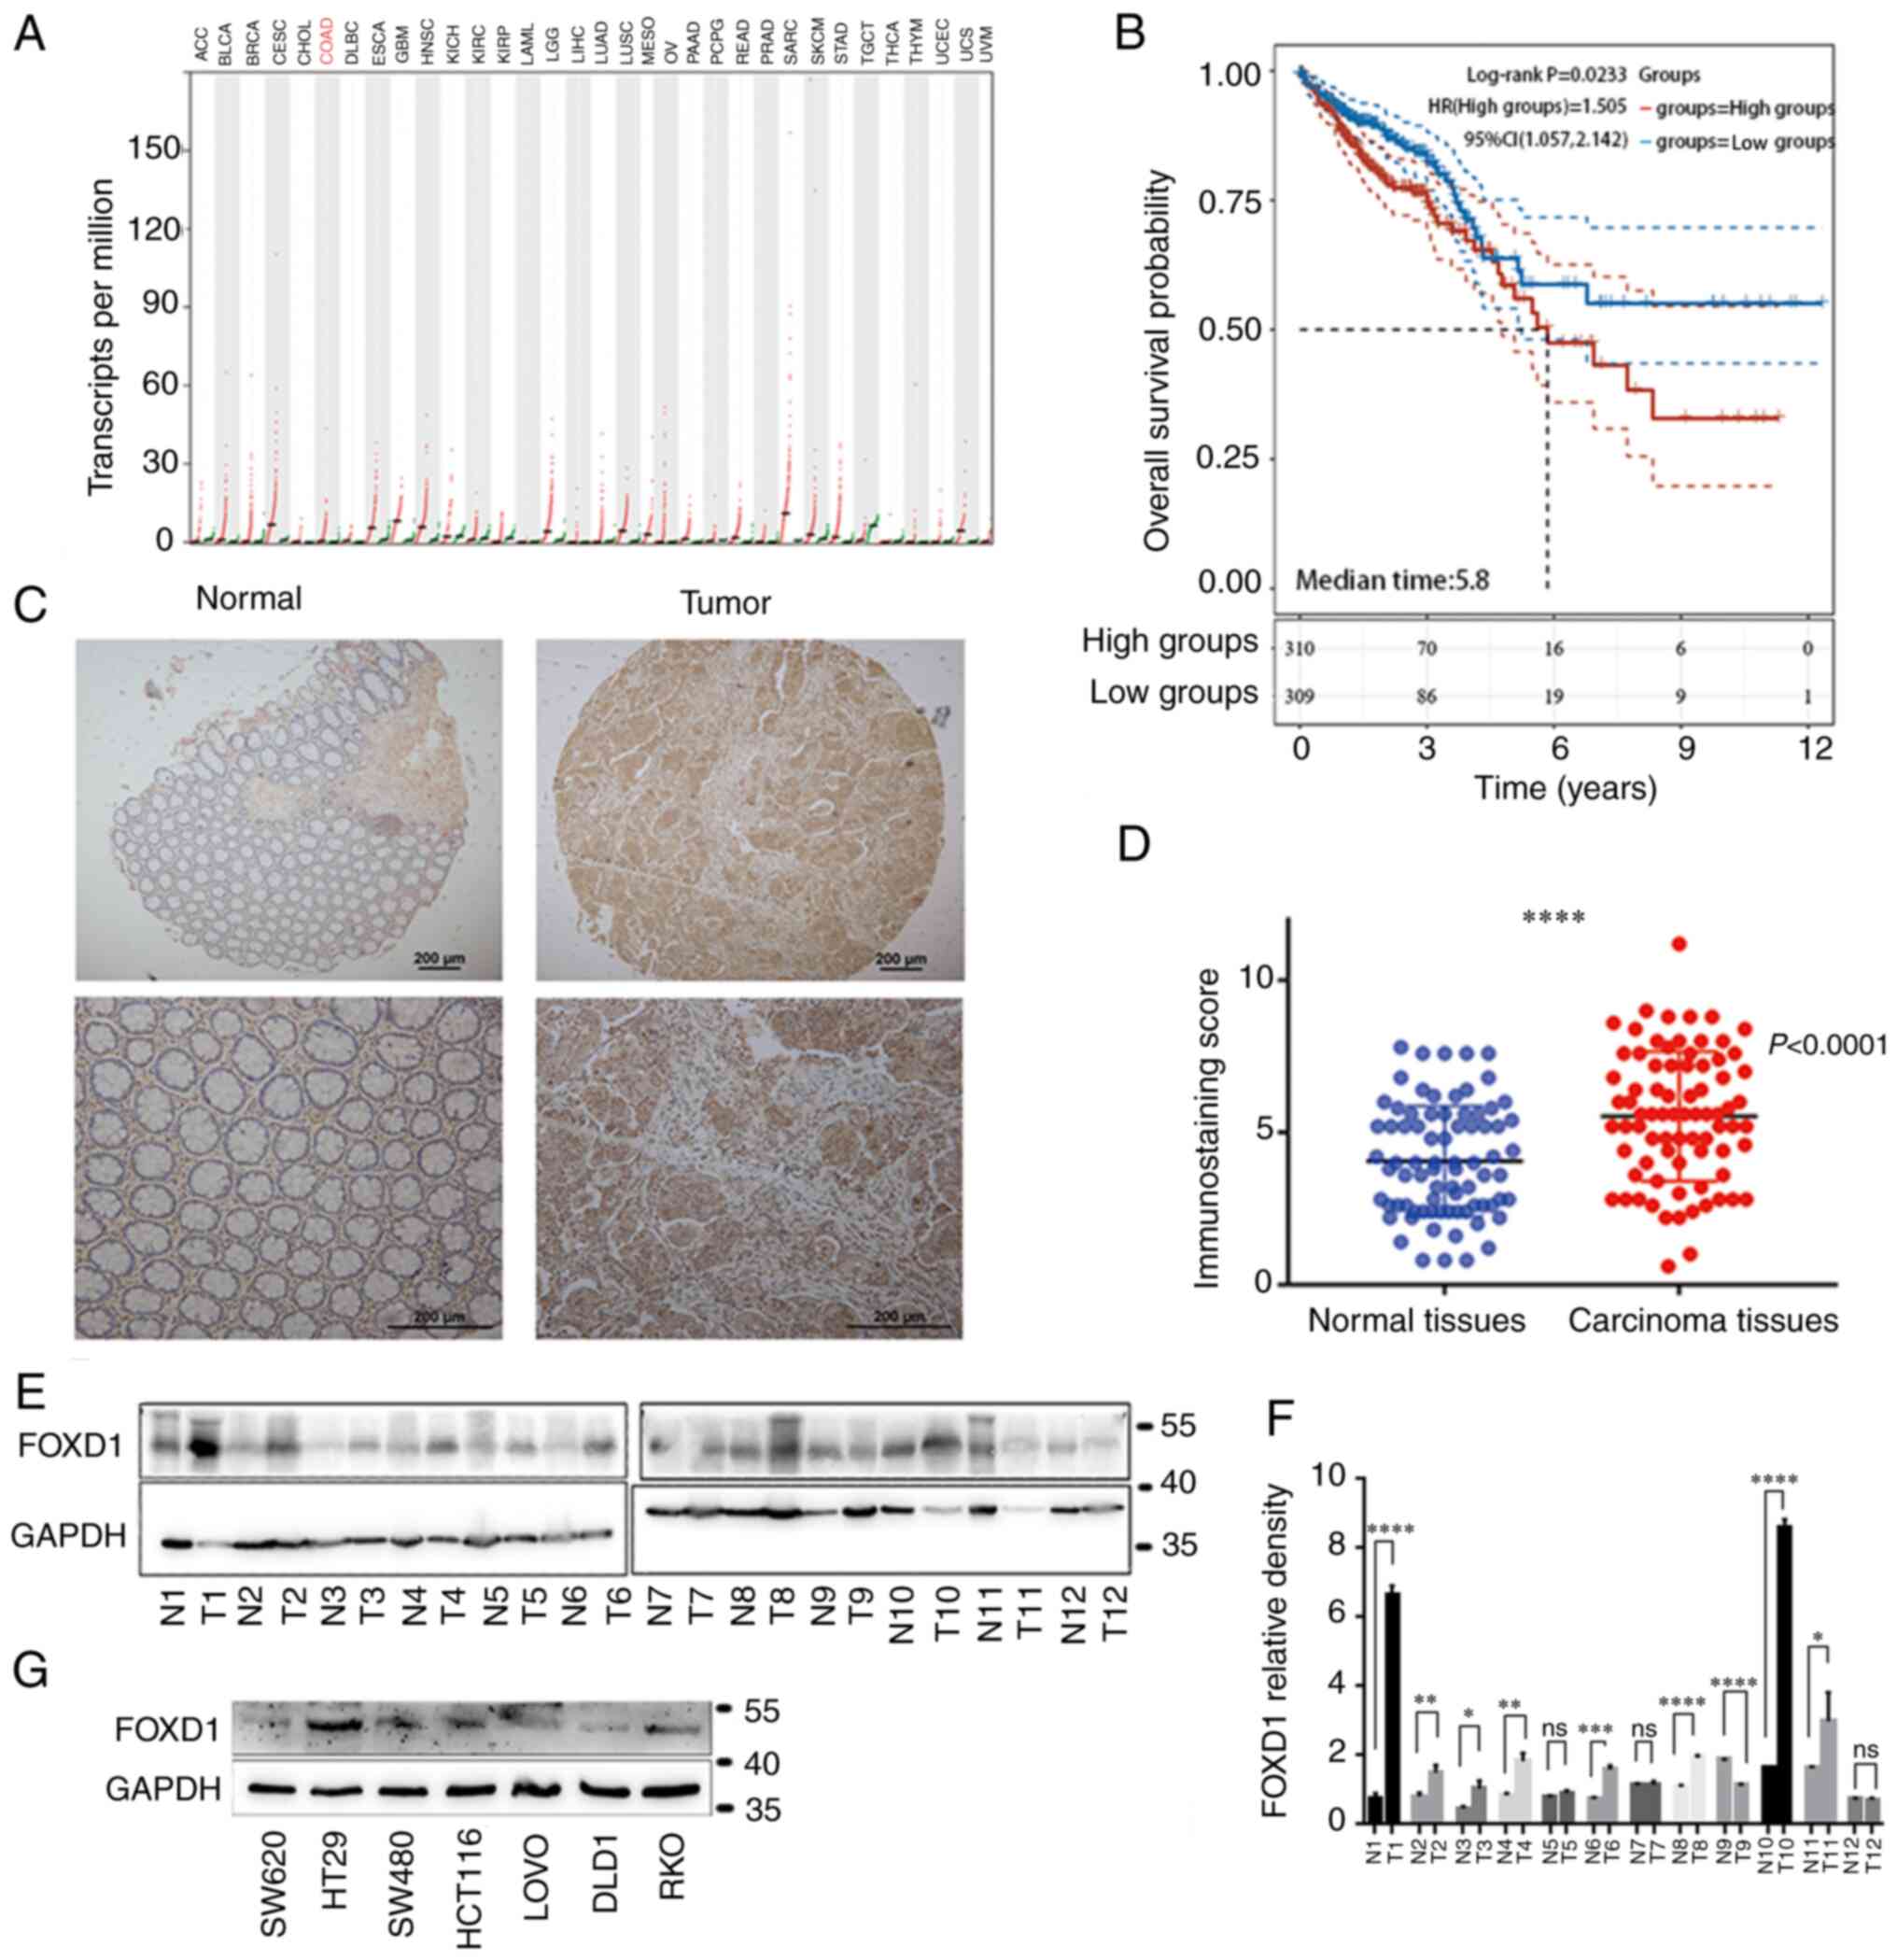 | Figure 1.(A) Differentially expressed FOXD1
between tumor and normal tissues. The gene expression profile
across all tumor samples and paired normal tissues is shown. Each
dot represents expression in a sample. Red bar plot indicates tumor
tissue, green bar plot indicates paired normal tissues. (B)
Comparison of overall survival in FOXD1 high and low groups. (C)
Immunohistochemical results showing high expression of FOXD1 in CRC
tissues. (D) Difference in FOXD1 expression between tumor and
peritumoral normal tissues is statistically significant
(***P<0.001). (E) Representative western blot and (F)
semi-quantification analysis of FOXD1 expression in 12 paired CRC
samples. (G) FOXD1 expression in seven different colorectal cancer
cell lines, SW620, HT29, SW480, HCT116, LOVO, DLD1 and RKO. FOXD1,
forkhead box D1. *P<0.05, **P<0.01, ****P<0.0001. ns, not
significant. |
FOXD1 promotes CRC cell proliferation,
migration and invasion
Specific lentiviral vectors expressing green
fluorescent protein were transduced into SW620 and HT29 cells.
Western blotting verified that FOXD1 protein expression was
increased in the SW620OE group relative to the SW620NC group, and
that FOXD1 protein expression was decreased in the HT29sh group
relative to the HT29NC group. (Fig.
2A). The effect of FOXD1 on CRC cell proliferation was examined
using the CCK-8 (Fig. 2B) and
colony formation (Fig. 2C and D)
assays; the results indicated that FOXD1 had a promoting effect on
CRC cell proliferation. Transwell assays confirmed the more
aggressive migratory potential of FOXD1-overexpressing SW620 cells,
whereas sh-FOXD1 inhibited the migration and invasion of HT29 cells
(Fig. 2E and F). Consistent with
the aforementioned results, wound-healing assays demonstrated that
FOXD1 depletion significantly inhibited scratch wound healing,
whereas FOXD1 overexpression enhanced CRC cell migration (Fig. 2G and H).
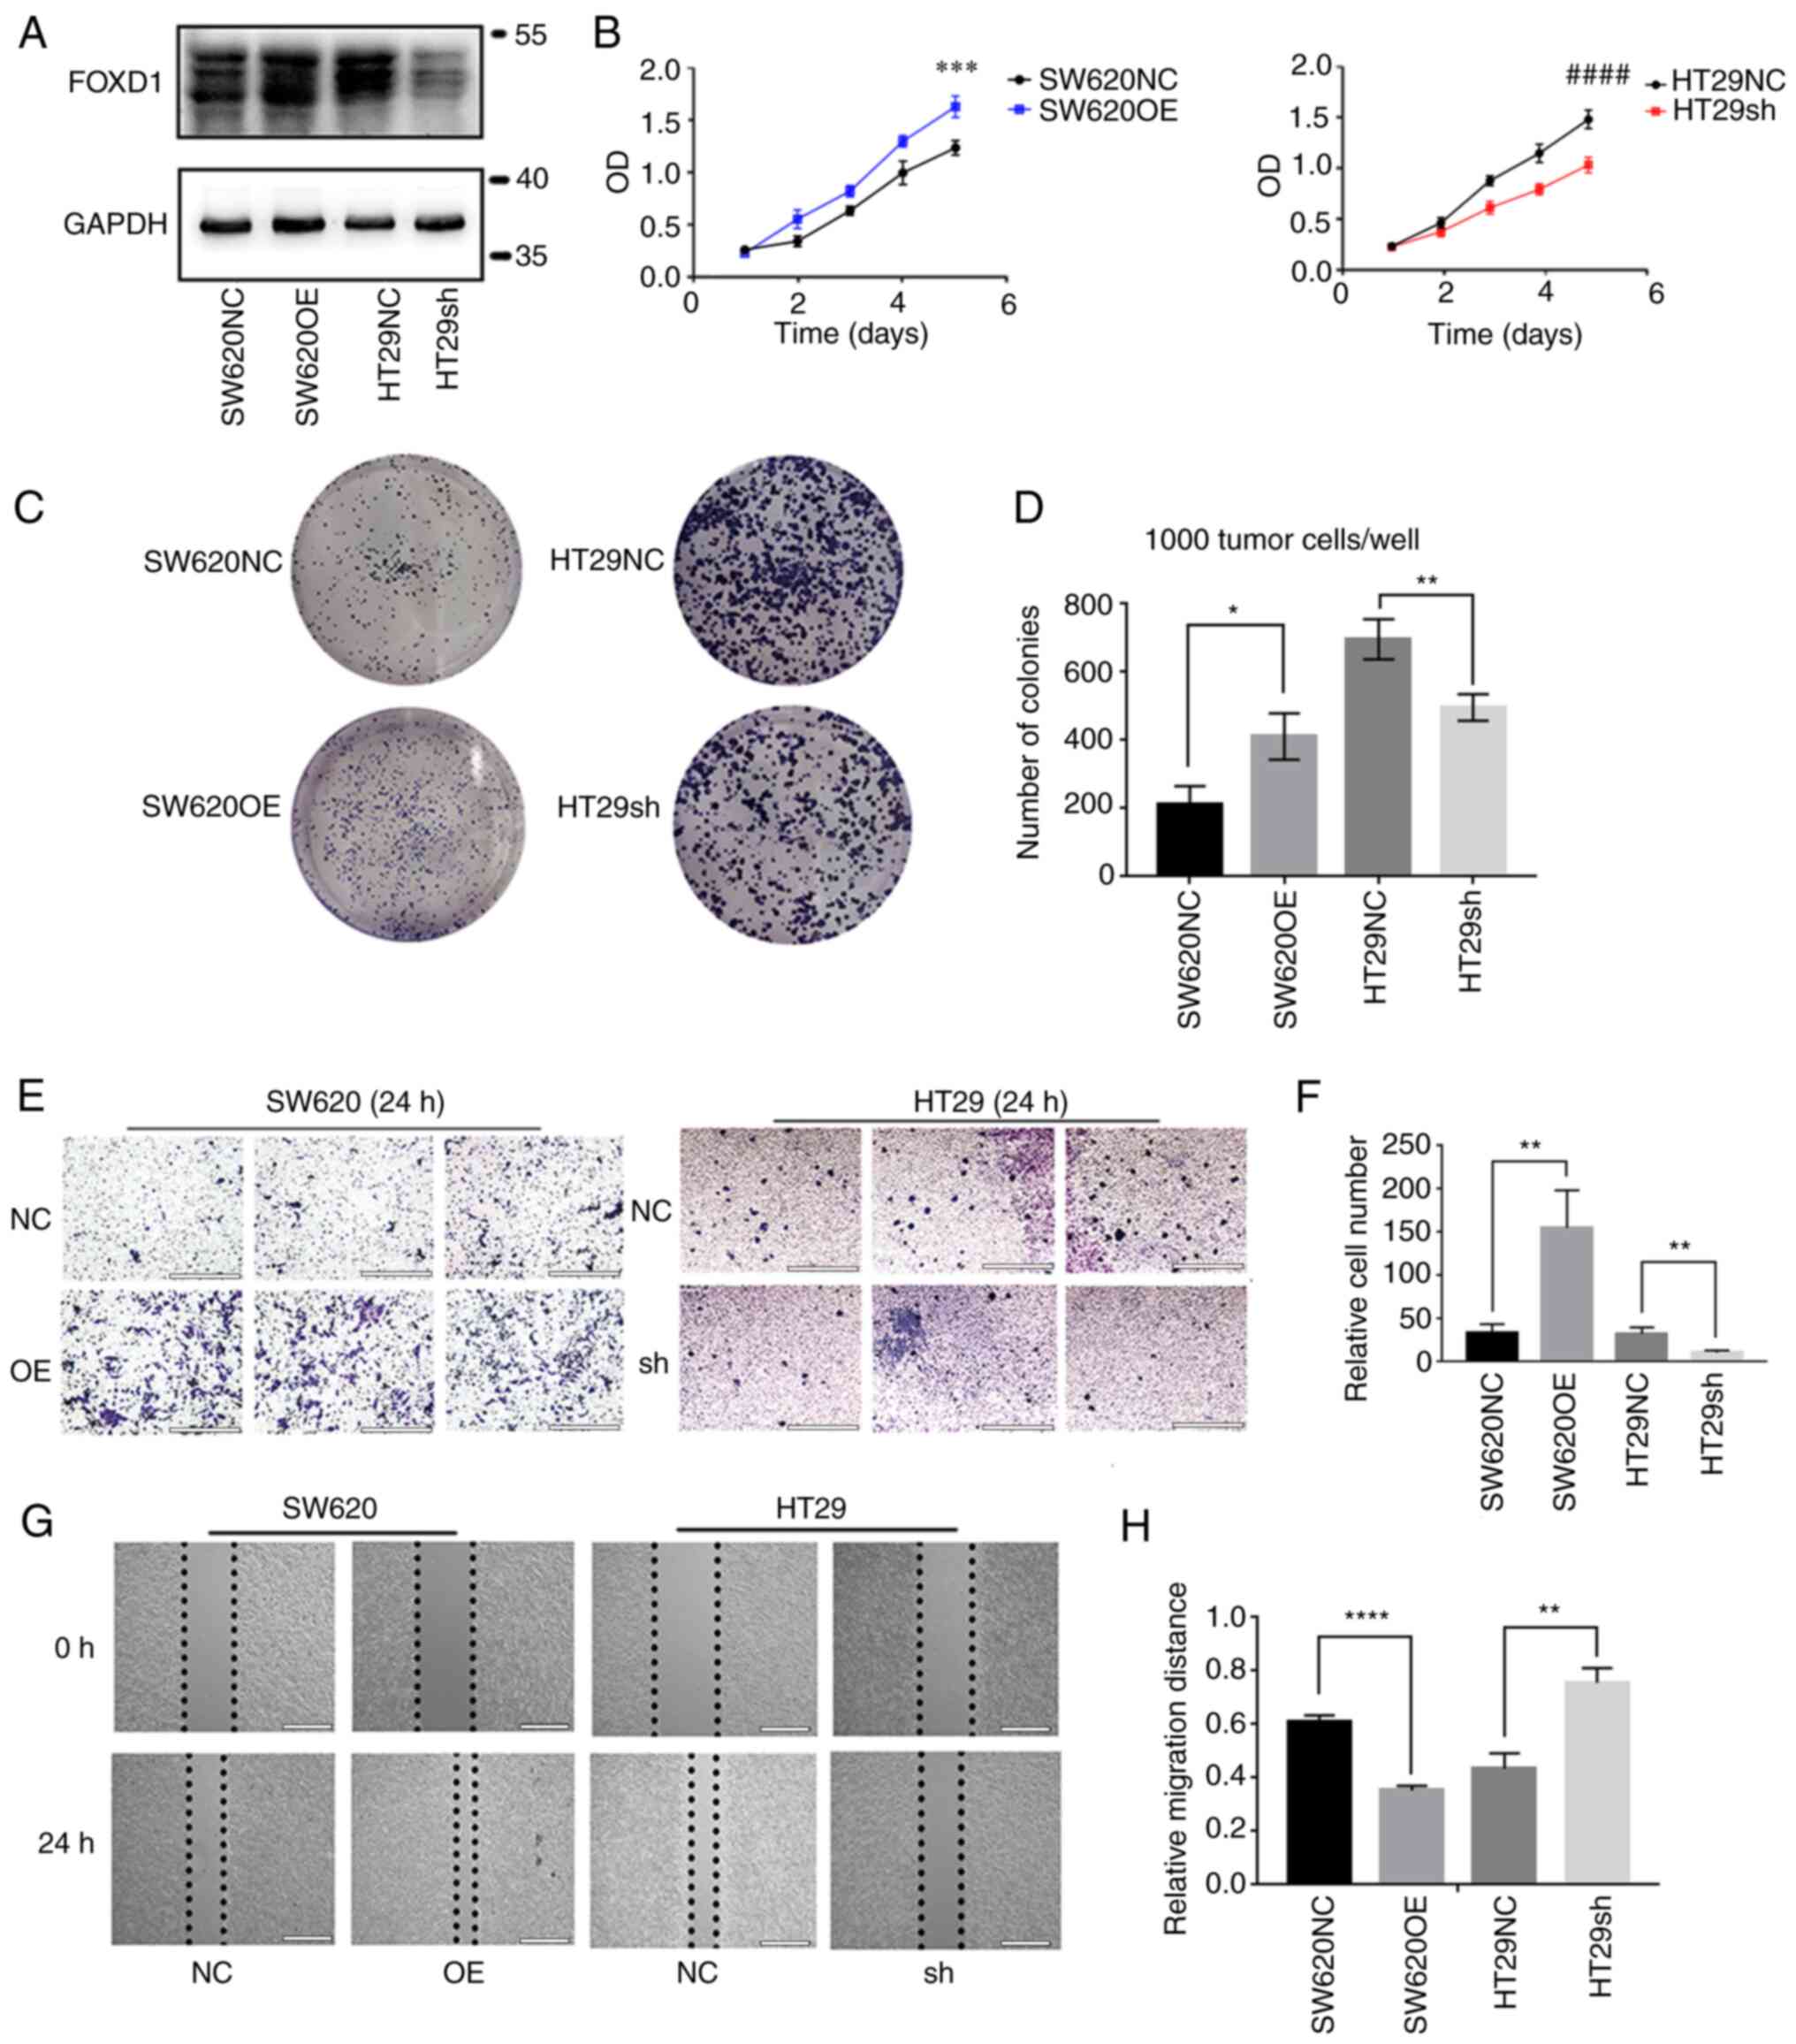 | Figure 2.(A) Western blot analysis of the
efficiency of FOXD1 OE and NC vectors in SW620 cells, and sh-FOXD1
and NC vectors in HT29 cells. (B) As assessed by Cell Counting
Kit-8 assay, FOXD1 OE enhanced the proliferation of SW620 cells and
FOXD1 depletion reduced the proliferation of HT29 cells. At day 5,
the differences in absorbance between the SW620NC and SW620OE
groups, and between the HT29NC and HT29sh groups were statistically
significant. ***P<0.001 vs. SW620NC; ####P<0.0001
vs. HT29sh. (C and D) Colony formation was increased in the SW620OE
group and reduced in the HT29 sh-FOXD1 group compared with in the
NC groups. (E and F) Cells migrated across the Transwell membrane
filter after 24 h. Transwell assays were performed to examine the
migration of FOXD1 OE SW620 cells and sh-FOXD1 HT29 cells. Scale
bar, 200 µm. (G and H) Wound-healing assays of cell migration in
SW620 and HT29 cells. The images of wound closure are presented at
0 and 24 h after scratching. Scale bar, 2,000 µm. *P<0.05,
**P<0.01, ****P<0.0001. FOXD1, forkhead box D1; NC, negative
control; OE, overexpression; sh, short hairpin. |
FOXD1 promotes CRC cells stemness via
activated β-catenin
Sphere formation is considered an important feature
in assessing tumor cell stemness in vitro (17). The stemness of tumor cells is
considered to have an important role in tumorigenic potential,
including the ability to metastasize, form colonies and exhibit
resistance to cytotoxic drugs (20). To investigate the relationship
between FOXD1 and CRC stemness, the sphere formation of SW620 cells
overexpressing FOXD1 and HT29 cells transduced with sh-FOXD1, as
well as controls, was evaluated. Examination of the spheroid
formation (Fig. 3A) revealed an
increased number of spheroids in the FOXD1-overexpressing SW620
cell groups compared with that in the control cell group. In
addition, sphere formation was significantly reduced in
sh-FOXD1-transduced HT29 cells compared with that in control cells
(Fig. 3B). Furthermore, limiting
dilution assays confirmed the pro-stemness effect of FOXD1 in
vivo; HT29 cells with FOXD1 knockdown exhibited impaired tumor
initiation, whereas SW620 cells with FOXD1 overexpression exhibited
enhanced tumor initiation (Fig.
3C). As the number of injected cells decreased exponentially,
the differences between groups became increasingly pronounced,
further demonstrating that FOXD1 could affect tumor cell stemness
(Fig. 3D).
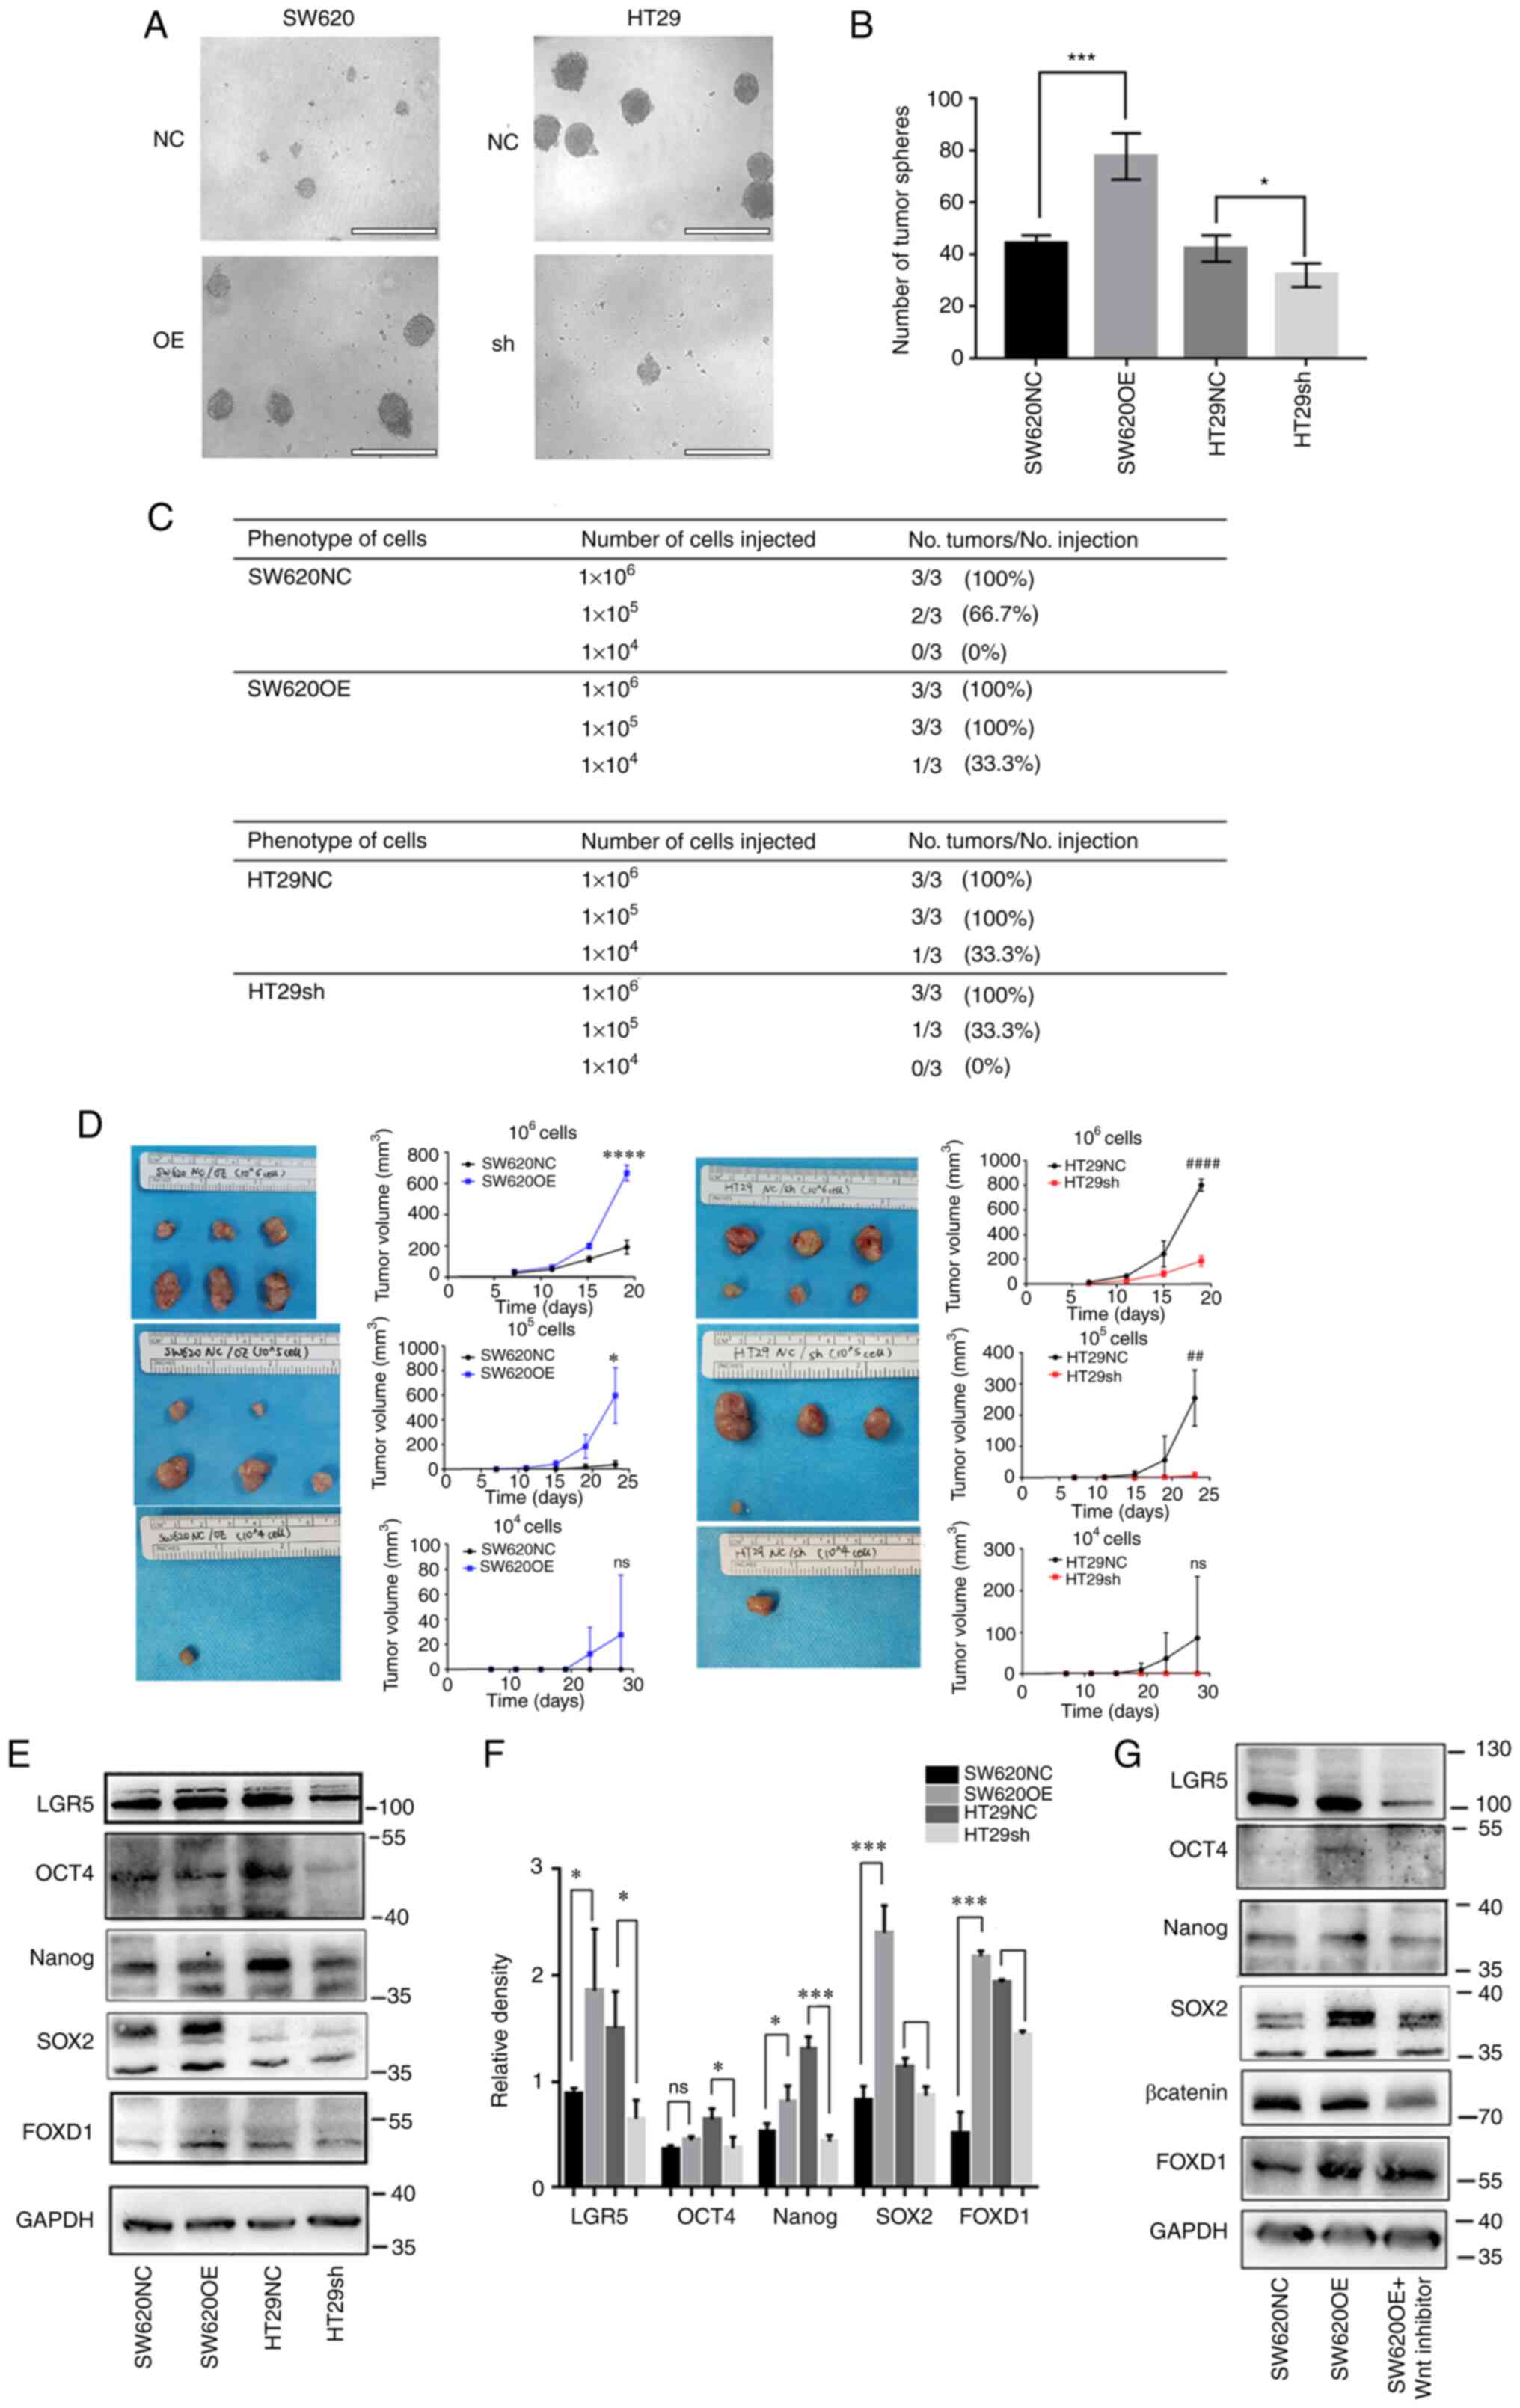 | Figure 3.(A and B) Tumor sphere formation was
assessed to determine the cell stemness of SW620 and HT29 cells.
There were more spheroids in the SW620OE group, and less in the
HT29 sh-FOXD1 group compared with in the NC groups. Scale bar, 400
µm. *P<0.05, ***P<0.001. (C) FOXD1 OE promotes
tumor-initiating capacity in vivo, whereas FOXD1 depletion
reduces it, as analyzed by a limiting dilution assay. (D)
Difference in subcutaneous tumor volume between the SW620NC and
SW620OE groups, and between the HT29NC and HT29sh groups in the
limiting dilution assay. *P<0.05, ****P<0.0001 vs. SW620NC;
##P<0.01, ####P<0.0001 vs. HT29sh. (E)
Western blot analysis and (F) semi-quantification of the expression
of stemness markers in SW620OE and HT29 sh-FOXD1 cells. (G) Western
blot analysis of the expression of stemness markers in SW620OE
cells treated with XAV-939. *P<0.05, ***P<0.001. FOXD1,
forkhead box D1; LGR5, leucine rich repeat containing G
protein-coupled receptor 5; NC, negative control; OE,
overexpression; sh, short hairpin; ns, not significant. |
Western blot analysis demonstrated that FOXD1
overexpression promoted Sox2, Oct4, Nanog, and LGR5 expression in
SW620 cells, whereas FOXD1 depletion reduced their expression in
HT29 cells (Fig. 3E and F). To
further examine whether FOXD1 could affect stemness through
impacting β-catenin, the FOXD1-overexpressing SW620 cells were
incubated with or without XAV-939, a Wnt/β-catenin inhibitor that
inhibits β-catenin expression. XAV-939 markedly inhibited Sox2,
Oct4, Nanog and LGR5 protein expression by suppressing
Wnt/β-catenin signaling pathway-mediated transcription (Fig. 3G).
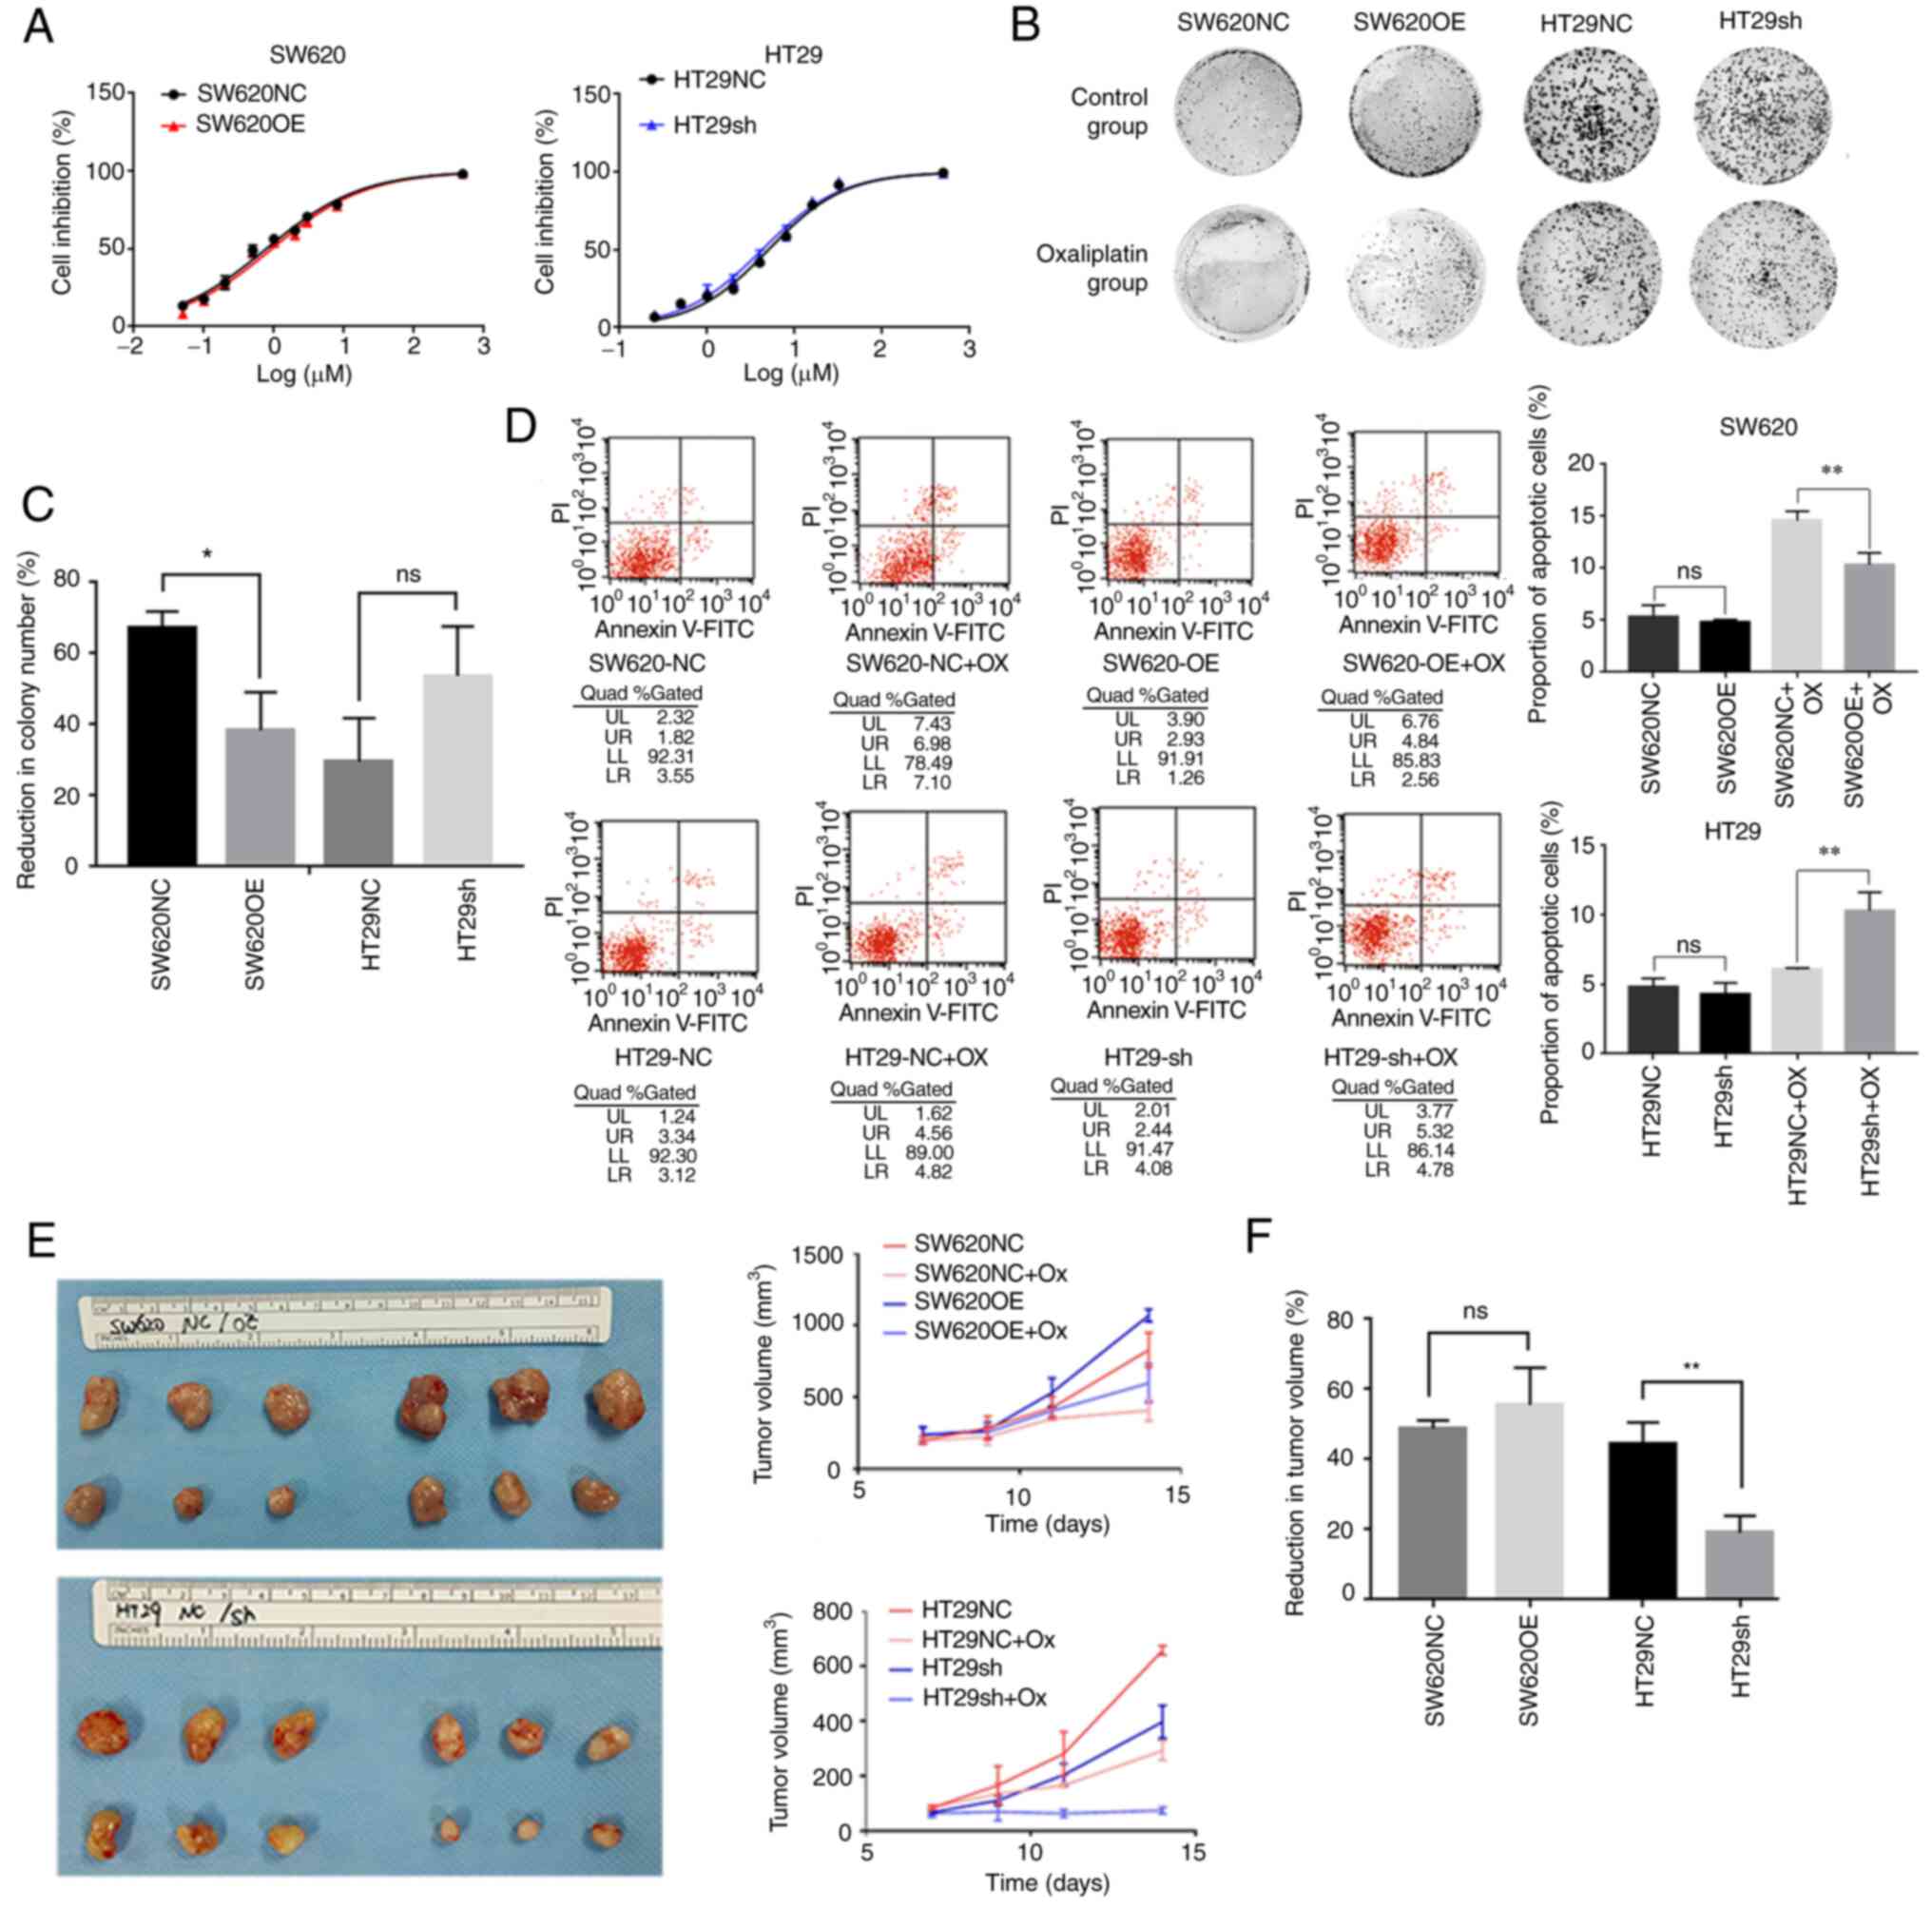
FOXD1 modulates oxaliplatin resistance
of CRC cells in vitro and in vivo
Cell stemness is considered to be among the
important potential mechanisms responsible for resistance to CRC
chemotherapeutic agents (15). The
present study revealed that the FOXD1-overexpressing SW620 cells
had higher oxaliplatin IC50 values
(IC50=0.936) than control cells (IC50=0.781),
whereas sh-FOXD1-transduced HT29 cells had lower IC50
values (IC50=4.248) than control cells (IC50=5.017)
(Fig. 4A). Although the numerical
value of IC50 seems very similar to that of the control
group, the difference in percentage is ~20% and thus the relative
difference is not small. Furthermore, colony formation experiments
using CRC cells that were treated with oxaliplatin in normal medium
revealed that FOXD1 knockdown strongly impaired CRC cell
proliferation and reduced the resistance of cells to oxaliplatin.
By contrast, FOXD1 overexpression promoted the proliferation and
oxaliplatin resistance of SW620 cells (Fig. 4B and C). In addition, following
treatment with oxaliplatin, a higher percentage of
sh-FOXD1-transduced HT29 cells underwent apoptosis compared with
HT29NC cells. Similarly, after treatment with oxaliplatin, a lower
percentage of FOXD1-overexpressing SW620 cells underwent apoptosis
compared with SW620NC cells (Fig.
4D). Necrotic cells are PI-positive, whereas apoptotic cells
were positive for Annexin V-FITC fluorescence. Upper and lower
right quadrants were assessed.
To further investigate whether FOXD1 enhances
chemoresistance in vivo, a chemoresistant nude mouse model
was used. Nude mice bearing tumors from SW620 control cells or
FOXD1-overexpressing SW620 cells, and HT29 control cells or FOXD1
knockdown HT29 cells were treated with oxaliplatin (5 mg/kg body
weight; intraperitoneal injection) or PBS every other day, and the
tumor size was measured after three treatments. The results showed
that after FOXD1 knockdown in the HT29sh group, a marked reduction
in tumor volume occurred relative to the HT29NC group. By contrast,
the tumors in the SW620OE group were markedly larger than those in
the SW620NC group, and although the percentage of tumor reduction
was not statistically different, a marked increase in tumor volume
was detected in SW620OE groups both with and without oxaliplatin
treatment (Fig. 4E and F).
Reduction in tumor volume (%)=volume of tumor after oxaliplatin
treatment/volume of tumor control ×100.
FOXD1 interacts directly with
β-catenin to promote nuclear translocation
IF analysis of β-catenin in each group revealed that
FOXD1 promoted β-catenin nuclear translocation (Fig. 5A). To further confirm this finding,
western blot analysis was performed; the results demonstrated that
the overexpression of FOXD1 in SW620 cells promoted β-catenin
nuclear translocation, whereas the opposite results were observed
in sh-FOXD1-transduced HT29 cells (Fig.
5D and E). Co-IP is a method used to study protein interactions
based on the specificity of the interaction between antibodies and
antigens. It is used to determine the physiological interaction of
two proteins within an intact cell. When cells are lysed under
non-denaturing conditions, a number of the protein-protein
interactions present in intact cells are retained. The present
study performed IP using an antibody against the protein FOXD1 and
demonstrated that the protein β-catenin was expressed in the
protein precipitate following anti-FOXD1 adsorption. Moreover, IP
was performed using anti-FOXD1 on proteins extracted from HT29sh
cells, and the expression of β-catenin in the protein precipitate
following anti-FOXD1 adsorption was reduced compared with that in
proteins extracted from HT29NC cells (Fig. 5B and C). Therefore, it was concluded
that FOXD1 could bind directly with β-catenin in tumor cells and
could promote β-catenin nuclear translocation.
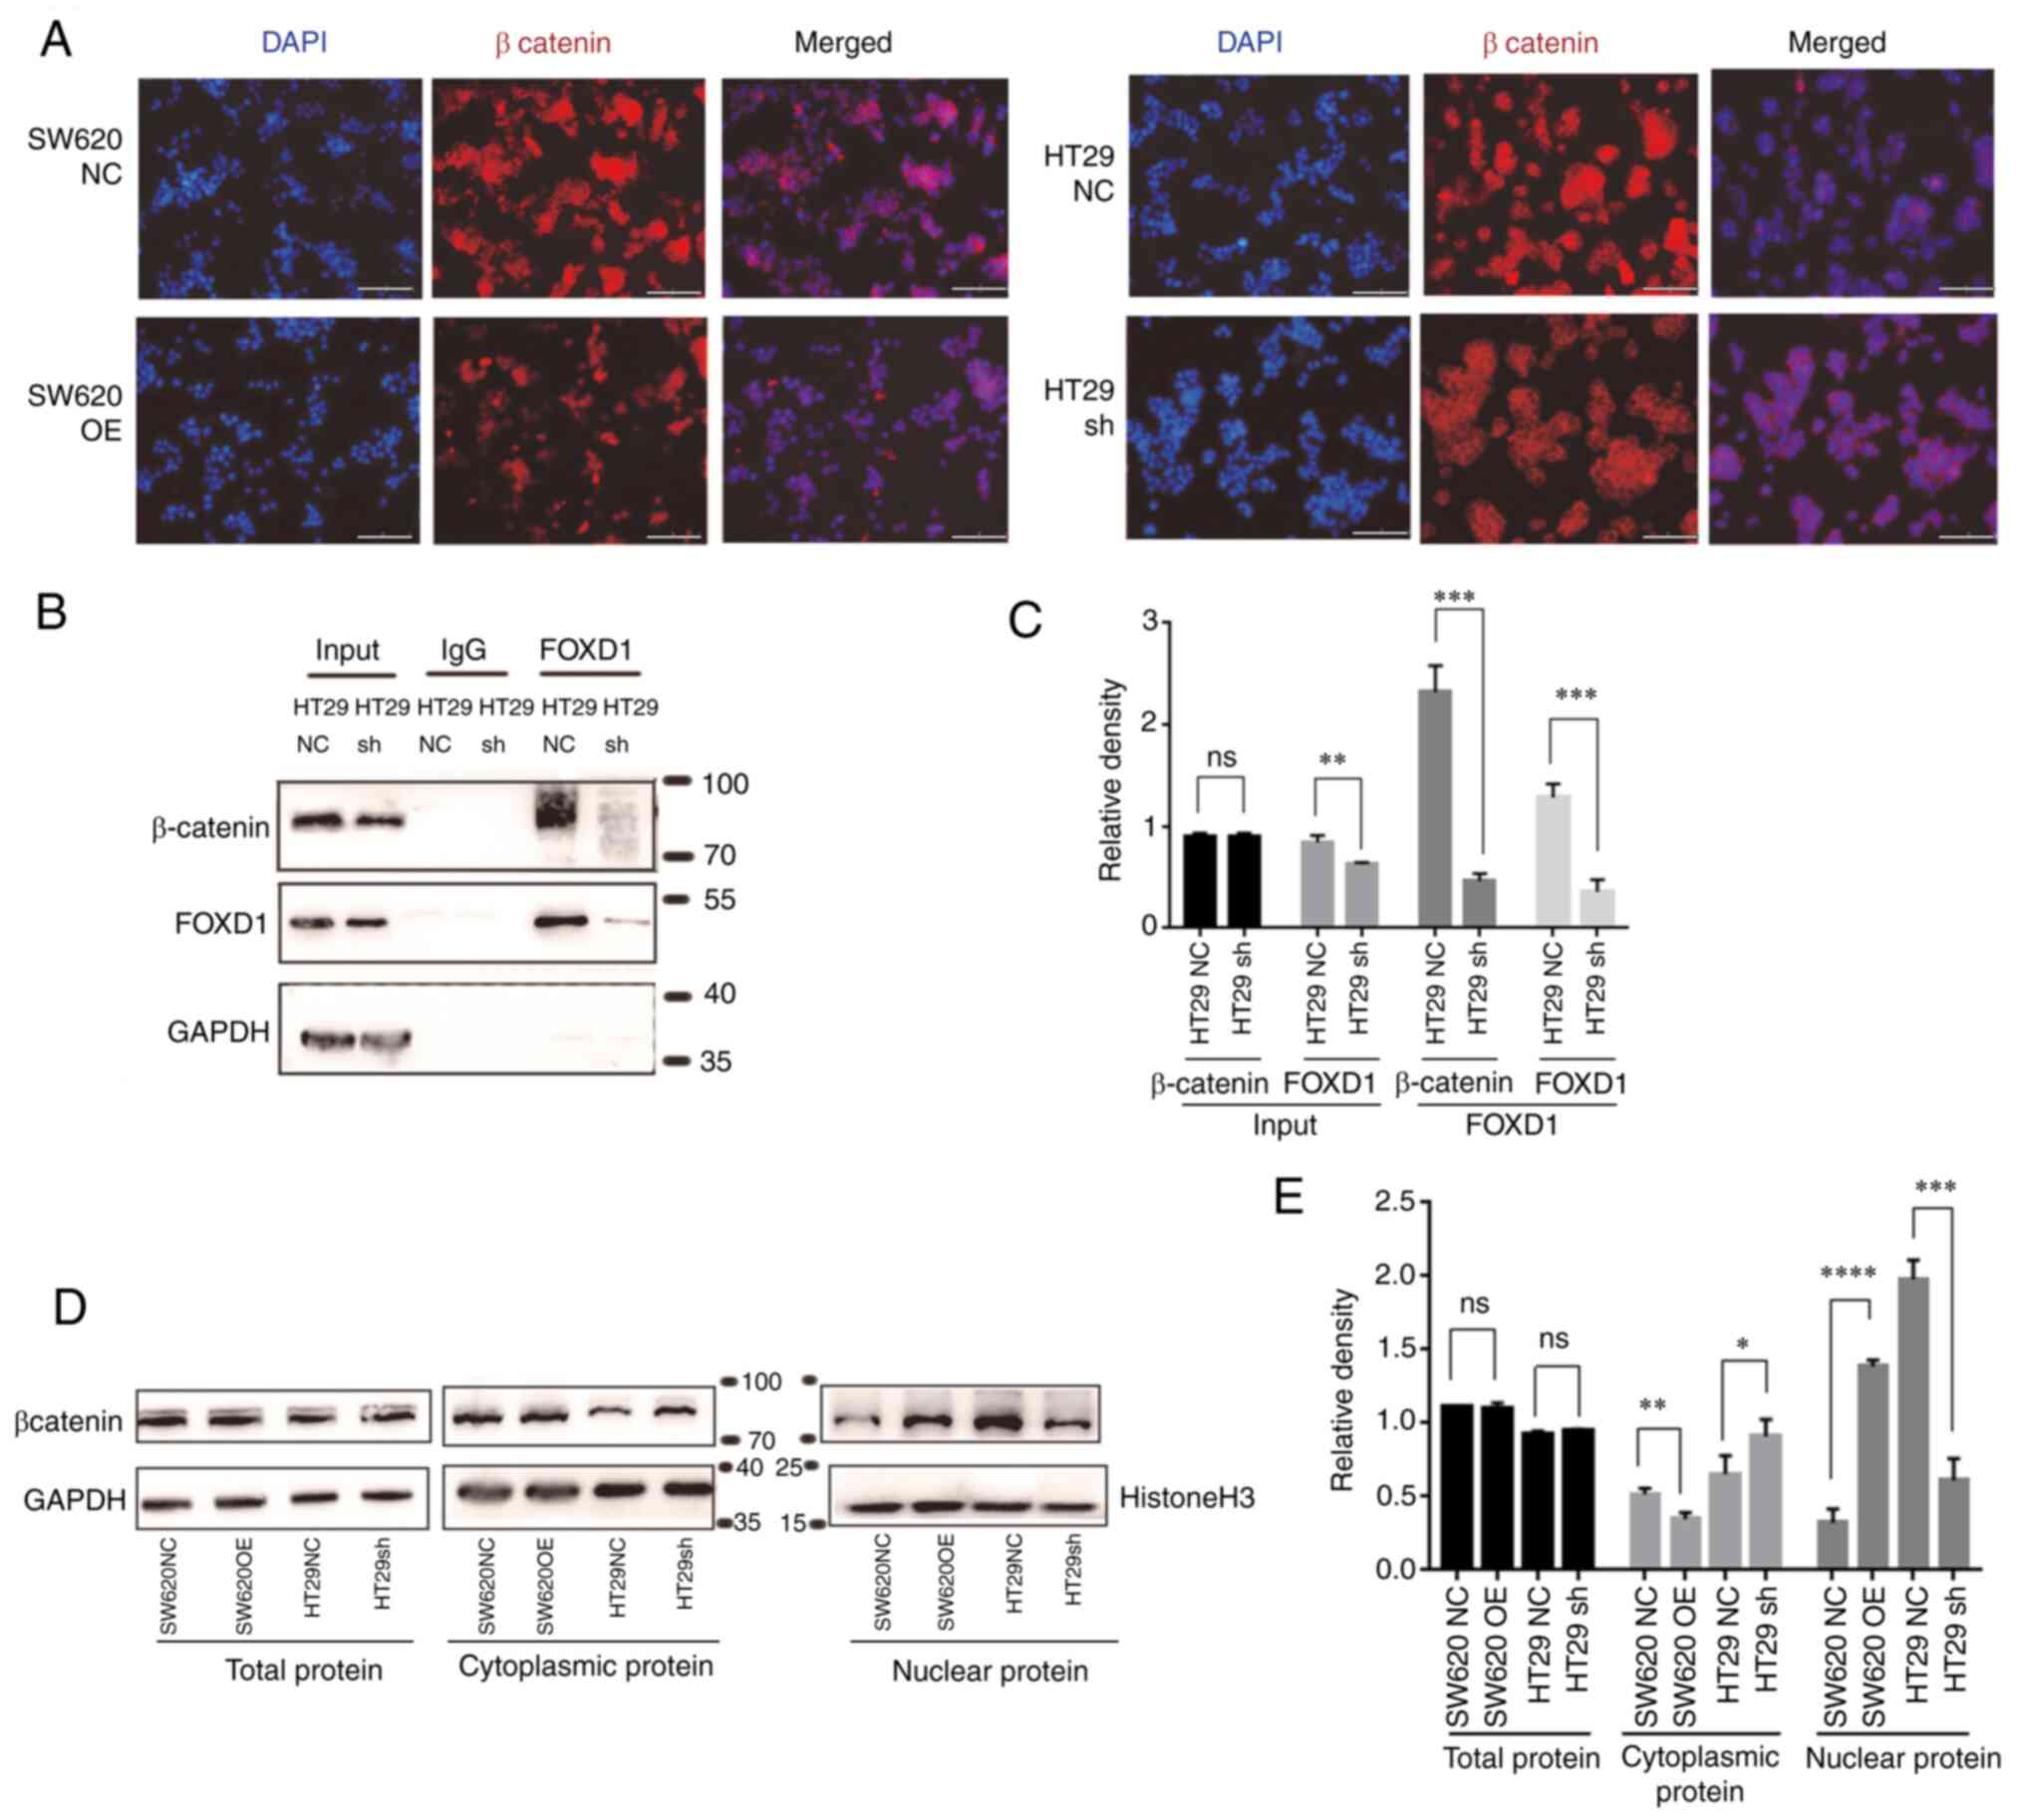 | Figure 5.(A) Immunofluorescence staining of
β-catenin (red) and nuclei (DAPI, blue) was performed in SW620OE
cells, HT29 sh-FOXD1 and NC cells. Scale bar, 200 µm. (B) HT29
sh-FOXD1 and NC cells were subjected to co-immunoprecipitation
using FOXD1 antibody or control IgG, followed by western blotting
with β-catenin and FOXD1 antibodies. (C) Semi-quantification of
western blotting protein bands. (D) Cytoplasmic and nuclear levels
of β-catenin in SW620OE cells, HT29 sh-FOXD1 and NC cells were
detected by western blotting and (E) were semi-quantified.
*P<0.05, **P<0.01, ***P<0.001, ****P<0.0001. FOXD1,
forkhead box D1; NC, negative control; OE, overexpression; sh,
short hairpin; ns, not significant. |
FOXD1 activates the Wnt/β-catenin
signaling enhances EMT
IF and western blot analyses demonstrated that FOXD1
overexpression decreased the expression levels of E-cadherin, and
increased the expression levels of vimentin and N-cadherin, whereas
FOXD1 knockdown decreased the expression levels of vimentin and
N-cadherin, and increased the expression levels of E-cadherin
(Fig. 6A-E). EMT is a reversible
cellular program that transiently places epithelial cells into
quasi-mesenchymal cell states. During this process, epithelial
cells progressively lose their cobblestone epithelial appearance in
monolayer cultures to adopt a spindle-shaped, mesenchymal
morphology (21). Upon activation
of EMT, E-cadherin expression is suppressed, which leads to the
loss of the typical polygonal, cobblestone morphology of epithelial
cells. In the present study, the FOXD1-overexpressing SW620 cells
acquired a spindle-shaped mesenchymal morphology. By contrast,
sh-FOXD1-transduced HT29 cells exhibited a more cobblestone-like
shape, characteristic of epithelial cells (Fig. 6F).
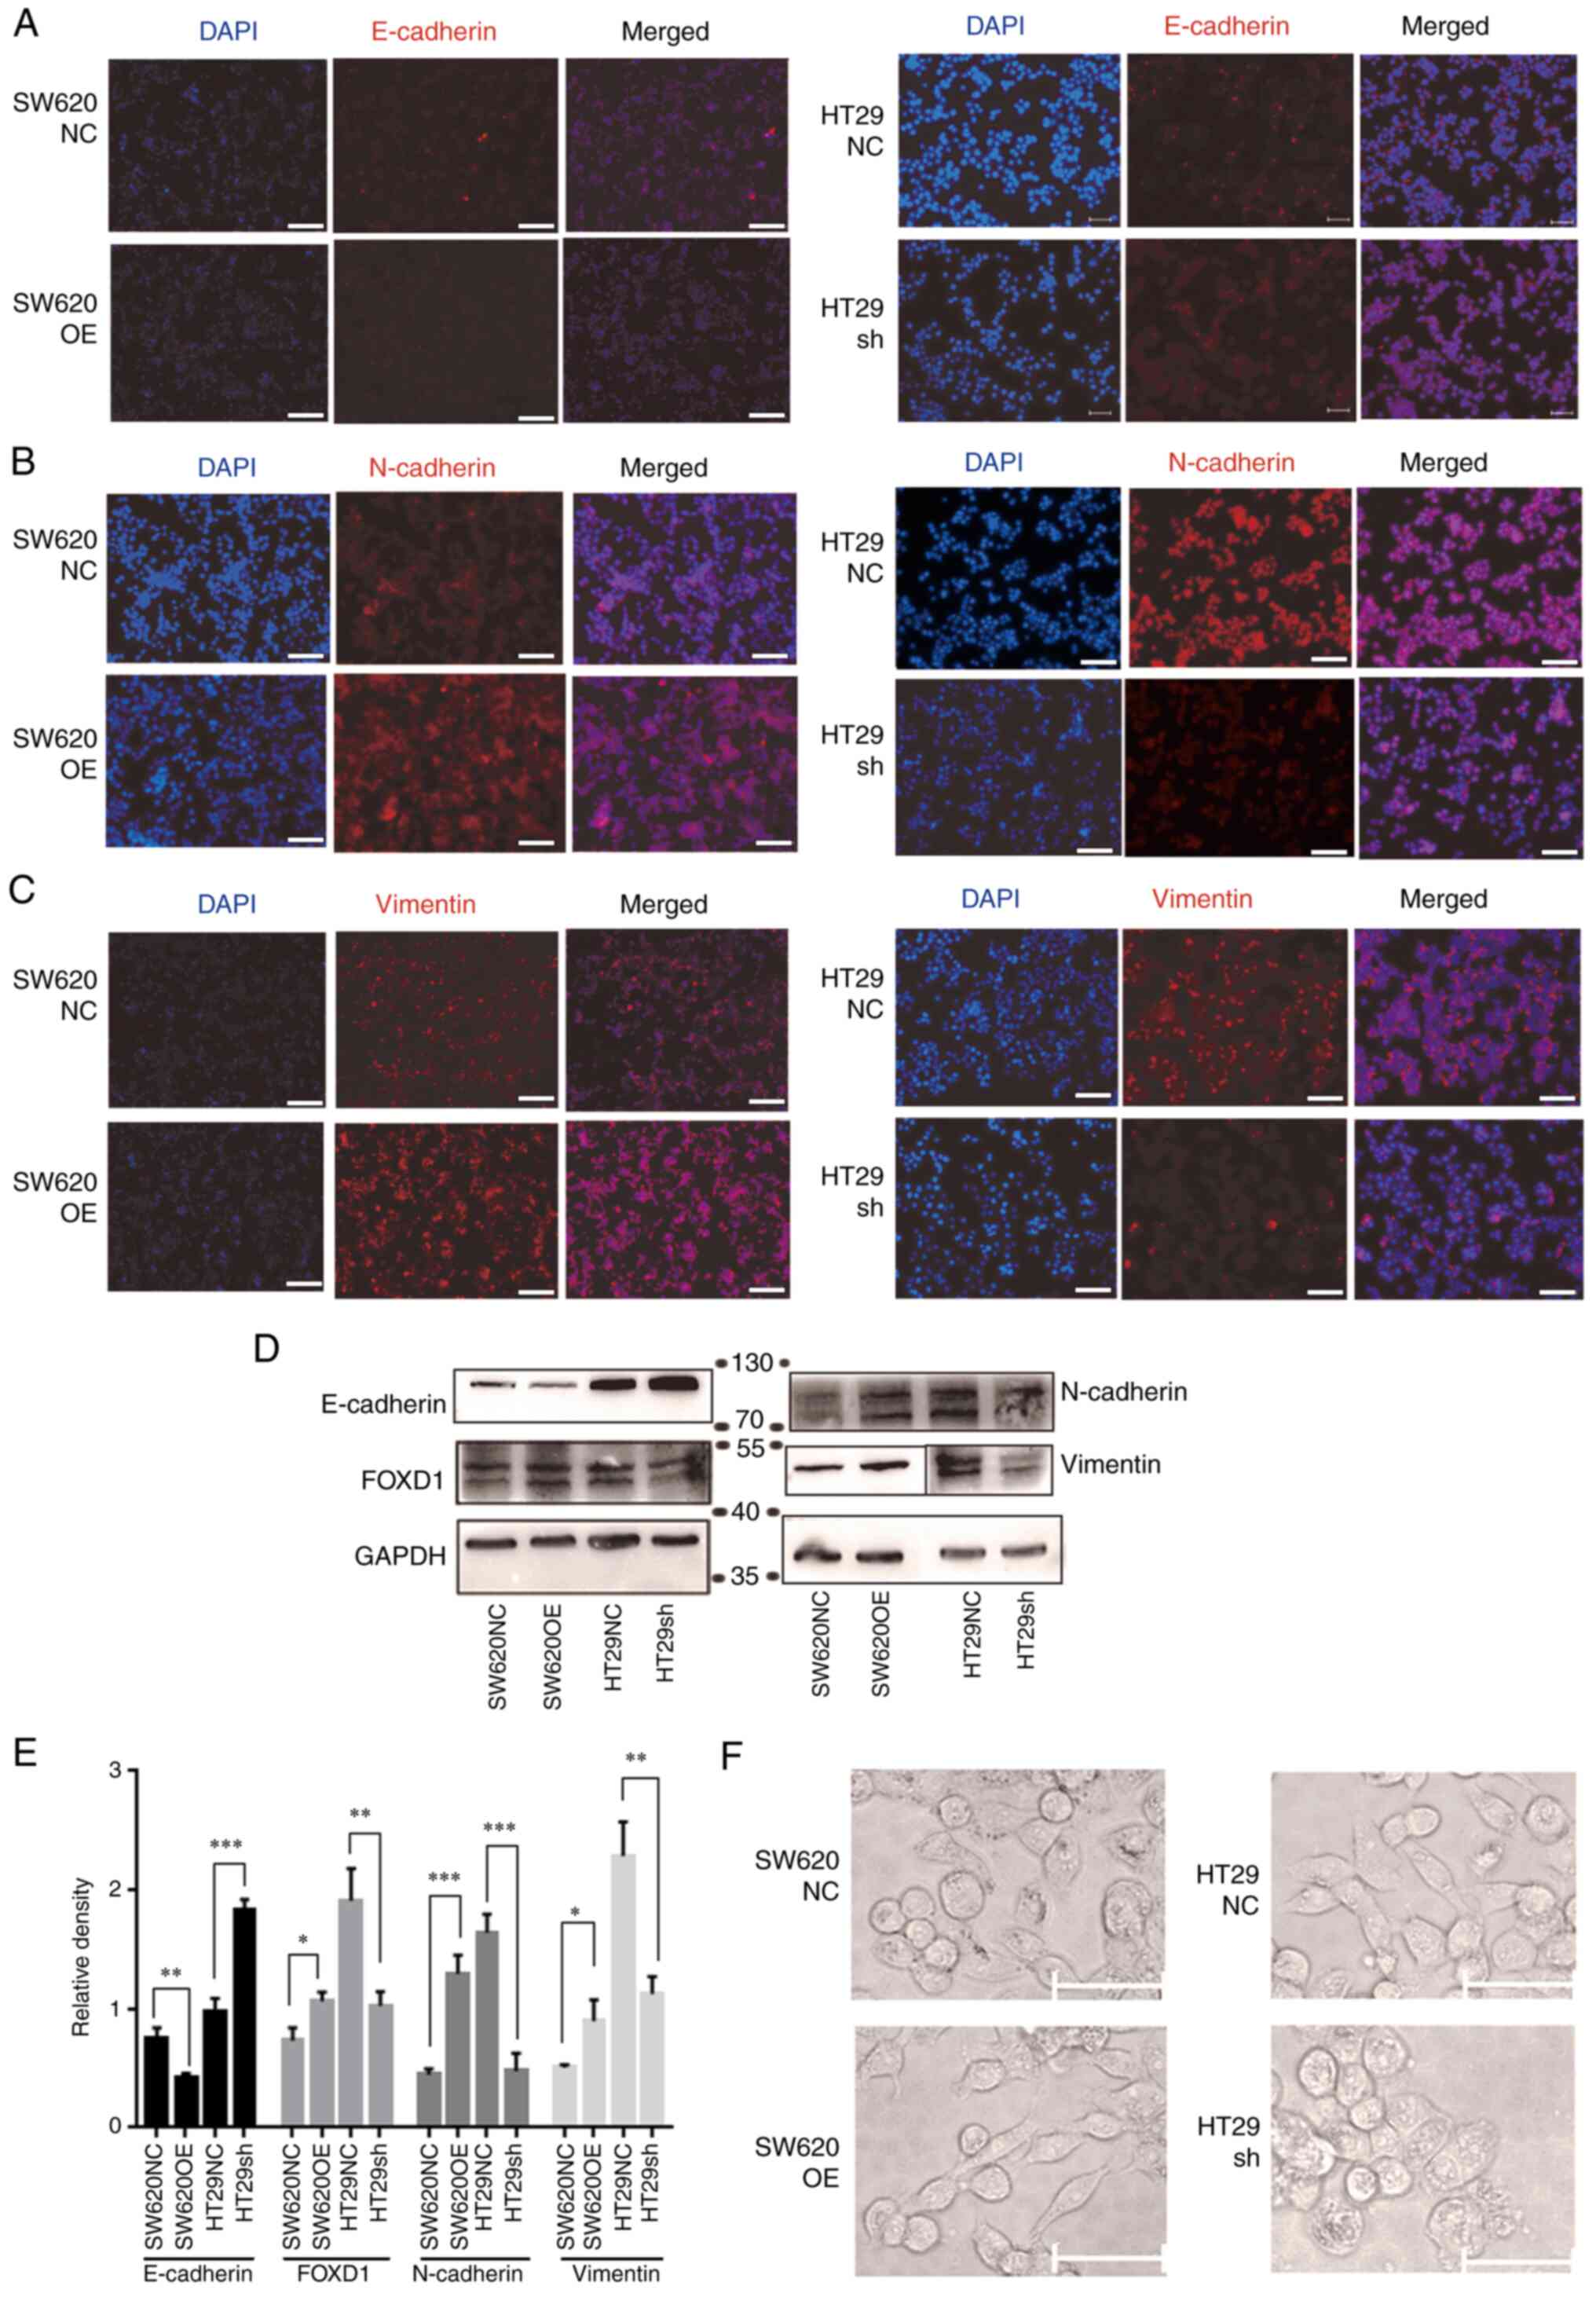 | Figure 6.Immunofluorescence staining showed
changes in the expression of EMT-associated proteins: (A)
E-cadherin, (B) N-cadherin and (C) vimentin (red) in SW620OE cells,
HT29 sh-FOXD1 and NC cells. Nuclei were counterstained with DAPI
(blue). Scale bar, 200 µm. (D) Western blot analysis and (E)
semi-quantification of the expression of EMT markers in FOXD1
overexpression SW620OE cells, HT29 sh-FOXD1 and NC cells. The
protein expression levels of vimentin for each group were detected
on the same membrane, sharing the same loading control but
different exposure times. (F) Morphological changes of SW620 cells
transduced with FOXD1 OE or NC vectors, and of HT29 cells
transduced with sh-FOXD1 or NC vectors. Scale bar, 100 µm.
*P<0.05, **P<0.01, ***P<0.001. FOXD1, forkhead box D1; NC,
negative control; OE, overexpression; sh, short hairpin. |
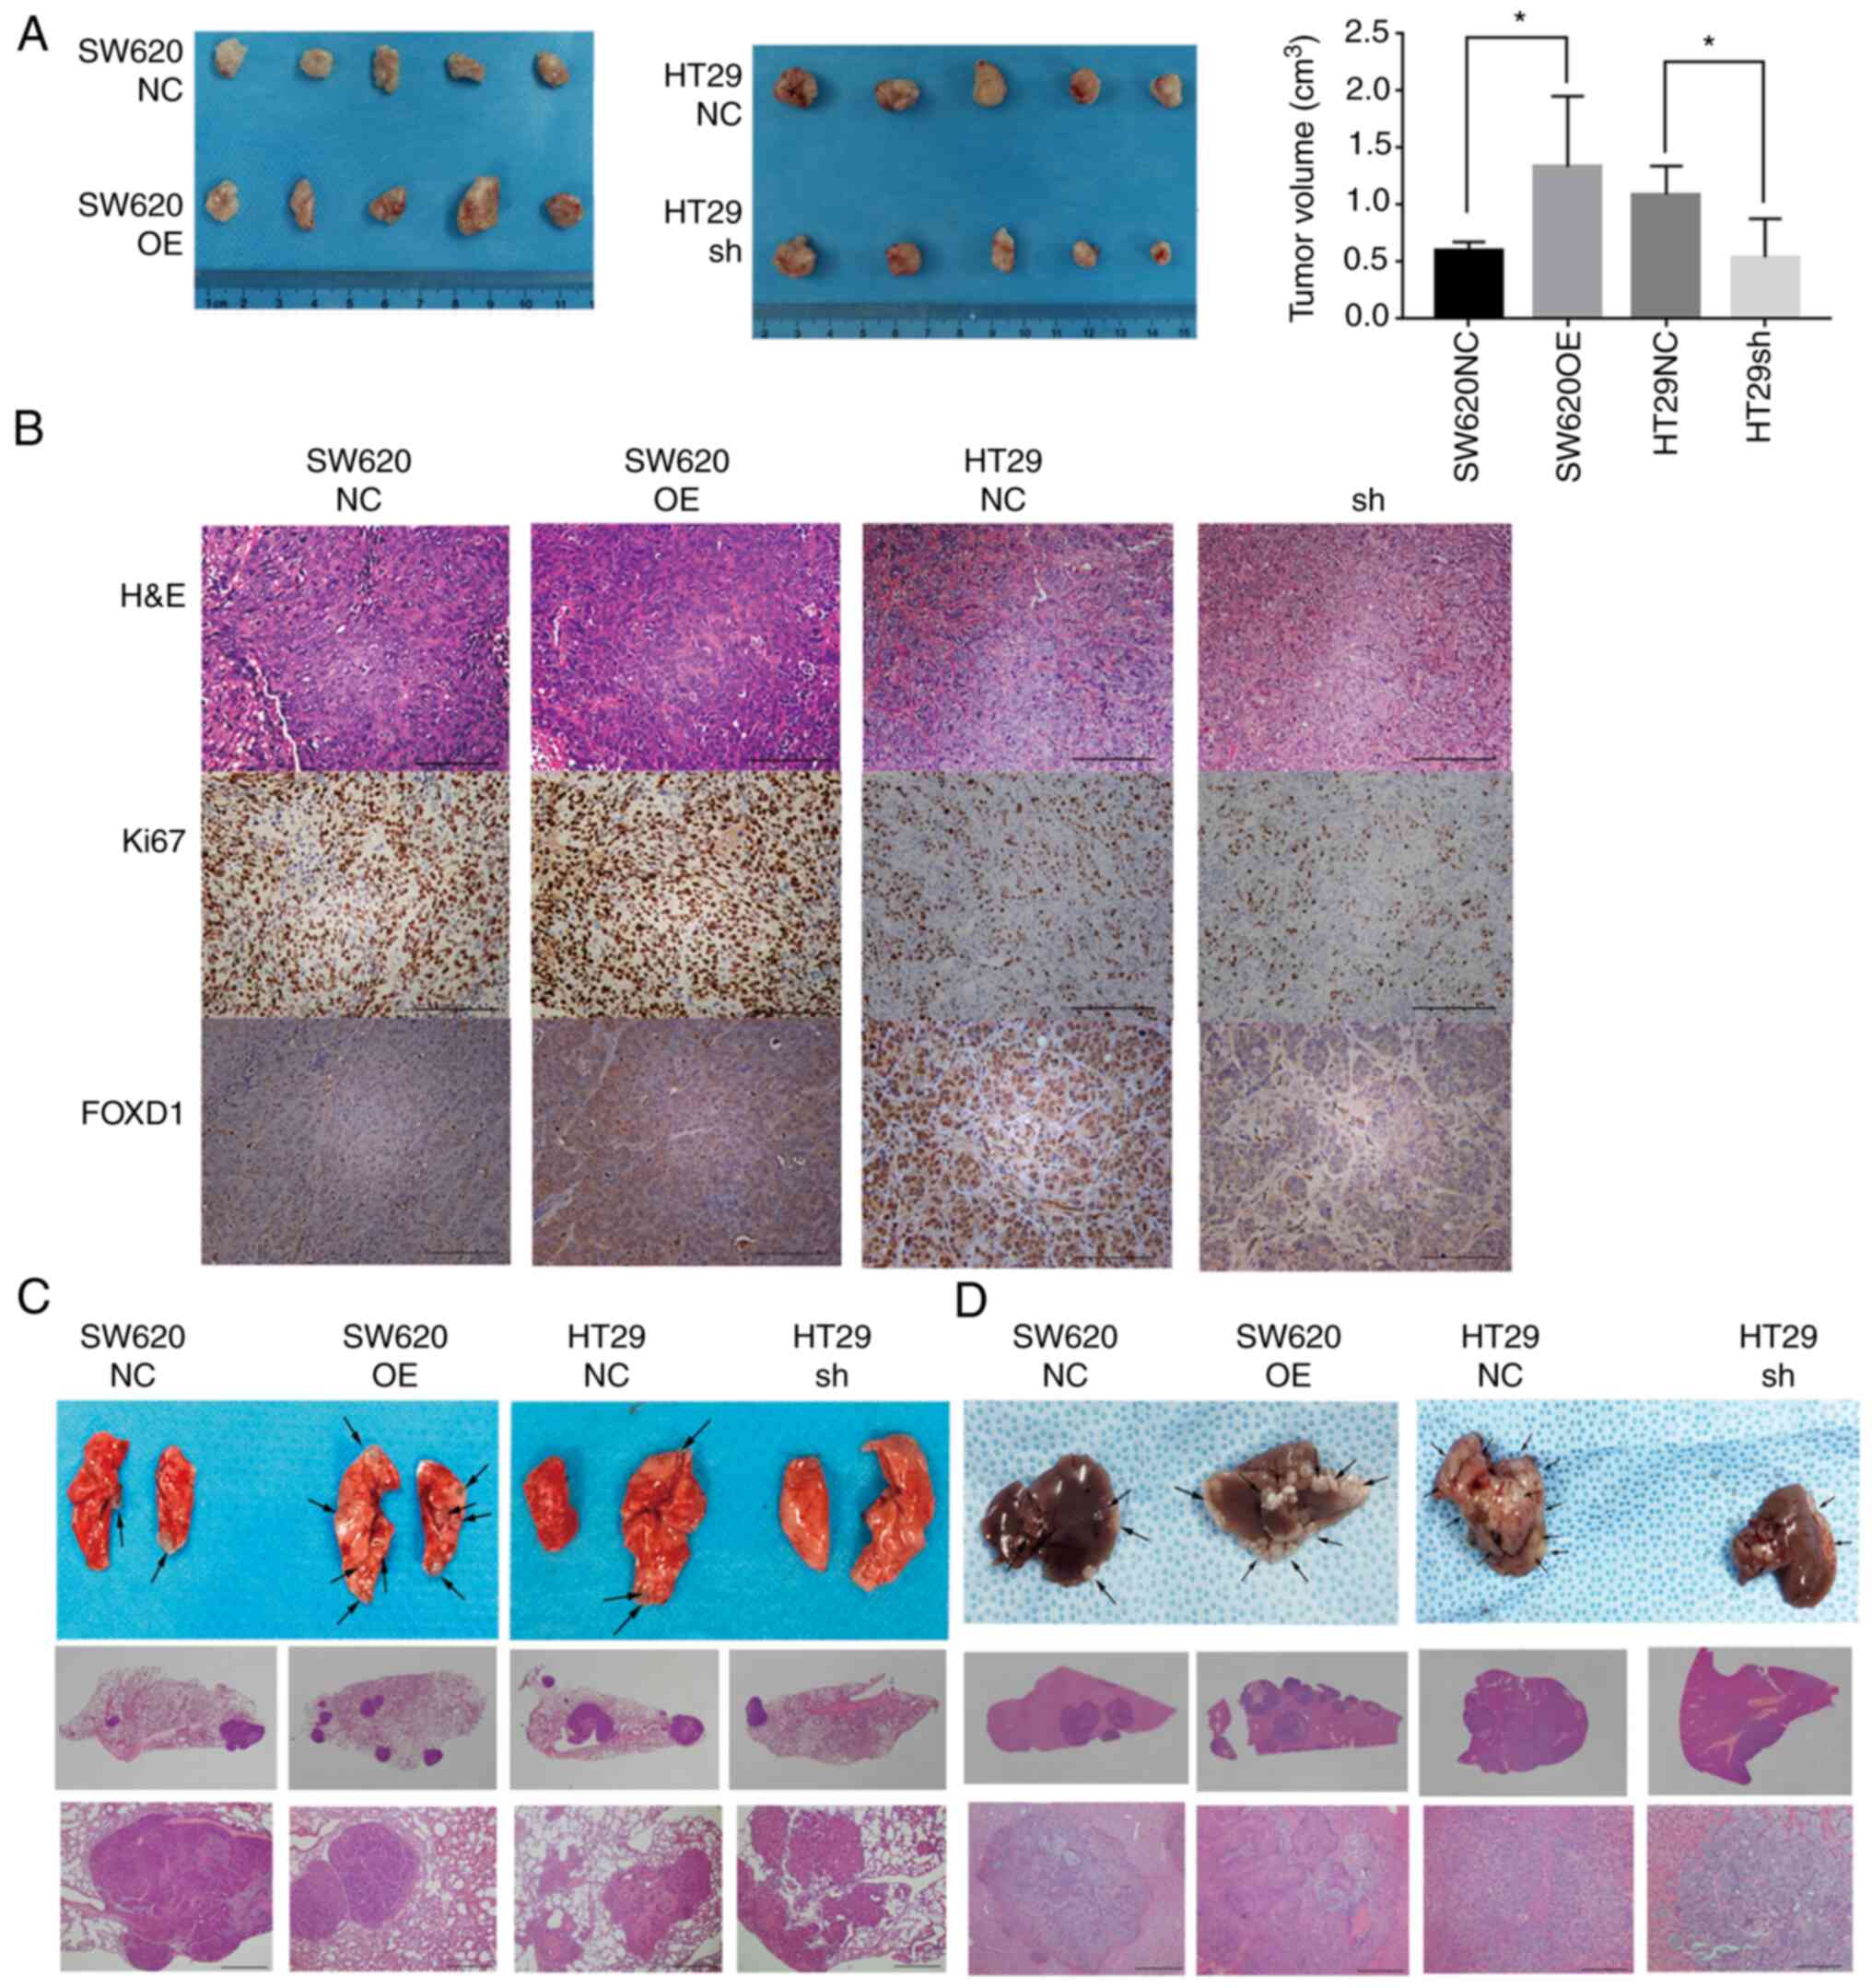
FOXD1 promotes tumorigenicity and
tumor metastasis in vivo
In order to verify the promoting effect of FOXD1 on
CRC cells in vivo, stably transduced SW620 and HT29 cells
were subcutaneously injected into nude mice and the subcutaneous
tumor growth in the xenograft nude mouse model was evaluated. FOXD1
overexpression increased tumor growth in vivo, whereas FOXD1
knockdown markedly suppressed tumor growth in vivo compared
with the controls (Fig. 7A and B).
Lung metastasis models were induced by injecting stably transfected
cells into the tail vein of mice to examine the effect of FOXD1 on
tumor metastasis. The metastatic nodules in the lungs 4 weeks after
injection were examined by H&E staining. Both the quantity and
size of pulmonary metastatic nodules were increased in the
FOXD1-overexpression groups and decreased in the FOXD1-knockdown
groups compared with in the control groups (Fig. 7C). In addition, the results of the
mouse liver metastasis model revealed that knockdown of FOXD1
reduced the number of liver metastatic nodules, whereas
overexpression of FOXD1 increased the number of liver metastatic
nodules (Fig. 7D). These results
indicated that FOXD1 may serve a critical role in tumorigenesis and
tumor metastasis in vivo.
Discussion
At present, surgical resection remains the most
effective treatment for patients with CRC. Although the survival of
patients with CRC has been prolonged in recent years with advances
in chemotherapy and radiotherapy, tumor metastasis is an important
detrimental factor in the treatment and prognosis of patients with
CRC (22).
At present, for patients who are resistant to
conventional anticancer treatment, chemotherapy and radiotherapy
have poor efficacy, and tumor progression usually results in
tumor-related death within 1 year of treatment (23). As a result, there is a need to
further explore novel molecular biomarkers to identify patients at
high risk of metastasis and chemotherapy drug resistance, to
predict clinical outcomes and to develop molecularly targeted
therapeutic approaches. EMT and stemness, which drive CRC cell
invasion and metastatic spread from the primary tumor, have been
established as key factors in tumor development and progression
(24). Increasing evidence has
suggested a positive role for FOXD1 in various epithelial
malignancies, and FOXD1 has been reported to be associated with
aggressive occurrence and progression of lung cancer and CRC
(4,25). A previous study demonstrated that
FOXD1 can regulate lung cancer cell apoptosis and cell cycle via
the Gal-31 regulatory loop (4).
Previous studies (4,25–27)
have also indicated that FOXD1 serves a role in self-renewal and
tumorigenicity in mesenchymal glioma cells and breast cancer cells.
The present results demonstrated that FOXD1 expression was higher
in CRC tissues than in normal colorectal tissues, and it was
positively associated with CRC proliferation, migration and
invasion, thus indicating that FOXD1 may act as a potential
biomarker to predict prognosis and metastasis in CRC.
Cell stemness is considered to be the basis of
aggressive tumors (27), reflecting
self-renewal and pluripotent differentiation in tumor cells, which
may lead to pathogenicity, resistance to treatment, recurrence and
metastasis (21). Increasing
studies have identified various cancer cell types that have stem
cell-like characteristics, which enhance the resistance of tumors
to treatment (28,29). Therefore, targeting cancer cell
stemness in CRC has become a frontier in cancer therapy. The
present study revealed that the overexpression of FOXD1 promoted
cell stemness in CRC, which might be the basic reason for
chemotherapy drug resistance. Furthermore, the present study
indicated that FOXD1-activated β-catenin may promote the EMT of CRC
cells, while increasing metastasis in CRC.
There has been a wealth of research on aberrant
activation of the Wnt/β-catenin pathway; almost all cases of
sporadic CRC are associated with abnormal Wnt/β-catenin signaling,
the activation of which increases β-catenin nuclear translocation
and β-catenin forms a complex with T-cell factor/lymphoid enhancer
factor to mediate target gene expression (30). Among them, β-catenin nuclear
translocation is one of the most critical steps activating the
Wnt/β-catenin signaling pathway (31). The present study revealed that FOXD1
enhanced the nuclear localization and transcriptional activity of
β-catenin through binding to β-catenin, thus promoting cell
stemness, which can make cells more resistant to chemotherapy. In
addition, the Wnt/β-catenin pathway inhibitor, XAV-393, through the
depletion of β-catenin, could reverse the expression of stemness
markers (such as Sox2, Oct4, Nanog and LGR5) induced by enhanced
FOXD1 expression. In summary, these results demonstrated that FOXD1
promoted chemotherapy resistance via enhancing cell stemness by
controlling β-catenin nuclear localization.
In conclusion, the present study identified a
promising cell stemness and chemotherapy resistance-associated
therapeutic gene, FOXD1. The present study revealed that FOXD1
could interact directly with β-catenin and control β-catenin
nuclear localization to facilitate cell stemness. Cells
overexpressing FOXD1 exhibited oxaliplatin resistance, and in
vivo experiments demonstrated that knockdown of FOXD1 had an
oxaliplatin-sensitizing effect. According to these results, the
increased expression of FOXD1 may inhibit the cell-killing capacity
of oxaliplatin in vitro and in vivo. A limitation of
the present study is that it did not investigate the specific
mechanism of drug resistance in detail; however, the experimental
results suggested the potential clinical application of FOXD1.
Taken together, these data indicated that FOXD1 may
be a potential clinical target for the prediction of metastasis and
could be a target for individualized drug therapy, which could
prevent tumor metastasis and chemotherapeutic resistance to improve
the prognosis of patients with CRC.
Acknowledgements
Not applicable.
Funding
Funding: No funding was received.
Availability of data and materials
The datasets used and/or analyzed during the current
study are available from the corresponding author on reasonable
request.
Authors' contributions
WF, JZ and AL made substantial contributions to the
conception or design of the work; WF, YCZ, YPZ, HG, WL and YM made
contributions to the acquisition and analysis of data. AL, MZ, ZQX
and ZFX made contributions to the interpretation of data for the
work. JZ and AL gave final approval of the version to be published.
AL and MZ agreed to be accountable for all aspects of the work in
ensuring that questions related to the accuracy or integrity of any
part of the work are appropriately investigated and resolved. AL
and MZ supervised the study. WF and JZ confirm the authenticity of
all the raw data. All authors read and approved the final
manuscript.
Ethics approval and consent to
participate
This study was approved by the Institutional Review
Board of Ruijin Hospital Ethics Committee (institutional approval
no. 2018-07-015; Shanghai Jiao Tong University School of Medicine).
Written informed consent to participate was obtained from all
patients and the human tissue samples were anonymously coded.
Patient consent for publication
Not applicable.
Competing interests
The authors declare that they have no competing
interests.
References
|
1
|
Siegel RL, Miller KD, Goding Sauer A,
Fedewa SA, Butterly LF, Anderson JC, Cercek A, Smith RA and Jemal
A: Colorectal cancer statistics, 2020. CA Cancer J Clin.
70:145–164. 2020. View Article : Google Scholar : PubMed/NCBI
|
|
2
|
Song M, Garrett WS and Chan AT: Nutrients,
foods, and colorectal cancer prevention. Gastroenterology.
148:1244–1260.e16. 2015. View Article : Google Scholar : PubMed/NCBI
|
|
3
|
Zhu H: Targeting forkhead box
transcription factors FOXM1 and FOXO in leukemia (review). Oncol
Rep. 32:1327–1334. 2014. View Article : Google Scholar : PubMed/NCBI
|
|
4
|
Golson ML and Kaestner KH: Fox
transcription factors: from development to disease. Development.
143:4558–4570. 2016. View Article : Google Scholar : PubMed/NCBI
|
|
5
|
Laissue P: The forkhead-box family of
transcription factors: key molecular players in colorectal cancer
pathogenesis. Mol Cancer. 18:52019. View Article : Google Scholar : PubMed/NCBI
|
|
6
|
Nakano I: Transcription factors as master
regulator for cancer stemness: Remove milk from fox? Expert Rev
Anticancer Ther. 14:873–875. 2014. View Article : Google Scholar : PubMed/NCBI
|
|
7
|
Zong Y, Miao Y, Li W, Zheng M, Xu Z, Gao
H, Feng W, Xu Z, Zhao J, Shen L and Lu A: Combination of FOXD1 and
Plk2: A novel biomarker for predicting unfavourable prognosis of
colorectal cancer. J Cell Mol Med. 26:3471–3482. 2022. View Article : Google Scholar : PubMed/NCBI
|
|
8
|
Gao YF, Zhu T, Mao XY, Mao CX, Li L, Yin
JY, Zhou HH and Liu ZQ: Silencing of forkhead box D1 inhibits
proliferation and migration in glioma cells. Oncol Rep.
37:1196–1202. 2017. View Article : Google Scholar : PubMed/NCBI
|
|
9
|
Nakayama S, Soejima K, Yasuda H, Yoda S,
Satomi R, Ikemura S, Terai H, Sato T, Yamaguchi N, Hamamoto J, et
al: FOXD1 expression is associated with poor prognosis in non-small
cell lung cancer. Anticancer Res. 35:261–268. 2015.PubMed/NCBI
|
|
10
|
Li D, Fan S, Yu F, Zhu X, Song Y, Ye M,
Fan L and Lv Z: FOXD1 promotes cell growth and metastasis by
activation of vimentin in NSCLC. Cell Physiol Biochem.
51:2716–2731. 2018. View Article : Google Scholar : PubMed/NCBI
|
|
11
|
Pan F, Li M and Chen W: FOXD1 predicts
prognosis of colorectal cancer patients and promotes colorectal
cancer progression via the ERK 1/2 pathway. Am J Transl Res.
10:1522–1530. 2018.PubMed/NCBI
|
|
12
|
Lytle NK, Barber AG and Reya T: Stem cell
fate in cancer growth, progression and therapy resistance. Nat Rev
Cancer. 18:669–680. 2018. View Article : Google Scholar : PubMed/NCBI
|
|
13
|
Visvader JE and Lindeman GJ: Cancer stem
cells: current status and evolving complexities. Cell Stem Cell.
10:717–728. 2012. View Article : Google Scholar : PubMed/NCBI
|
|
14
|
Takebe N, Miele L, Harris PJ, Jeong W,
Bando H, Kahn M, Yang SX and Ivy SP: Targeting notch, hedgehog, and
Wnt pathways in cancer stem cells: clinical update. Nat Rev Clin
Oncol. 12:445–464. 2015. View Article : Google Scholar : PubMed/NCBI
|
|
15
|
Li F, Tiede B, Massagué J and Kang Y:
Beyond tumorigenesis: Cancer stem cells in metastasis. Cell Res.
17:3–14. 2007. View Article : Google Scholar : PubMed/NCBI
|
|
16
|
Zhu CC, Chen C, Xu ZQ, Zhao JK, Ou BC, Sun
J, Zheng MH, Zong YP and Lu AG: CCR6 promotes tumor angiogenesis
via the AKT/NF-κB/VEGF pathway in colorectal cancer. Biochim
Biophys Acta Mol Basis Dis. 1864:387–397. 2018. View Article : Google Scholar : PubMed/NCBI
|
|
17
|
Tirino V, Desiderio V, Paino F, De Rosa A,
Papaccio F, La Noce M, Laino L, De Francesco F and Papaccio G:
Cancer stem cells in solid tumors: An overview and new approaches
for their isolation and characterization. FASEB J. 27:13–24. 2013.
View Article : Google Scholar : PubMed/NCBI
|
|
18
|
Zhao J, Ou B, Feng H, Wang P, Yin S, Zhu
C, Wang S, Chen C, Zheng M, Zong Y, et al: Overexpression of CXCR2
predicts poor prognosis in patients with colorectal cancer.
Oncotarget. 8:28442–28454. 2017. View Article : Google Scholar : PubMed/NCBI
|
|
19
|
Zhu YY and Yuan Z: Pancreatic cancer stem
cells. Am J Cancer Res. 26:894–906. 2015.PubMed/NCBI
|
|
20
|
André T, Boni C, Mounedji-Boudiaf L,
Navarro M, Tabernero J, Hickish T, Topham C, Zaninelli M, Clingan
P, Bridgewater J, et al: Oxaliplatin, fluorouracil, and leucovorin
as adjuvant treatment for colon cancer. N Engl J Med.
350:2343–2351. 2004. View Article : Google Scholar : PubMed/NCBI
|
|
21
|
Dongre A and Weinberg RA: New insights
into the mechanisms of epithelial-mesenchymal transition and
implications for cancer. Nat Rev Mol Cell Biol. 20:69–84. 2019.
View Article : Google Scholar : PubMed/NCBI
|
|
22
|
Alberts SR, Horvath WL, Sternfeld WC,
Goldberg RM, Mahoney MR, Dakhil SR, Levitt R, Rowland K, Nair S,
Sargent DJ and Donohue JH: Oxaliplatin, fluorouracil, and
leucovorin for patients with unresectable liver-only metastases
from colorectal cancer: A north central cancer treatment group
phase II study. J Clin Oncol. 23:9243–9249. 2005. View Article : Google Scholar : PubMed/NCBI
|
|
23
|
Argilés G, Tabernero J, Labianca R,
Hochhauser D, Salazar R, Iveson T, Laurent-Puig P, Quirke P,
Yoshino T, Taieb J, et al: Localised colon cancer: ESMO clinical
practice guidelines for diagnosis, treatment and follow-up. Ann
Oncol. 31:1291–1305. 2020. View Article : Google Scholar : PubMed/NCBI
|
|
24
|
Findlay VJ, Wang C, Watson DK and Camp ER:
Epithelial-to-mesenchymal transition and the cancer stem cell
phenotype: Insights from cancer biology with therapeutic
implications for colorectal cancer. Cancer Gene Ther. 21:181–187.
2014. View Article : Google Scholar : PubMed/NCBI
|
|
25
|
Chen Y, Liang W, Liu K and Shang Z: FOXD1
promotes EMT and cell stemness of oral squamous cell carcinoma by
transcriptional activation of SNAI2. Cell Biosci. 11:1542021.
View Article : Google Scholar : PubMed/NCBI
|
|
26
|
Li CH, Chang YC, Hsiao M and Liang SM:
FOXD1 and Gal-3 form a positive regulatory loop to regulate lung
cancer aggressiveness. Cancers (Basel). 11:18972019. View Article : Google Scholar : PubMed/NCBI
|
|
27
|
Zhao YF, Zhao JY, Yue H, Hu KS, Shen H,
Guo ZG and Su XJ: FOXD1 promotes breast cancer proliferation and
chemotherapeutic drug resistance by targeting p27. Biochem Biophys
Res Commun. 456:232–237. 2015. View Article : Google Scholar : PubMed/NCBI
|
|
28
|
Ombrato L, Nolan E, Kurelac I, Mavousian
A, Bridgeman VL, Heinze I, Chakravarty P, Horswell S,
Gonzalez-Gualda E, Matacchione G, et al: Metastatic-niche labelling
reveals parenchymal cells with stem features. Nature. 572:603–608.
2019. View Article : Google Scholar : PubMed/NCBI
|
|
29
|
Carstens MR, Fisher RC, Acharya AP,
Butterworth EA, Scott E, Huang EH and Keselowsky BG: Drug-eluting
microarrays to identify effective chemotherapeutic combinations
targeting patient-derived cancer stem cells. Proc Natl Acad Sci
USA. 112:8732–8737. 2015. View Article : Google Scholar : PubMed/NCBI
|
|
30
|
Wilson MM, Weinberg RA, Lees JA and Guen
VJ: Emerging mechanisms by which EMT programs control stemness.
Trends Cancer. 6:775–780. 2020. View Article : Google Scholar : PubMed/NCBI
|
|
31
|
Hirabayashi Y, Itoh Y, Tabata H, Nakajima
K, Akiyama T, Masuyama N and Gotoh Y: The Wnt/β-catenin pathway
directs neuronal differentiation of cortical neural precursor
cells. Development. 131:2791–2801. 2004. View Article : Google Scholar : PubMed/NCBI
|