Introduction
Ovarian cancer is a deadly gynecological cancer,
with a 5-year survival rate of 30–40% in the United States
(1,2). Ovarian serous carcinoma (OC) is the
most common histological subtype of ovarian cancer and accounts for
70–80% of ovarian cancer-related deaths (3,4).
Immunotherapy, an emerging field in tumor treatment, has achieved
therapeutic effects only in a small subset of patients with ovarian
cancer (5,6). Moreover, a previous study reported
that immunotherapy has better therapeutic efficacy in patients with
a pre-existing T-cell response against the tumor (7). However, although T-cell infiltration
exhibits a significant effect in situ, it is detected in
only ~50% of ovarian cancer tissues at diagnosis (8). CD8 T cells are major immune mediators
of tumor rejection, and it has been reported that CD8
tumor-infiltrating lymphocytes (TILs) are associated with a
favorable prognosis in OC (9).
Therefore, it is important to investigate the mechanisms of CD8
T-cell infiltration in OC, to identify new diagnostic biomarkers
for OC.
Signal transducer and activator of transcription 4
(STAT4) is a key mediator of pro-inflammatory immune responses and
affects several immune cells by mediating interleukin (IL)-12
signaling (10). For example, STAT4
mediates the induction of interferon-γ production in CD4, CD8,
natural killer cells and macrophages (11,12),
and stimulates the development of fully functional Th1 cells
(13). Considering its important
immune modulatory function, the role of STAT4 has also been studied
extensively in carcinogenesis. Previous studies have indicated that
high STAT4 expression is a prognostic factor for survival in breast
carcinoma, hepatic carcinoma and ovarian cancer (14–16).
Chemokines serve an important role in regulating
tumor immune cell infiltration. Previous studies have suggested
that the expression of several chemokines, including CC chemokine
ligand (CCL)2, CCL3, CCL4, CCL5, chemokine C-X-C ligand (CXCL)9 and
CXCL10, is associated with TIL recruitment in melanoma (17,18).
For example, CCL4 has been shown to have a key role in recruiting
BATF3-expressing dendritic cells (DCs), which affects T-cell
inflammation in melanoma (18,19).
In addition, tumors, such as ovarian cancer, express multiple
chemokines, which permit the infiltration of peripheral blood CD4
and CD8 T cells to the ovarian cancer site (20). Moreover, tumor cell-expressed CCL5,
and macrophage and DC-expressed CXCL9 have been shown to promote
T-cell infiltration at the ovarian cancer site (21).
The present study aimed to identify the potential
biomarkers affecting CD8 TILs and their role in OC prognosis, and
to further explore the underlying mechanisms.
Materials and methods
Clinical specimens and ethics
statement
Tissues were obtained from 25 patients with OC (age,
40–70 years; mean age, 53.6 years) between January and December
2020 from the Department of Obstetrics and Gynecology, Tongji
Hospital, Tongji Medical College (Wuhan, China). Patients who did
not provide consent were excluded. A total of 25°C tissues were
collected by surgery for immunohistochemical staining, whereas 16
surgically removed fresh OC tissues were frozen and stored at −80°C
for western blotting and reverse transcription-quantitative PCR
(RT-qPCR). Peripheral blood was obtained from three healthy female
donors (age, 20–40 years; mean age, 33.7 years) with an
unremarkable medical history between May 2 and May 5, 2021. The
collection and use of human samples in the present study was
approved by the Ethics Committee of Tongji Hospital (approval no.
TJ-IRB20190320).
Data acquisition
RNA-sequencing (RNA-seq) data were obtained from
TCGA-ovarian serous cystadenocarcinoma (OV) dataset (376 samples
from patients with OC; http://portal.gdc.cancer.gov/repository) and clinical
data were obtained from TCGA pan-cancer clinical data resource, a
standardized dataset developed by Liu et al (22). However, due to a lack of data
regarding disease-free interval (DFI; the time to recurrence from
first diagnosis) and/or progression-free interval (PFI; the period
from the date of diagnosis until the date of the first occurrence
of a new tumor event) for all patients, the numbers of patients
with DFI and/or PFI data were less than the numbers of patients
with overall survival (OS; the date of diagnosis to the date of
death from any cause), disease-specific survival (DSS; defined as
death from the diagnosed cancer type; Liu et al combined the
fields of ‘tumor_status’ with ‘vital status’ to derive a surrogate
for DSS, by approximating ‘Dead’ and ‘With Tumor’ as a DSS event)
data. The microarray data were obtained from the GSE53963
(https://www.ncbi.nlm.nih.gov/geo/query/acc.cgi?acc=GSE53963)
(23), GSE32062 (https://www.ncbi.nlm.nih.gov/geo/query/acc.cgi?acc=GSE32062)
(24) and GSE130571 (https://www.ncbi.nlm.nih.gov/geo/query/acc.cgi?acc=GSE130571)
(21) datasets from the GEO
database.
Differentially expressed gene (DEG)
analysis
Gene expression values from TCGA-OV database were
expressed as transcripts per million. The RNA-seq data
corresponding to recurrent tumors, based on TCGA-OV annotation,
were excluded from the present study for the following reasons.
Firstly, a comparison of primary and relapsed tumors has shown that
specific molecular alterations can appear in the relapsed tumors
(25,26). Moreover, Sun et al (27) found a significant difference in the
immune microenvironments of recurrent and primary hepatocellular
carcinoma cases, suggesting that the immune microenvironment may
also differ between primary and recurrent tumors in OC. Secondly,
since TCGA database focuses on primary tumors, there were only a
few recurrent tumor samples (n=5) to conduct a reliable analysis.
Subsequently, quanTIseq and MCP-counter in R script were used to
quantify the relative proportions of infiltrating CD8 T cells
(28,29). Thereafter, the optimal cutoff point
(0.3) was determined using the R package ‘survminer’ (https://cran.r-project.org/package=survminer) and all
of the patients were classified into CD8 T cell high- and low-score
groups, based on this cutoff value. The DEGs in the high- and
low-score groups were determined using DESeq2 (https://bioconductor.org/packages/release/bioc/html/DESeq2.html)
at |log2 fold change|>1 and Benjamini-Hochberg-adjusted
P<0.05.
Construction of a protein-protein
interaction (PPI) network and identification of hub genes
The Search Tool for the Retrieval of Interacting
Genes/Proteins (STRING) database was used to build a PPI network of
DEGs (30) and a confidence score
of ≥0.4 was used as the cutoff standard. To identify specific
functional genes, the top 90 overlapping genes were screened using
12 different methods, Maximal Clique Centrality, Density of Maximum
Neighborhood Component, Maximum Neighborhood Component, Edge
Percolated Component, Degree, Stress, BottleNeck, Closeness,
EcCentricity, Radiality, Betweenness and ClusteringCoefficient,
based on the Cytoscape plug-in cytoHubba (https://apps.cytoscape.org/apps/cytohubba).
Functional enrichment analysis
Gene Ontology Biological Process (GOBP) term and
Kyoto Encyclopedia of Genes and Genomes (KEGG) pathway analyses
were conducted using the ‘clusterProfiler’ package (31). The false discovery rate <0.05 was
set as the cut-off value. Gene Set Enrichment Analysis (GSEA) was
performed to further determine the KEGG pathways and GOBP terms
that were correlated with STAT4 expression. The genes were
ranked according to their Spearman correlation with STAT4
expression levels, and the genes with an absolute value of
correlation coefficients |rho|>0.3 and P<0.05 were
selected.
Immunohistochemistry (IHC)
The OC tissues were fixed in 4% paraformaldehyde for
24 h at room temperature, embedded in paraffin, and cut into 4-µm
sections for immunohistochemical analysis using rabbit/mouse
streptavidin-peroxidase kits (cat. nos. SP-9001/SP-9002; OriGene
Technologies, Inc.) according to the manufacturer's instructions.
Antigen retrieval was performed with EDTA buffer (pH 9) at 95°C for
10 min, after which, the sections were washed with PBS followed by
the addition of 3% H2O2 at 37°C for 30 min to
remove endogenous peroxidase. After sufficient washing with PBS,
the sections were incubated with 5% BSA (cat. no. G5001; Wuhan
Servicebio Technology Co., Ltd) for 30 min at 37°C. Subsequently,
the sectioned tissues were incubated with primary antibody at 4°C
overnight. The following antibodies were used: CD8A (1:2,000; cat.
no. ab245118; Abcam), STAT4 (1:200; cat. no. 13028-1-AP;
Proteintech Group, Inc.) and CCL5 (1:50; cat. no. A5630; Abclonal
Biotech Co., Ltd.). Staining was visualized using DAB (cat. no.
ZLI-9019; OriGene Technologies, Inc.) and counterstaining was
performed with hematoxylin for 1 min at room temperature. The
staining was captured under a light microscope (Olympus
Corporation). For STAT4 and CCL5, the histochemistry score
(H-Score) was calculated as follows: H-Score=(% cells of weak
intensity ×1) + (% cells of moderate intensity ×2) + (% cells of
strong intensity ×3) (32). For
CD8A, the number of positive cells was counted in five random
fields of view under a ×20 magnification to calculate the mean
number of positive cells.
Cell culture and transfection
The OVCAR8, HOC7, SKOV3 and CAOV3 (serous
adenocarcinoma) human ovarian cancer cell lines were obtained from
the American Type Culture Collection. OVCAR8 cells were cultured in
RPMI-1640 (cat. no. 11875119; Gibco; Thermo Fisher Scientific,
Inc.) supplemented with 10% FBS (cat. no. 16140089; Gibco; Thermo
Fisher Scientific, Inc.), HOC7 cells were cultured in DMEM (cat.
no. 11965092; Gibco; Thermo Fisher Scientific, Inc.) supplemented
with 10% FBS, SKOV3 cells were cultured in McCoy's 5A (cat. no.
16600082; Gibco; Thermo Fisher Scientific, Inc.) supplemented with
10% FBS, and CAOV3 cells were cultured in RPMI-1640 supplemented
with 20% FBS. All cells were maintained in a humidified atmosphere
containing 5% CO2 at 37°C. OVCAR8 and CAOV3 cells were
seeded in six-well plates at a density of 60–70% confluence, then
transfected with control small interfering RNA (siRNA)
(non-targeting sequence: 5′-TTCTCCGAACGTGTCACGT-3′), human
STAT4 siRNA_1 (targeting sequence:
5′-GCCTGACCATAGATTTGGA-3′) or human STAT4 siRNA_2 (targeting
sequence: 5′-AACGGCTGTTGCTAAAGGA-3′) (all 50 nM; Guangzhou RiboBio
Co., Ltd.) using Lipofectamine® 3000 reagent
(Invitrogen; Thermo Fisher Scientific, Inc.) according to the
manufacturer's instructions. After 24 h, the medium was replaced
with fresh culture medium and to the cells were cultured for
another 48 h in a humidified atmosphere containing 5%
CO2 at 37°C. The cells were then collected and knockdown
efficiency was verified using western blot analysis and
RT-qPCR.
RNA isolation and RT-qPCR
Total RNA was extracted from OC tissues or cells
using the Total RNA kit (cat. no. RC101; Vazyme Biotech Co., Ltd.)
according to the manufacturer's instructions. For all samples, RNA
was then reverse transcribed into cDNA using HiScript II Q RT
SuperMix (cat. no. R223-01; Vazyme Biotech Co., Ltd.) according to
the manufacturer's protocol. Subsequently, cDNA levels were
quantified using SYBR Green qPCR (cat. no. Q711; Vazyme Biotech
Co., Ltd.) in triplicate. Each sample was amplified and normalized
to the housekeeping gene GAPDH, and the relative fold change of
mRNA expression was measured using the 2−ΔΔCq method
(33). The primer sequences were as
follows: Human CD8A, forward 5′-TCCATCATGTACTTCAGCCACTT-3′ and
reverse 5′-GGTGATAACCAGTGACAGGAGAA-3′; human STAT4, forward
5′-CTCAGAGGCCGTTGGTACTTAAA-3′ and reverse
5′-TCCTTTGGTTGCAAATGTCGAAAT-3′; human CCL5, forward
5′-CGTGCCCACATCAAGGAGTATTT-3′ and reverse
5′-TTGATGTACTCCCGAACCCATTT-3′; and human GAPDH, forward
5′-GGAGTCCACTGGCGTCTTCA-3′ and reverse
5′-GTCATGAGTCCTTCCACGATACC-3′. qPCR was performed using a qPCR
instrument (Bio-Rad Laboratories, Inc.) and the cycling conditions
were as follows: 3 min at 95°C for polymerase activation, followed
by 45 cycles at 95°C for 15 sec, 60°C for 30 sec and 72°C for 30
sec, and fluorescence collection at 95°C for 15 sec.
Western blot analysis
Total proteins were extracted from cells and tissues
using the ExKine Total Protein Extraction Kit (cat. no. KTP3006;
Abbkine Scientific Co., Ltd.) and the extracted proteins were
quantified using the BCA protein analysis kit (cat. no. G2026-200T;
Wuhan Servicebio Technology Co., Ltd.) according to the
manufacturer's protocol. Equal amounts of protein (20 µg) from each
sample were loaded into each lane and separated by SDS-PAGE on a
10% gel. Subsequently, proteins were transferred to PDVF membranes.
After being blocked with 5% BSA, the membranes were incubated with
specific antibodies overnight. The following primary antibodies
were used: CD8A (1:5,000; cat. no. 66868-1-lg; Proteintech Group,
Inc.), STAT4 (1:600; cat. no. 13028-1-AP; Proteintech Group, Inc.),
CCL5 (1:1,000; cat. no. A5630; Abclonal Biotech Co., Ltd.), GAPDH
(1:50,000; cat. no. 60004-1-Ig; Proteintech Group, Inc.) and
β-actin (1:50,000; cat. no. 81115-1-RR; Proteintech Group, Inc.).
The membranes were then incubated with HRP-conjugated goat
anti-rabbit IgG/anti-mouse IgG (1:5,000; cat. no. Ant020/Ant019;
Antgene) for 1 h at room temperature. Finally, blots were
visualized using the western blotting detection kit WesternBright
ECL (cat. no. K-12045-D50; Advansta, Inc.). GAPDH and β-actin were
used as loading controls. Protein semi-quantification was performed
using ImageJ software (v1.49p; National Institutes of Health).
ELISA
Cell supernatants were collected 48 h after
transfection, and CCL5 levels were measured using a CCL5 ELISA kit
(cat. no. RK00077; Abclonal Biotech Co., Ltd.), according to the
manufacturer's instructions. The results were obtained using a
microplate reader (Bio-Rad Laboratories, Inc.) set to 450 nm, and
the readings were corrected at 570 nm. Since the ELISA kit was
designed for serum, plasma and cell culture supernatant samples,
the components of a more complex ovarian cancer homogenate may
interfere with CCL5 quantification by ELISA. For example, matrix
components often interfere with sample analysis and affect the
accuracy of the results (34).
Therefore, to detect CCL5 content, ELISA was used for cellular
experiments and western blot analysis was used for fresh-frozen
tissue samples.
Chemotaxis assay
To assess lymphocyte migration, peripheral blood
lymphocytes were isolated from healthy donors by gradient
centrifugation (1,000 × g for 20 min) at room temperature, then
stimulated with 5 µg/ml anti-CD3 (cat. no. BE0001-2; Bio X Cell)
and anti-CD28 (cat. no. 40-0289; Cytek Biosciences) for 2 days at
37°C, after which, the cells were cultured in the presence of 20
ng/ml recombinant human IL-2 (cat. no. 200-02; PeproTech, Inc.) for
5 days at 37°C. Thereafter, 80,000 lymphocytes were resuspended in
150 µl RPMI-1640 and placed in the top well of a Transwell
migration chamber (pore size, 5 µm; Corning, Inc.). CAOV3 cells
transfected with control siRNA or human STAT4 siRNA were
seeded 24 h earlier in the bottom well of the Transwell migration
chamber. CD8 T cells that migrated to the bottom chamber were
evaluated after 24 h by flow cytometry. The cells in the bottom
chamber were collected, washed with PBS and then incubated with
allophycocyanin-conjugated anti-human CD8A antibodies (5 µl/test;
cat. no. 300911; BioLegend, Inc.) on ice for 20 min. The samples
were collected and analyzed by flow cytometry (FACSCalibur; BD
Biosciences) and CytExpert (v2.4.0.28; Beckman Coulter, Inc.) were
used for data analyses. I results were expressed as chemotactic
index, which was defined as the ratio of cell migration towards the
medium of cells transfected with human STAT4 siRNA compared
with control siRNA.
Statistical analysis
In the present study, the optimal cutoff values of
CD8 T cells or gene expression were determined using the R package
‘survminer’ based on the correlation with patient survival.
Survival analysis by Kaplan-Meier was performed using survminer R
packages and the P-value of each Kaplan Meier-plot was calculated
by log-rank test. Individuals with <30 days follow-up were
excluded to remove the potential bias associated with treatment
effects, as a short follow-up period can lead to an overestimation
of OS/progression-free survival (35). Survival analysis was also carried
out on the Kaplan-Meier plotter website (https://kmplot.com). Cox univariate and multivariate
regression analyses were conducted to evaluate the effects of
variables on survival. Unpaired Student's t-test was used for
comparisons between two groups, whereas one-way ANOVA with Tukey's
post hoc test was used for comparisons between multiple groups.
Correlation coefficients were evaluated by Spearman analyses. The R
package ggplot2 (https://ggplot2.tidyverse.org/) was used to map the
relationship between STAT4 and chemokine genes expression
levels. All statistical analyses were conducted using GraphPad
Prism software (v8.3.0; Dotmatics) or R software (v4.0.3;
http://www.r-project.org/). All
experiments were carried out in triplicate and data are expressed
as the mean ± SD. P<0.05 was considered to indicate a
statistically significant difference.
Results
Association of CD8 TILs with survival
in patients with OC
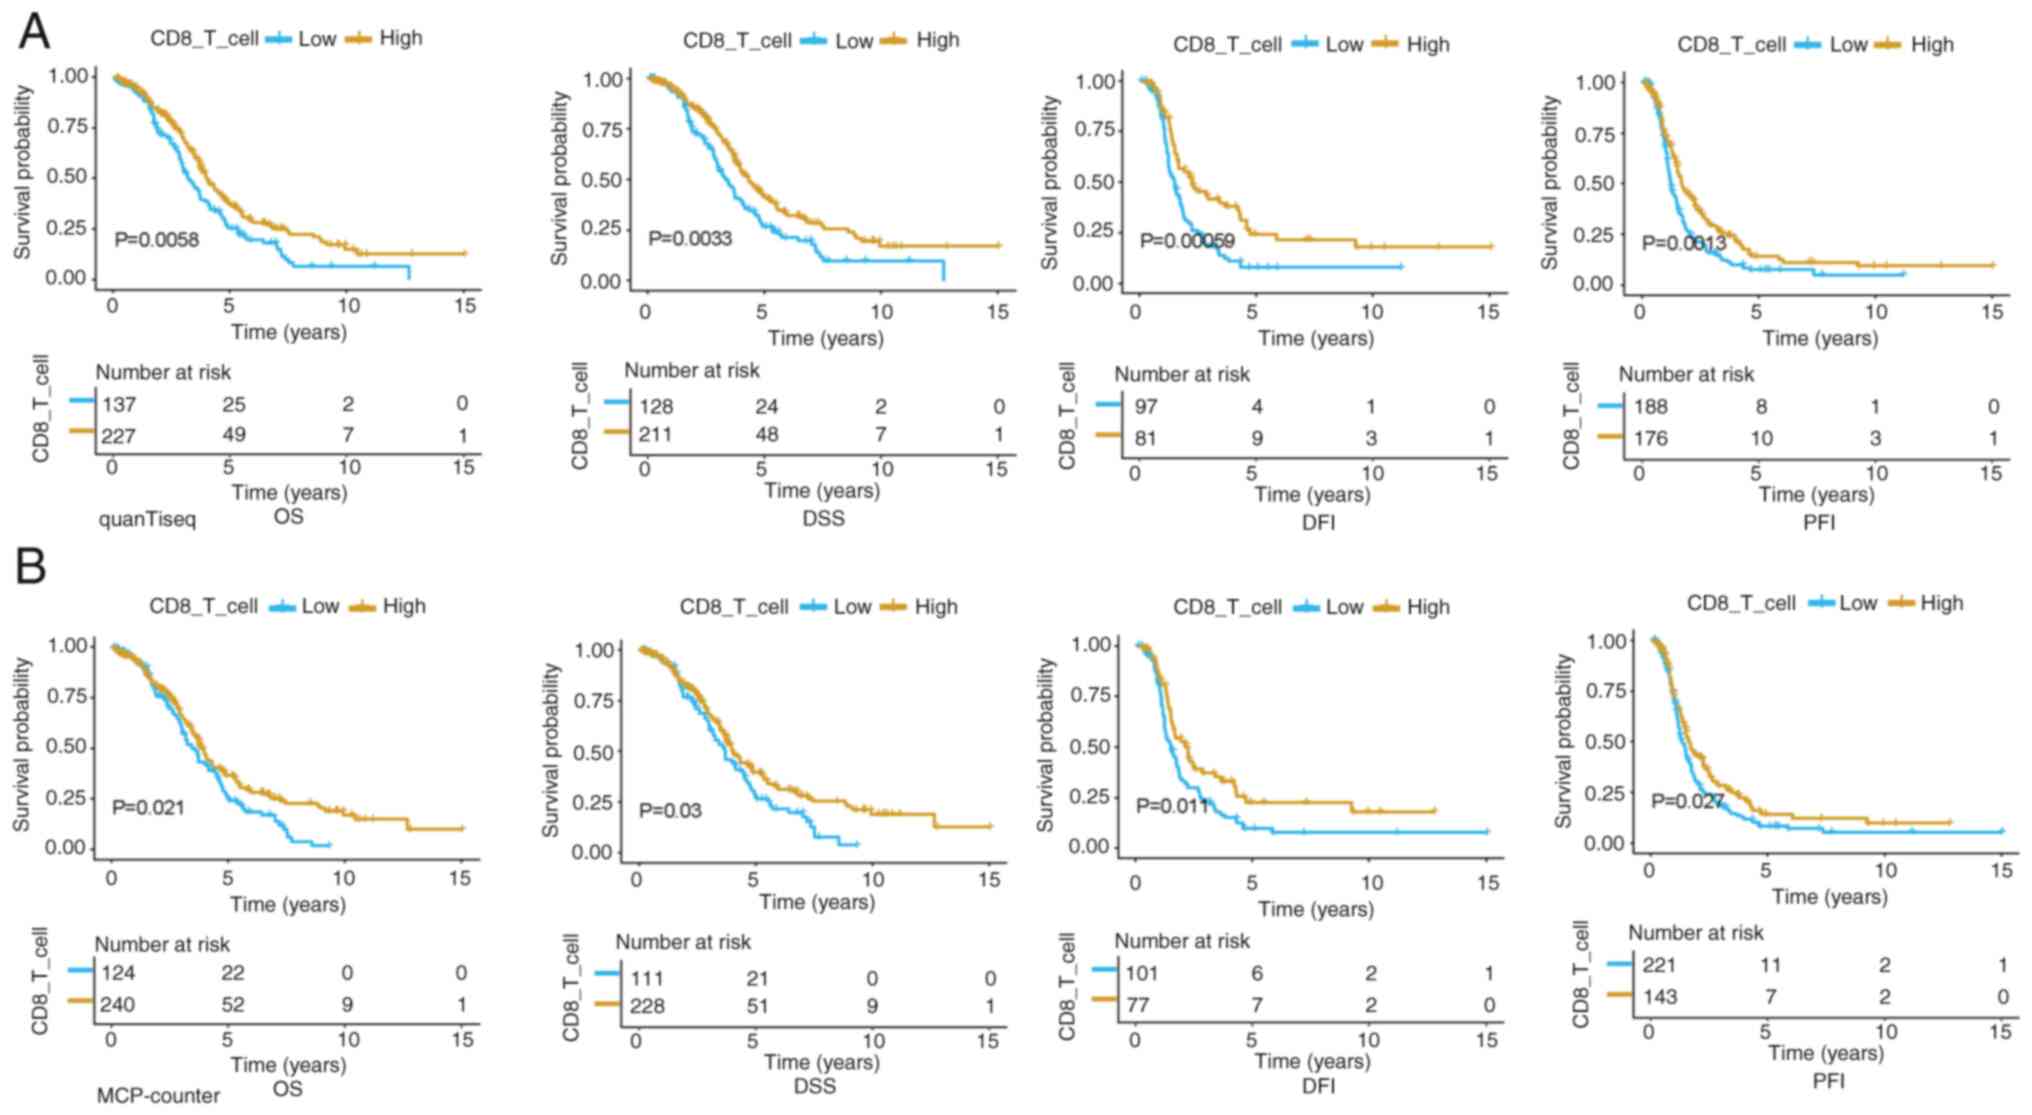
The present study evaluated the immune populations
in TCGA-OV dataset using both quanTIseq and MCP-counter algorithms
to enhance accuracy. The quanTIseq algorithm predicted the
composition of 10 immune cell types in OC tissues, whereas the
MCP-counter algorithm quantified the abundance of eight immune cell
types and two stromal cell types (cancer associated fibroblasts and
endothelial cell) in OC tissues (Fig.
S1A and B). Thereafter, all of the patients were classified
into high- and low-score groups based on the average CD8 T-cell
infiltration score (cutoff values: quanTIseq, 0.0027; MCP-counter,
0.3526). Survival time data were obtained from TCGA pan-cancer
clinical data resource (22) and
Kaplan-Meier survival curve analysis was used to evaluate the
prognostic impact of CD8 T-cell infiltration in OC. Consistent with
the previous analysis (9), the
results revealed that high CD8 T-cell scores were significantly
associated with a better prognosis of patients with OC (Fig. 1A and B).
Identification of CD8 T-cell
infiltration-related genes in OC
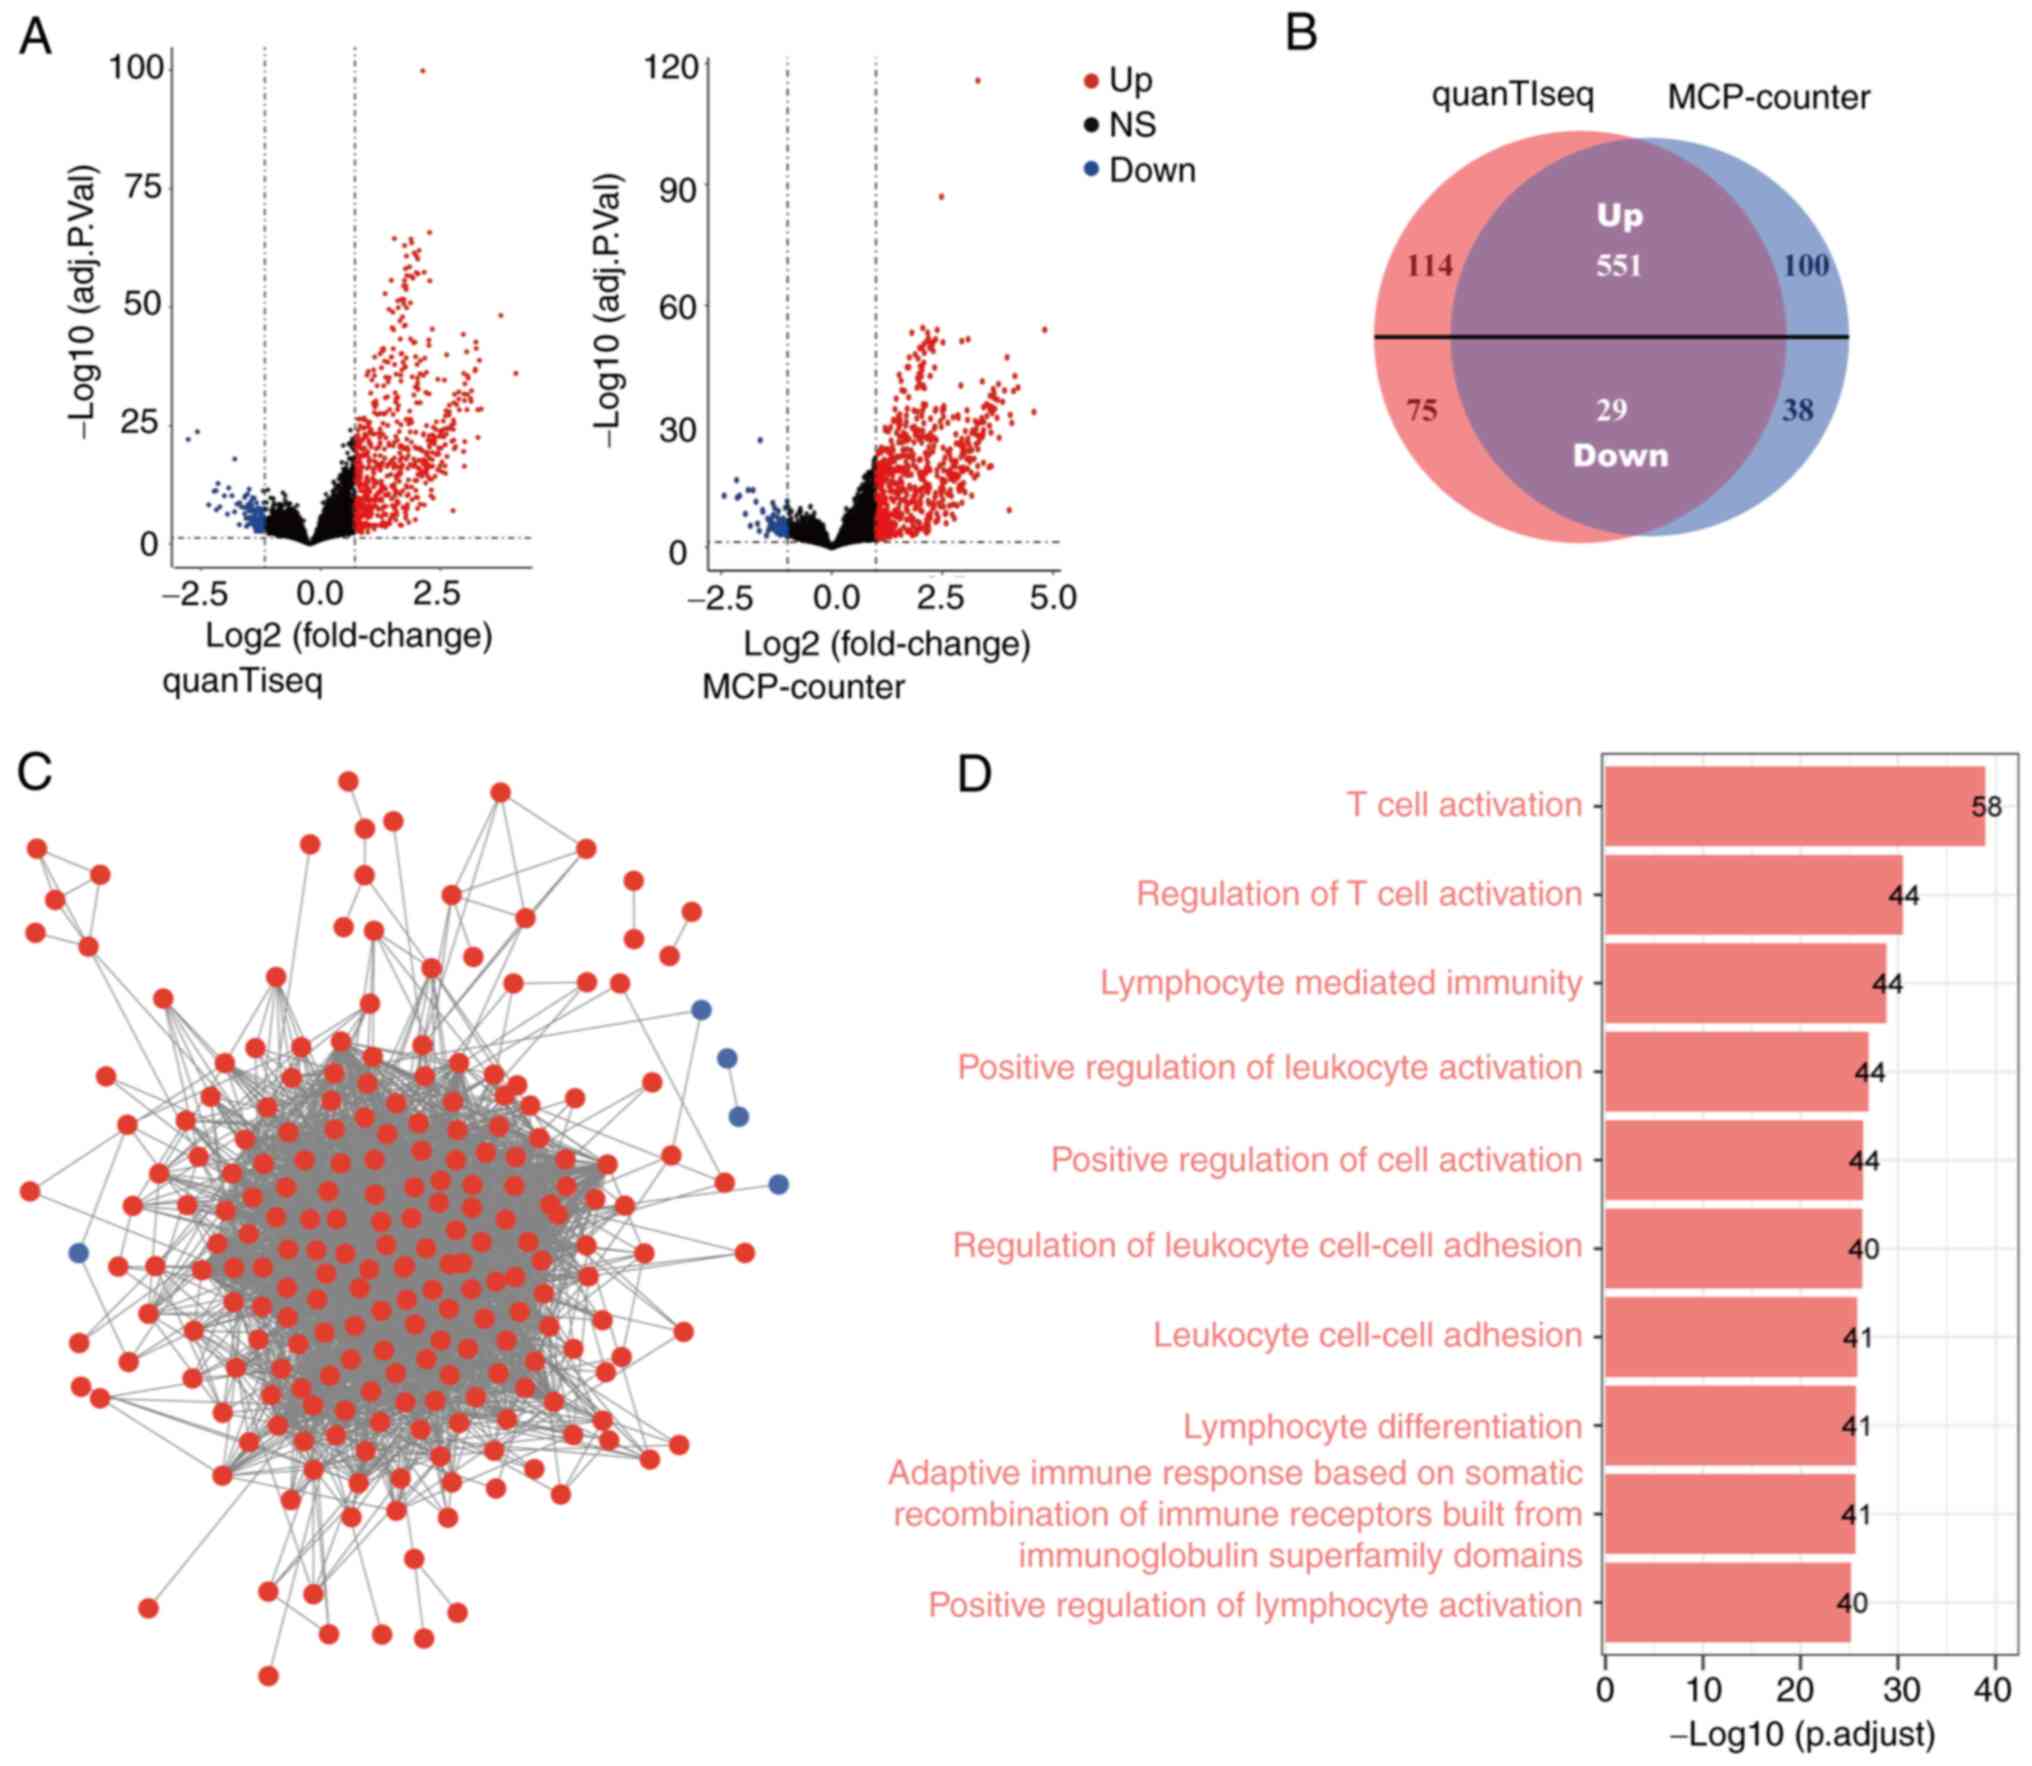
Patients were classified into high and low CD8
T-cell score groups according to the results of the quanTIseq and
MCP-counter algorithms. Subsequently, differential gene expression
analysis was performed to identify DEGs between the high and low
CD8 T-cell score groups. There were 665 significantly upregulated
genes and 104 significantly downregulated genes in the high CD8
T-cell score group identified by the quanTIseq algorithm.
Similarly, 651 genes were upregulated and 67 genes were
downregulated according to the MCP-counter algorithm (Fig. 2A). The overlapping genes (551
upregulated and 29 downregulated) in the two groups were selected
as candidate genes for further analysis (Fig. 2B). To determine the association
between the candidate DEGs and CD8 T-cell infiltration in OC, a PPI
network was constructed with 228 nodes (223 upregulated and five
downregulated nodes) using the STRING database and it was
visualized using Cytoscape (Fig.
2C). Finally, the GOBP enrichment analysis of the 228 nodes was
conducted to determine their associated molecular mechanisms. As
shown in Fig. 2D, these nodes were
found to be primarily associated with ‘T cell activation’, which is
consistent with the biological role of CD8 TILs.
STAT4 is a potential marker of CD8
T-cell infiltration in OC
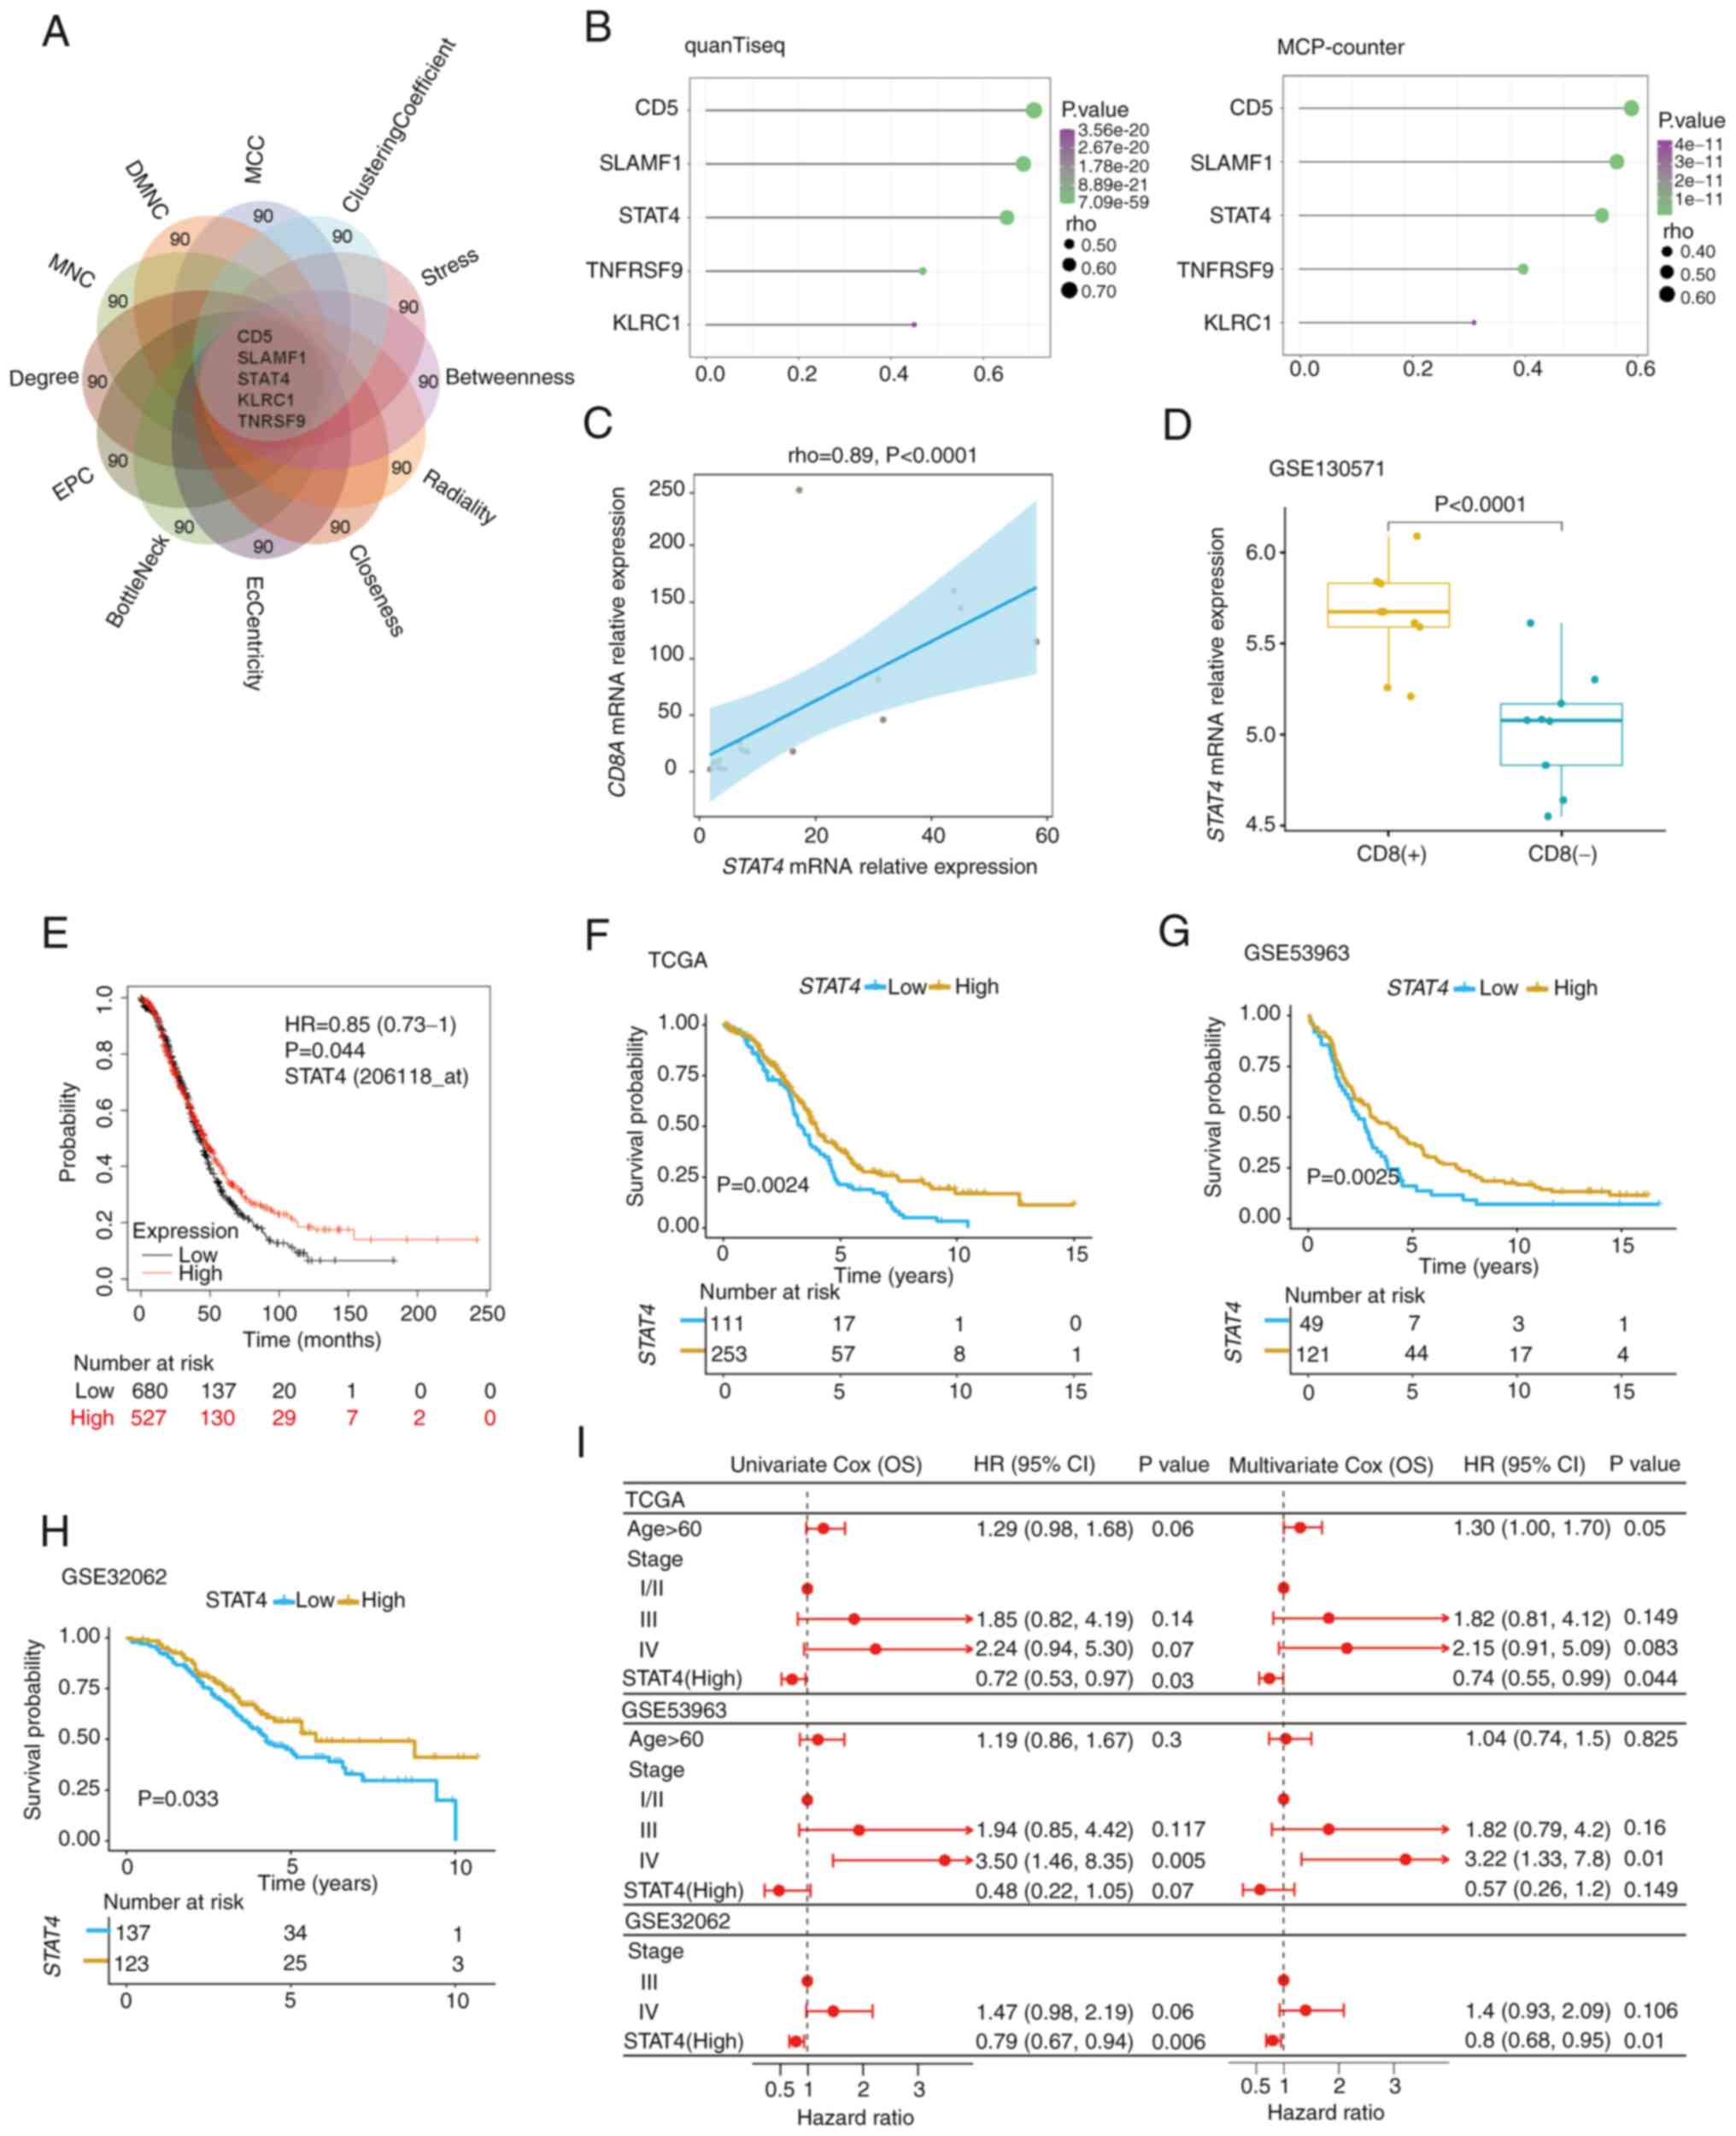
The top 90 overlapping hub genes in the PPI network
were first analyzed using twelve algorithms from the CytoHubba
plug-in, after which a flower plot was created to determine
significant hub genes shared across all of the groups; ultimately,
a list of five genes was identified (Fig. 3A). To further determine the
relationship between these five genes and CD8 T-cell infiltration,
the Spearman correlation coefficients between their gene expression
values and CD8 T-cell scores were calculated, and three key genes
(CD5, SLAMF1 and STAT4) with a Spearman correlation
coefficient ≥0.5 were identified (Fig.
3B). Previous studies have reported that CD5 and
SLAMF1 are widely expressed on cells within the
hematopoietic system and are closely associated with T-cell
activation (36–38); therefore, these were not pursued
further in the present study. Whereas STAT4 was highly
correlated with CD8 T-cell infiltration and has rarely been
reported to be involved in tumor immune cell infiltration (39). Analysis of TCGA-OV database revealed
that CD8A expression was significantly correlated with CD8
T-cell infiltration level (Fig.
S2) and thus may be used as a marker gene for quantifying CD8
TILs (21). In addition, the
results confirmed the positive correlation between CD8A and
STAT4 expression in an independent set of 16 OC specimens
using RT-qPCR analysis (Fig. 3C).
Moreover, similar results were obtained in the xenografts of the
mouse ovarian cancer cell line ID8 (GSE130571); STAT4
expression was significantly increased in tumors with CD8 T-cell
infiltration compared with in those lacking CD8 TILs (Fig. 3D). The present study further
assessed the association of STAT4 expression levels with age
and the clinical stage of OC, and revealed that age was not
associated with STAT4 expression levels (Fig. S3A); however, STAT4
expression was elevated in early-stage patients (I/II) compared
with in advanced-stage patients (III/IV), although the difference
was not statistically significant (Fig. S3B). This was possibly because the
majority of the samples were obtained from the patients with
advanced stage OC (>94%). Subsequent Kaplan-Meier survival
curves of Kaplan-Meier plotter database, TCGA, GSE53963 and
GSE32062 datasets revealed that patients with high STAT4
expression had a significantly better prognosis than those with low
STAT4 expression in patients with OC (Fig. 3E-H). Similar findings were observed
in the univariate Cox regression analysis and STAT4
expression was significantly associated with survival in TCGA and
GSE32062. Multivariate Cox regression analysis of TCGA, GSE53963
and GSE32062 data [hazard ratio=0.74, 0.57 and 0.8; 95% confidence
interval=0.55-0.99, 0.26-1.2 and 0.68-0.95; P=0.044, 0.149 and
0.01, respectively; Fig. 3I)
revealed that high STAT4 expression may serve as an
independent biomarker for a favorable prognosis. Therefore,
STAT4 was chosen as the candidate gene for further
analyses.
STAT4 is strongly associated with CCL5
in OC
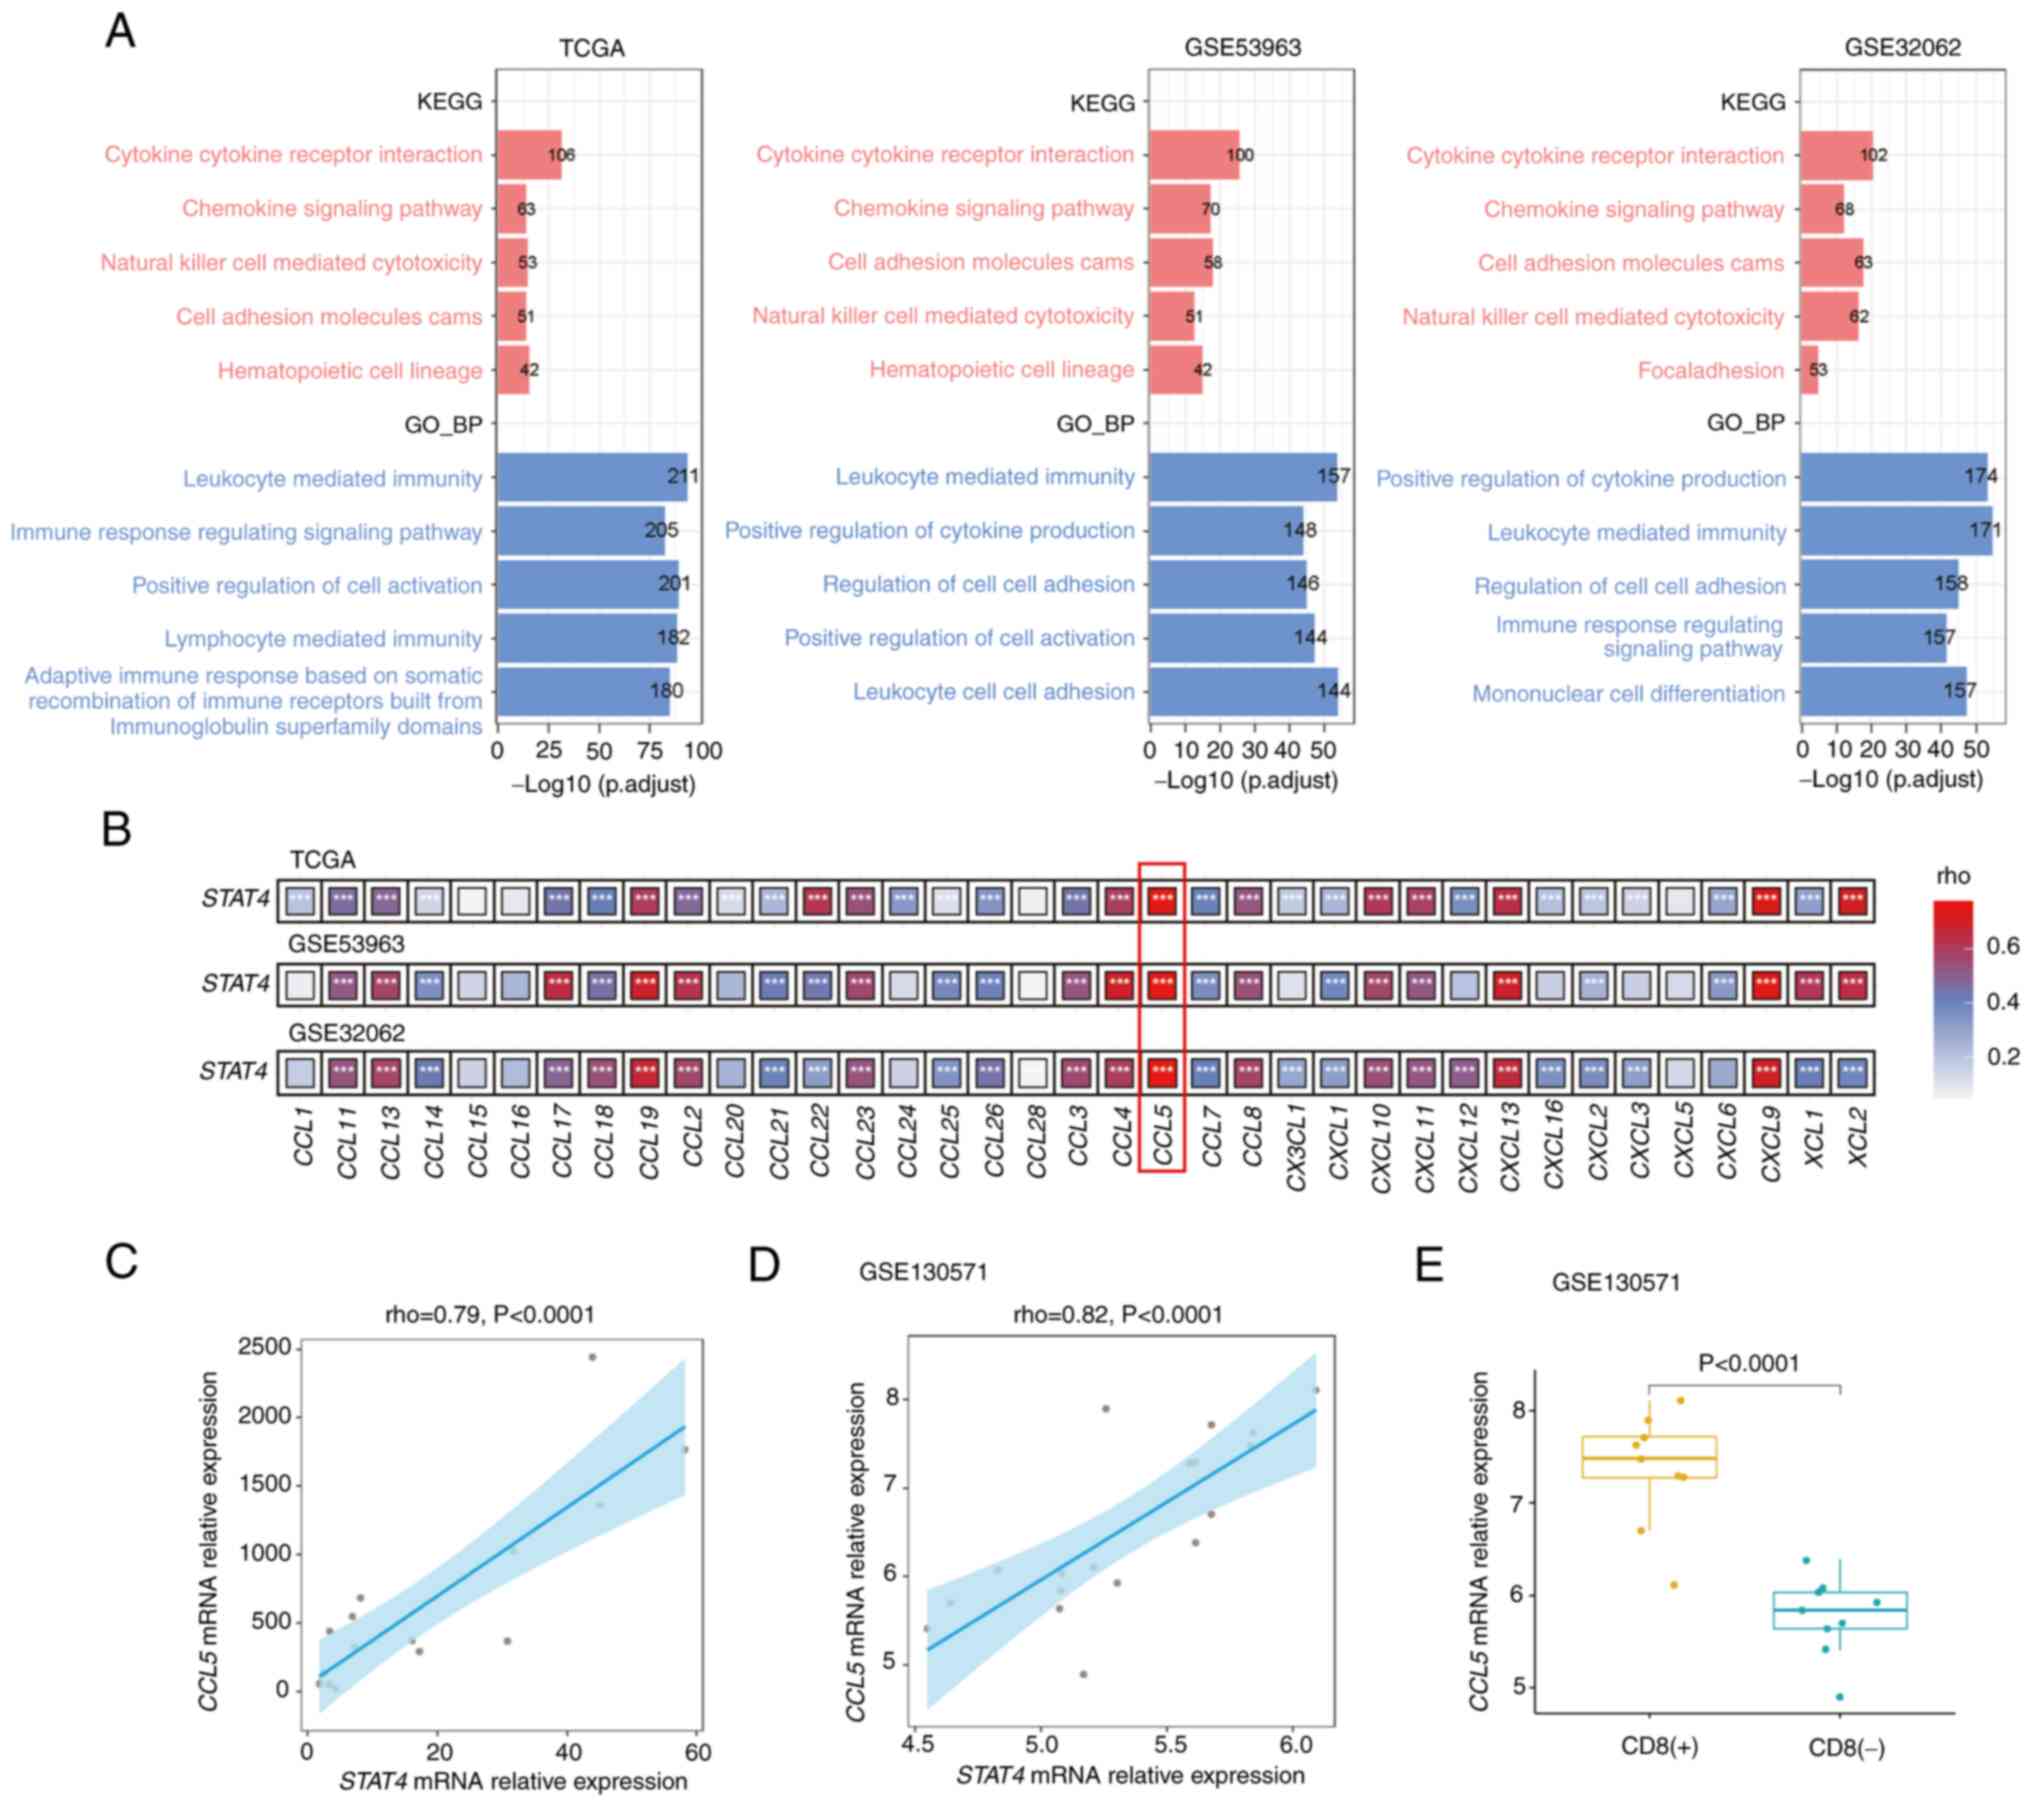
KEGG and GO analyses were performed to determine the
biological functions of the STAT4-associated genes in OC.
Firstly, TCGA, GSE53963 and GSE32062 datasets were screened to
obtain 2,100, 1,907 and 2,197 STAT4-associated genes,
respectively (|rho|>0.3 and P<0.05). GOBP analysis revealed
that these STAT4-associated genes were mostly involved in
‘leukocyte-mediated immunity’ and ‘positive regulation of cytokine
production’. The KEGG pathway analysis revealed that these genes
were associated with ‘cytokine-cytokine receptor interaction’ and
‘chemokine signaling pathway’ (Fig.
4A). Furthermore, GSEA demonstrated a clear positive
correlation between STAT4 expression and the aforementioned
processes (Fig. S4A-D). These
findings suggested that STAT4 may be involved in the
production of cytokines, especially chemokines. Therefore, the
present study further assessed the relationship between
STAT4 and chemokines, and revealed that STAT4 was
positively correlated with chemokines in all three datasets.
Notably, these data all showed that STAT4 was most
significantly correlated with CCL5 (Fig. 4B). Further RT-qPCR analysis of
CCL5 and STAT4 in an independent set of 16 OC
specimens revealed a positive correlation between the two genes
(Fig. 4C). Similarly, a positive
correlation was also observed in the ID8 tumor tissues (GSE130571)
(Fig. 4D). Moreover, the expression
of STAT4 was significantly higher in tumors with CD8 T-cell
infiltration compared with in those lacking CD8 T cells (Fig. 4E).
STAT4, CCL5 and CD8 T-cell
infiltration are closely associated in OC
Dangaj et al (21) reported that CD8 T-cell infiltration
required tumor cell-derived CCL5. Consistently, the present study
observed that CCL5 expression was significantly positively
correlated with CD8 T-cell infiltration level in TCGA-OV dataset
(Fig. S5A and B). Similar results
were also observed between CD8A and CCL5 by RT-qPCR
analysis of 16 OC specimens (Fig.
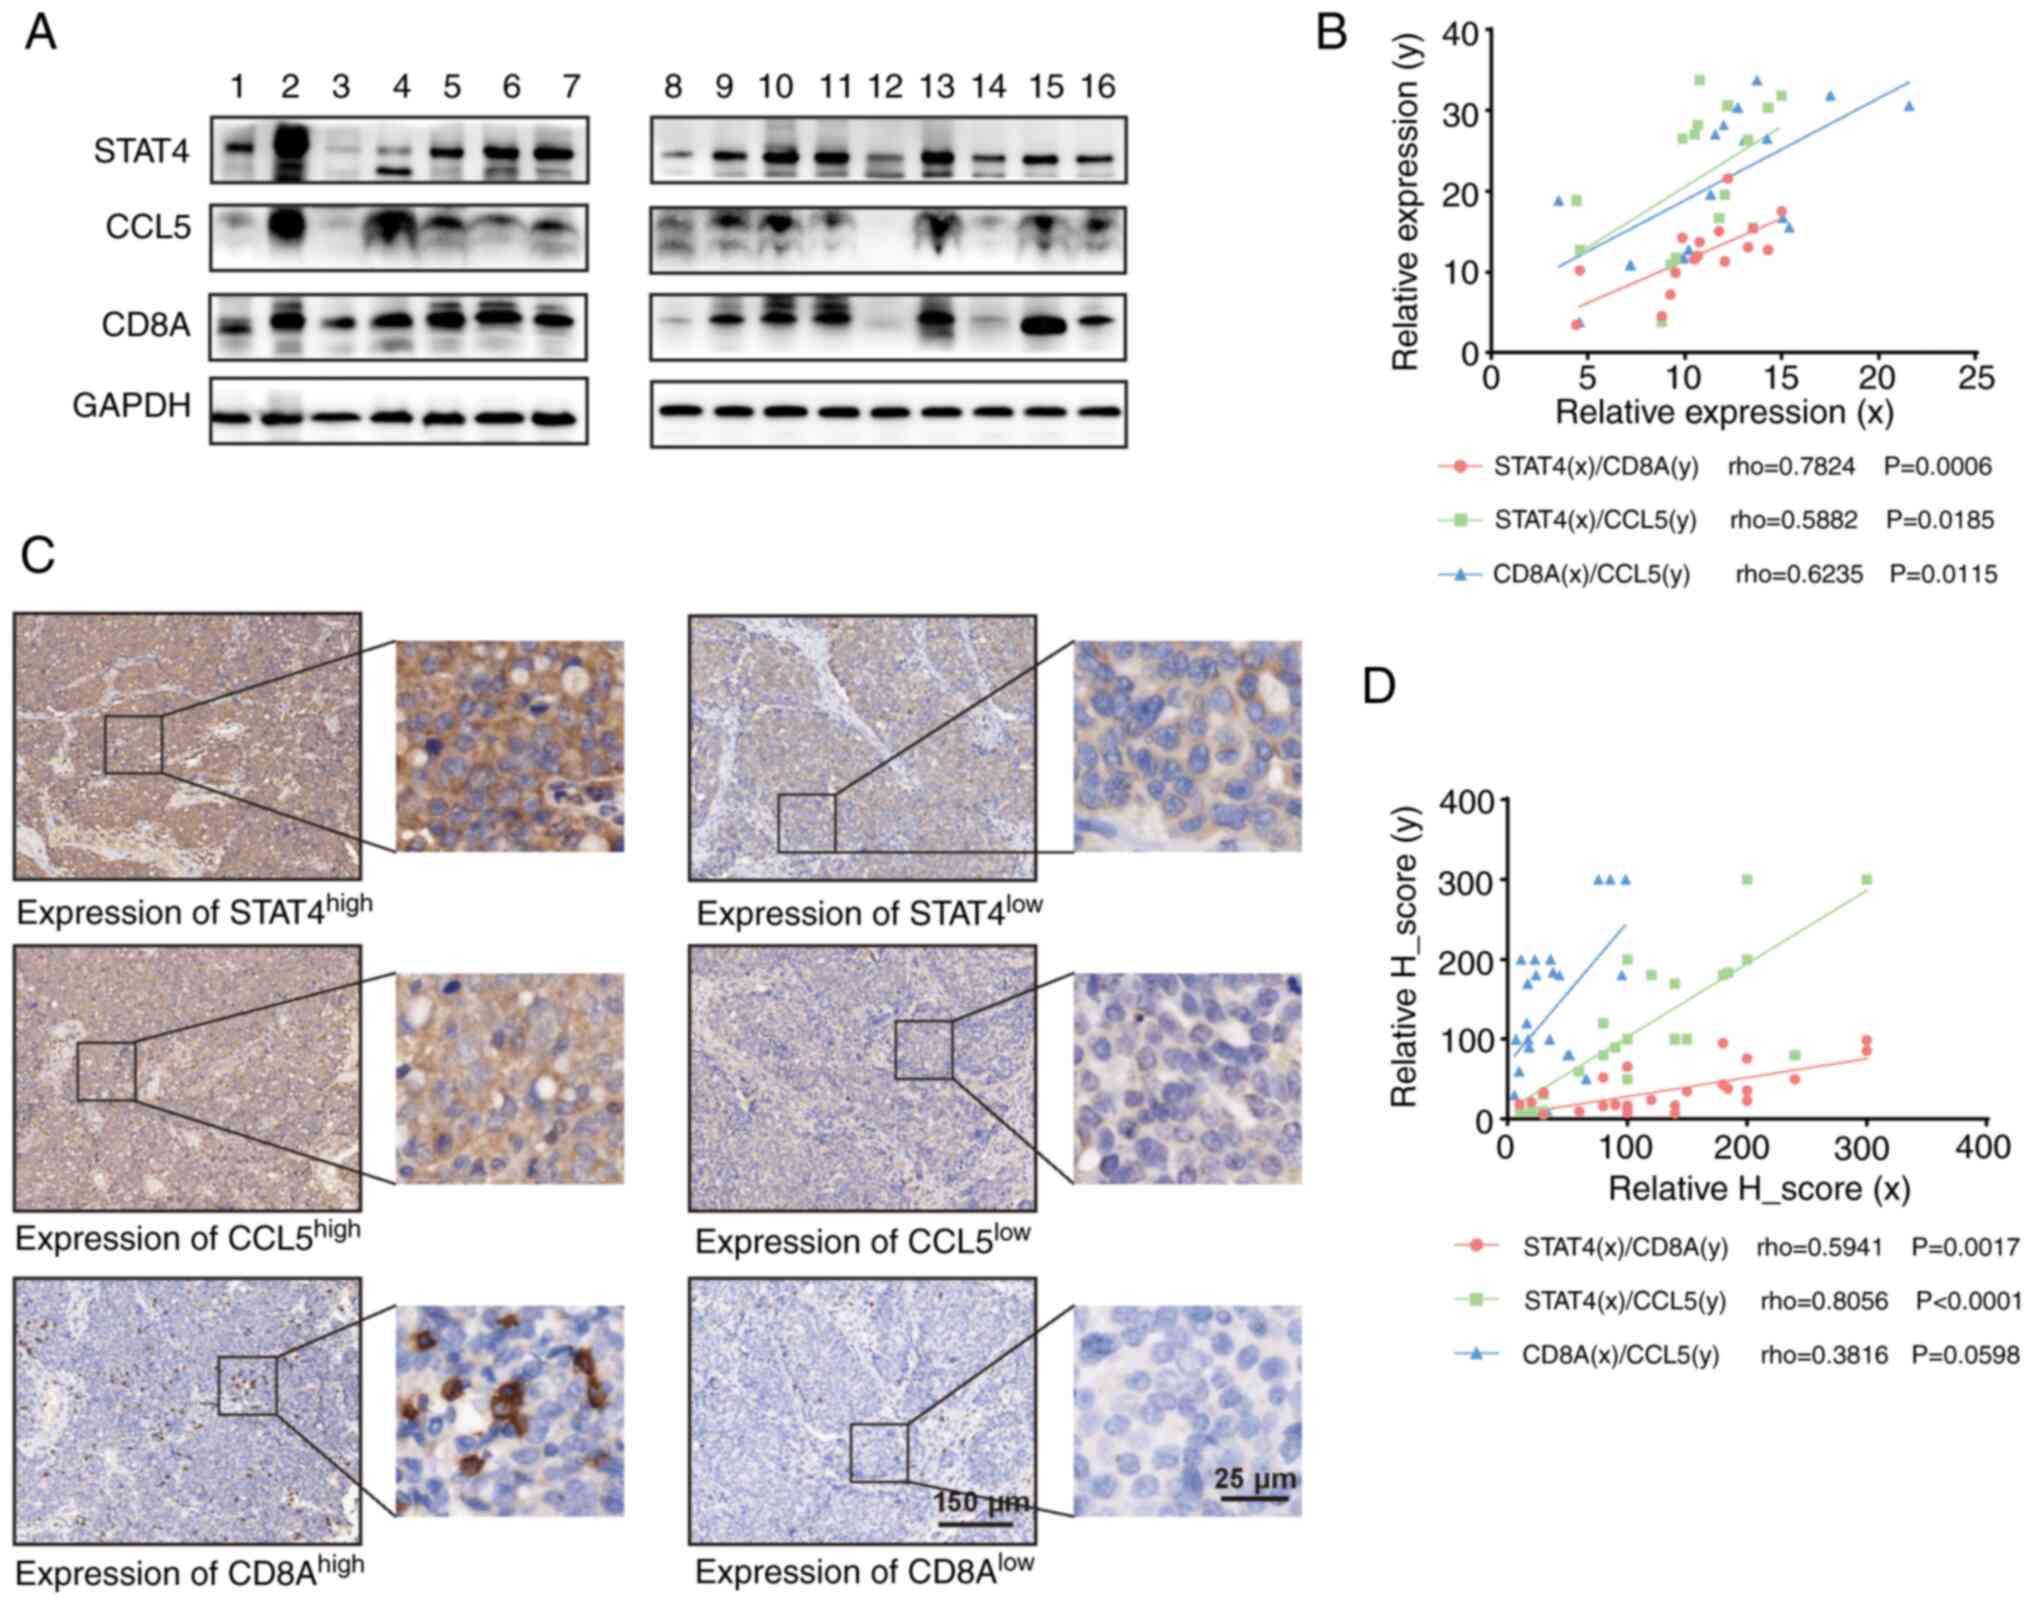
S5C). Furthermore, western blot analysis revealed that the
protein expression levels of STAT4, CCL5 and CD8A in OC specimens
were positively correlated with each other (Fig. 5A and B). In addition, IHC analysis
of STAT4, CCL5 and CD8A in OC specimens revealed that STAT4 and
CCL5 were highly expressed in OC tissues, and that STAT4 was
significantly correlated with CD8A and CCL5. Additionally, there
was a correlation between CD8A and CCL5, although not statistically
significant (Fig. 5C and D). Based
on these results, we hypothesized that STAT4 may influence CD8
T-cell infiltration in OC by regulating CCL5 expression.
STAT4 promotes CD8 T-cell migration by
inducing CCL5 secretion
To confirm whether STAT4 induces CCL5 secretion, the
expression levels of STAT4 and CCL5 were examined in
four ovarian cancer cell lines (HOC7, SKOV3, CAOV3 and OVCAR8). The
results revealed that the expression levels of STAT4 were
low in the HOC7 cell line, but high in SKOV3, OVCAR8 and CAOV3 cell
lines, especially in the SKOV3 cell line. Additionally, the
expression levels of CCL5 were low in the HOC7 and SKOV3 cell
lines, but were higher in the OVCAR8 and CAOV3 cell lines, with the
highest expression in the CAOV3 cell line (Fig. S6A-C). Therefore, CAOV3 and OVCAR8
cell lines were selected for STAT4 gene knockdown analyses.
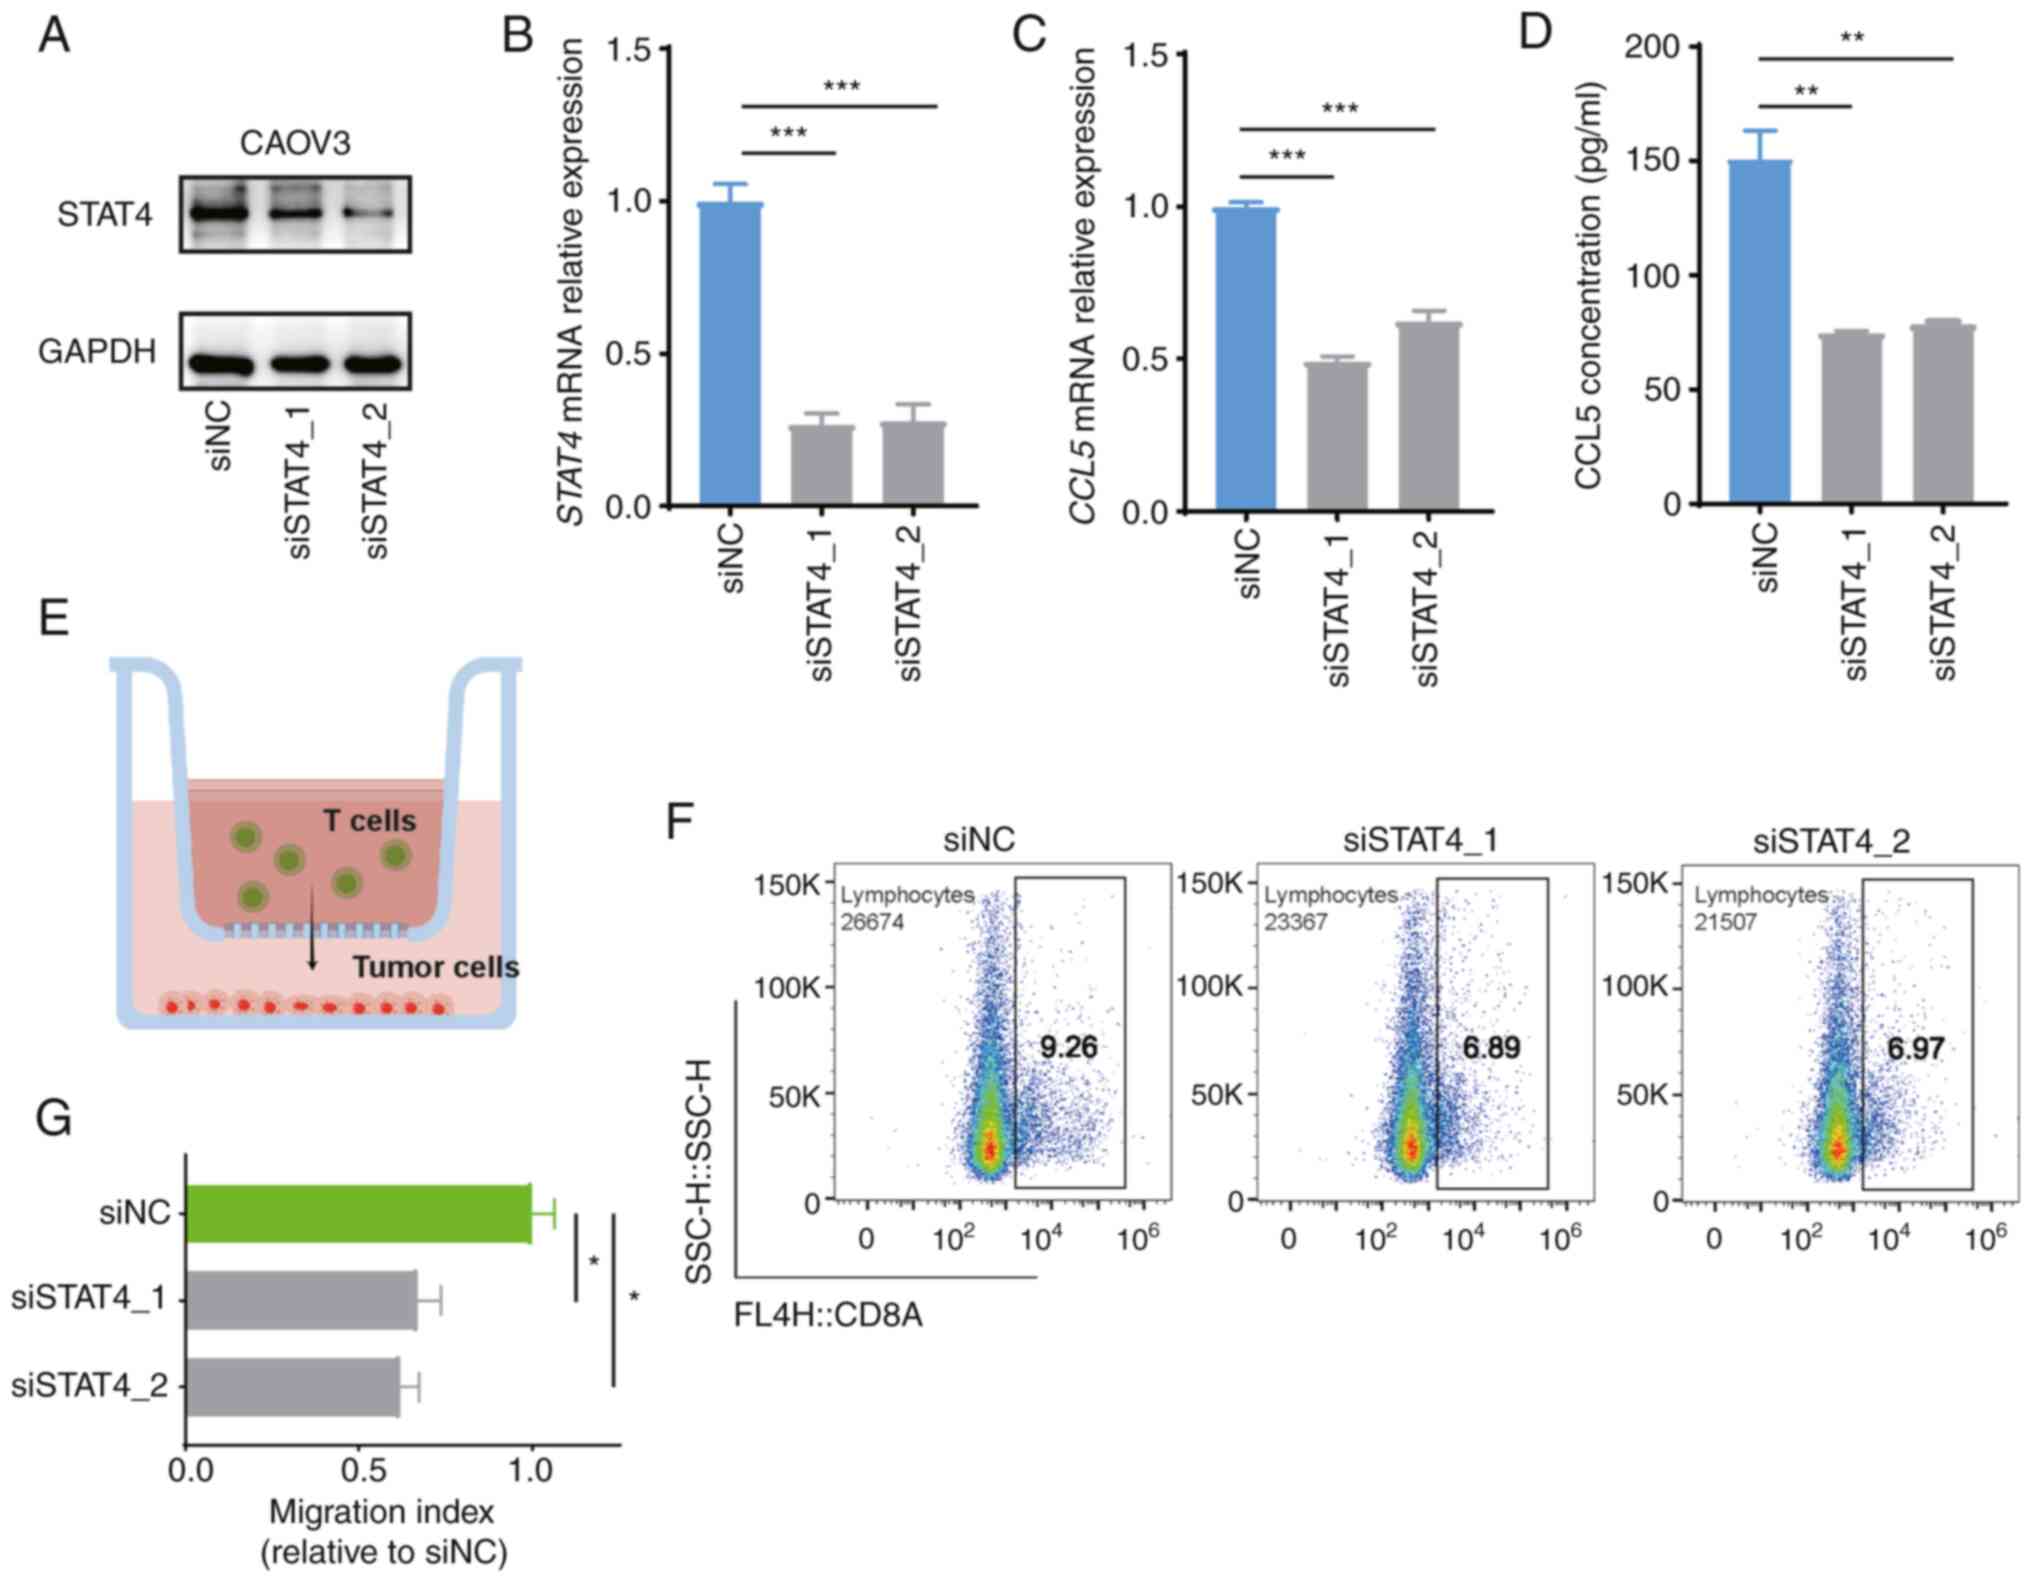
As shown in Fig. 6A and B, STAT4
was significantly downregulated at both the mRNA and protein levels
in CAOV3 cell line transfected with the indicated siRNAs,
indicating successful knockdown of the STAT4 gene.
Subsequent analysis of CCL5 expression revealed that
STAT4 knockdown significantly suppressed CCL5
expression in the CAOV3 cell line and cell culture supernatant
(Fig. 6C and D). By contrast,
although the mRNA expression levels of STAT4 were also
significantly downregulated in the OVCAR8 cell line, the silencing
effect was relatively weak. Additionally, knockdown of STAT4
resulted in a non-significant decrease in the expression levels of
CCL5 (Fig. S6D-G), which may be
due to the relatively low STAT4 expression in the OVCAR8
cell line, resulting in insignificant changes in CCL5.
Subsequently, it was determined whether STAT4 affected CD8
T-cell migration by performing a chemotaxis assay of autologous
blood T cells; the results revealed that the recruitment of CD8 T
cells to cancer cells was attenuated by STAT4 knockdown
(Fig. 6E-G). Therefore, these
results validated the hypothesis that STAT4 promotes CD8
T-cell migration by inducing CCL5 secretion.
Discussion
CD8 T cells serve a crucial role in antitumor immune
responses (40). It has been
reported that CD8 T-cell infiltration is associated with a better
prognosis in OC (9); however, an
Italian study showed that T-cell infiltration was detected in only
~50% of ovarian cancer tissues (8).
Moreover, the mechanism of CD8 T-cell infiltration in OC is poorly
understood. The transcriptome represents tumor heterogeneity, and
to gain insights into the mechanism of CD8 T-cell infiltration in
OC, the present study screened TCGA and GEO datasets for CD8 T-cell
infiltration-related biomarkers through the quanTIseq and
MCP-counter algorithms.
The R scripts, including CIBERSORT-CBS,
CIBERSORT-CBA, EPIC, MCP-counter, quanTIseq, TIMER and xCell, which
are used to quantify infiltrating immune cells conceptually fall
into two categories, marker gene-based or deconvolution-based.
Sturm et al (41)
demonstrated that quanTIseq gave the most accurate estimates of CD8
T cells (r=0.98; P<0.001) among the deconvolution-based R
scripts, whereas MCP-counter gave the most accurate estimates of
CD8 T cells (r=0.95; P<0.001) among the marker gene-based R
scripts. Therefore, the present study first estimated the CD8
T-cell score in TCGA-OV dataset using the quanTIseq and MCP-counter
algorithms. Consistent with the results of a previous study
(9), a high CD8 T-cell score was
revealed to be associated with a better prognosis in patients with
OC. Thereafter, 580 CD8 T cell-related genes were identified by
comparing the gene expression profiles of the CD8 T cell high- and
low-score groups. A PPI network was then constructed and the
molecular mechanisms of the genes were explored by GO enrichment
analysis. The results demonstrated that the majority of the hub
genes were associated with ‘T cell activation’. Subsequent survival
analysis of the selected hub genes revealed that STAT4 has a
potential value as a predictive biomarker of survival and as an
indicator of CD8 T-cell infiltration in OC. Furthermore,
comprehensive assessment across multiple independent OC cohorts
showed that the STAT4 high-expression group had a
significantly longer OS time compared with the low-expression
group, which is consistent with the previous studies on cancer
outcomes (14–16,42).
In addition, Wubetu et al (43) revealed that STAT4 expression was
positively correlated with CD8 T-cell infiltration in
hepatocellular carcinoma tissues (43). Thus, STAT4 may serve an
important role in the recruitment of CD8 T-cell infiltration in
OC.
A series of experiments and analyses were performed
in the current study to obtain insights into the biological
functions of STAT4. GO and KEGG analyses indicated that
STAT4 has a key role in the positive regulation of cytokine
production and chemokine signaling pathways. Furthermore,
STAT4 and CCL5 were highly correlated in multiple
independent cohorts of OC. A previous study reported that loss of
CCL5 resulted in a significant reduction of CD8 T-cell infiltration
in human and murine ovarian cancer (21). Collectively, these results suggested
that STAT4 may regulate CCL5 secretion to enhance CD8 T-cell
infiltration. Furthermore, STAT4, CCL5 and CD8A levels were
revealed to be significantly correlated in OC tissues at both mRNA
and protein levels. In addition, STAT4 knockdown in the
CAOV3 cell line led to a corresponding reduction in CCL5 expression
and CD8 T-cell migration. These results are consistent with a study
by Dangaj et al (21), which
suggested that tumor-derived CCL5 is a key contributor to the
regulation of immune cell infiltration in ovarian cancer, resulting
in an improved clinical benefit for patients. Additionally,
Pasquier et al reported that ovarian cancer stromal cells
can induce chemoresistance by secreting CCL5, thus promoting cancer
progression (44). Moreover, CCL5
secretion by cancer-associated fibroblasts has been shown to
promote the metastasis of hepatocellular carcinoma by activating
the HIF1α/ZEB1 axis (45). These
results indicated that CCL5 has different functions in different
types of cancer.
The present study demonstrated that STAT4 is
an important positive regulator of CCL5 expression in OC. It has
been demonstrated that DNA methylation can silence CCL5
expression, which may be used as a potential mechanism for its
negative regulation (46).
Additionally, the WNT/β-catenin gene signature is specifically
upregulated in low-CCL5 melanoma tumors (18). Notably, DNA methyltransferase 1
inhibition has been reported to increase the expression of the
T-cell chemoattractant, CCL5, in lung cancer via suppression of MYC
signaling (47). These pathways may
interact with each other and affect the expression of CCL5, which
can be explored further in future research.
In conclusion, the present study revealed that
STAT4 may be an independent factor for favorable prognosis
in OC, with the high STAT4-expression group having a longer
survival compared with the low STAT4-expression group, thus
suggesting that STAT4 may be a novel prognostic biomarker
for OC. Furthermore, the present data indicated that STAT4
acts as an important regulator of CD8 T-cell infiltration in OC
tissues by regulating the secretion of CCL5. However, these
experiments were performed in vitro and should be verified
by in vivo studies in future research.
Supplementary Material
Supporting Data
Acknowledgments
Not applicable.
Funding
This work was supported by the Nature and Science Foundation of
China (grant nos. 81974408, 81874106, 82073259), the Key R&D
Program of Hubei Province (grant no. 2020BCA067), the Hubei
Province Science Fund for Distinguished Young Scholars (grant no.
2020CFA066) and the Beijing Kanghua Foundation for the Development
of Traditional Chinese and Western Medicine (grant no.
KH-2021-LQJJ-006).
Availability of data and materials
The datasets generated and/or analyzed during the
current study are available in TCGA and GEO repositories (TCGA,
https://portal.gdc.cancer.gov/repository; GSE130571,
https://www.ncbi.nlm.nih.gov/geo/query/acc.cgi?acc=GSE130571;
GSE53963, https://www.ncbi.nlm.nih.gov/geo/query/acc.cgi?acc=GSE53963;
GSE32062, http://www.ncbi.nlm.nih.gov/geo/query/acc.cgi?acc=GSE32062).
The remaining datasets used and/or analyzed during the current
study are available from the corresponding author on reasonable
request.
Authors' contributions
WW, GC and CYS conceived the study. WW and SL
confirm the authenticity of all the raw data. WW performed the
experiments. FNL collected clinical data and samples. SL, BY, XCZ
and JJY performed data analysis. WW wrote the manuscript. SL, GC
and CYS supervised and revised the paper. GC and CYS provided
equipment and funding. All of the authors read and approved the
final manuscript.
Ethics approval and consent to
participate
The present study was approved by the Ethics
Committee of Tongji Hospital (approval no. TJ-IRB20190320), and
patients provided written informed consent.
Patient consent for publication
Written informed consent for publication was
obtained from the patients.
Competing interests
The authors declare that they have no competing
interests.
Glossary
Abbreviations
Abbreviations:
|
OC
|
ovarian serous carcinoma
|
|
TCGA
|
The Cancer Genome Atlas
|
|
DEGs
|
differentially expressed genes
|
|
PPI
|
protein-protein interaction
|
|
TILs
|
tumor-infiltrating lymphocytes
|
|
STAT4
|
signal transducer and activator of
transcription 4
|
|
GEO
|
Gene Expression Omnibus
|
|
GO
|
Gene Ontology
|
|
KEGG
|
Kyoto Encyclopedia of Genes and
Genomes
|
|
GSEA
|
Gene Set Enrichment Analysis
|
|
IHC
|
immunohistochemistry
|
|
OS
|
overall survival
|
|
DSS
|
disease-specific survival
|
|
DFI
|
disease-free interval
|
|
PFI
|
progression-free interval
|
|
HR
|
hazard ratio
|
|
CI
|
confidence interval
|
References
|
1
|
Siegel RL, Miller KD, Fuchs HE and Jemal
A: Cancer statistics, 2022. CA Cancer J Clin. 72:7–33. 2022.
View Article : Google Scholar : PubMed/NCBI
|
|
2
|
Dao F, Schlappe BA, Tseng J, Lester J,
Nick AM, Lutgendorf SK, McMeekin S, Coleman RL, Moore KN, Karlan
BY, et al: Characteristics of 10-year survivors of high-grade
serous ovarian carcinoma. Gynecol Oncol. 141:260–263. 2016.
View Article : Google Scholar
|
|
3
|
Torre LA, Trabert B, DeSantis CE, Miller
KD, Samimi G, Runowicz CD, Gaudet MM, Jemal A and Siegel RL:
Ovarian Cancer Statistics, 2018. CA Cancer J Clin. 68:284–296.
2018. View Article : Google Scholar : PubMed/NCBI
|
|
4
|
Garziera M, Cecchin E, Giorda G, Sorio R,
Scalone S, De Mattia E, Roncato R, Gagno S, Poletto E, Romanato L,
et al: Clonal evolution of TP53 c.375+1G > A mutation in pre-
and post-neo-adjuvant chemotherapy (NACT) tumor samples in
high-grade serous ovarian cancer (HGSOC). Cells. 8:11862019.
View Article : Google Scholar : PubMed/NCBI
|
|
5
|
Leary A, Tan D and Ledermann J: Immune
checkpoint inhibitors in ovarian cancer: Where do we stand? Ther
Adv Med Oncol. 13:175883592110398992021. View Article : Google Scholar
|
|
6
|
Hamanishi J, Mandai M, Ikeda T, Minami M,
Kawaguchi A, Murayama T, Kanai M, Mori Y, Matsumoto S, Chikuma S,
et al: Safety and antitumor activity of Anti-PD-1 antibody,
nivolumab, in patients with platinum-resistant ovarian cancer. J
Clin Oncol. 33:4015–4022. 2015. View Article : Google Scholar
|
|
7
|
Ji RR, Chasalow SD, Wang L, Hamid O,
Schmidt H, Cogswell J, Alaparthy S, Berman D, Jure-Kunkel M,
Siemers NO, et al: An immune-active tumor microenvironment favors
clinical response to ipilimumab. Cancer Immunol Immunother.
61:1019–1031. 2012. View Article : Google Scholar : PubMed/NCBI
|
|
8
|
Pautu JL and Kumar L: Intratumoral T cells
and survival in epithelial ovarian cancer. Natl Med J India.
16:150–151. 2003.
|
|
9
|
Ovarian Tumor Tissue Analysis (OTTA)
Consortium, . Goode EL, Block MS, Kalli KR, Vierkant RA, Chen W,
Fogarty ZC, Gentry-Maharaj A, Tołoczko A, Hein A, et al:
Dose-Response association of CD8+ Tumor-Infiltrating lymphocytes
and survival time in high-grade serous ovarian cancer. JAMA Oncol.
3:e1732902017. View Article : Google Scholar
|
|
10
|
Kaplan MH: STAT4-A critical regulator of
inflammation in vivo. Immunol Res. 31:231–241. 2005. View Article : Google Scholar : PubMed/NCBI
|
|
11
|
Thierfelder WE, Van Deursen JM, Yamamoto
K, Tripp RA, Sarawar SR, Carson RT, Sangster MY, Vignali DA,
Doherty PC, Grosveld GC and Ihle JN: Requirement for Stat4 in
interleukin-12-mediated responses of natural killer and T cells.
Nature. 382:171–174. 1996. View Article : Google Scholar : PubMed/NCBI
|
|
12
|
Kuroda E, Kito T and Yamashita U: Reduced
expression of STAT4 and IFN-gamma in macrophages from BALB/c mice.
J Immunol. 168:5477–5482. 2002. View Article : Google Scholar
|
|
13
|
Bacon CM, Petricoini EF III, Ortaldo JR,
Rees RC, Larner AC, Johnston JA and O'Shea JJ: Interleukin 12
induces tyrosine phosphorylation and activation of STAT4 in human
lymphocytes. Proc Natl Acad Sci USA. 92:7307–7311. 1995. View Article : Google Scholar : PubMed/NCBI
|
|
14
|
Wang G, Chen JH, Qiang Y, Wang DZ and Chen
Z: Decreased STAT4 indicates poor prognosis and enhanced cell
proliferation in hepatocellular carcinoma. World J Gastroenterol.
21:3983–3993. 2015. View Article : Google Scholar
|
|
15
|
Li S, Sheng B, Zhao M, Shen Q, Zhu H and
Zhu X: The prognostic values of signal transducers activators of
transcription family in ovarian cancer. Biosci Rep.
37:BSR201706502017. View Article : Google Scholar : PubMed/NCBI
|
|
16
|
Wang S and Yu L, Shi W, Li X and Yu L:
Prognostic roles of signal transducers and activators of
transcription family in human breast cancer. Biosci Rep.
38:BSR201711752018. View Article : Google Scholar : PubMed/NCBI
|
|
17
|
Harlin H, Meng Y, Peterson AC, Zha Y,
Tretiakova M, Slingluff C, McKee M and Gajewski TF: Chemokine
expression in melanoma metastases associated with CD8+ T-cell
recruitment. Cancer Res. 69:3077–3085. 2009. View Article : Google Scholar : PubMed/NCBI
|
|
18
|
Spranger S, Bao R and Gajewski TF:
Melanoma-intrinsic β-catenin signalling prevents anti-tumour
immunity. Nature. 523:231–235. 2015. View Article : Google Scholar : PubMed/NCBI
|
|
19
|
Sanchez-Paulete AR, Cueto FJ,
Martínez-López M, Labiano S, Morales-Kastresana A, Rodríguez-Ruiz
ME, Jure-Kunkel M, Azpilikueta A, Aznar MA, Quetglas JI, et al:
Cancer immunotherapy with immunomodulatory Anti-CD137 and Anti-PD-1
monoclonal antibodies requires BATF3-Dependent dendritic cells.
Cancer Discov. 6:71–79. 2016. View Article : Google Scholar : PubMed/NCBI
|
|
20
|
Zsiros E, Duttagupta P, Dangaj D, Li H,
Frank R, Garrabrant T, Hagemann IS, Levine BL, June CH, Zhang L, et
al: The ovarian cancer chemokine landscape is conducive to homing
of Vaccine-Primed and CD3/CD28-Costimulated T cells prepared for
adoptive therapy. Clin Cancer Res. 21:2840–2850. 2015. View Article : Google Scholar : PubMed/NCBI
|
|
21
|
Dangaj D, Bruand M, Grimm AJ, Ronet C,
Barras D, Duttagupta PA, Lanitis E, Duraiswamy J, Tanyi JL,
Benencia F, et al: Cooperation between constitutive and inducible
chemokines enables T cell engraftment and immune attack in solid
tumors. Cancer Cell. 35:885–900.e10. 2019. View Article : Google Scholar
|
|
22
|
Liu J, Lichtenberg T, Hoadley KA, Poisson
LM, Lazar AJ, Cherniack AD, Kovatich AJ, Benz CC, Levine DA, Lee
AV, et al: An Integrated TCGA Pan-cancer clinical data resource to
drive High-Quality survival outcome analytics. Cell.
173:400–416.e11. 2018. View Article : Google Scholar
|
|
23
|
Konecny GE, Wang C, Hamidi H, Winterhoff
B, Kalli KR, Dering J, Ginther C, Chen HW, Dowdy S, Cliby W, et al:
Prognostic and therapeutic relevance of molecular subtypes in
high-grade serous ovarian cancer. J Natl Cancer Inst.
106:dju2492014. View Article : Google Scholar
|
|
24
|
Yoshihara K, Tsunoda T, Shigemizu D,
Fujiwara H, Hatae M, Fujiwara H, Masuzaki H, Katabuchi H, Kawakami
Y, Okamoto A, et al: High-Risk ovarian cancer based on 126-Gene
expression signature is uniquely characterized by downregulation of
antigen presentation pathway. Clin Cancer Res. 18:1374–1385. 2012.
View Article : Google Scholar : PubMed/NCBI
|
|
25
|
Ramaswamy V, Remke M, Bouffet E, Faria CC,
Perreault S, Cho YJ, Shih DJ, Luu B, Dubuc AM, Northcott PA, et al:
Recurrence patterns across medulloblastoma subgroups: An integrated
clinical and molecular analysis. Lancet Oncol. 14:1200–1207. 2013.
View Article : Google Scholar
|
|
26
|
Hill RM, Kuijper S, Lindsey JC, Petrie K,
Schwalbe EC, Barker K, Boult JK, Williamson D, Ahmad Z, Hallsworth
A, et al: Combined MYC and P53 defects emerge at medulloblastoma
relapse and define rapidly progressive, therapeutically targetable
disease. Cancer Cell. 27:72–84. 2015. View Article : Google Scholar
|
|
27
|
Sun Y, Wu L, Zhong Y, Hou Y, Wang Z, Zhang
Z, Xie J, Wang C, Chen D, Huang Y, et al: Single-cell landscape of
the ecosystem in early-relapse hepatocellular carcinoma. Cell.
184:404–421.e16. 2021. View Article : Google Scholar
|
|
28
|
Becht E, Giraldo NA, Lacroix L, Buttard B,
Elarouci N, Petitprez F, Selves J, Laurent-Puig P, Sautès-Fridman
C, Fridman WH and de Reyniès A: Estimating the population abundance
of tissue-infiltrating immune and stromal cell populations using
gene expression. Genome Biol. 17:2182016. View Article : Google Scholar
|
|
29
|
Finotello F, Mayer C, Plattner C,
Laschober G, Rieder D, Hackl H, Krogsdam A, Loncova Z, Posch W,
Wilflingseder D, et al: Molecular and pharmacological modulators of
the tumor immune contexture revealed by deconvolution of RNA-seq
data. Genome Med. 11:342019. View Article : Google Scholar : PubMed/NCBI
|
|
30
|
Szklarczyk D, Gable AL, Lyon D, Junge A,
Wyder S, Huerta-Cepas J, Simonovic M, Doncheva NT, Morris JH, Bork
P, et al: STRING v11: Protein-protein association networks with
increased coverage, supporting functional discovery in genome-wide
experimental datasets. Nucleic Acids Res. 47:D607–D613. 2019.
View Article : Google Scholar : PubMed/NCBI
|
|
31
|
Yu G, Wang LG, Han Y and He QY:
clusterProfiler: An R package for comparing biological themes among
gene clusters. OMICS. 16:284–287. 2012. View Article : Google Scholar : PubMed/NCBI
|
|
32
|
Azim HA Jr, Peccatori FA, Brohée S,
Branstetter D, Loi S, Viale G, Piccart M, Dougall WC, Pruneri G and
Sotiriou C: RANK-ligand (RANKL) expression in young breast cancer
patients and during pregnancy. Breast Cancer Res. 17:242015.
View Article : Google Scholar : PubMed/NCBI
|
|
33
|
Livak KJ and Schmittgen TD: Analysis of
relative gene expression data using real-time quantitative PCR and
the 2(T)(−Delta Delta C) method. Methods. 25:402–408. 2001.
View Article : Google Scholar : PubMed/NCBI
|
|
34
|
Ling S, Pang J, Yu J, Wang R, Liu L, Ma Y,
Zhang Y, Jin N and Wang S: Preparation and identification of
monoclonal antibody against fumonisin B-(1) and development of
detection by Ic-ELISA. Toxicon. 80:64–72. 2014. View Article : Google Scholar : PubMed/NCBI
|
|
35
|
Jones CC, Mercaldo SF, Blume JD, Wenzlaff
AS, Schwartz AG, Chen H, Deppen SA, Bush WS, Crawford DC, Chanock
SJ, et al: Racial disparities in lung cancer survival: The
contribution of stage, treatment, and ancestry. J Thorac Oncol.
13:1464–1473. 2018. View Article : Google Scholar
|
|
36
|
Ju YJ, Lee SW, Kye YC, Lee GW, Kim HO, Yun
CH and Cho JH: Self-reactivity controls functional diversity of
naive CD8+ T cells by co-opting tonic type I interferon.
Nat Commun. 12:60592021. View Article : Google Scholar : PubMed/NCBI
|
|
37
|
Burgueno-Bucio E, Mier-Aguilar CA and
Soldevila G: The multiple faces of CD5. J Leukoc Biol. 105:891–904.
2019. View Article : Google Scholar
|
|
38
|
Gordiienko I, Shlapatska L, Kovalevska L
and Sidorenko SP: SLAMF1/CD150 in hematologic malignancies: Silent
marker or active player? Clin Immunol. 204:14–22. 2019. View Article : Google Scholar
|
|
39
|
Yang C, Mai H, Peng J, Zhou B, Hou J and
Jiang D: STAT4: An immunoregulator contributing to diverse human
diseases. Int J Biol Sci. 16:1575–1585. 2020. View Article : Google Scholar
|
|
40
|
Yatim N, Cullen S and Albert ML: Dying
cells actively regulate adaptive immune responses. Nat Rev Immunol.
17:262–275. 2017. View Article : Google Scholar
|
|
41
|
Sturm G, Finotello F, Petitprez F, Zhang
JD, Baumbach J, Fridman WH, List M and Aneichyk T: Comprehensive
evaluation of transcriptome-based cell-type quantification methods
for immuno-oncology. Bioinformatics. 35:i436–i445. 2019. View Article : Google Scholar : PubMed/NCBI
|
|
42
|
Nishi M, Batsaikhan BE, Yoshikawa K,
Higashijima J, Tokunaga T, Takasu C, Kashihara H, Ishikawa D and
Shimada M: High STAT4 expression indicates better disease-free
survival in patients with gastric cancer. Anticancer Res.
37:6723–6729. 2017.PubMed/NCBI
|
|
43
|
Wubetu GY, Utsunomiya T, Ishikawa D,
Yamada S, Ikemoto T, Morine Y, Iwahashi S, Saito Y, Arakawa Y,
Imura S, et al: High STAT4 expression is a better prognostic
indicator in patients with hepatocellular carcinoma after
hepatectomy. Ann Surg Oncol. 21 (Suppl 4):S721–S728. 2014.
View Article : Google Scholar
|
|
44
|
Pasquier J, Gosset M, Geyl C,
Hoarau-Véchot J, Chevrot A, Pocard M, Mirshahi M, Lis R, Rafii A
and Touboul C: CCL2/CCL5 secreted by the stroma induce IL-6/PYK2
dependent chemoresistance in ovarian cancer. Mol Cancer. 17:472018.
View Article : Google Scholar : PubMed/NCBI
|
|
45
|
Xu H, Zhao J, Li J, Zhu Z, Cui Z, Liu R,
Lu R, Yao Z and Xu Q: Cancer associated fibroblast-derived CCL5
promotes hepatocellular carcinoma metastasis through activating
HIF1 α/ZEB1 axis. Cell Death Dis. 13:4782022. View Article : Google Scholar : PubMed/NCBI
|
|
46
|
Li H, Chiappinelli KB, Guzzetta AA,
Easwaran H, Yen RW, Vatapalli R, Topper MJ, Luo J, Connolly RM,
Azad NS, et al: Immune regulation by low doses of the DNA
methyltransferase inhibitor 5-azacitidine in common human
epithelial cancers. Oncotarget. 5:587–598. 2014. View Article : Google Scholar
|
|
47
|
Topper MJ, Vaz M, Chiappinelli KB,
DeStefano Shields CE, Niknafs N, Yen RC, Wenzel A, Hicks J, Ballew
M, Stone M, et al: Epigenetic therapy Ties MYC depletion to
reversing immune evasion and treating lung cancer. Cell.
171:1284–1300.e21. 2017. View Article : Google Scholar
|