Introduction
In recent years, the worldwide prevalence of type 2 diabetes mellitus (T2DM) and its complications are increasing at an alarming rate. T2DM is a serious metabolic disorder characterized by an increase in the blood glucose level caused by a deficiency in insulin secretion or insulin resistance, or both. The etiopathogenesis of T2DM is complex and is not yet fully understood. In addition to being governed by genetic and environmental factors, it has been demonstrated that the gut microbiota plays a crucial role in the development and progression of T2DM (1). The association between T2DM and the gut microbiota has emerged as a novel topic of clinical concern and research.
The gut microbiota is an integral component of the human body, providing important functions to the metabolic health of the host (2). The gut microbiome is an ecological community, that is, trillions of different species of microorganisms reside in the gastrointestinal tract (3). The microbial composition may vary depending on the anatomy, abiotic environment and diverse functions of different parts of the intestine. The composition of the gut microbiota is characterized by a significant interpersonal variability, attributing to the differences in ethnicity, genetics, age, sex, geographical area, diet, lifestyle and health status (4). This suggests that each individual has a unique gut microbiota pattern. As regards human health, the gut microbiota plays an important role in the maintenance of the physiological state and the regulation of fundamental metabolism. Quantitative and qualitative alterations of the gut microbiota result in dysbiosis, an imbalance in microbial homeostasis, leading to the development of a number of chronic diseases, such as T2DM (5), obesity (6) and cardiovascular diseases (7). There is emerging evidence to suggest that the dysbiosis of the intestinal microbiota plays a significant role in the improvement of glucose metabolism (8,9). Furthermore, a number of glucose-lowering drugs have been reported to alter the gut bacterial community, such as metformin (10), acarbose (11), glucagon-like peptide 1 (GLP-1) agonists (12) and dipeptidyl peptidase-4 inhibitors (DPP-4i) (13). However, the association between the composition modulation of the gut microbiota and the diverse degrees of blood glucose control remains to be elucidated.
In the present study, the changes in the microbial composition of patients with T2DM were investigated in order to explore the differences in the microbial community associated with degrees of blood glucose control.
Patients and methods
Study design
A total of 30 patients diagnosed with T2DM at the Second Hospital of Hebei Medical University (Shijiazhuang, China) from June, 2020 to September, 2020 were recruited in the present study. The inclusion criteria for the patients were as follows: i) An age between 18 and 70 years; ii) newly or previously diagnosed T2DM, based on the World Health Organization 1998 diagnostic criteria (14); iii) all patients received metformin, glycosidase inhibitors or a combination of both; iv) hemoglobin A1c (glycated hemoglobin; HbA1c) levels ≥53 mmol/mol; and v) the absence of other metabolic diseases. The exclusion criteria were as follows: i) Females who were pregnant; ii) patients with type 1 diabetes mellitus (T1DM) or diabetes with identified secondary causes; iii) the presence of gastrointestinal disorders; iv) any use of antibiotics, prebiotic agents, probiotics or fiber supplements that could modify the microbiota during the 3 months prior to enrollment; v) patients who received treatment with gastrointestinal or biliary surgery; vi) the presence of severe hepatic and renal dysfunction, malnutrition, malignant tumor; vii) patients diagnosed with hypertension, coronary heart disease, cerebral infarction or other chronic diseases; and viii) the presence of acute inflammatory or any infectious disease. A total of 17 males (56.67%) and 13 females (43.33%) provided written informed consent. The study conformed to the principles of the Declaration of Helsinki and was approved by the Ethics Committee of the Second Hospital of Hebei Medical University in China (Approval no. 2020-R467). Early-morning fecal samples were collected from the enrolled participants in sterile cups and frozen immediately at -80˚C for fecal microbial quantification. Peripheral blood samples were obtained following 8 h of overnight fasting and analyzed immediately.
Biochemical analysis and anthropometrics
Demographic information and anthropometric measurements were collected, including age, sex, body weight, height, body mass index (BMI), diabetes duration and medical and medication history. Body weight was measured with an accuracy of 0.1 kg in light indoor clothes and height was measured with a precision of 0.5 cm without shoes using an automatic scale. The BMI was calculated as the body weight in kilograms divided by the square of height in meters (kg/m2).
HbA1c levels measured using a high-performance liquid chromatography (Tosoh Bioscience). Serum fasting blood glucose (FBG), triglyceride (TG), total cholesterol (TC), high-density lipoprotein cholesterol (HDL) and low-density lipoprotein cholesterol (LDL) levels were measured using Roche kits (FBG, 05168791190; TG, 05171407190; TC, 05168538190; HDL, 07528582190; LDL, 07005768190; Roche Diagnostics GmbH), with an auto-analyzer instrument (Hitachi, Ltd.). Liver function was evaluated based on the aspartate transaminase (AST), alanine aminotransferase (ALT) levels and total serum bile acid (TBA). Renal function was determined based on the urea nitrogen (BUN), creatinine and uric acid (UA) levels in serum. Liver and renal functions were measured using an automatic biochemical analyzer (AU480; Beckman Coulter, Inc.). The urinary albumin-to-creatinine ratio (UACR) was expressed as mg/mol of creatinine.
DNA extraction and 16S rRNA gene amplicon sequencing
Fecal genomic DNA was extracted from 200 mg of each frozen fecal sample using the TIANamp Stool DNA kit (cat. no. DP328-02; Tiangen Biotech Co., Ltd.) according to the manufacturer's protocol. The extracted DNA concentration and purification were determined using a Nanodrop spectrophotometer (Thermo Fisher Scientific, Inc.), and the DNA quality was examined by 1% agarose gel electrophoresis. The DNA samples of the V4 region of the bacterial 16S-rDNA gene were amplified by PCR using the following primers: 341F, 5'-ACTCCTACGGGRSGCAGCAG-3'; and 806R, 5'-GGACTACVV GGGTATCTAATC-3'. PCR (F547S; Thermo Fisher Scientific, Inc.) was performed as follows: An initial DNA denaturation step at 95˚C for 1 min, followed by 25 cycles of 30 sec at 95˚C, primer annealing at 55˚C for 30 sec, extension at 72˚C for 40 sec, and a final extension step at 72˚C for 2 min. Following amplification, all PCR products were purified using the TIANgel Midi Purification lit (cat. no. DP209-03; Tiangen Biotech Co., Ltd.). The concentration of purified DNA was quantified using Qubit DNA (cat. no. 12640ES76; Shanghai Yisheng Biotechnology Co., Ltd.). The range of the loading concentration of the final library was 7.62-17.58 ng/µl. Purified and pooled amplicons were sequenced using an Illumina Novaseq6000 (PE250) according to the manufacturer's instructions. Raw sequence reads were demultiplexed and low-quality reads (average quality score <20 or read length <200 bp) were filtered. Representative sequences were further analyzed using the Quantitative Insights into Microbial Ecology (QIIME version 2) software package. The quality filtered sequences were clustered into operational taxonomic units (OTUs) with a 97% sequence similarity using the Greengenes database (http://greengenes.lbl.gov).
Statistical analyses
Data analyses were performed using IBM SPSS 21.0 software (IBM Corporation). All data are presented as the median (min-max) or mean ± standard deviation (SD). All data were tested for normality and variance homogeneity. Statistical significance was carried out using one-way analysis of variance (ANOVA) followed by Tukey's post hoc test for data such as age, BMI, HbA1c, FBG, TC, TG, HDL, LDL, ALT, AST, BUN, creatinine, UA and TBA levels. Non-parametric analyses were performed using the Kruskal-Wallis test for data such as UACR levels and diabetes duration. The alpha diversity of microbial composition was calculated using the Chao1 diversity index, Shannon diversity index and Simpson diversity index. The Kruskal-Wallis test was used to identify significant differences between alpha diversity in each group, and the Mann Whitney U test with the Bonferroni correction method were used as post hoc tests. The beta diversity was calculated using unweighted UniFrac-based principal component analysis (PCA). The linear discriminant analysis effect size (LEfSe) analysis was used to detect differential abundance among different groups. A default cut-off value of linear discriminant analysis (LDA) >4.0 and P<0.05 were considered to indicate statistically significant differences.
Results
Anthropometric and biochemical parameters of the study participants
In the present study, 30 screened volunteers were eligible for enrollment as per the inclusion/exclusion criteria mentioned above. Based on the HbA1c values, all enrolled participants were assigned to three groups (n=10 per group) as follows: Group A (HbA1c levels, ≥53 but <75 mmol/mol), group B (HbA1c levels, ≥75 but ≤97 mmol/mol) and group C HbA1c levels, >97 mmol/mol). There were significant differences in the HbA1c levels among the three groups (Table I). The HbA1c level in group A was 56.00±2.83 mmol/mol, that in group B was 81.40±3.03 mmol/mol, and that in group C was 99.80±2.15 mmol/mol. At the beginning of the experiment, the mean FBG level in group C (10.76±2.41 mmol/l) was significantly higher than that in group A (6.71±2.46 mmol/l) or group B (8.07±2.20 mmol/l). No significant differences were observed as regards age, sex, BMI and diabetes duration at baseline among the three groups. The TBA level in group C (5.57±4.10 µmol/l) was significantly higher than that in group B (2.25±1.40 µmol/l). However, no statistically significant differences were observed in TBA levels between group A (3.39±1.34 µmol/l) and group C. In addition, no statistically differences were observed in biochemical indicators, such as TC, TG, HDL, LDL, AST, ALT, BUN, creatinine, UA and UACR levels. The clinical characteristics and biochemical variables of the patients in the three groups are presented in Table I.
 |
Table I
Clinical characteristics and biochemical variables of the study participants.
|
Table I
Clinical characteristics and biochemical variables of the study participants.
| |
Group A (n=10) |
Group B (n=10) |
Group C (n=10) |
P-value |
| Sex (female/male) |
4/6 |
6/4 |
3/7 |
- |
| Age, years (range) |
51 (40-68) |
54 (37-68) |
38 (29-59) |
0.126 |
| BMI, kg/m2 (range) |
25.00 (20.40-34.68) |
26.83 (22.77-33.10) |
26.42 (21.11-30.45) |
0.770 |
| Diabetes duration, months (range) |
96 (4.00-240.00) |
36 (2.00-240.00) |
47.50 (4.00-216.00) |
0.476 |
| HbA1c (mmol/mol) |
56.00±2.83 |
81.40±3.03a |
99.80±2.15a,b |
0.001 |
| FBG (mmol/l) |
6.71±2.46 |
8.07±2.20 |
10.76±2.41a,b |
0.003 |
| TC (mmol/l) |
4.42±1.00 |
4.37±1.16 |
5.33±1.43 |
0.167 |
| TG (mmol/l) |
2.25±1.92 |
2.06±1.30 |
2.84±1.71 |
0.549 |
| HDL (mmol/l) |
1.14±0.32 |
1.00±0.17 |
0.94±0.16 |
0.147 |
| LDL (mmol/l) |
2.81±0.70 |
3.02±1.18 |
3.62±0.97 |
0.184 |
| ALT (U/l) |
22.01±8.11 |
20.87±10.17 |
32.29±25.66 |
0.264 |
| AST (U/l) |
17.69±5.52 |
21.15±11.37 |
26.90±20.40 |
0.366 |
| BUN (mmol/l) |
5.59±1.52 |
5.40±1.04 |
5.14±1.10 |
0.727 |
| Creatinine (µmol/l) |
70.22±14.62 |
66.60±13.19 |
63.20±11.26 |
0.512 |
| UA (µmol/l) |
345.89±85.43 |
299.60±92.40 |
313.50±82.09 |
0.505 |
| UACR (mg/mol) |
5.63±10.57 |
4.97±5.36 |
1.71±1.02 |
0.241 |
| TBA (µmol/l) |
3.39±1.34 |
2.25±1.40 |
5.57±4.10b |
0.036 |
| Family history of T2DM (%) |
50 |
50 |
60 |
- |
| Macrovascular complication (%) |
60 |
50 |
30 |
- |
| Peripheral neuropathy (%) |
100 |
100 |
100 |
- |
| Diabetic retinopathy (%) |
60 |
30 |
20 |
- |
| Diabetic nephropathy (%) |
20 |
40 |
10 |
- |
Association of alpha and beta diversity with HbA1c level
After filtering to obtain the high-quality clean reads, the number of effective sequencing lengths obtained in each group are presented in Table II. The effective sequence length distribution is illustrated in Fig. 1A. All sequences were divided into 19,501 OTUs according to 97% similarity, and the Venn diagrams that visually represented the total and unique conditions of the OTU numbers of the three groups were formed. The OTU numbers of groups A, B and C were 2,754, 3,242 and 3,501, respectively. A total of 3,664 OTUs were simultaneously shared by the three groups (Fig. 1B).
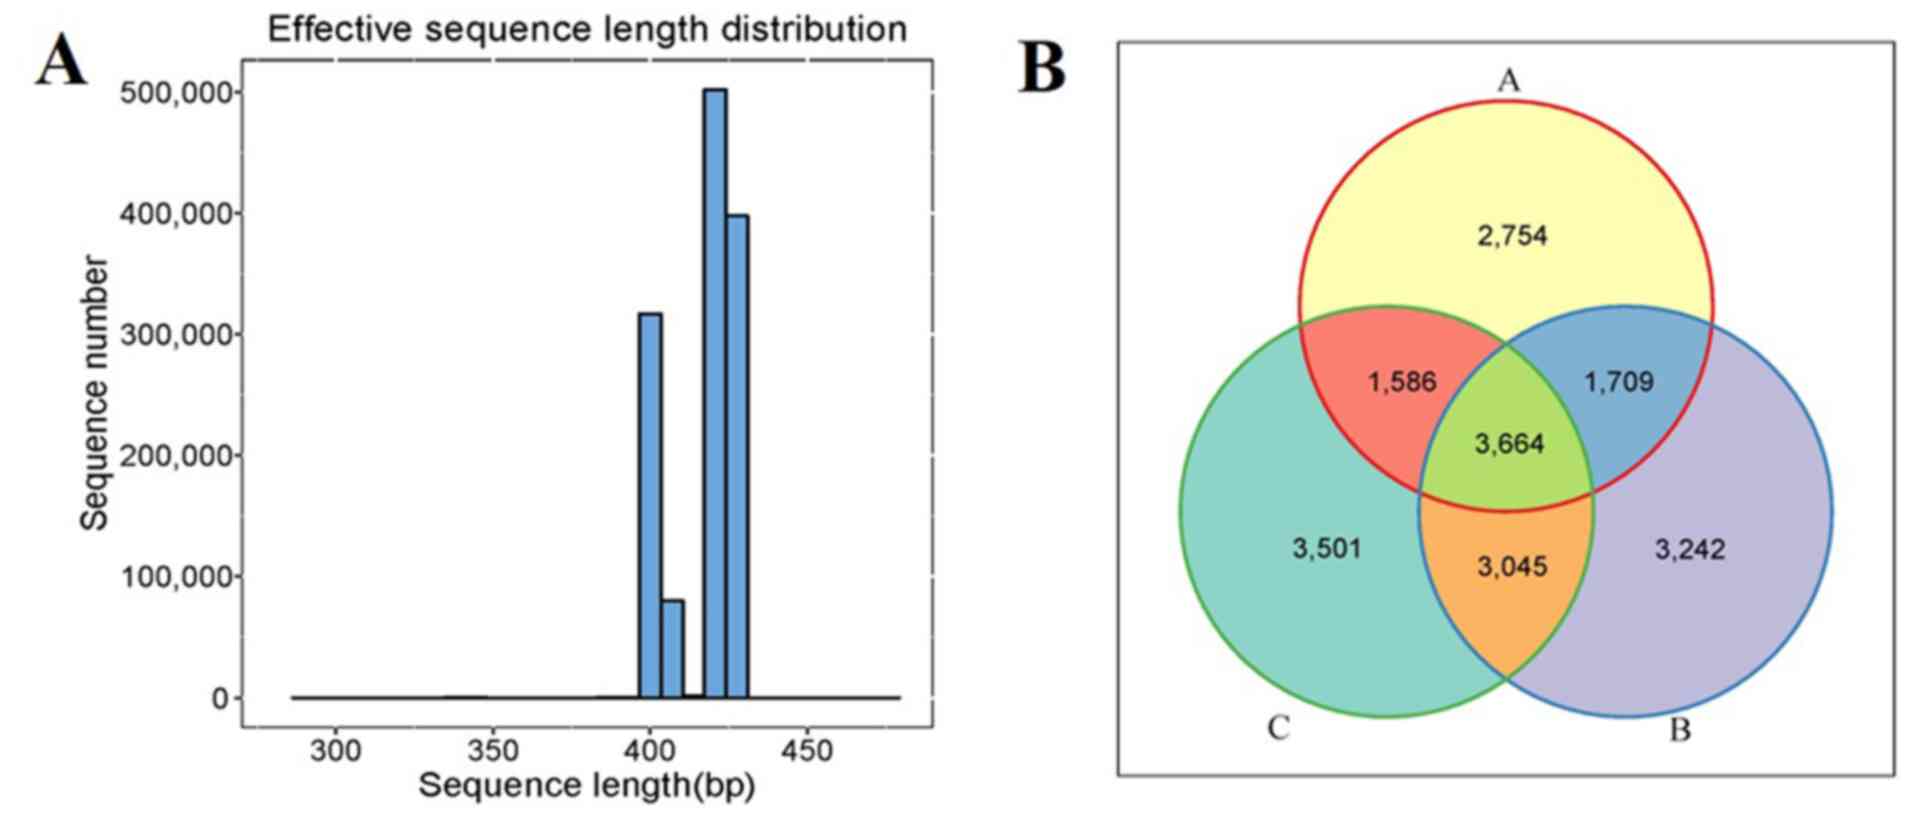 |
Figure 1
Comparison of gut microbiota composition among the patients in groups A, B and C. (A) Sequence length distribution map. (B) Venn diagram showing the overlap of operational taxonomic units in the three groups. The patients were divided into the three groups according to the HbA1c levels as follows: Group A (HbA1c levels, ≥53 but <75 mmol/mol), group B (HbA1c levels, ≥75 but ≤97 mmol/mol) and group C HbA1c levels, >97 mmol/mol). HbA1c, hemoglobin A1c (glycated hemoglobin).
|
|
Table II
Effective sequencing lengths in each group.
|
Table II
Effective sequencing lengths in each group.
| Sample |
PE_reads |
Nochimera |
Average length (nt) |
GC (%) |
Effective (%) |
| A1 |
65,477 |
46,632 |
423.44 |
51.53 |
71.21 |
| A2 |
65,239 |
44,066 |
419.16 |
52.82 |
67.54 |
| A3 |
74,503 |
35,485 |
415.5 |
53.86 |
47.62 |
| A4 |
65,183 |
49,340 |
421.39 |
52.78 |
75.69 |
| A5 |
44,764 |
25,961 |
413.26 |
51.51 |
57.99 |
| A6 |
49,716 |
34,425 |
419.49 |
52.01 |
69.24 |
| A7 |
59,801 |
37,342 |
419.88 |
51.3 |
62.44 |
| A8 |
57,893 |
30,095 |
419.89 |
52.58 |
51.98 |
| A9 |
42,535 |
27,077 |
417.49 |
53.94 |
63.65 |
| A10 |
72,706 |
53,832 |
424.64 |
52.97 |
74.04 |
| B1 |
67,444 |
38,560 |
419.38 |
55.04 |
57.17 |
| B2 |
69,920 |
42,089 |
414.55 |
53.53 |
60.19 |
| B3 |
57,192 |
36,327 |
421.08 |
51.09 |
63.51 |
| B4 |
77,800 |
43,557 |
414.84 |
53.37 |
55.98 |
| B5 |
85,978 |
62,974 |
419.84 |
48.29 |
73.24 |
| B6 |
80,113 |
42,390 |
411.32 |
50.9 |
52.91 |
| B7 |
81,950 |
47,100 |
418.36 |
52.72 |
57.47 |
| B8 |
61,658 |
37,550 |
410.72 |
51.31 |
60.9 |
| B9 |
57,377 |
33,727 |
414.47 |
52.46 |
58.78 |
| B10 |
72,343 |
37,461 |
406.06 |
53.17 |
51.78 |
| C1 |
76,800 |
47,882 |
414.81 |
49.65 |
62.34 |
| C2 |
83,864 |
56,933 |
420.29 |
50.63 |
67.88 |
| C3 |
92,174 |
54,407 |
414.61 |
50.87 |
59.02 |
| C4 |
64,173 |
31,935 |
409.78 |
52.41 |
49.76 |
| C5 |
78,314 |
59,582 |
426.38 |
54.23 |
76.08 |
| C6 |
76,436 |
43,825 |
412.61 |
50.26 |
57.33 |
| C7 |
61,214 |
38,689 |
422.51 |
49.65 |
63.2 |
| C8 |
115,707 |
77,703 |
417.43 |
48.87 |
67.15 |
| C9 |
78,223 |
46,980 |
414.16 |
49.8 |
60.05 |
| C10 |
80,347 |
46,224 |
421.15 |
51.84 |
57.53 |
The alpha diversity was quantified using the Chao1 diversity index, Shannon diversity index and Simpson diversity index, which relates both OUT richness and evenness. As shown in Fig. 2A, three outliers in group B were excluded. As shown in Fig. 2C, one outlier was excluded. When comparing the alpha diversity measurements among three groups, the microbial richness and inner diversity of the gut microbiome was slightly increased as the HbA1c levels increased, although this did not reach statistical significance (Fig. 2A-C).
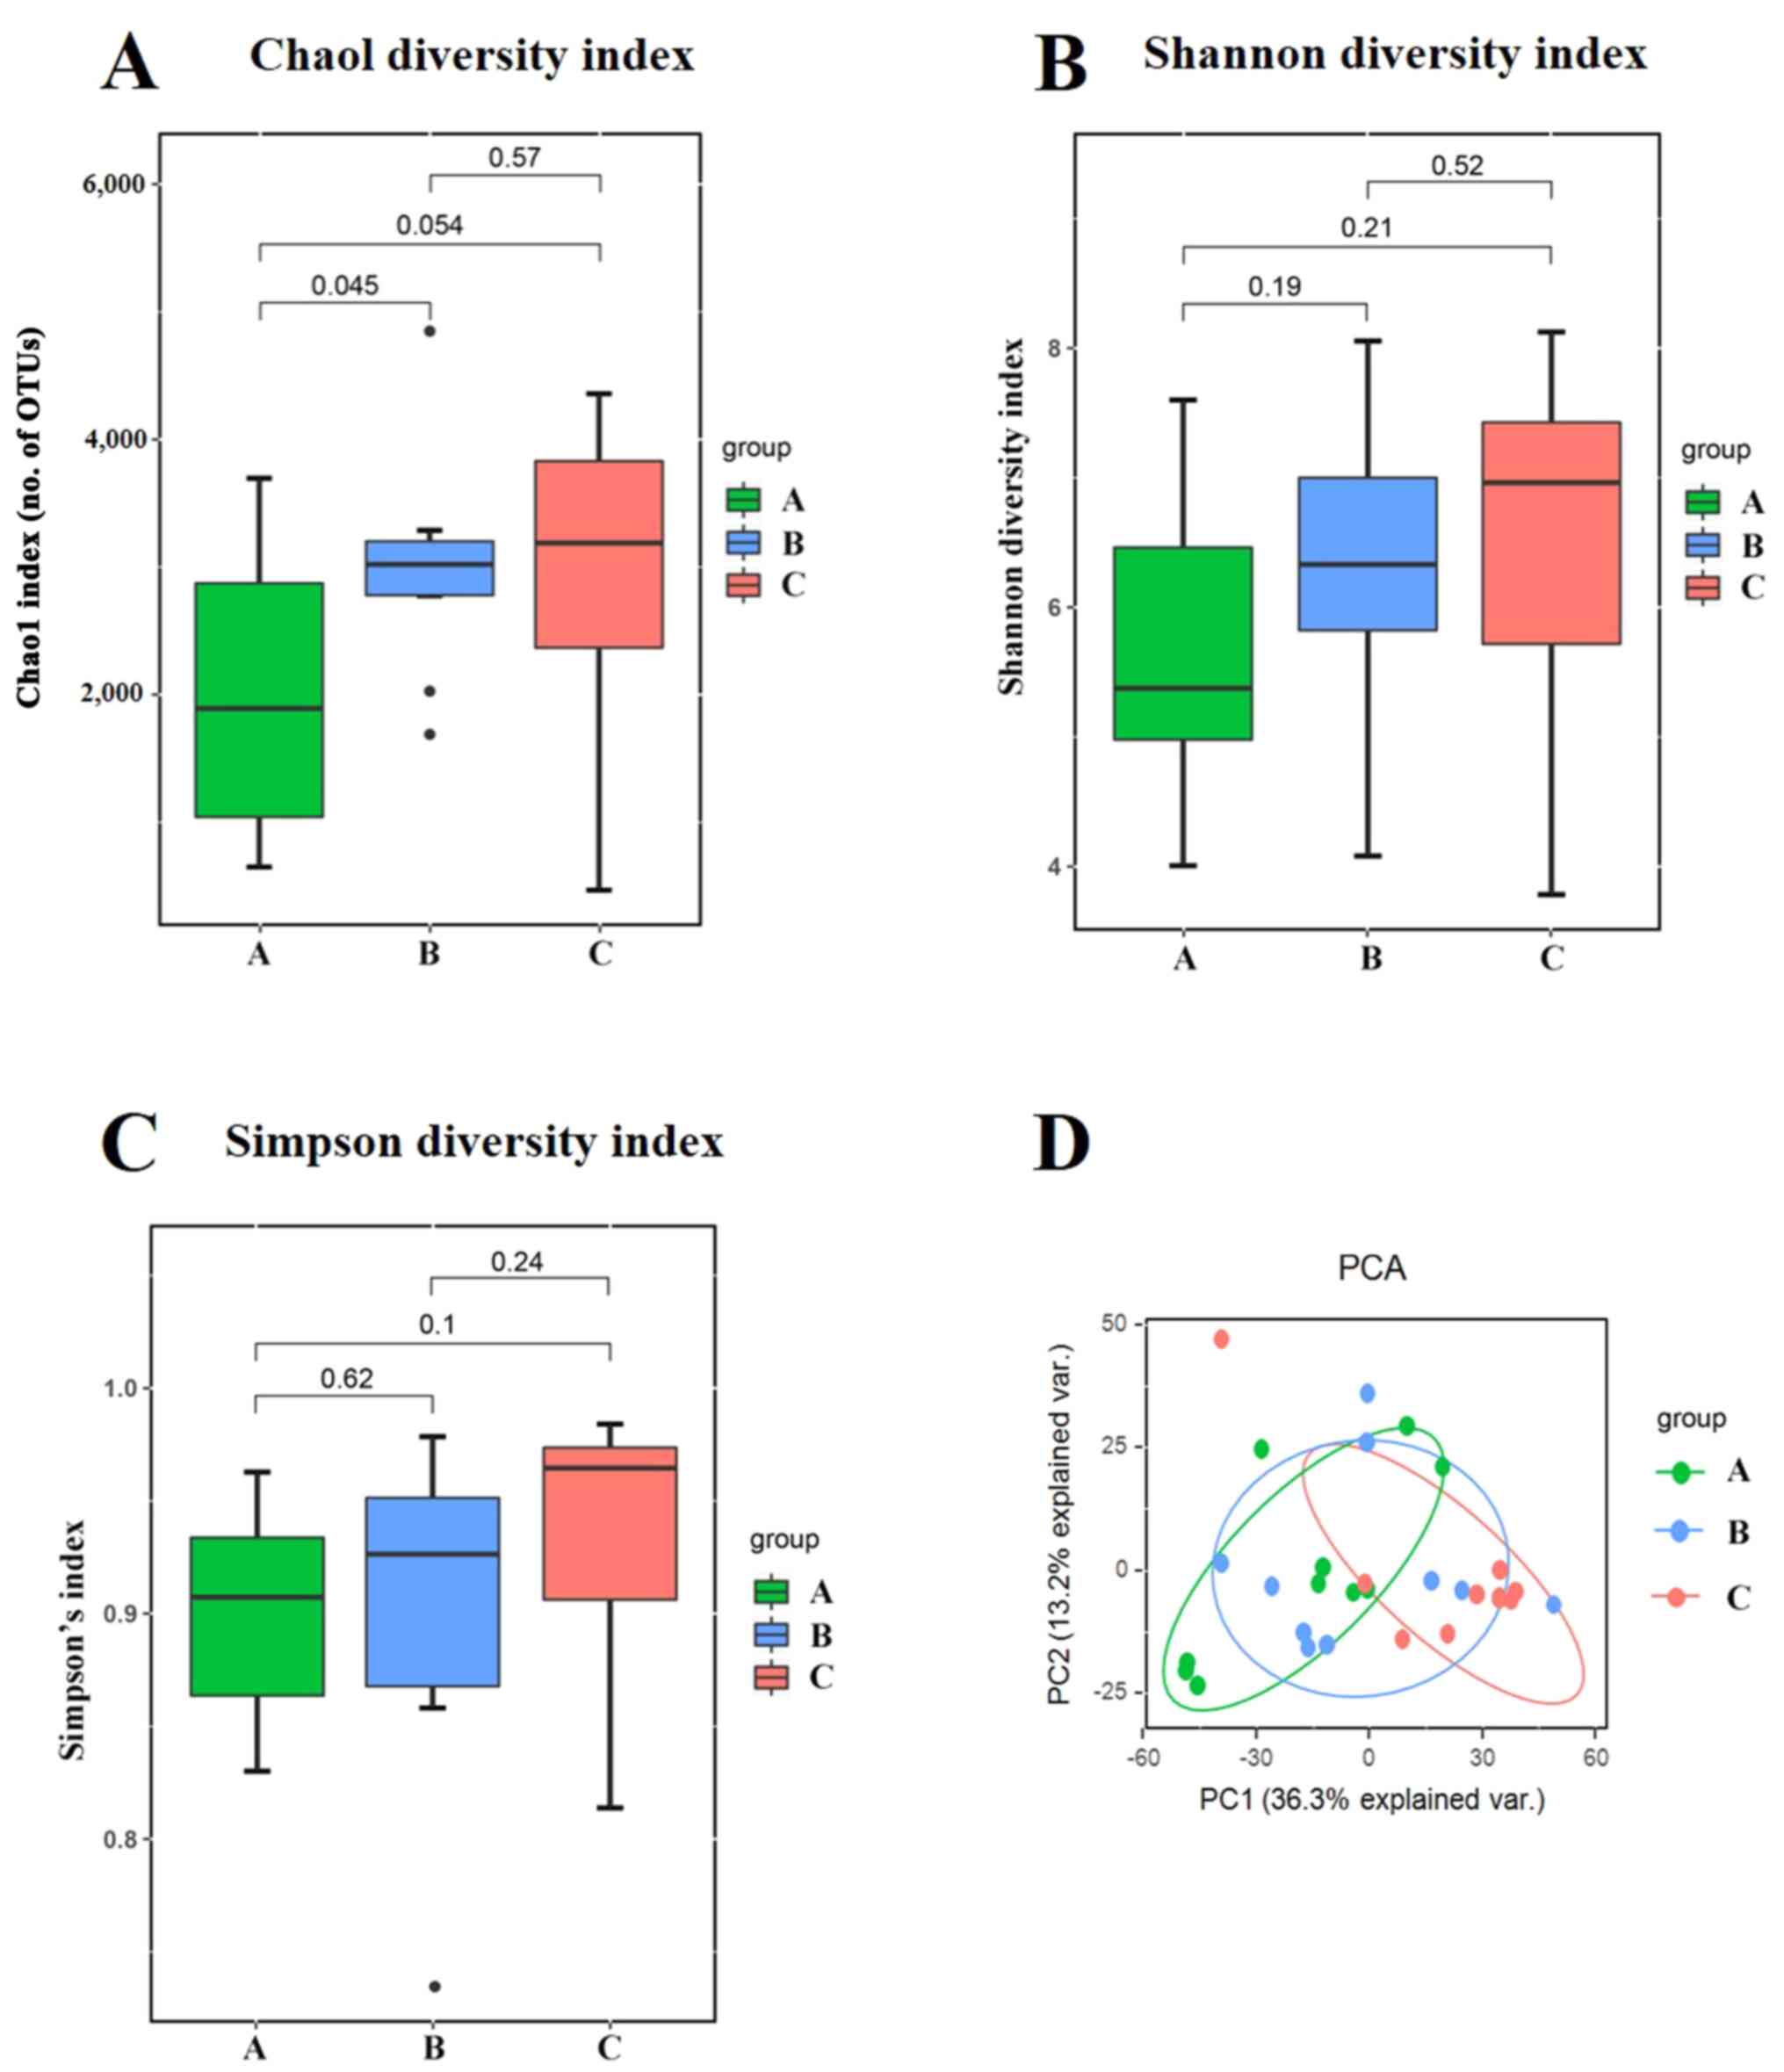 |
Figure 2
Alpha and beta diversity analysis of gut microbiota composition across three groups. (A) Chao1 diversity index. (B) Shannon diversity index. (C) Simpson diversity index. (D) Unweighted UniFrac-based PCA score plots of metabolic profiling. The patients were divided into the three groups according to the HbA1c levels as follows: Group A (HbA1c levels, ≥53 but <75 mmol/mol), group B (HbA1c levels, ≥75 but ≤97 mmol/mol) and group C HbA1c levels, >97 mmol/mol). HbA1c, hemoglobin A1c (glycated hemoglobin); PCA, principal component analysis; PC, principal component.
|
To visualize the group differences in bacterial community composition, the beta diversity of the microbial composition was compared. The beta diversity was calculated using unweighted UniFrac-based principal component analysis (PCA). PCA described the principal components (PCs) scores of microbial composition among the three groups. The first principal component (PC1) accounted for 36.3% of the total variance. The second principal component (PC2) accounted for 13.2% of the total variance. The data related to the three groups were clustered together with different magnitudes and directions. The results indicated that varying degrees of blood glucose control may play an important role in shaping the bacterial communities (Fig. 2D).
Associations between gut microbiota components in fecal samples and HbA1c levels
The microbial community among the three groups was assessed to evaluate the possible effect of different HbA1c levels on gut microbial abundances. The bacterial phyla, Firmicutes, Bacteroidetes and Proteobacteria, contributed the majority of bacterial microbiota components. At the phylum (Fig. 3A) and genus (Fig. 3B) level, the relative abundance of Bacteroidetes was increased, whereas the relative abundance of Firmicutes was decreased with the increasing HbA1c levels. The histograms (Fig. 4A) and cladograms (Fig. 4B) of LEfSe analysis revealed that the dominant phyla and class of bacterial communities were distinct between groups A (red) and C (green) using the logarithmic LDA value of 4 (Fig. 4). The bacterial taxa enriched in group A was the phyla Firmicutes. The phyla Proteobacteria and the class Betaproteobacteria were significantly enriched in group C.
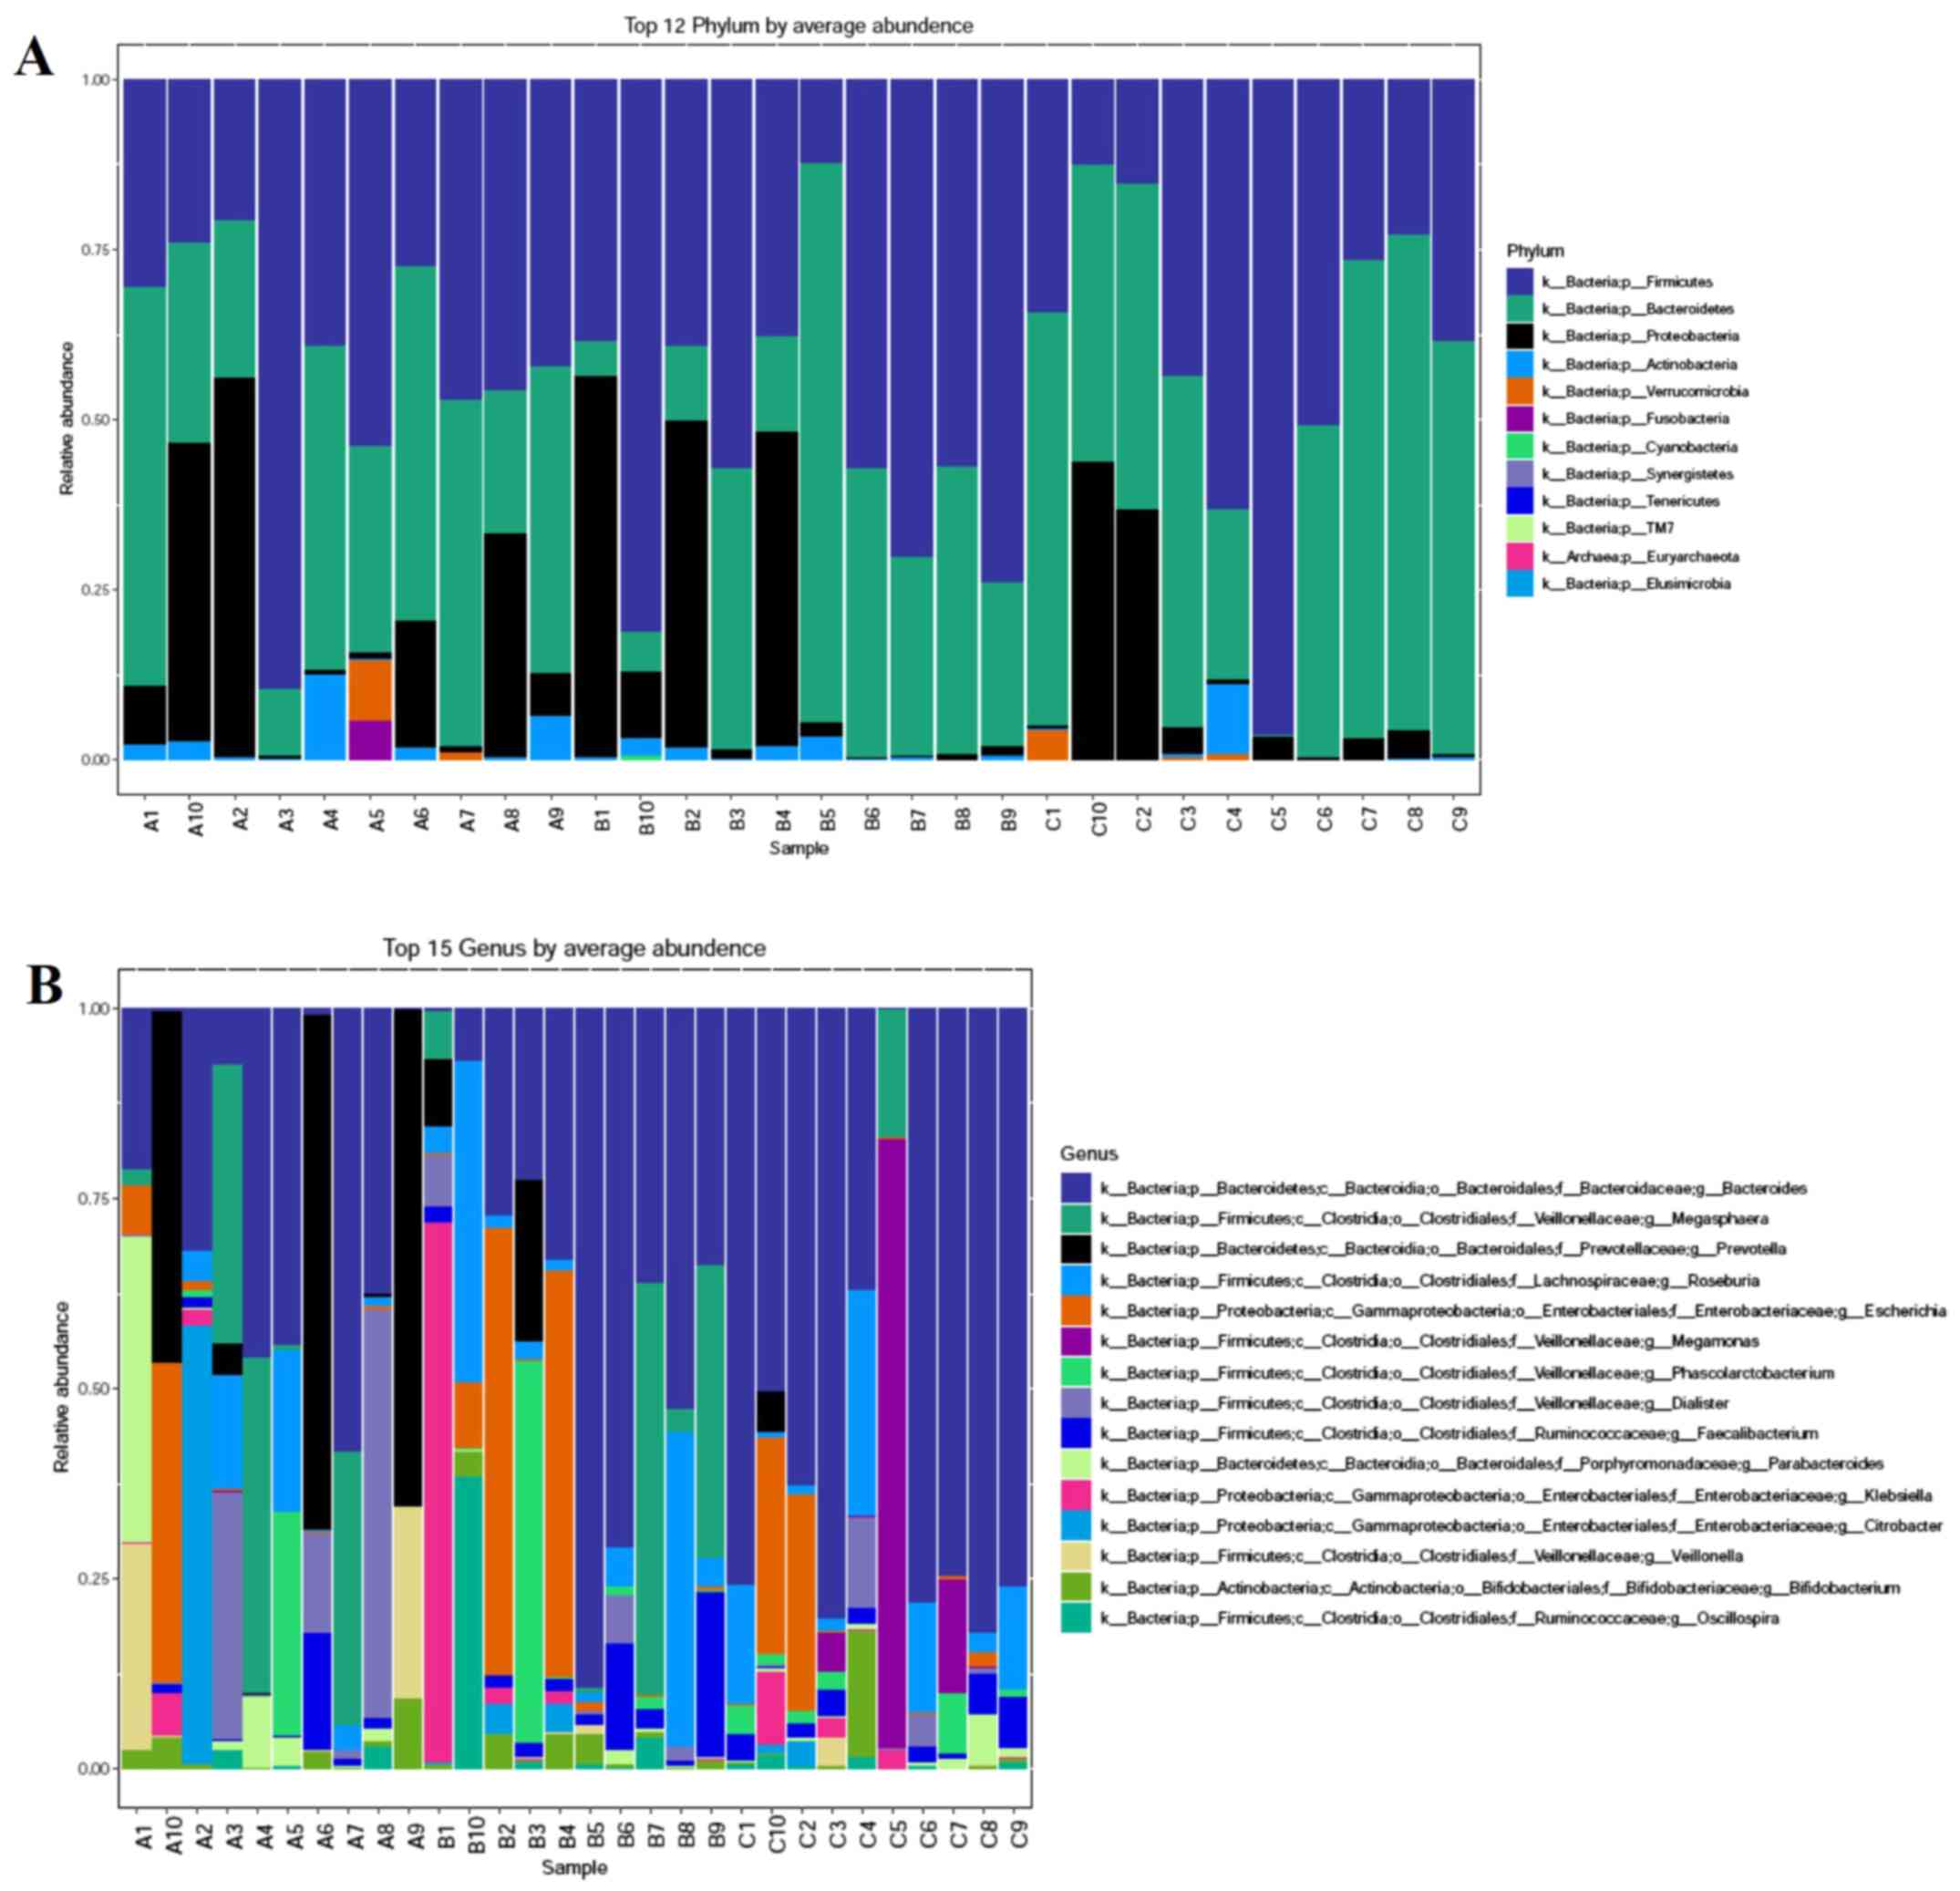 |
Figure 3
Relative abundance composition of gut microbiota among the three groups. (A) Relative percentage of most abundant phylum in each sample among three groups. (B) Relative abundance of bacteria at genus level among three groups. The patients were divided into the three groups according to the HbA1c levels as follows: Group A (HbA1c levels, ≥53 but <75 mmol/mol), group B (HbA1c levels, ≥75 but ≤97 mmol/mol) and group C HbA1c levels, >97 mmol/mol). HbA1c, hemoglobin A1c (glycated hemoglobin).
|
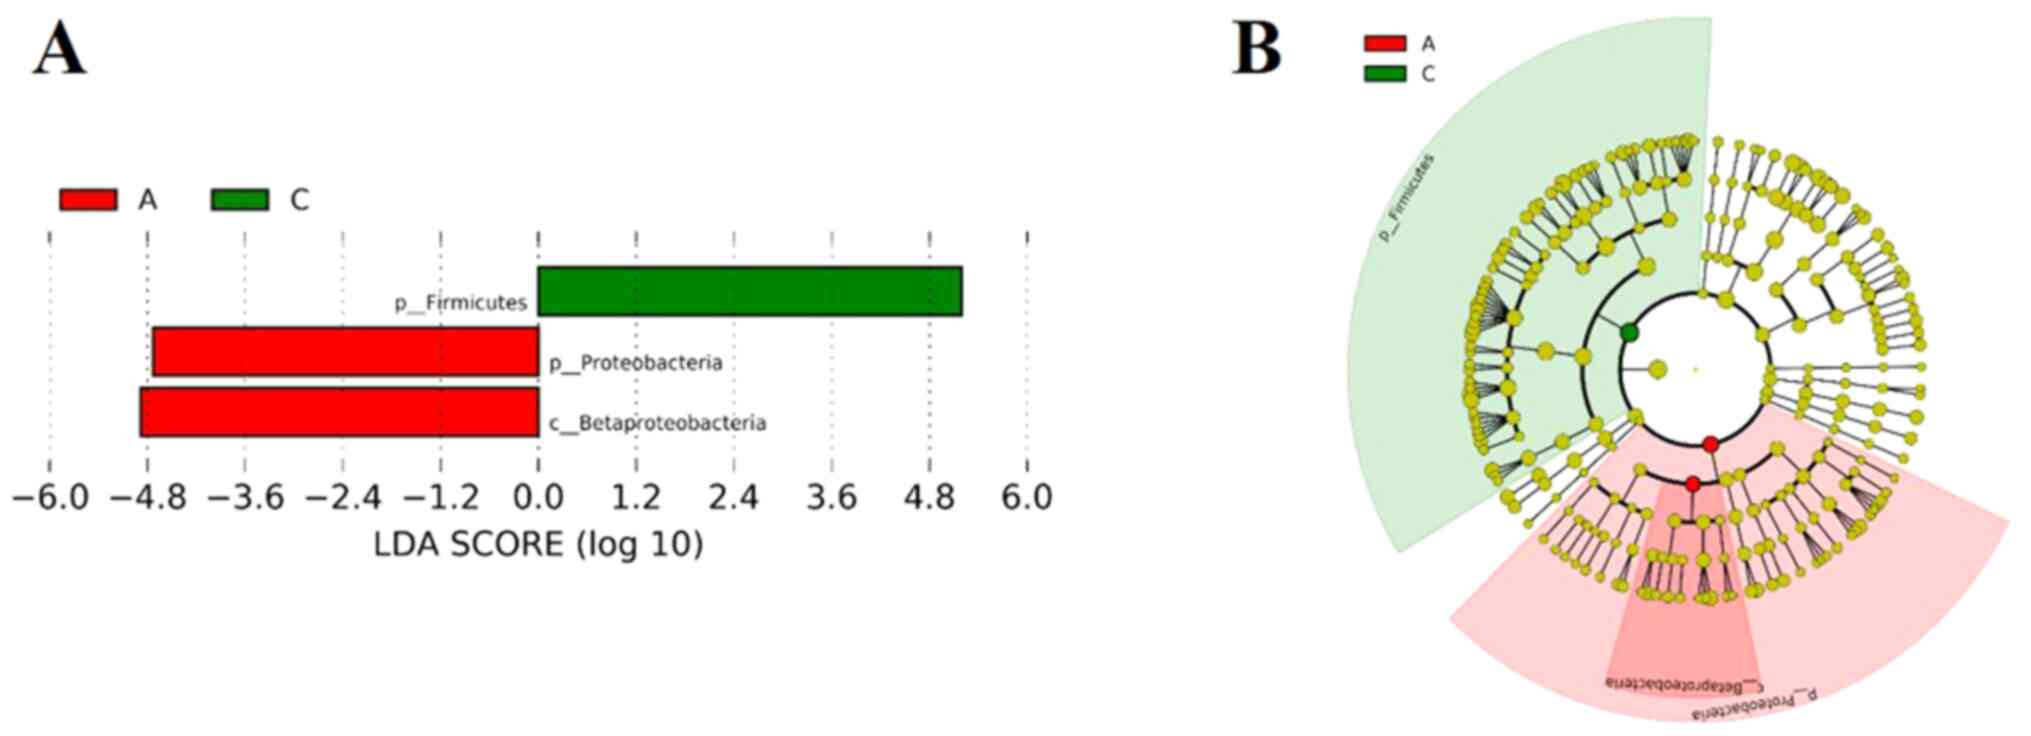 |
Figure 4
LEfSe analyses of the gut microbiota among the three groups. (A) List of taxa that differed between groups A and C, ranked according to the effect size. (B) Chadogram illustrating taxonomic representation of differences between groups A and C. The patients were divided into the three groups according to the HbA1c levels as follows: Group A (HbA1c levels, ≥53 but <75 mmol/mol), group B (HbA1c levels, ≥75 but ≤97 mmol/mol) and group C HbA1c levels, >97 mmol/mol). HbA1c, hemoglobin A1c (glycated hemoglobin); LEfSe, linear discriminant analysis effect size.
|
Discussion
Metagenomic studies have revealed that the most abundant phyla in the gut microbiota present in both human and mice are Bacteroidetes and Firmicutes, which account for ~90% of the total community. In addition, other subdominant phyla, such as Proteobacteria, Actinobacteria and Verrucomicrobia are found in low abundance (15,16). In healthy mammals, the associatoin between the two dominant phyla, expressed as the Firmicutes/Bacteroidetes ratio, is relatively stable. An increase or a decrease in the Firmicutes/Bacteroidetes ratio can lead to the development of metabolic disorders. In particular, a previous study established that the Firmicutes/Bacteroidetes ratio was associated with the progression of diabetes mellitus (17). The major alterations in diabetes include a significantly lower abundance of Firmicutes and an increased enrichment of Bacteroidetes, which is consistent with the findings of previous studies (18-20). Lambeth et al (21) found that the ratios of Bacteroides/Firmicutes were positively associated with blood glucose levels, demonstrating that changes in the gut microbiota were closely related to reductions in glucose tolerance. The present study focused on the associations of the gut microbiota with different HbA1c levels in patients with T2DM. The 16S rRNA V3-V4 region was sequenced and it was identified that the Firmicutes/Bacteroidetes ratio was negatively associated with HbA1c levels, which is similar with the findings of a previous study (22). A recent study on Chinese adult patients with T1D proved that the Firmicutes/Bacteroidetes ratio was found to be reduced. Moreover, the Firmicutes/Bacteroidetes ratio was found to be negatively associated with serum levels of HbA1c (22).
Several metabolic products of gut microbiota metabolism are involved in the regulation of glucose metabolism, including short-chain fatty acids (SCFAs), trimethylamine N-oxide (TMAO), bile acids and indole propionic acids (23). SCFAs are produced by the fermentation of dietary fibers in the human colon, which are one of the major end products of bacterial fermentation (24). The main SCFAs are acetate, propionate and butyrate. SCFAs, particularly butyrate, improve insulin sensitivity and secretion by binding to G-protein coupled receptors (GPCR), such as GPCR41 and GPCR43, which are expressed in the human colon and the small intestine (25). Moreover, these receptors are also expressed in various insulin sensitive tissues, such as the liver, pancreatic β-cells, adipose tissue and skeletal muscle (26,27). SCFAs have been shown to stimulate insulin secretion and improve glucose homeostasis by stimulating GLP-1 and peptide YY (PYY) (28). There is increasing evidence to suggest that deficiency in SCFA production has been associated with the development of T2DM. Furthermore, Chinese patients with T2DM have been shown to exhibit a significant decrease in butyrate-producing bacteria, compared with healthy individuals (20). As previously demonstrated, when the promotion of SCFA production is targeted by personalized nutrition, participants were shown to exhibit an improvement in HbA1c levels (29). In the present study, group C exhibited a decrease in the Firmicutes/Bacteroidetes ratio, which partly explained the elevated HbA1c level in this group as SCFA production may be deficient.
Bile acids (BAs) are synthesized from cholesterol in the hepatocytes as primary BAs and transformed in the intestine into secondary BAs by the gut microbiota (30). While BAs have long been regarded solely to facilitate fat digestion and absorption (31), there is recent compelling evidence to indicate BAs also play an important role in blood glucose homeostasis (32,33). Some ex vivo and in vitro studies have suggested that BAs may affect glucose metabolism through interaction with the nuclear receptor farnesoid X receptor (FXR) (34) and Takeda G-protein-coupled receptor 5 (TGR5) (35), both of which are expressed in enteroendocrine L-cells. Published studies have demonstrated that the activation of FXR and TGR5 by BAs increase GLP-1 secretion to improve hyperglycemia and insulin sensitivity (36,37). Recently, BA sequestrants have been shown to improve glycemic control (38) and have been approved for the treatment of T2DM in the USA (39), even though the mechanisms of action are not yet fully understood. There is evidence to suggest that certain glucose-lowering agents, such as α-glucosidase inhibitor and metformin, substantially affect the gut microbiota and intervene with microbial BA metabolism (40,41). In the present study, the TBA level in group C was higher than that in groups A and B; however, there was no statistically significant difference between groups C and A. The TBA level was not consistent with the changes in the HbA1c level, which was perhaps associated with glucose-lowering agents. The change in BA composition induced by anti-diabetic medication has also been reported, which may improve metabolic health (42).
However, there were several limitations to the present study. Firstly, it should be acknowledged that the sample size was relatively small and limited. Another limitation is that the effects of different HbA1c levels on metabolic changes, such as SCFAs, TMAO and indole propionic acids, were not investigated in the present study. Therefore, these possible roles and mechanisms need to be investigated in future studies.
In conclusion, the present study randomly recruited 30 participants in the inpatient ward. After the 30 screened volunteers were enrolled, all participants were assigned to each group according to the HbA1c values. In the Department of Endocrinology of the Second Hospital of Hebei Medical University, the majority of patients were admitted to the inpatient ward owing to poor glycemic control. The HbA1c values of all participants were high. Thus, the association between the composition modulation of the gut microbiota and the diverse degrees of blood glucose control were examined and discussed. It was demonstrated that the HbA1c levels modulated the composition of the gut microbiota. As the HbA1c levels increased, the microbial richness and inner diversity of the gut microbiome slightly increased. Moreover, the Firmicutes/Bacteroidetes ratio was reduced with the increase in blood glucose levels, indicating a potential strategy for regulating glucose metabolism in the future. However, another limitation to the present study was that no group with normal HbA1c levels was included. In future studies, the authors aim to enroll more participants in the outpatient department and inpatient ward.
Acknowledgements
Not applicable.
Funding
The present study was funded by The Natural Science Foundation of Hebei Province (CN) H2020206108.
Availability of data and materials
The datasets used and/or analyzed during the current study are available from the corresponding author on reasonable request.
Authors' contributions
MW as the corresponding author was responsible for the conception and design of the study and performed the critical review of the manuscript. YC as the first author was involved in data collection and analysis, writing and manuscript preparation and revisions, as well as in the conception and design of the study. RM was also involved in data collection and analysis, as well as in the conception and design of the study. All authors confirm the authenticity of all the raw data. All authors have read and approved the final manuscript.
Ethics approval and consent to participate
The study conformed to the principles of the Declaration of Helsinki and was approved by the Ethics Committee of the Second Hospital of Hebei Medical University (Approval Number 2020-R467) in China. All patients provided written informed consent.
Patient consent for publication
Not applicable.
Competing interests
The authors declare that they have no competing interests.
References
|
1
|
Bordalo Tonucci L, Dos Santos KM, De Luces Fortes Ferreira CL, Ribeiro SM, De Oliveira LL and Martino HS: Gut microbiota and probiotics: Focus on diabetes mellitus. Crit Rev Food Sci Nutr. 57:2296–2309. 2017.PubMed/NCBI View Article : Google Scholar
|
|
2
|
Jandhyala SM, Talukdar R, Subramanyam C, Vuyyuru H, Sasikala M and Nageshwar Reddy D: Role of the normal gut microbiota. World J Gastroenterol. 21:8787–8803. 2015.PubMed/NCBI View Article : Google Scholar
|
|
3
|
Giambò F, Italia S, Teodoro M, Briguglio G, Furnari N, Catanoso R, Costa C and Fenga C: Influence of toxic metal exposure on the gut microbiota (Review). World Acad Sci J: Feb 2, 2021 (Epub ahead of print). doi: org/10.3892/wasj.2021.90.
|
|
4
|
Kalinkovich A and Livshits G: A cross talk between dysbiosis and gut-associated immune system governs the development of inflammatory arthropathies. Semin Arthritis Rheum. 49:474–484. 2019.PubMed/NCBI View Article : Google Scholar
|
|
5
|
Karlsson FH, Tremaroli V, Nookaew I, Bergström G, Behre CJ, Fagerberg B, Nielsen J and Bäckhed F: Gut metagenome in European women with normal, impaired and diabetic glucose control. Nature. 498:99–103. 2013.PubMed/NCBI View Article : Google Scholar
|
|
6
|
Bianchi F, Duque ALRF, Saad SMI and Sivieri K: Gut microbiome approaches to treat obesity in humans. Appl Microbiol Biotechnol. 103:1081–1094. 2019.PubMed/NCBI View Article : Google Scholar
|
|
7
|
Battson ML, Lee DM, Weir TL and Gentile CL: The gut microbiota as a novel regulator of cardiovascular function and disease. J Nutr Biochem. 56:1–15. 2018.PubMed/NCBI View Article : Google Scholar
|
|
8
|
Everard A, Lazarevic V, Derrien M, Girard M, Muccioli GG, Neyrinck AM, Possemiers S, Van Holle A, François P, de Vos WM, et al: Responses of gut microbiota and glucose and lipid metabolism to prebiotics in genetic obese and diet-induced leptin-resistant mice. Diabetes. 60:2775–2786. 2011.PubMed/NCBI View Article : Google Scholar
|
|
9
|
Brunkwall L and Orho-Melander M: The gut microbiome as a target for prevention and treatment of hyperglycaemia in type 2 diabetes: From current human evidence to future possibilities. Diabetologia. 60:943–951. 2017.PubMed/NCBI View Article : Google Scholar
|
|
10
|
Wu H, Esteve E, Tremaroli V, Khan MT, Caesar R, Mannerås-Holm L, Ståhlman M, Olsson LM, Serino M, Planas-Fèlix M, et al: Metformin alters the gut microbiome of individuals with treatment-naive type 2 diabetes, contributing to the therapeutic effects of the drug. Nat Med. 23:850–858. 2017.PubMed/NCBI View Article : Google Scholar
|
|
11
|
Su B, Liu H, Li J, Sunli Y, Liu B, Liu D, Zhang P and Meng X: Acarbose treatment affects the serum levels of inflammatory cytokines and the gut content of bifidobacteria in Chinese patients with type 2 diabetes mellitus. J Diabetes. 7:729–739. 2015.PubMed/NCBI View Article : Google Scholar
|
|
12
|
Zhao L, Chen Y, Xia F, Abudukerimu B, Zhang W, Guo Y, Wang N and Lu Y: A Glucagon-Like Peptide-1 Receptor Agonist Lowers Weight by Modulating the Structure of Gut Microbiota. Front Endocrinol (Lausanne). 9(233)2018.PubMed/NCBI View Article : Google Scholar
|
|
13
|
Liao X, Song L, Zeng B, Liu B, Qiu Y, Qu H, Zheng Y, Long M, Zhou H, Wang Y, et al: Alteration of gut microbiota induced by DPP-4i treatment improves glucose homeostasis. EBioMedicine. 44:665–674. 2019.PubMed/NCBI View Article : Google Scholar
|
|
14
|
Alberti KG and Zimmet PZ: Definition, diagnosis and classification of diabetes mellitus and its complications. Part 1: Diagnosis and classification of diabetes mellitus provisional report of a WHO consultation. Diabet Med. 15:539–553. 1998.PubMed/NCBI View Article : Google Scholar
|
|
15
|
Rodriguez-Valera F, Martin-Cuadrado AB, Rodriguez-Brito B, Pasić L, Thingstad TF, Rohwer F and Mira A: Explaining microbial population genomics through phage predation. Nat Rev Microbiol. 7:828–836. 2009.PubMed/NCBI View Article : Google Scholar
|
|
16
|
Qin J, Li R, Raes J, Arumugam M, Burgdorf KS, Manichanh C, Nielsen T, Pons N, Levenez F, Yamada T, et al: MetaHIT Consortium: A human gut microbial gene catalogue established by metagenomic sequencing. Nature. 464:59–65. 2010.PubMed/NCBI View Article : Google Scholar
|
|
17
|
Zhao L, Lou H, Peng Y, Chen S, Zhang Y and Li X: Comprehensive relationships between gut microbiome and faecal metabolome in individuals with type 2 diabetes and its complications. Endocrine. 66:526–537. 2019.PubMed/NCBI View Article : Google Scholar
|
|
18
|
Roager HM, Vogt JK, Kristensen M, Hansen LBS, Ibrügger S, Mærkedahl RB, Bahl MI, Lind MV, Nielsen RL, Frøkiær H, et al: Whole grain-rich diet reduces body weight and systemic low-grade inflammation without inducing major changes of the gut microbiome: A randomised cross-over trial. Gut. 68:83–93. 2019.PubMed/NCBI View Article : Google Scholar
|
|
19
|
Larsen N, Vogensen FK, van den Berg FW, Nielsen DS, Andreasen AS, Pedersen BK, Al-Soud WA, Sørensen SJ, Hansen LH and Jakobsen M: Gut microbiota in human adults with type 2 diabetes differs from non-diabetic adults. PLoS One. 5(e9085)2010.PubMed/NCBI View Article : Google Scholar
|
|
20
|
Qin J, Li Y, Cai Z, Li S, Zhu J, Zhang F, Liang S, Zhang W, Guan Y, Shen D, et al: A metagenome-wide association study of gut microbiota in type 2 diabetes. Nature. 490:55–60. 2012.PubMed/NCBI View Article : Google Scholar
|
|
21
|
Lambeth SM, Carson T, Lowe J, Ramaraj T, Leff JW, Luo L, Bell CJ and Shah VO: Composition, diversity and abundance of gut microbiome in prediabetes and type 2 diabetes. J Diabetes Obes. 2:1–7. 2015.PubMed/NCBI View Article : Google Scholar
|
|
22
|
Huang Y, Li SC, Hu J, Ruan HB, Guo HM, Zhang HH, Wang X, Pei YF, Pan Y and Fang C: Gut microbiota profiling in Han Chinese with type 1 diabetes. Diabetes Res Clin Pract. 141:256–263. 2018.PubMed/NCBI View Article : Google Scholar
|
|
23
|
Ebrahimzadeh Leylabadlo H, Sanaie S, Sadeghpour Heravi F, Ahmadian Z and Ghotaslou R: From role of gut microbiota to microbial-based therapies in type 2-diabetes. Infect Genet Evol. 81(104268)2020.PubMed/NCBI View Article : Google Scholar
|
|
24
|
Dalile B, Vervliet B, Bergonzelli G, Verbeke K and Van Oudenhove L: Colon-delivered short-chain fatty acids attenuate the cortisol response to psychosocial stress in healthy men: A randomized, placebo-controlled trial. Neuropsychopharmacology. 45:2257–2266. 2020.PubMed/NCBI View Article : Google Scholar
|
|
25
|
Macia L, Thorburn AN, Binge LC, Marino E, Rogers KE, Maslowski KM, Vieira AT, Kranich J and Mackay CR: Microbial influences on epithelial integrity and immune function as a basis for inflammatory diseases. Immunol Rev. 245:164–176. 2012.PubMed/NCBI View Article : Google Scholar
|
|
26
|
Priyadarshini M, Villa SR, Fuller M, Wicksteed B, Mackay CR, Alquier T, Poitout V, Mancebo H, Mirmira RG, Gilchrist A, et al: An acetate-specific GPCR, FFAR2, regulates insulin secretion. Mol Endocrinol. 29:1055–1066. 2015.PubMed/NCBI View Article : Google Scholar
|
|
27
|
Ørgaard A, Jepsen SL and Holst JJ: Short-chain fatty acids and regulation of pancreatic endocrine secretion in mice. Islets. 11:103–111. 2019.PubMed/NCBI View Article : Google Scholar
|
|
28
|
Everard A and Cani PD: Gut microbiota and GLP-1. Rev Endocr Metab Disord. 15:189–196. 2014.PubMed/NCBI View Article : Google Scholar
|
|
29
|
Zhao L, Zhang F, Ding X, Wu G, Lam YY, Wang X, Fu H, Xue X, Lu C, Ma J, et al: Gut bacteria selectively promoted by dietary fibers alleviate type 2 diabetes. Science. 359:1151–1156. 2018.PubMed/NCBI View Article : Google Scholar
|
|
30
|
Sivamaruthi BS, Fern LA, Rashidah Pg Hj Ismail DS and Chaiyasut C: The influence of probiotics on bile acids in diseases and aging. Biomed Pharmacother. 128(110310)2020.PubMed/NCBI View Article : Google Scholar
|
|
31
|
Wahlström A, Sayin SI, Marschall HU and Bäckhed F: Intestinal crosstalk between bile acids and microbiota and its impact on host metabolism. Cell Metab. 24:41–50. 2016.PubMed/NCBI View Article : Google Scholar
|
|
32
|
Higuchi S: The physiological importance of bile acid structure and composition on glucose homeostasis. Curr Diab Rep. 20(42)2020.PubMed/NCBI View Article : Google Scholar
|
|
33
|
Chávez-Talavera O, Tailleux A, Lefebvre P and Staels B: Bile acid control of metabolism and inflammation in obesity, type 2 diabetes, dyslipidemia, and nonalcoholic fatty liver disease. Gastroenterology. 152:1679–1694.e3. 2017.PubMed/NCBI View Article : Google Scholar
|
|
34
|
Trabelsi MS, Daoudi M, Prawitt J, Ducastel S, Touche V, Sayin SI, Perino A, Brighton CA, Sebti Y, Kluza J, et al: Farnesoid X receptor inhibits glucagon-like peptide-1 production by enteroendocrine L cells. Nat Commun. 6(7629)2015.PubMed/NCBI View Article : Google Scholar
|
|
35
|
Thomas C, Gioiello A, Noriega L, Strehle A, Oury J, Rizzo G, Macchiarulo A, Yamamoto H, Mataki C, Pruzanski M, et al: TGR5-mediated bile acid sensing controls glucose homeostasis. Cell Metab. 10:167–177. 2009.PubMed/NCBI View Article : Google Scholar
|
|
36
|
Rajani C and Jia W: Bile acids and their effects on diabetes. Front Med. 12:608–623. 2018.PubMed/NCBI View Article : Google Scholar
|
|
37
|
González-Regueiro JA, Moreno-Castañeda L, Uribe M and Chávez-Tapia NC: The role of bile acids in glucose metabolism and their relation with diabetes. Ann Hepatol. 16 (Suppl 1: s3-105):16–21. 2017.PubMed/NCBI View Article : Google Scholar
|
|
38
|
Hansen M, Sonne DP, Mikkelsen KH, Gluud LL, Vilsbøll T and Knop FK: Bile acid sequestrants for glycemic control in patients with type 2 diabetes: A systematic review with meta-analysis of randomized controlled trials. J Diabetes Complications. 31:918–927. 2017.PubMed/NCBI View Article : Google Scholar
|
|
39
|
Inzucchi SE, Bergenstal RM, Buse JB, Diamant M, Ferrannini E, Nauck M, Peters AL, Tsapas A, Wender R and Matthews DR: Management of hyperglycemia in type 2 diabetes, 2015: a patient-centered approach: update to a position statement of the American Diabetes Association and the European Association for the Study of Diabetes. Diabetes Care. 38:140–149. 2015.PubMed/NCBI View Article : Google Scholar
|
|
40
|
Sansome DJ, Xie C, Veedfald S, Horowitz M, Rayner CK and Wu T: Mechanism of glucose-lowering by metformin in type 2 diabetes: Role of bile acids. Diabetes Obes Metab. 22:141–148. 2020.PubMed/NCBI View Article : Google Scholar
|
|
41
|
Qiu Y, Shen L, Fu L, Yang J, Cui C, Li T, Li X, Fu C, Gao X, Wang W, et al: The glucose-lowering effects of α-glucosidase inhibitor require a bile acid signal in mice. Diabetologia. 63:1002–1016. 2020.PubMed/NCBI View Article : Google Scholar
|
|
42
|
Gu Y, Wang X, Li J, Zhang Y, Zhong H, Liu R, Zhang D, Feng Q, Xie X, Hong J, et al: Analyses of gut microbiota and plasma bile acids enable stratification of patients for antidiabetic treatment. Nat Commun. 8(1785)2017.PubMed/NCBI View Article : Google Scholar
|


