Introduction
Influenza viruses cause a potentially fatal, highly contagious respiratory disease. Influenza viruses have a negative-sense, single-stranded, segmented RNA genome and belong to the Orthomyxoviridae family (1). Influenza A viruses are classified into subtypes based on the antigenicity of their hemagglutinin and neuraminidase molecules. Influenza B viruses are classified into two lineages, Victoria and Yamagata (2). Over the past 10 years, influenza A virus subtypes H1N1 and H3N2, and both lineages of influenza B viruses have affected the Mexican population (3).
Worldwide anti-vaccine groups, overpopulation and overcrowding in Latin America have made respiratory diseases, such as influenza, a public health concern that increases work absenteeism, and leads to complications due to not being diagnosed and treated on time and efficiently, thus affecting the quality of life of patients. With the arrival of the coronavirus 2019 (COVID-19) pandemic, the identification of the clinical characteristics of influenza is of even greater importance.
Previous retrospective studies have characterized the epidemiology of influenza infections in Mexico (4,5). Ruiz-Matus et al (4) reported that the influenza seasons in Mexico exhibited clear seasonality. They demonstrated that the productive age population that was not vaccinated and had one or more comorbidities had a greater risk of succumbing to the influenza viruses (4).
Mata-Marín et al (6) reported the risk factors associated with mortality in patients infected with the pandemic influenza A H1N1 subtype in 2009; nevertheless, they only analyzed 11 patients. To date, at least to the best of our knowledge, no other studies are available that report the risk factors associated with hospitalization due to influenza viruses in Mexico.
Therefore, the present study aimed to determine the epidemiological characteristics of patients with influenza infections in Northern Mexico during five influenza seasons and to elucidate the risk factors responsible for hospitalization in order to improve diagnosis, treatment and prognosis.
Patients and methods
Study design
The present retrospective study evaluated data from patients with confirmed influenza infection tested by the Public Health State Laboratory of Nuevo León (Nuevo León, Mexico). The Public Health State laboratory receives samples from the state's sanitary jurisdictions and hospitals for the molecular detection of influenza using reverse transcription-quantitative PCR (RT-qPCR). Data from October 21, 2009 to December 31, 2014 were evaluated. The definitions used were influenza-like illness (ILI), an individual of any age with fever (body temperature ≥38˚C), cough and headache, plus one or more of the following: Rhinorrhea, nasal congestion, odynophagia, arthralgia, myalgia, weakness, thoracic pain, abdominal pain, or diarrhea. In children <5 years of age, irritability was considered instead of a headache. In adults >65 years of age or in immunocompromised individuals, the presence of fever was not required. A patient with severe acute respiratory infection (SARI) was defined as an individual of any age with dyspnea, fever and cough plus one or more of the following: Malaise, thoracic pain, or polypnea, or who required hospitalization. Cases were analyzed by sex, age, municipality of residence, symptomatology, comorbidities, type of care (ambulatory or hospitalized) and vaccination history.
Laboratory confirmation
Cases were confirmed using RT-qPCR following the protocol described by the Centers for Disease Control and Prevention (CDC) (7) as stated in The Respiratory Disease Surveillance in the Americas (SARInet) (8). RT-qPCR detected influenza A/H1N1-pdm09, A/H3N2 and influenza B. Samples were obtained using rayon swabs (Copan, Probiotek) and preserved in viral transport medium (Universal Viral Transport; BD Biosciences). RNA was extracted using the MagNa Pure LC Total Nucleic Acid Isolation kit (Roche Diagnostics GmbH). The RT-qPCR assays were performed using the SuperScript III Platinum One-Step qRT-PCR kit (Invitrogen; Thermo Fisher Scientific, Inc.) on a 7500 Fast Real-Time PCR System (Applied Biosystems; Thermo Fisher Scientific, Inc.), as described in the manufacturer's protocol. The conditions used for the amplification were, for a 25 µl sample, reverse transcription, one cycle at 50˚C for 30 min, denaturation, one cycle at 95˚C for 2 min and then amplification for 45 cycles of 95˚C for 15 sec each; CT values <36 were aimed for. The primers used, as well as the protocols, were those established and validated by the World Health Organization (WHO) for the molecular diagnosis of influenza viruses (9) and as presented in Table SI.
Ethics statement
All subjects gave their informed consent for inclusion prior to participation in the study. The study was performed according to the Declaration of Helsinki. The protocol was approved by the Ethics Committee of the Hospital Metropolitano ‘Dr. Bernardo Sepúlveda’ with the registration code HMBSSSNL-2016/739 and the School of Medicine, Autonomous University of Nuevo León Ethics Committee with the code BI14-002. All patient information was de-identified to conserve anonymity.
Statistical analysis
Patient demographics and clinical characteristics were determined. Bivariable associations with confirmed influenza infection were determined using the Chi squared and Fisher's exact tests. Data were analyzed and it was determined that the distribution was non-parametric; thus, the Kruskal-Wallis test was used to analyze continuous variables, followed by post hoc analysis using the Mann-Whitney U with Bonferroni correction applied. All variables with P-values ≤0.25 in the bivariate analysis were considered in the multivariate model, which was determined using binary logistic regression and a backward stepwise selection procedure with the Wald test (entry, 51% exit, 10%). Data were entered and analyzed using IBM SPSS Statistics v20 (IBM Corp.). P-values <0.05 were considered to indicate statistically significant differences.
Results
Patient diagnostics
In the present study, a total of 3,482 patients diagnosed with influenza from October, 2009 to December, 2014 in Nuevo León state in Mexico were examined. This period spanned five complete influenza seasons and half the influenza season of 2014-2015. In total, 79% (n=2,611) of these patients had ILI (ambulatory treatment) and 21% (n=871) SARI (required hospitalization).
Of the total study population, 54% (n=1,874) were females; the median age was 27 years (range, 11 days old-93 years). The most affected age group (Table SII) was that between 25-44 years (31%, n=1,077), followed by 45-64 years (18%, n=635). Patients aged between 5-44 years of age comprised 64% of the total study population (n=2,222). The most prevalent occupations were housewives (22%, n=774), followed by students (21%, n=735) and employees (14%, n=484) (Table I).
 |
Table I
Clinical features of the ambulatory and hospitalized patients in Nuevo León, Mexico.
|
Table I
Clinical features of the ambulatory and hospitalized patients in Nuevo León, Mexico.
| |
Total |
Ambulatory n (%) |
Hospitalized n (%) |
P-valuea |
| Comorbidity |
|
|
|
|
| Diabetes |
276 |
136(5) |
140(16) |
<0.001 |
| COPD |
61 |
22(1) |
39(4) |
<0.001 |
| Asthma |
176 |
124(5) |
52(6) |
0.084 |
| Immunosuppression |
47 |
21(1) |
26(3) |
<0.001 |
| Hypertension |
230 |
131(5) |
99(11) |
<0.001 |
| HIV/AIDS |
18 |
7 (0.3) |
11(1) |
0.001 |
| Cardiac disease |
63 |
40(2) |
23(3) |
0.017 |
| Obesity |
280 |
190(7) |
90(10) |
0.001 |
| Chronic kidney disease |
47 |
19(1) |
28(3) |
<0.001 |
| Vaccinated |
733 |
602(23) |
131(15) |
<0.001 |
| Symptom |
|
|
|
|
| Fever |
3,260 |
2,469(95) |
791(91) |
0.008 |
| Cough |
3,220 |
2,441(93) |
779(89) |
0.565 |
| Odynophagia |
1,901 |
1,546(59) |
355(41) |
<0.001 |
| Dyspnea |
1,276 |
719(28) |
557(64) |
<0.001 |
| Irritability |
815 |
600(23) |
215(25) |
0.073 |
| Diarrhea |
391 |
285(11) |
106(12) |
0.130 |
| Thoracic pain |
1,302 |
951(36) |
351(40) |
<0.001 |
| Chills |
2,359 |
1,922(74) |
437(50) |
<0.001 |
| Headache |
2,846 |
2,266(87) |
580(67) |
<0.001 |
| Myalgia |
2,514 |
2,009(77) |
505(58) |
<0.001 |
| Arthralgia |
2,361 |
1,859(71) |
502(58) |
<0.001 |
| Malaise |
2,718 |
2,049(78) |
669(77) |
0.137 |
| Rhinorrhea |
2,567 |
2,068(79) |
499(57) |
<0.001 |
| Polypnea |
608 |
302(12) |
306(35) |
<0.001 |
| Vomiting |
444 |
355(14) |
89(10) |
1.000 |
| Abdominal pain |
686 |
541(21) |
145(17) |
0.086 |
| Conjunctivitis |
754 |
631(24) |
123(14) |
<0.001 |
| Cyanosis |
148 |
52(2) |
96(11) |
<0.001 |
| Sudden onset |
2,510 |
1,983(76) |
527(61) |
<0.001 |
| Influenza subtype |
|
|
|
|
| A H3N2 |
929 |
756(29) |
173(20) |
<0.001 |
| A H1N1 pdm09 |
1,797 |
1,263(48) |
534(61) |
<0.001 |
| A N/S |
326 |
240(9) |
86(10) |
0.546 |
| B |
430 |
352(13) |
78(9) |
<0.001 |
| Occupation |
|
|
|
|
| Employee |
484 |
329(13) |
155(18) |
<0.001 |
| Student |
735 |
670(26) |
65(7) |
<0.001 |
| House activities |
774 |
551(21) |
223(26) |
<0.001 |
Diabetes (n=276) and obesity (n=280) were the most prevalent comorbidities, both present in 8% of the study population. Hypertension (n=230) affected 7% and asthma (n=176) affected 5% of the patients. Chronic obstructive pulmonary disease (COPD; n=61) and heart disease (n=63) affected 2% of the patients. Chronic kidney disease (n=47) and immunosuppression (n=47) affected 1% of the patients. In total, 21% of the patients reported being vaccinated against influenza (n=733) (Table I).
Fever (n=3,260) and cough (n=3,220) were the most prevalent symptoms in 94 and 93% of the patients, respectively. As regards severe symptomatology, 37% of the patients had dyspnea (n=1,276) and thoracic pain (n=1,302), 18% (n=608) had polypnea and 4% (n=148) had cyanosis (Table I).
Nuevo León is located in the northeast region of Mexico. It is surrounded by the state of Coahuila de Zaragoza, the United States border, and Tamaulipas state to the north; by Tamaulipas to the east; by Tamaulipas and San Luis Potosi to the south and by San Luis Potosi and Zacatecas to the west. Monterrey is the capital of Nuevo Leon and its metropolitan area comprises the municipalities of Monterrey, Guadalupe, Apodaca, San Nicolas de los Garza, General Escobedo, Juarez, Santa Catarina, Garcia and San Pedro Garza García. According to the 2015 census, Nuevo León has 5,131,938 inhabitants and 80% reside in the metropolitan area of Monterrey. As was expected, it was found that the majority of the cases were detected in the metropolitan area of Monterrey (Fig. 1).
 |
Figure 1
Geographical distribution of confirmed cases in Nuevo León by season. The names of each municipality are numbered in the lower-left box; 039 corresponds to the city of Monterrey, the state capital, which is the headquarters of the largest number of confirmed cases each season. The location of the state in the northeast region can be observed on the map of Mexico (upper left box), and a metric scale is included in each of the seasonal case state maps to relate surface and distance between municipalities.
|
The pandemic influenza A virus H1N1 subtype was responsible for 52% (n=1,797) of the cases in the present study, followed by influenza A virus H3N2 subtype (27% n=929) and influenza B (12% n=430). Notably, non-subtyped influenza A represented 9% (n=326) of the total cases.
Influenza seasons
As aforementioned, the present study evaluated five complete influenza seasons and half of the 2014-2015 influenza season. The proportion of ILIs (ambulatory treatment) and SARIs (hospitalized patients) varied across the influenza seasons analyzed (Table II). It was observed that the proportion of SARIs began at 35% in the 2009-2010 influenza season, diminished in the 2010-2011, 2011-2012 and 2012-2013 (6-13%) influenza seasons, and later increased in the 2013-2014 and 2014-2015 (28-31%) influenza seasons. No differences were observed in the sex proportion of patients across the evaluated seasons. The affected female proportion ranged from 51-58%.
|
Table II
Clinical features of influenza positive patients during the six (five and a half) evaluated influenza seasons in Nuevo León, Mexico.
|
Table II
Clinical features of influenza positive patients during the six (five and a half) evaluated influenza seasons in Nuevo León, Mexico.
| |
Influenza season, n (%) |
| Symptom |
2009-2010 |
2010-2011 |
2011-2012 |
2012-2013 |
2013-2014 |
2014-2015 |
P-valuea |
| Fever |
800(92) |
631(95) |
477(95) |
410(96) |
629(94) |
247(95) |
0.015 |
| Cough |
824(95) |
629(95) |
475(95) |
408(96) |
574(99) |
246(95) |
0.009 |
| Odynophagia |
527(61) |
379(57) |
267(54) |
232(55) |
320(56) |
142(56) |
0.071 |
| Dyspnea |
334(39) |
213(32) |
184(37) |
129(30) |
293(50) |
96(37) |
<0.001 |
| Irritability |
133(15) |
170(26) |
144(29) |
129(30) |
163(28) |
60(23) |
<0.001 |
| Diarrhea |
103(12) |
72(11) |
67(13) |
49(12) |
64(11) |
22(9) |
0.451 |
| Thoracic pain |
353(41) |
225(35) |
195(39) |
150(36) |
259(45) |
99(38) |
0.003 |
| Chills |
626(73) |
443(68) |
345(69) |
298(72) |
409(71) |
194(75) |
0.207 |
| Headache |
752(87) |
535(82) |
418(84) |
352(84) |
502(87) |
231(90) |
0.016 |
| Myalgia |
650(76) |
466(71) |
380(77) |
326(77) |
435(76) |
206(81) |
0.051 |
| Arthralgia |
612(71) |
430(66) |
354(71) |
309(73) |
423(74) |
187(73) |
0.028 |
| Malaise |
743(86) |
498(76) |
423(85) |
338(79) |
472(81) |
199(77) |
<0.001 |
| Rhinorrhea |
633(75) |
536(81) |
376(75) |
354(83) |
429(74) |
196(76) |
<0.001 |
| Polypnea |
173(20) |
100(15) |
89(18) |
63(15) |
133(23) |
42(16) |
0.002 |
| Vomiting |
73(15) |
104(17) |
72(16) |
82(20) |
71(15) |
27(13) |
0.207 |
| Abdominal pain |
210(25) |
120(18) |
114(23) |
89(21) |
93(16) |
44(17) |
0.001 |
| Conjunctivitis |
191(22) |
168(26) |
128(26) |
102(24) |
105(18) |
46(18) |
0.005 |
| Cyanosis |
50(6) |
23(4) |
20(4) |
11(3) |
35(6) |
5(2) |
0.006 |
| Sudden onset |
709(82) |
418(64) |
342(68) |
333(78) |
448(77) |
213(83) |
<0.001 |
| ILI (Ambulatory) |
633(71) |
543 (82) |
429(85) |
357(84) |
392(59) |
203(78) |
<0.001 |
| SARI (Hospitalized) |
257(29) |
122(18) |
76(15) |
67(16) |
277(41) |
56(22) |
<0.001 |
| Diabetes |
64(8) |
35(5) |
32(6) |
24(6) |
78(12) |
38(15) |
<0.001 |
| COPD |
12(1) |
16(2) |
4 (0.8) |
10(2) |
10(2) |
9(4) |
0.093 |
| Asthma |
37(4) |
51(8) |
22(4) |
21(5) |
23(4) |
19(7) |
0.014 |
| Immunosuppression |
14(2) |
5 (0.08) |
7(1) |
2 (0.5) |
13(2) |
4(2) |
0.146 |
| Hypertension |
44(5) |
50(8) |
29(6) |
23(6) |
60(10) |
20(8) |
0.006 |
| HIV/AIDS |
7 (0.8) |
3 (0.5) |
3 (0.6 |
0 (0) |
0 (0) |
5(2) |
0.007 |
| Heart disease |
17(2) |
10(2) |
11(2) |
2 (0.5) |
14(2) |
9(4) |
0.089 |
| Obesity |
85(11) |
41(6) |
34(7) |
24(6) |
63(11) |
27(10) |
0.001 |
| Chronic renal failure |
17(2) |
3 (0.5) |
6(1) |
4(1) |
8(1) |
8(3) |
0.023 |
| Tobacco consumption |
77(9) |
56(9) |
33(7) |
25(6) |
50(9) |
22(9) |
0.327 |
| Vaccinated |
172(19) |
208(31) |
81(16) |
114(27) |
93(14) |
31(12) |
<0.001 |
| Ocupation: Student |
194(22) |
148(22) |
114(23) |
129(30) |
82(12) |
60(23) |
<0.001 |
| Ocupation: Employee |
170(19) |
54(8) |
54(10) |
31(7) |
129(19) |
35(14) |
<0.001 |
| Ocupation: Home activities |
226(25) |
156(24) |
105(21) |
69(16) |
135(20) |
64(25) |
0.003 |
The age median and distribution varied across the influenza seasons analyzed, as illustrated in Fig. 2A. The median age was steady for the first three seasons (24-26 years), decreased in the 2012-2013 season to 19 years, increased in the 2013-2014 season to 37 years, and decreased to 30 years in the 2014-2015 season. It was observed that the age distribution in the 2010-2011 and 2012-2013 seasons concentrated in younger age groups (Fig. 2A).
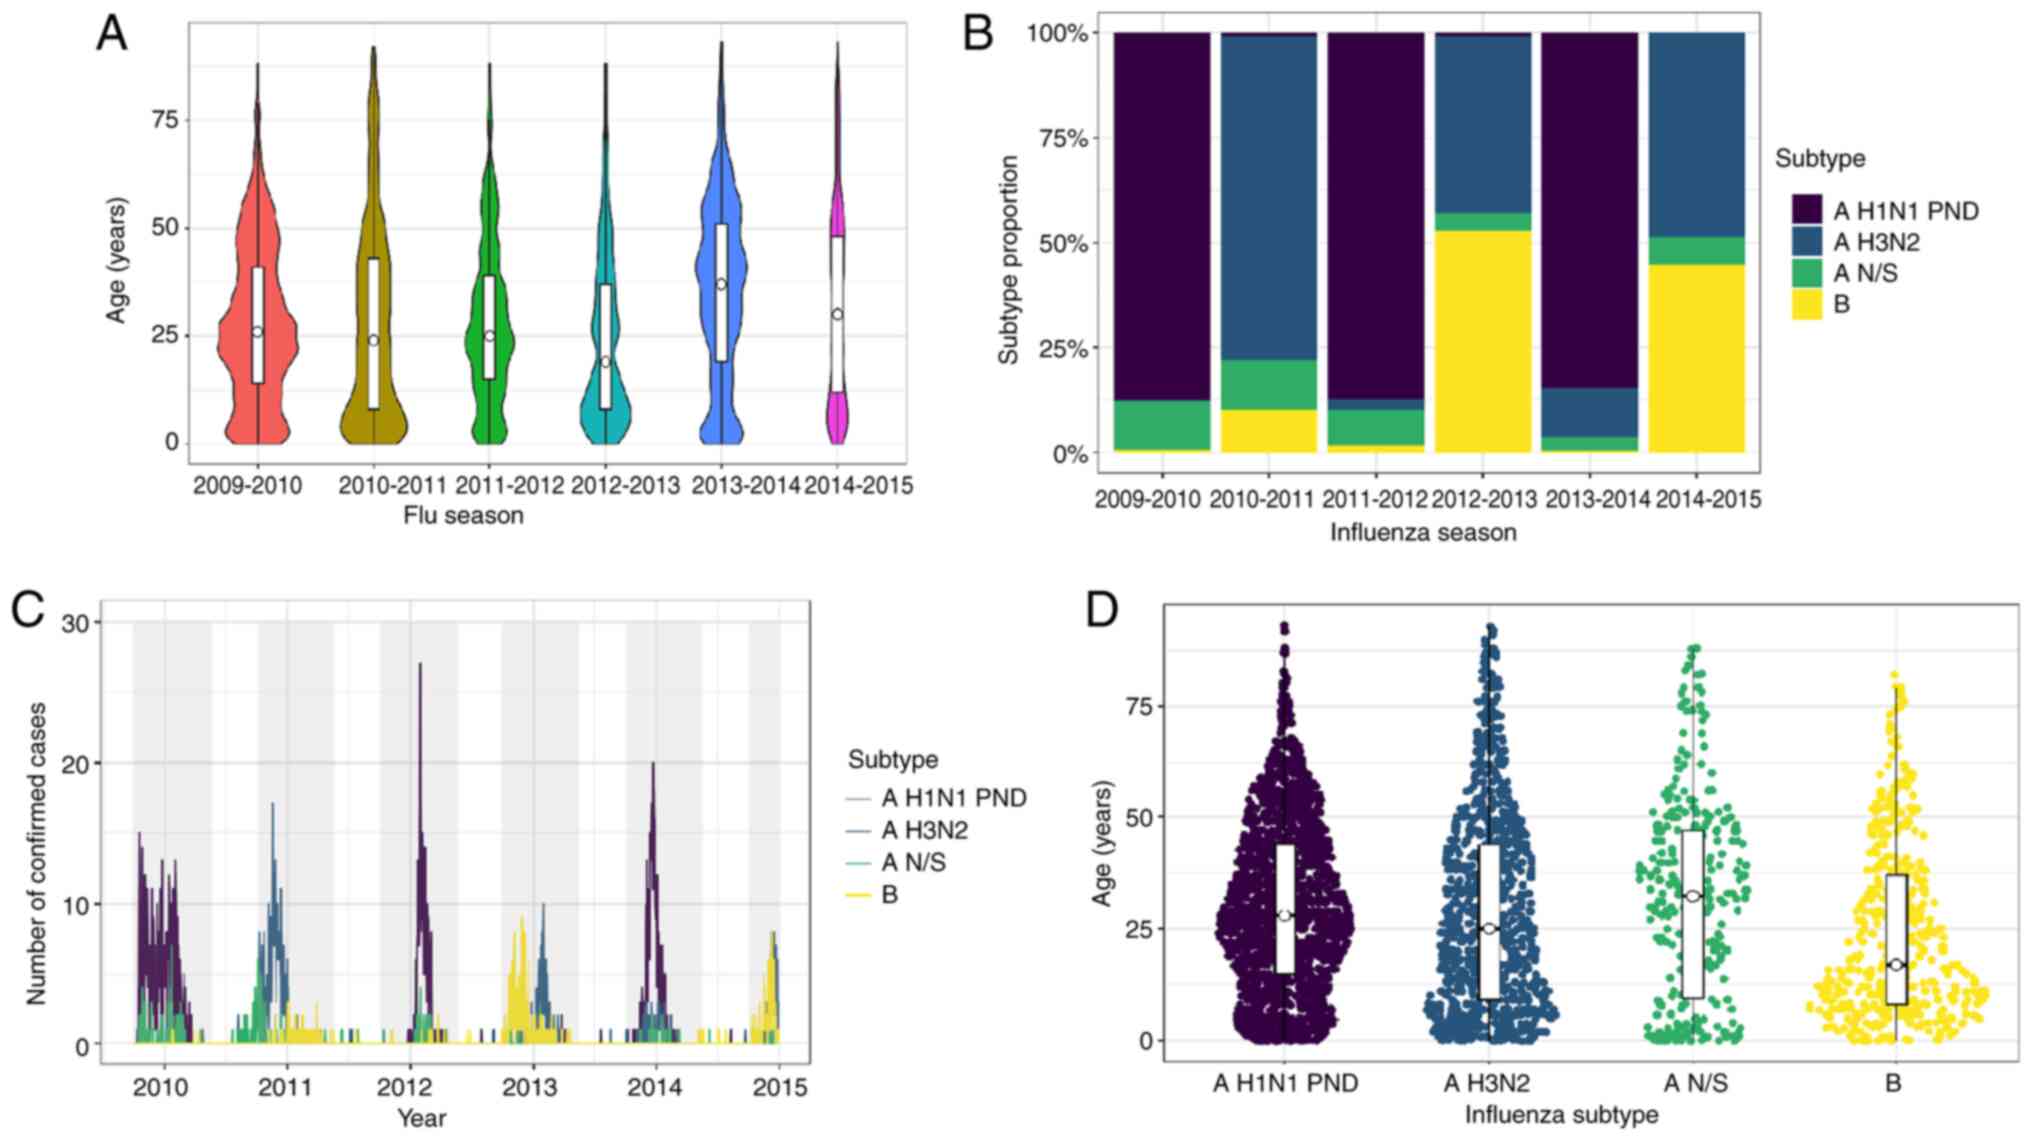 |
Figure 2
Comparison between seasons 2009-2014. (A) Age distribution by season. The median corresponds to the age group of young adults, from 19-37 years of age (Kruskall-Wallis test; P<0.05; season 2012-2013 vs. 2009-2010, 2013-2014, 2014-2015 and 2013-2014; season 2010-2011 vs. 2013-2014; and season 2011-2012 vs. 2013-2014). (B) Subtype proportion by season. Predominance alternates mainly between AH1N1-pdm and A H3N2. (C) Number of confirmed cases in the region during each season and subtype. A peak in the number of cases was observed in 2012 with a predominance of AH1N1-pdm. (D) Age distribution among influenza subtypes, showing variability between the median in each subtype (Kruskall-Wallis test; P<0.05; subtype B vs. AH3N2, N/S and AH1N1-pdm; subtype AH3N2 vs. AH1N1-pdm).
|
The proportion of comorbidities was analyzed across the six (five and a half) influenza seasons, as shown in Table II. The proportion of patients with diabetes increased over time (8-15%). The proportion of the other comorbidities remained unaltered. The proportion of vaccinated patients in the 2010-2011 and 2012-2013 seasons was 27-31%. In the remaining seasons, the proportion of vaccinated patients ranged from 12-19%.
The proportion of patient symptomatology across the different influenza seasons was also examined. The proportion of fever, odynophagia, diarrhea, vomiting, chills, headache, myalgia and cyanosis changed; however, they were the most prevalent symptoms across the seasons analyzed. A peak was observed in the proportion of patients with dyspnea and thoracic pain in the 2013-2014 influenza season. The complete symptomatology of the cases is presented in Table II.
Due to the 2009 pandemic, the most prevalent influenza subtype in the 2009-2010 season was pandemic influenza A virus H1N1 subtype (Fig. 2B). It was replaced predominantly by influenza A virus H3N2 subtype in the 2010-2011 season, and it returned in the 2011-2012 season. Interestingly, influenza B predominated in season 2012-2013 (53% of confirmed cases). Pandemic influenza A virus H1N1 subtype caused 85% of the confirmed cases in the 2013-2014 season. Influenza A virus H3N2 subtype and influenza B virus shared the 2014-2015 season in a similar proportion (Fig. 2B).
Influenza subtypes
A pattern was observed in infecting subtypes affecting the state, first the pandemic influenza AH1N1 subtype in the 2009-2010 season, followed by the AH3N2 subtype in the 2010-2011 season. This pattern was repeated until the 2014-2015 season (Fig. 2C). The B subtype appeared subtly in the second part of the 2010-2011 season. Nevertheless, the B subtype was responsible for almost all the infections in the first part of the 2012-2013 season and affected individuals in the same proportion as AH3N2 in the 2014-2015 season (Fig. 2C). Non-subtyped influenza A was detected mostly in the 2009-2010 seasons and in the next ensuing 2010-2011 winter season.
Pandemic AH1N1 and non-subtyped influenza A caused 70% (1,263) of ILIs and 30% (534) of SARIs. By contrast, AH3N2 and B caused ~80% of ILIs and ~18% SARIs (Table SIII); this was inferred according to the definition of ILIs and SARI (as described in the Patients and methods section, all the ambulatory patients are considered ILI, and the hospitalized ones as SARIs) using the clinical features of the patients with different influenza subtypes (Table SIII). A significant difference in age distribution was observed among the influenza subtypes (P<0.05; Fig. 2D). The median age of the patients infected with pandemic AH1N1 and non-subtyped influenza A was 28 and 33 years, respectively. Influenza AH3N2 and the B subtype were detected in the younger age groups (median age, 25 and 17 years, respectively).
No association was found between a specific influenza subtype and comorbidities. It was observed that the proportion of vaccinated patients infected with pandemic AH1N1 and influenza B were 15 and 19%, respectively. In total, 30% of patients infected with AH3N2 and non-subtyped influenza A were vaccinated (Table SIII).
The proportion of symptomatology in patients infected with non-subtyped influenza A differed from patients infected with other influenza subtypes (Table SIII). Patients infected with non-subtyped influenza exhibited a lower proportion of fever, cough, odynophagia, chills, headache, myalgia, and polypnea compared to other influenza subtypes. Patients infected with pandemic AH1N1 exhibited a greater proportion of dyspnea, thoracic pain, arthralgia and malaise. Patients infected with AH3N2 exhibited a greater proportion of rhinorrhea (Table SIII). On the whole, the AH3N2 subtype infected a greater proportion of patients compared with other subtypes over the whole study period (2009-2014), followed by the AH3N2 subtype (Table SIV).
Ambulatory vs. hospitalized patients
In total 75% of the patients (n=2,611) received ambulatory treatment and 25% (n=871) were hospitalized. The number of hospitalized patients varied across the different influenza seasons (Fig. 3A). The 2010-2011, 2011-2012 and 2012-2013 seasons had the lowest proportion of hospitalizations (16-18%). By contrast, the 2013-2014 season had the highest proportion of hospitalizations (41%). The 2009-2010 and 2014-2014 seasons had a proportion of 29 and 22% hospitalizations, respectively. It was observed that the number of hospitalized patients overlapped the number of ambulatory patients in the 2013-2014 season (Fig. 3A).
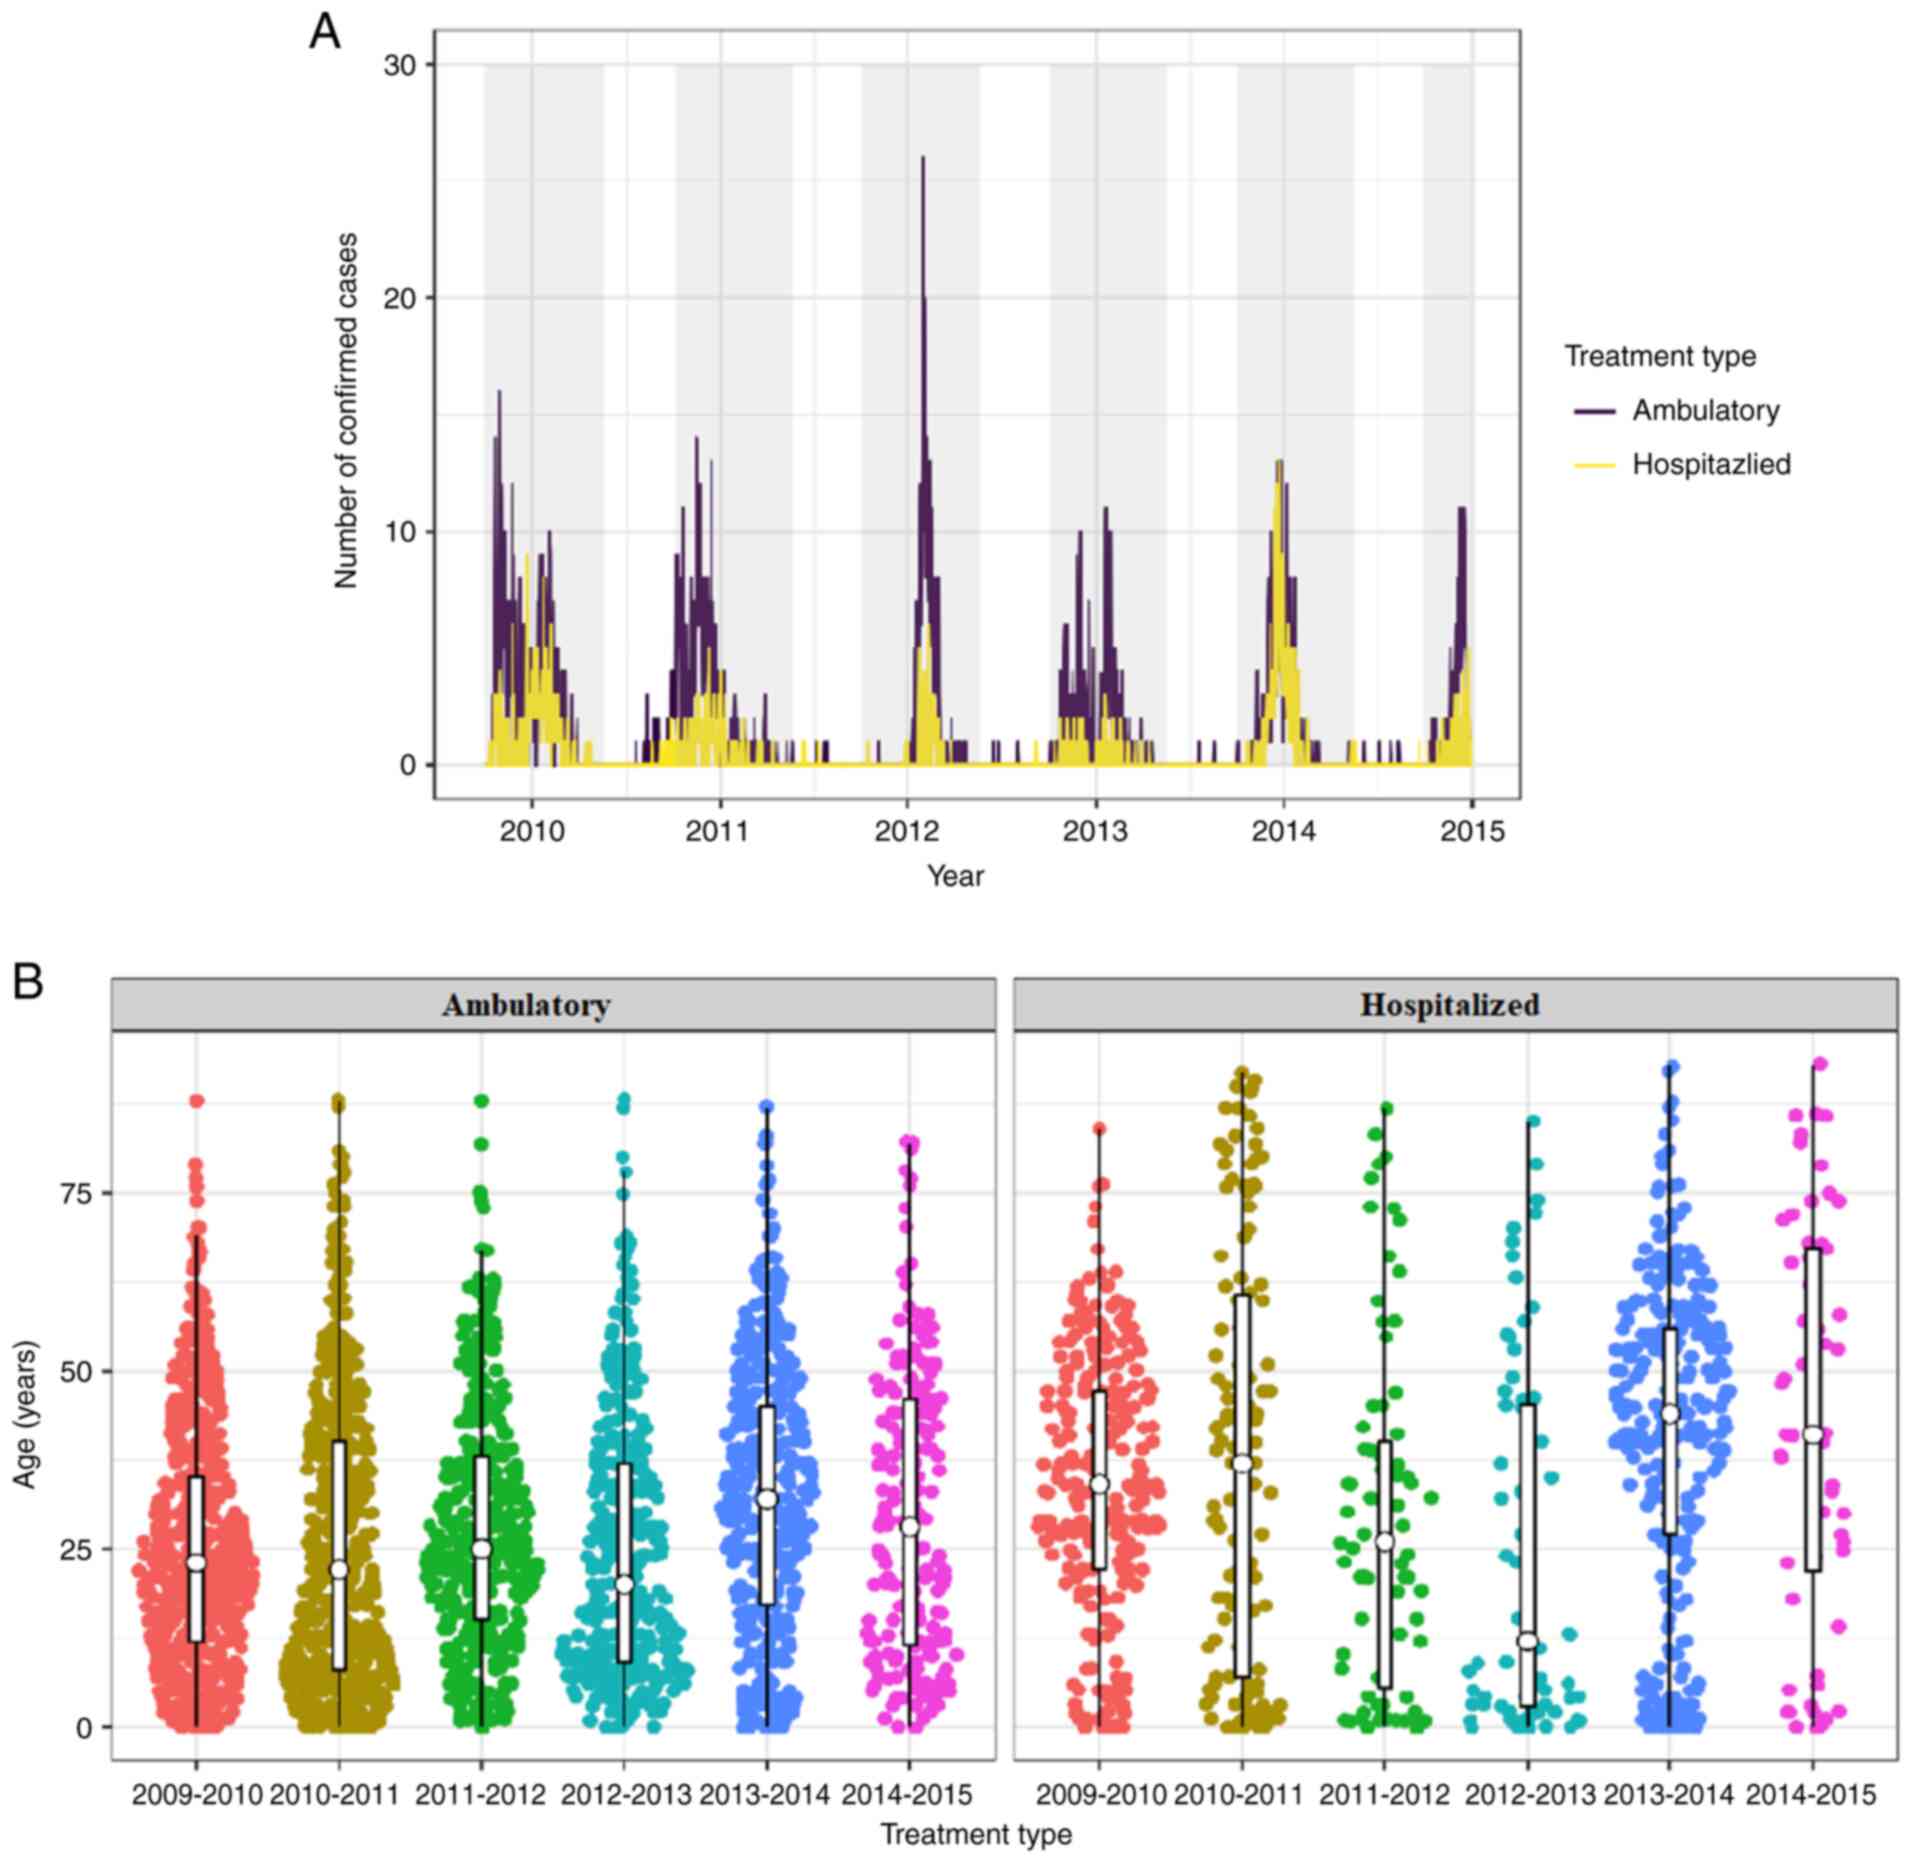 |
Figure 3
Comparison between types of treatment (hospitalized vs. ambulatory). (A) The number of confirmed cases and the treatment type per year; despite a large number of confirmed cases in 2012, the hospitalization rate increased in 2014. (B) Distribution of ambulatory and hospitalized patients by age and season (Table SII); a constant of ambulatory treatment is observed in young patients (median age, 25 years), while hospitalizations exhibited a greater variability by season and age (Kruskall-Wallis test; P<0.05 between all seasons).
|
Females comprised 54% of the patients in both types of treatments (Table SV). The median age of the hospitalized patients was higher than that of the ambulatory patients (median age, 37 and 25 years, respectively, P<0.001). Even though it was observed in Table SII that the 25-44-year age group had a greater proportion of hospitalized patients (31%), 51% of individuals aged ≥65 years were hospitalized (Fig. 3B). The age distribution of the ambulatory and hospitalized patients is illustrated in Fig. 3B. The age of the ambulatory patients was constant over the first four seasons and increased in the 2013-2014 and 2014-2015 seasons (Table SII).
As regards the hospitalized patients, 50% in the 2012-2013 season were ≤13 years of age. Moreover, the age distribution of the patients in the 2013-2014 season differed from that observed in all the seasons, apart from 2014-2015. In total, 50% of the hospitalized patients in the 2013-2014 season were aged 27-56 years (Fig. 3B).
A greater proportion of comorbidities was observed in the hospitalized compared with the ambulatory patients (Table I). In total, 64% of patients with COPD (39/61) were hospitalized. Similarly, 60% of patients with chronic kidney disease (28/47) and 51% of patients with diabetes (140/276) were hospitalized.
Only 18% of the total vaccinated patients were hospitalized. By contrast, 27% of the unvaccinated patients were hospitalized. The difference in proportion was statistically significant (P<0.001). Likewise, the hospitalized patients exhibited a greater proportion of severe symptomatology (malaise, thoracic pain, or polypnea), as presented in Table I. Inversely, milder symptomatology (rhinorrhea, nasal congestion, odynophagia, arthralgia, myalgia, weakness, thoracic pain, abdominal pain, or diarrhea) was observed in the ambulatory patients.
Influenza subtypes were also associated with a greater proportion of hospitalizations. Of all influenza A H1N1-pdm09-infected patients, 30% were hospitalized. By contrast, of all the influenza A H3N2- and influenza B-infected patients, 19 and 18%, respectively, were hospitalized. Of all non-subtyped influenza A-infected patients, 26% were hospitalized. The proportion of influenza subtype by patient type is shown in Table I.
Following multivariate analysis, the hospitalized patients were significantly more likely to be older, have dyspnea, polypnea, cyanosis, COPD, diabetes, unvaccinated and infected with influenza A H1N1-pdm09 (Table III).
|
Table III
Multivariate analysis associated with influenza hospitalization in Northeast Mexico.
|
Table III
Multivariate analysis associated with influenza hospitalization in Northeast Mexico.
| Parameter |
Adjusted odds ratio |
95% Confidence interval |
P-valuea |
| Age, years |
1.015 |
1.009-1.02 |
<0.001 |
| Fever |
|
|
|
| Yes |
1.679 |
1.073-2.625 |
0.023 |
| Dyspnea |
|
|
|
| Yes |
3.637 |
2.931-4.513 |
<0.001 |
| Chills |
|
|
|
| Yes |
0.519 |
0.410-0.658 |
<0.001 |
| Headache |
|
|
|
| Yes |
0.448 |
0.341-0.588 |
<0.001 |
| Myalgia |
|
|
|
| Yes |
0.634 |
0.491-0.819 |
0.001 |
| Malaise |
|
|
|
| Yes |
1.792 |
1.368-2.346 |
<0.001 |
| Rhinorrhea |
|
|
|
| Yes |
0.528 |
0.425-0.657 |
<0.001 |
| Polypnea |
|
|
|
| Yes |
2.369 |
1.855-3.026 |
<0.001 |
| Conjunctivitis |
|
|
|
| Yes |
0.633 |
0.487-0.823 |
0.001 |
| Cyanosis |
|
|
|
| Yes |
3.073 |
1.980-4.770 |
<0.001 |
| Odynophagia |
|
|
|
| Yes |
0.741 |
0.597-0.919 |
0.006 |
| Sudden onset |
|
|
|
| Yes |
0.627 |
0.504-0.780 |
<0.001 |
| Diabetes |
|
|
|
| Yes |
1.741 |
1.252-2.422 |
0.001 |
| COPD |
|
|
|
| Yes |
2.322 |
1.169-4.612 |
0.016 |
| Influenza B |
|
|
|
| Yes |
1.167 |
0.812-1.677 |
0.403 |
| Influenza AH1N1 pdm09 |
|
|
|
| Yes |
1.696 |
1.325-2.172 |
<0.001 |
| Influenza A N/S |
|
|
|
| Yes |
1.167 |
0.795-1.713 |
0.431 |
| Vaccinated |
|
|
|
| No |
1.370 |
1.051-1.785 |
0.02 |
For each increase in 10 years of age, the odds of being hospitalized are estimated to increase 10-fold. The odds of being hospitalized among patients with dyspnea are 3.6-fold higher than patients without dyspnea. The odds of being hospitalized among patients with polypnea are 2.3-fold higher greater than the odds of patients without polypnea. Patients with cyanosis are 3-fold more likely to be hospitalized than patients without cyanosis. The odds of being hospitalized among patients with COPD are 3-fold greater than patients without COPD. Patients with diabetes are 1.7-fold more likely to be hospitalized than patients without diabetes. The odds of hospitalization among patients not vaccinated against influenza may be as little as 1- or much as 1.7-fold higher than those vaccinated against influenza, at the 95% confidence level. Patients infected with influenza A H1N1-pdm09 are ~1.7-fold more likely to be hospitalized than patients not infected with influenza A H1N1-pdm09.
Discussion
The present study characterized the epidemiology of five complete influenza seasons and the first half of influenza season 2014-2015 in Nuevo León, Mexico. When patients were grouped according to the influenza season, the affected female proportion observed in Nuevo León was similar to that reported by Ruiz-Matus et al (4) in the whole country (50-56%). When comparing the median age of the patients by influenza season, it was found that the age of the patients from Nuevo León were similar to that of nationally reported patients (median age, 27-37 years). The 2012-2013 season was the exception. The median age of the patients from Nuevo León in the 2012-2013 season was 19 years compared to 28 years in Mexico (4).
Fernandes-Matano et al (5) previously reported that the greatest proportion of affected individuals was observed in the age group of 25-44 years. This finding may be as this age group consists of the most productive subdivision of the population; thus, it carries a greater contagion risk. For this reason, it seems crucial to continue describing the behavior of this disease due to the economic effects caused by increasing days of work absence.
A lower proportion of patients (6-11% less) with one or more comorbidities was observed in the present study compared to the study by Ruiz-Matus et al (4) when grouped by influenza season. For example, in the 2011-2012 season, it was observed that 22% of the patients had at least one comorbidity (Table I), compared to the 33% previously reported (4). In the 2013-2014 season, the present study only observed 2% of patients with COPD and 12% of patients with diabetes, as shown in Table II. By contrast, Albarrán-Sánchez et al (10) reported 12% of patients with COPD and 14% of patients with diabetes. This difference may be as Albarrán-Sánchez et al (10) only evaluated patients from one hospital in Mexico City. Dominguez-Cherit et al (11) also found that 50% of critically ill Mexican patients with confirmed pandemic influenza A H1N1-pdm in the season were obese.
As previously stated by Ruiz-Matus et al (4), a biannual pattern of viral subtypes affecting Nuevo León was observed. Pandemic AH1N1 in the 2009-2010, 2011-2012 and 2013-2014 seasons, and AH3N2 in the 2010-2011, 2012-2013 and 2014-2015 seasons. It is important to mention that even though influenza A H3N2 was present in the 2012-2013 season, influenza B preceded and was responsible for 53% of infections in the present study (Fig. 2B). Overall, the proportion of influenza virus types observed in Nuevo León during the study period was the same as that reported by Fernandes-Matano et al (5). Pandemic Influenza A H1N1 predominated, followed by AH3N2, type B and non-subtyped influenza. The present study observed the same pattern of pandemic Influenza AH1N1 as that reported by Fernandes-Matano et al (5), demonstrating that the same virus affects the country. In contrast to the findings of Fernandes-Matano et al (5), the present study observed that influenza A H3N2 predominated in the 2010-2011 influenza season.
Cough was one of the most prevalent symptoms in confirmed patients, as also shown by Fernandes-Matano et al (5). Nevertheless, the present study found that fever was the most prevalent symptom, in contrast to that reported by Fernandes-Matano et al (5) (79%). These symptoms are also prevalent in other respiratory diseases, such as COVID-19; therefore, it would be advisable to compare the percentages of appearance of this symptom in the acute stages of both diseases to strengthen the evidence in a differential diagnosis.
The present study observed a greater proportion of vaccinated patients, considering all the evaluated seasons than that reported by Fernandes-Matano et al (5) (21 vs. 17%). The present study observed a pattern in vaccination status when compared to the influenza season. The proportion of vaccinated patients was lower when pandemic influenza AH1N1 was dominated the season. The findings presented herein correspond to the vaccination status reported in the study by Ruiz-Matus et al (4). Albarrán-Sánchez et al (10) reported that 25% of the evaluated patients in the 2013-2014 season were vaccinated. This proportion is greater than that observed herein (14%) (Table II). This suggests different vaccination strategies across the country. This information may influence the importance of promoting vaccination programs in the state.
As observed by Fernandes-Matano et al (5), patients infected with non-subtyped influenza A had fewer clinical manifestations compared to other subtypes. They also reported that rhinorrhea was less commonly associated with pandemic influenza AH1N1(5). Similarly, the present study observed an association between rhinorrhea and influenza A H3N2. Herein, an association was also found between pandemic influenza A H1N1 and severe symptomatology, as found by Fernandes-Matano et al (5). This indicates that pandemic influenza A H1N1 causes severe disease in all Mexican populations.
Compared to the study by Borja-Aburto et al (12), the present study did not find an increase in hospitalized patients >60 years of age in the 2011-2012 season. In fact, the median age of hospitalized patients in the 2011-2012 season was 25.5 years (IQR, 37). This difference may be due to the fact that the majority of the patients in the study by Borja-Aburto et al (12) were from central Mexican states, followed by southeastern states. As reported by Fernandes-Matano et al (5), pandemic influenza AH1N1 caused a greater proportion of hospitalizations. In the present study, 65% of the hospitalized patients were infected with pandemic influenza AH1N1. In the 2013-2014 season, the greatest proportion of hospitalized patients (41%) was observed. This high proportion of hospitalization was also reported by Albarrán-Sánchez et al (10) in Mexico City and by Dávila-Torres et al (13) in the whole country. In total, 50% of the hospitalizations in the 2013-2014 season in the present study occurred in patients aged 27-56 years. Dávila-Torres et al (13) reported a similar age range in hospitalizations in the whole country. The present study also found an increase in the proportion of hospitalized patients aged 25-64 years in the 2013-2014 season compared to the 2009-2010 season.
Following the multivariate analysis, no association was found between obesity and hospitalized patients with confirmed influenza infection. Braun et al (14) reported similar findings. They found no association between obesity and influenza severity outcomes among hospitalized adults in the USA during influenza the 2012-2013 season.
The present study had certain limitations. The samples were obtained from the metropolitan area in already confirmed patients. For this reason, one limitation was that there were no samples of patients with mild symptoms or those who did not follow-up their infection. Patients were recruited from the public health services of the state; that is, patients with social security or those who sought medical attention in private practices were not included. It would thus be desirable to perform further studies in order to update the present study in the current seasons, with the addition of sentinel sampling of patients with suggestive disease in health centers, and perhaps also including patients from various health services.
In conclusion, it can be deduced that influenza cases occurred mainly in the metropolitan area of Monterrey; the median age and clinical characteristics varied according to the season and did not necessarily coincide with the national epidemiology. An older age, having dyspnea, polypnea, cyanosis, malaise, COPD, diabetes or not being vaccinated increased the risk of hospitalization. All this information and the different health promotion strategies within the states in the country appear to influence the behavior of the infection, particularly as regards the number of vaccinated patients.
Supplementary Material
Primer sets used for one-step RT-qPCR for human influenza surveillance (London WHO CC; July 2017)a.
Frequency of influenza-infected patients per age group included in the present study (2009-2014).
Different clinical features exhibited by patients infected with different influenza subtypes in Nuevo León, Mexico.
No. of patients infected with different influenza subtypes in Nuevo León, Mexico (2009-2014).
No. of patients stratified by sex and type of treatment (2009-2014).
Acknowledgements
Not applicable.
Funding
No funding was received.
Availability of data and materials
The datasets used and/or analyzed during the current study are available from the corresponding author on reasonable request.
Authors' contributions
BEAS performed the literature search, collected the data, designed the tables, and wrote, corrected and edited the manuscript. KAGH collected the data, performed the statistical analysis, designed the tables and figures, and wrote the manuscript. GRPR performed the statistical analysis and corrected the manuscript. JRJ defined the study objectives and discussed the revised manuscript. CTG and MEDLOC performed the literature search and collected the data. RMDOL participated in the design of the study, reviewed the references, and drafted and corrected the manuscript. AMRE conceived the main idea behind the study, designed the study, and drafted, directed, corrected and edited the manuscript. BEAS and KAGH confirm the authenticity of all the raw data. All authors have read and approved the final manuscript.
Ethics approval and consent to participate
All subjects gave their informed consent for inclusion prior to participation in the study. The study was performed according to the Declaration of Helsinki. The protocol was approved by the Ethics Committee of the Hospital Metropolitano ‘Dr. Bernardo Sepúlveda’ with the registration code HMBSSSNL-2016/739 and the School of Medicine, Autonomous University of Nuevo León Ethics Committee with the code BI14-002. All patient information was de-identified to conserve anonymity.
Patient consent for publication
Not applicable.
Competing interests
The authors declare that they have no competing interests.
References
|
1
|
Petrova VN and Russell CA: The evolution of seasonal influenza viruses. In: Nature Reviews Microbiology. Vol. 16. Nature Publishing Group, pp47-60, 2018.
|
|
2
|
Krammer F, Smith GJD, Fouchier RAM, Peiris M, Kedzierska K, Doherty PC, Palese P, Shaw ML, Treanor J, Webster RG and García-Sastre A: Influenza. Nat Rev Dis Primers. 4(3)2018.PubMed/NCBI View Article : Google Scholar
|
|
3
|
World Health Organization. Influenza Laboratory Surveillance Information-FluNet. Available from: https://www.who.int/influenza/gisrs_laboratory/flunet/en/. Accessed April, 2021.
|
|
4
|
Ruiz-Matus C, Kuri-Morales P and Narro-Robles J: Behavior of influenza seasons in Mexico from 2010 to 2016: Analysis and prospective. Gac Med Mex. 153:189–196. 2017.PubMed/NCBI
|
|
5
|
Fernandes-Matano L, Monroy-Muñoz IE, Bermúdez de León M, Leal-Herrera YA, Palomec-Nava ID, Ruíz-Pacheco JA, Escobedo-Guajardo BL, Marín-Budip C, Santacruz-Tinoco CE, González-Ibarra J, et al: Analysis of influenza data generated by four epidemiological surveillance laboratories in Mexico, 2010-2016. Epidemiol Infect. 147(e183)2019.PubMed/NCBI View Article : Google Scholar
|
|
6
|
Mata-Marín LA, Mata-Marín JA, Vásquez-Mota VC, Arroyo-Anduiza CI, Gaytán-Martínez JE, Manjarrez-Téllez B, Ochoa-Carrera LA and Sandoval-Ramírez JL: Risk factors associated with mortality in patients infected with influenza A/H1N1 in Mexico. BMC Res Notes. 8(432)2015.PubMed/NCBI View Article : Google Scholar
|
|
7
|
World Health Organization. CDC protocol of real time RT-PCR for swine influenza A(H1N1), 2009. http://www.who.int/csr/resources/publications/swineflu/CDCrealtimeRTPCRprotocol_20090428.pdf. Accessed October 6, 2020.
|
|
8
|
Respiratory Disease Surveillance in the Americas SARInet. https://www.paho.org/hq/dmdocuments/2014/2014-cha-sarinet-inaugural-meeting.pdf. Accessed October, 2021.
|
|
9
|
World Health Organization: WHO information for the molecular detection of influenza viruses (5th revision). November, 2018. https://cdn.who.int/media/docs/default-source/influenza/molecular-detention-of-influenza-viruses/protocols_influenza_virus_detection_feb_2021.pdf. Accessed March, 2021.
|
|
10
|
Albarrán-Sánchez A, Ramírez-Rentería C, Huerta-Montiel F, Martínez-Jerónimo A, Herrera-Landero A, García-Álvarez JL, Ortiz-Rodríguez E and Palmas-Pineda L: Clinical features of patients with influenza-like illness who went to a third level center in the winter of 2013-2014. Rev Med Inst Mex Seguro Soc. 54 (Suppl 2):S162–S167. 2016.PubMed/NCBI(In Spanish).
|
|
11
|
Dominguez-Cherit G, De la Torre A, Rishu A, Pinto R, Ñamendys-Silva SA, Camacho-Ortiz A, Silva-Medina MA, Hernández-Cárdenas C, Martínez-Franco M, Quesada-Sánchez A, et al: Influenza A (H1N1pdm09)-related critical illness and mortality in Mexico and Canada, 2014. Crit Care Med. 44:1861–1870. 2016.PubMed/NCBI View Article : Google Scholar
|
|
12
|
Borja-Aburto VH, Chowell G, Viboud C, Simonsen L, Miller MA, Grajales-Muñiz C, González-Bonilla CR, Diaz-Quiñonez JA and Echevarría-Zuno S: Epidemiological characterization of a fourth wave of pandemic A/H1N1 influenza in Mexico, winter 2011-2012: Age shift and severity. Arch Med Res. 43:563–570. 2012.PubMed/NCBI View Article : Google Scholar
|
|
13
|
Dávila-Torres J, Chowell G, Borja-Aburto VH, Viboud C, Grajalez-Muñiz C and Miller MA: Intense seasonal A/H1N1 influenza in Mexico, winter 2013-2014. Arch Med Res. 46:63–70. 2015.PubMed/NCBI View Article : Google Scholar
|
|
14
|
Braun ES, Crawford FW, Desai MM, Meek J, Kirley PD, Miller L, Anderson EJ, Oni O, Ryan P, Lynfield R, et al: Obesity not associated with severity among hospitalized adults with seasonal influenza virus infection. Infection. 43:569–575. 2015.PubMed/NCBI View Article : Google Scholar
|


