Introduction
The effects of microplastics on human health have become an increasingly relevant research topic (1-4). During the production of plastic, phthalates are often added to enhance the material properties (5). However, the added phthalate compounds are not directly involved in covalent polymerization, but remain weakly attached to the polymer chains (6). This may cause the leaching of phthalates from the plastic (7,8). Microplastic ingestion may lead to the incorporation of phthalates into marine animals, and subsequently into human beings.
Among the phthalates, benzyl butyl phthalate (BBP) is one of to the most widely used and studied compounds (5). BBP is used as plasticizer in polyvinyl chloride (PVC), consumer end products, medical devices and others (9-11). Due to its toxic and endocrine-disrupting properties, the usage of BBP has been restricted, and it is considered a water pollutant (10-12). While BBP has been extensively studied, other phthalate compounds such as butyl cyclohexyl phthalate (BCP) and butyl octyl phthalate (BOP) require further risk assessment. Previous studies have revealed cyto- and genotoxic effects induced by BCP (7,13).
Phthalates exert adverse health effects in animal studies, particularly reproductive and developmental effects (14). It is therefore suspected that the added phthalate compounds should be considered as endocrine-disrupting chemicals (EDCs) (10,15,16). EDCs mimic hormones and induce hormonal effects in cells, mediated by nuclear receptors such as the estrogen receptor (ER) (17,18). ERs exist in 2 isoforms: ERα (ESR1) and ERβ (ESR2), with ERα being the most important for development and reproduction (19). The receptor binds its natural ligand 17-β-estradiol (E2) in the ligand binding domain (LBD) (20). The subsequent 3-dimensional change of the protein induces the dimerization of the receptor and translocation to the nucleus, where ERα binds to the DNA and functions as transcription factor (20). ERα is mainly associated with developmental, reproductive and proliferative effects (21,22).
In the present study, RNA sequencing was used to reveal the effects of phthalate exposure on gene expression in MCF-7 cells. We demonstrated that BCP, BBP and BOP all bound and activated ERα, and that BOP induced the differential expression of 15 genes regulated by ESR1, indicating a possible endocrine-disrupting effect in MCF-7 breast cancer cells in vitro.
Material and methods
Chemicals
BBP (CAS 85-68-7, 98%) was purchased from Oxchem Corporation. BOP (CAS 84-78-6, 99,0%) was purchased from LGC Standards GmbH. BCP (CAS 84-64-0, 98%) and E2 (CAS 50-28-2, 96%) were purchased from Toronto Research Chemicals.
Molecular docking
The present study screened 13 phthalates associated with environmental toxins and/or with plastic production to the whole ERα-LBD using the Virtual Screening Tool PyRx 0.9. The 3-dimensional ligand structures were downloaded from PubChem (NCBI) (23) as standard data files. The crystal structure of ERα-LBD was downloaded from the Protein Data Bank (http://www.rcsb.org/) (24) as a PDB file (PDB code: 5U2D) (25). Based on the screening results, BBP, BCP and BOP were selected for further molecular docking and the in silico binding of both compounds and E2 to the ERα-LBD was analyzed using AutoDock 4.2.6 (The Scripps Research Institute) (26). AutoDockTools 1.5.6 was used to prepare the molecular docking. Ligand and protein files were converted to Protein Data Bank Partial Charge and Atom Type (PDBQT) files. A grid box was set around the E2-binding pocket in the ERα-LBD. The AutoDock build-in Lamarckian Algorithm has been used for the calculation with 250 runs and 25 Mio evaluations each. Results were obtained from the RMSD cluster analysis from AutoDock. Interacting amino acids were identified with AutoDockTools. Visual Molecular Dynamics 1.9.3 (VMD) was used to create the visualizations (http://www.ks.uiuc.edu/Research/vmd/) (27). Parts of the present analyses were conducted using the supercomputer Mogon and advisory services provided by Johannes Gutenberg University Mainz (hpc.uni-mainz.de), which is a member of the AHRP (Alliance for High Performance Computing in Rhineland Palatinate, www.ahrp.info) and the Gauss Alliance e.V.
Microscale thermophoresis (MST)
MST was performed with ERα as fluorescently labeled protein and the phthalate compounds and E2 as ligands as previously reported (28-30). ERα was purchased as recombinant human protein (TP313277) from OriGene Technologies Inc. The concentration of the protein was 0.55 µg/µl (lot: WX1018M11). Staining was performed using the Monolith Protein Labeling kit RED-NHS 2nd Generation (MO-L011) from NanoTemper Technologies GmbH. The concentration of the protein after buffer exchange was 7.55 µM. The protein was stained according to the manufacturer's instruction using the dye with 5-fold the protein concentration. Following staining, the proteins were split into 10-µl aliquots and flash-frozen in liquid nitrogen. The MST experiments were performed using the Monolith NT.115 system with standard treated capillaries (MO-K022) according to the instructions provided by the manufacturer. The results were obtained using an LED power of 95% and an MST power of 20%. NT Analysis Software was used to analyze the results.
Cells and cell culture
The MCF-7 (from the in-house Tumor Bank of the Germany Cancer Research Center, Heidelberg, Germany) and 293-ESR1 cells were grown in phenol red-free, high glucose Dulbecco's modified Eagle's medium (DMEM, 21063029; Gibco; Thermo Fisher Scientific, Inc.) supplemented with 10% fetal bovine serum (10270106; Gibco; Thermo Fisher Scientific, Inc.) and 1% penicillin/streptomycin (15144120; Gibco; Thermo Fisher Scientific, Inc.). The cells were grown at 37˚C, 90% humidity and a 5% CO2 atmosphere. The cells were then detached after washing with Dulbecco's phosphate-buffered saline (DPBS, 14190094; Gibco; Thermo Fisher Scientific, Inc.) and applying phenol red-free Trypsin-EDTA 0.5% (15400054; Gibco; Thermo Fisher Scientific, Inc.).
Generation of ERα-overexpressing 293 cells
293-ESR1 cells were generated by transfection of wild-type 293 cells (obtained from Dr Yoshikazu Sugimoto, Kyoto Pharmaceutical University, Kyoto, Japan) with the Precision LentiORF™ plasmid OHS5898-224630674 (Horizon Discovery Group), containing the information for ERα, green fluorescence protein (GFP) and the antibiotic, blasticidin S HCl. Cell transfection was performed using DharmaFECT kb transfection reagent T-2006-01 (from the Horizon Discovery Group), according to the manufacturer's instructions. For stable transfection, the cells were grown in phenol red-free DMEM medium (21063029; Gibco; Thermo Fisher Scientific, Inc.) with blasticidin S HCl (R21001; Gibco; Thermo Fisher Scientific, Inc.) for 3 weeks. Stably transfected cells expressing GFP were isolated by fluorescence-activated cell sorting (FACS) by the flow cytometry core facility at IMB. In brief, the transfected cells were collected in sorting buffer (1 mM EDTA, 1% FBS, in PBS buffer) and sorted on a BD FACS Aria III cell sorter with a nozzle size of 100 µm and a sheath pressure of 23 psi into 96 well plates using the single cell sort precision. Following cell sorting, the single cells were maintained in conditioned medium, containing 50% sterile filtered cell culture supernatant from the same cell line and 20% FBS. Growing 293-ESR1 cell clones were further cultured in phenol red-free DMEM medium supplemented with 10 µg/ml blasticidin S HCl.
Cytotoxicity assay
The cytotoxicity of the phthalates on 293-ESR1 cells was analyzed with resazurin reduction assay. A total of 104 293-ESR1 cells were seeded per well in a 96-well-plate in 100 µl DMEM. As a control, two columns were filled only with medium. After 24 h, the cells were treated with various concentrations of the compounds diluted in 100 µl DMEM medium, respectively. Each concentration was tested a total of 6 times. Medium containing 100 µl DMSO was added to one row as a control. Following 72 h of incubation at 37˚C, 20 µl of a 0.01% resazurin solution were added to all wells. The fluorescence signal was measured 4 h later using an Infinite M2000 Pro plate reader (Tecan Deutschland GmbH) with an excitation wavelength of 544 nm and an emission wavelength of 590 nm. The survival rate SR was calculated with the mean fluorescence of the respective samples msample, medium mmedium and DMSO mDMSO as a control as follows:
The survival rate was plotted against the concentration of the compounds and thereof the 50% inhibition concentration IC50 calculated as the mean ± standard deviation (SD) based on three independent experiments (biological replicates).
ER transcription factor activation assay
A total of 3x10⁵ 293-ESR1 cells were seeded per well in 2 ml phenol red-free DMEM in 6-well-plates. After 24 h, the compounds were added to a final concentration of 25 µM. The compounds were diluted in DMSO, resulting in a final DMSO concentration of 0.2%. Nuclear extraction was performed 4 and 8 h following treatment, using a cell scraper to detach the cells. The NE-PER™ nuclear and cytoplasmic extraction reagents kit (78833 Thermo Fisher Scientific, Inc.) was used to prepare nuclear extracts mainly according to the instructions provided by the manufacturer. However, instead of vortexing following the addition of the nuclear extraction reagent, the samples were treated four times with 5 sec of sonication with a 10-sec break on ice between each cycle. The protein concentration was measured using a NanoDrop spectrophotometer. The nuclear extracts were used in the ER transcription factor assay kit (ab207203 Abcam) according to the instructions provided by the manufacturer. A total of 10 µg of the prepared nuclear extracts were applied per well. The absorbance was measured with the Infinite M2000 Pro plate reader (Tecan Deutschland GmbH). ER activation was calculated based on the averaged absorbance Ā of the samples (smp) at the measurement wavelength Āms at 450 nm and the reference wavelength Ārf at 655 nm. DMSO-treated cells were used as a control (cnrl) as follows:
Cell cycle analysis
A total of 3x10⁵ 293-ESR1 and 4x10⁵ MCF-7 cells were seeded 24 h prior to treatment in 2 ml phenol red-free medium in 6-well plates. The compounds were added at a final concentration of 25 and 50 µM. The compounds were diluted in DMSO, resulting in a final DMSO concentration of 0.2%. Following treatment for 4 and 8 h, the cells were harvested using trypsin 0.5% and centrifuged at 350 x g for 5 min at 10˚C. The cell pellet was then washed with 900 µl ice cold PBS. Ice-cold 70% ethanol (900 µl) was then added to the cell pellet in a drop-wise manner, while vortexing on the highest setting. The fixed cells were stored at -20˚C. For staining with propidium iodide (PI), the cells were centrifuged at 350 x g for 5 min at 10˚C, and the cell pellet was washed once with 900 µl ice-cold PBS. Subsequently, the cell pellet was dissolved with 5 µg RNAse (Merck KGaA) and 0.05 µg/ml PI (Merck KGaA) diluted in PBS. The cell suspension was passed through cell strainers pluriStrainer® with a 40-µm mesh (pluriSelect Life Science), in order to prevent the clumping of the cells in the flow cytometer. The filtrate was kept in the dark on ice until measurements were taken. Measurements were performed using a BD Accuri™ C6 Flow Cytometer (BD Biosciences). At least 10,000 cells were measured at a flow rate of 14 µl/min and a 10 µm core size. Gating was performed using Kontrast software (Söngen & Blachnik GmbH). The major cell population was gated in a side scatter area (SSC-A) vs. forward scatter area (FSC-A) plot. Aggregates and doublets were removed in an FL2-height (FL2-H) vs. FL2-area (FL2-A) plot. Finally, the selected cells were gated based on their PI content measured by the FL2-A detector into 4 groups as follows: sub G1, G0/G1, S, and G2/M phase of the cell cycle. The number of cells in each cell cycle gate was used for analysis.
RNA extraction
Aliquots of 3.5x10⁵ MCF-7 cells were seeded into 6-well plates 24 h prior to treatment. The cells were treated with the compounds of interest resulting in a final concentration of 25 µM, each. The control cells were treated with 0.2% DMSO. Following 8 h of incubation at 37˚C, the cells were harvested with phenol red-free trypsin 0.5% (Gibco; Thermo Fisher Scientific, Inc.). RNA extraction was performed with the InviTrap® Spin Cell RNA Mini kit (Invitek Molecular GmbH), according to the instructions provided by the manufacturer. Briefly, the cell pellet was lysed with 350 µl Lysis Solution and treated with β-mercaptoethanol. Following the removal of DNA, 350 µl 70% ethanol were added and the sample was applied onto the RNA-RTA Spin Filter. Following several washing steps, RNA was eluted with 60 µl of RNAse-free water (New England Biolabs) and the concentration and purity measured using a NanoDrop spectrophotometer.
RNA sequencing
Next-generation sequencing (NGS) was carried out by StarSEQ GmbH. The quality of the extracted RNA was verified by the company using a 2100 Bioanalyzer system (Agilent Technologies, Inc.). Following the isolation of mRNA and library preparation using the NEBNext© Ultra™ II Directional RNA Library Prep kit (New England Biolabs), RNA sequencing was performed using the Illumina NextSeq 500™ system using 25 Mio paired-end reads (2x150 nt). Fold changes were calculated by StarSEQ GmbH using the STAR Alignment workflow, followed by a pairwise comparison with DESeq2. Thereby, the expression levels of the samples were respectively compared to the DMSO control. Each sample was measured in biological duplicates.
Ingenuity pathway analysis (IPA)
The differentially expressed genes based on NGS were analyzed using IPA software (Qiagen, Inc.). Core analysis was performed for all expressed genes with a P-value <0.05. The analysis settings were adjusted to the following values: Reference set, ingenuity knowledge base (genes only); relationship to include, direct and indirect; include endogenous chemicals, true; filter summary: Species=human, confidence=experimentally observed, cell lines=all, node types=all, mutation=all, data sources=all. Networks were created based on the upstream analysis using ESR1 as an upstream regulator. Networks were displayed with the IPA Path Designer.
Reverse transcription-quantitative polymerase chain reaction (RT-qPCR)
Aliquots of 1 µg of the extracted RNA were converted into cDNA using the Luna Script™ RT SuperMix kit (E3010) from New England Biolabs GmbH, according to the instructions provided by the manufacturer. RT-qPCR was performed using 5X Hot Start Taq EvaGreen® qPCR Mix (No Rox) from Axon-Labortechnik, according to the instructions provided by the manufacturer. PCR primers were ordered from Eurofins Genomics Germany GmbH. The primers used were designed with the Primer-BLAST tool from NCBI and were double-checked for suitability with the Oligo Analyse Tool from Eurofins Genomics. The sequences of the primers used are listed in Table I. GAPDH was selected as a reference gene, as it was not differentially expressed in the NGS data. qPCR was carried out with the CFX384™ Real-Time PCR Detection System (Bio-Rad Laboratories GmbH). Each sample was measured in biological triplicates with technical duplicates. The fold change (FC) was calculated based on the absolute value of the threshold cycles Cq of the gene of interest (gene) and the reference gene (ref) from the sample as well as the control as follows (31):
 |
Table I
Sequences of primers (5'→3') designed for RT-qPCR.
|
Table I
Sequences of primers (5'→3') designed for RT-qPCR.
| Gene |
NCBI RefSeq |
Forward primer |
Reverse primer |
| GAPDH |
NM_002046.7 |
CTGTTCGACAGTCAGCCGCATC |
GCGCCCAATACGACCAAATCCG |
| PGR |
NM_001202474.3 |
AGGCAAAAAGGAGTTGTGTCG |
GAAATTCAACACTCAGTGCCCG |
| SLC7A5 |
NM_003486.7 |
AGTAGATCACCTCCTCGAACC |
TGAGGGATGAGATTCGTACCAG |
| SLC7A11 |
NM_014331.4 |
TGTCGGAGAAAATAACCAGAACA |
TCCCTATTTTGTGTCTCCCCTT |
| STC2 |
NM_003714.2 |
TGTAGTAGTTGAGCGCAGGC |
AAGGAGTCGAGCAGGTGTTG |
| TFAP2C |
NM_003222.4 |
TGGTTGGTTTTTGTGTCCGC |
TGCCTCCTACCAGAGGACTT |
ΔCq = Cq,gene - Cq,ref
ΔΔCq = ΔCq,smp - ΔCq,cntr
FC = log2 (2-ΔΔCq)
The fold change was calculated as log2 fold change and plotted against the log2 fold change of the NGS data. A linear regression was calculated with Origin 7.5 (www.originlab.com). The comparison was performed for both reference genes.
Results
Molecular docking analysis
Molecular docking analysis was performed to investigate the in silico binding of the phthalates to the ERα-LBD (Table II). In silico binding of the phthalate compounds to ERα-LBD indicated higher binding energies to the protein, compared to the natural ligand E2, which was calculated with -9.45 kcal/mol (29). The phthalate compounds shared 9 amino acids of ERα-LBD, to which they all bound: Leu346, Thr347, Ala350, Glu353, Leu387, Leu391, Phe404, Leu525 and Leu540. A total of 4 amino acids were also shared with E2 as ligand: Leu346, Glu353, Phe404 and Leu525(29). The binding position calculated with the lowest energy is visualized in Fig. 1. BBP, BCP and BOP bound to ERα-LBD in silico.
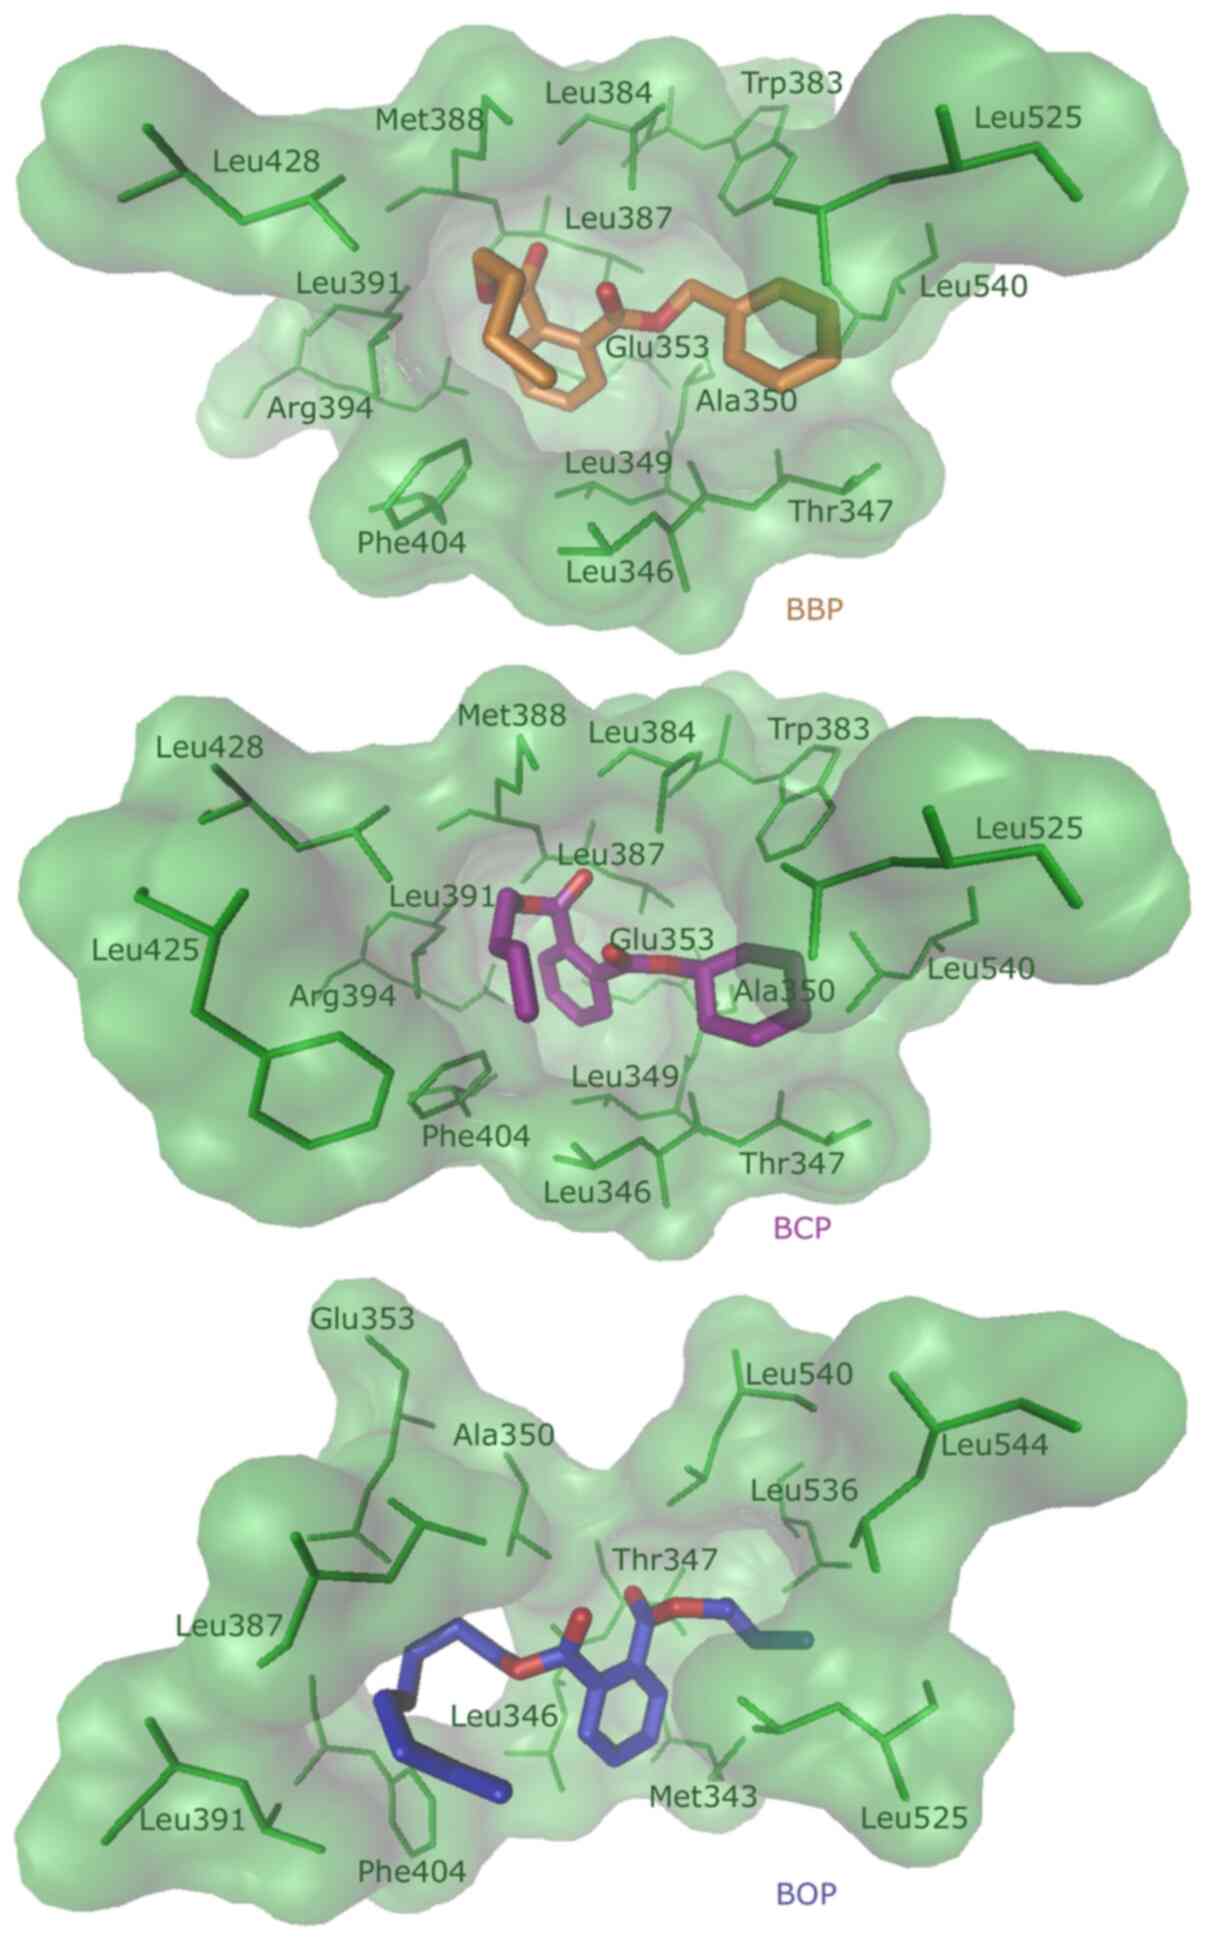 |
Figure 1
Visualization of the molecular docking result. The lowest binding energy position of the ligands BBP (orange), BCP (purple) and BOP (blue) in ERα-LBD are shown. Each ligand is displayed with the interacting amino acids of ERα-LBD. BBP, benzyl butyl phthalate; BCP, benzyl cyclohexyl phthalate; BOP, butyl octyl phthalate; Erα, estrogen receptor α; LBD, ligand binding domain.
|
|
Table II
Results of molecular docking.
|
Table II
Results of molecular docking.
| Ligand/phthalate |
Lowest binding energy/kcal/mol |
Mean binding energy/kcal/mol |
Ki,pred/µM |
Td |
No. of cluster |
Runs in 1st cluster |
Amino acids involved in hydrophobic interactions |
Amino acids involved in H-bonds |
| E2 |
-9.48 |
-9.45 |
0.113 |
2 |
1 |
250/250 |
Leu346 Leu387 Met388 Leu391 Phe404 Met421 Ile424 Leu428 Leu525 |
Glu353 Arg394 |
| BBP |
-7.80 |
-7.60 |
1.930 |
9 |
12 |
29/250 |
Leu346 Thr347 Leu349 Ala350 Glu353 Trp383 Leu384 Leu387 Met388 Leu391 Arg394 Phe404 Leu428 Leu525 Leu540 |
x |
| BCP |
-8.09 |
-7.63 |
1.170 |
8 |
10 |
121/250 |
Leu346 Thr347 Leu349 Ala350 Glu353 Trp383 Leu384 Leu387 Met388 Leu391 Arg394 Phe404 Phe425 Leu428 Leu525 Leu540 |
x |
| BOP |
-7.43 |
-6.80 |
3.590 |
14 |
13 |
7/250 |
Met343 Leu346 Thr347 Ala350 Glu353 Leu387 Leu391 Phe404 Leu525 Leu536 Leu540 Leu544 |
x |
MST
MST was used to investigate the binding capability of the phthalate ligands to ERα in vitro. For all ligands, the detected fluorescent signal decreased with the increasing concentration, indicating binding of all ligands to ERα (Fig. 2). The calculated dissociation constant of BCP was clearly higher than of the other ligands (Table III), indicating a lower binding capability to the protein. The in vitro binding to ERα was confirmed for all ligands.
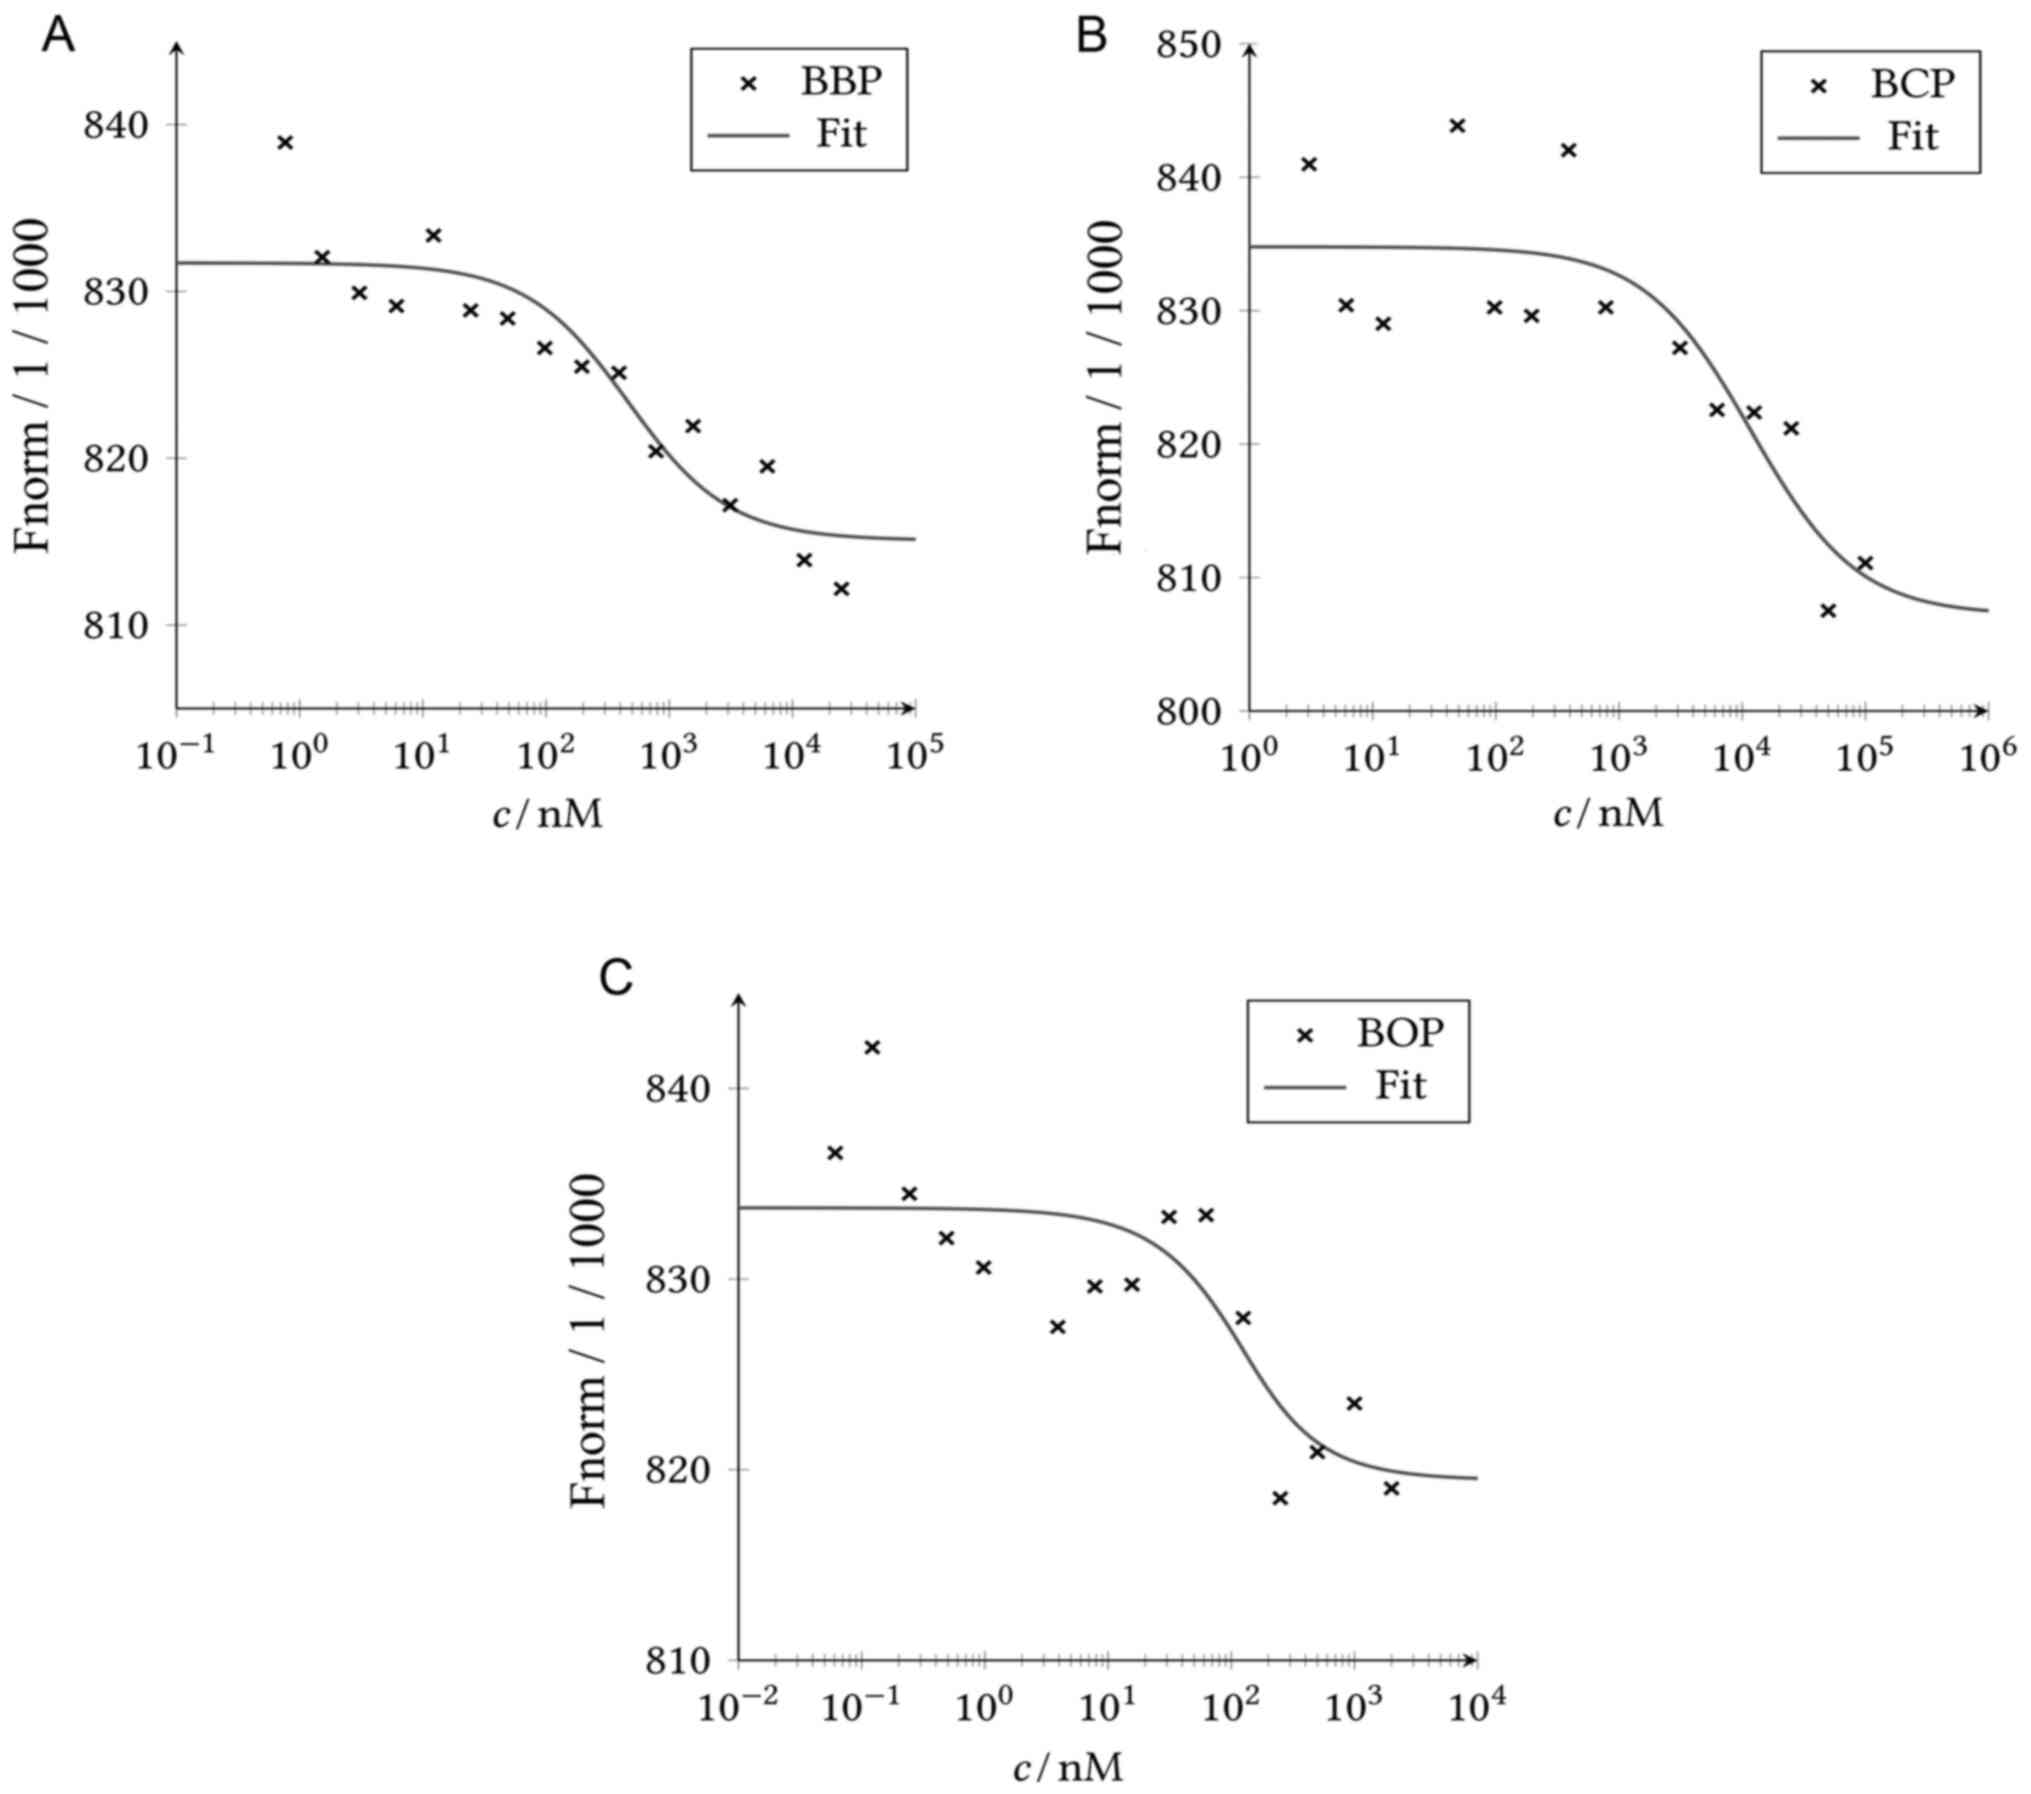 |
Figure 2
Analysis of the MST experiments. MST was performed with 95% LED and 20% MST power. Fluorescently-labeled ERα was used as target with (A) BBP, (B) BCP, and (C) BOP as a ligand, respectively. A fit was performed according to the law of mass action. MST, microscale thermophoresis; BBP, benzyl butyl phthalate; BCP, benzyl cyclohexyl phthalate; BOP, butyl octyl phthalate.
|
|
Table III
Molecular structure of the analyzed ligands and comparison of the inhibitory constant predicted in silico Ki,pred with the dissociation constant Kd calculated by MST in vitro.
|
Cytotoxicity
The cytotoxic effects of the phthalates were analyzed with the resazurin reduction assay. All 3 phthalate compounds did not reduce the survival rate of the cells in the measured concentration range <60% (data not shown). The IC50 of E2 on 293-ESR1 cells was measured as 68±11 µM (29). For the following experiments, concentrations were chosen below the IC50 of E2 to avoid any cytotoxic effects in the cells.
ER activation
As the binding of BBP, BCP and BOP to ERα was verified in silico and in vitro, the activation of the receptor was measured with the ER transcription factor activation assay in ERα-overexpressing 293-ESR1 cells. A time-dependent activation of ERα was observed for all ligands (Fig. 3). While BBP induced the strongest activation after 4 h, the activation following treatment with BOP was strongest after 8 h. However, the natural ligand E2 was the most active compound at both time points. All phthalates activated the estrogen receptor in vitro.
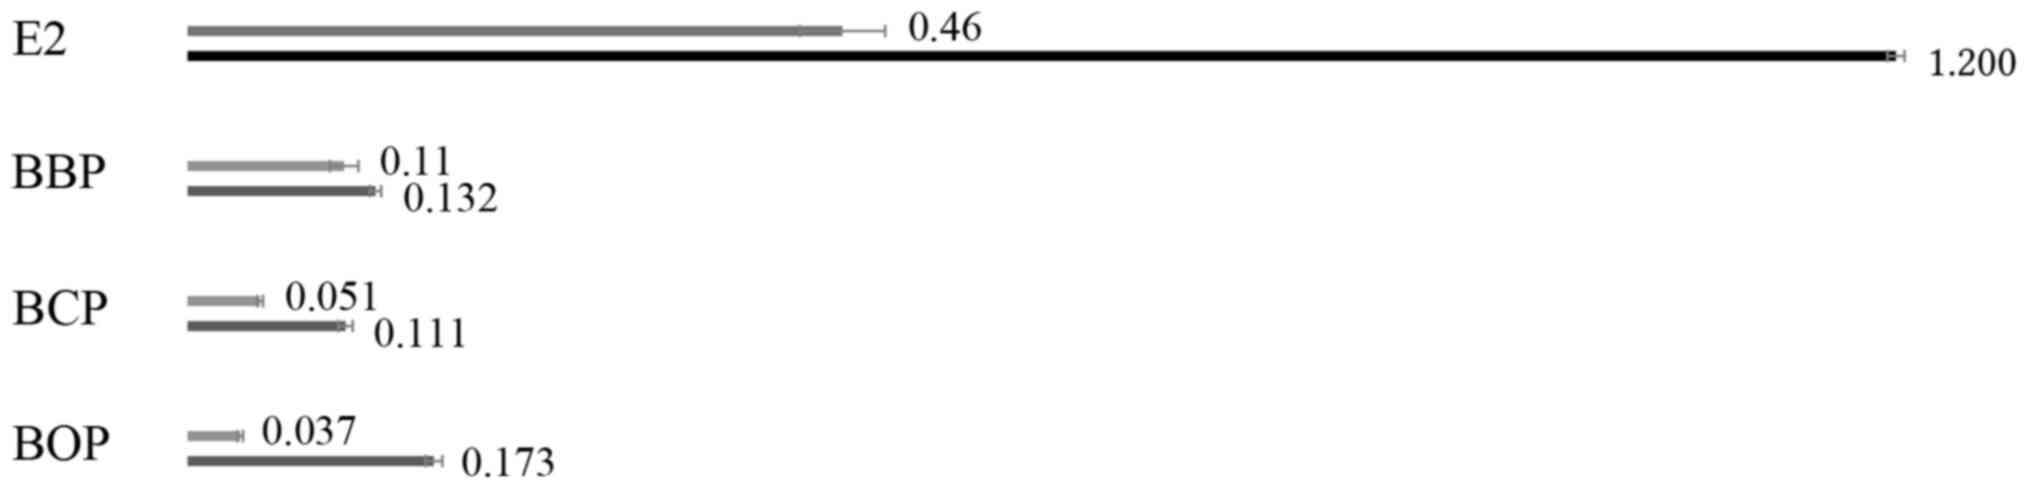 |
Figure 3
ER transcription factor assay. Activation of estrogen receptor was measured after 4 and 8 h of incubation of the 293-ESR1 cells with 25 µM of the respective ligand. The difference optical density measured after 4 h is shown in the upper line and after 8 h in the lower line. ER, estrogen receptor; ESR1, estrogen receptor 1.
|
Cell cycle
Cell cycle analysis was performed to search for possible proliferative effects of the phthalate compounds in the MCF-7 and HEK-ESR1 cells. The cells were treated with the compounds at two different concentrations and time points. The results indicated an increased G2/M population following treatment of the HEK-ESR1 cells with BBP and of the MCF-7 cells treated with BOP (Table IV). However, no effect of the phthalate compounds on the cell cycle was observed.
|
Table IV
Cell cycle analysis performed with the 293-ESR1 and MCF-7 cells.
|
Table IV
Cell cycle analysis performed with the 293-ESR1 and MCF-7 cells.
| |
293-ESR1 cells |
MCF-7 cells |
| Treatment duration and concentration |
Gate |
DMSO |
BBP |
BCP |
BOP |
DMSO |
BBP |
BCP |
BOP |
| 4 h |
Sub G1/% |
0.4 |
0.2 |
0.6 |
0.5 |
0.2 |
0.2 |
0.2 |
0.3 |
| 25 µM |
G1/G0/% |
54.3 |
50.5 |
54.3 |
52.2 |
46.7 |
45.8 |
43.2 |
43.2 |
| |
S/% |
23.4 |
24.4 |
22.5 |
22.1 |
24.4 |
25.6 |
25.9 |
25.6 |
| |
G2/M/% |
21.9 |
24.4 |
22.5 |
25.1 |
28.4 |
28.2 |
30.6 |
30.7 |
| 4 h |
Sub G1/% |
0.2 |
0.7 |
0.6 |
0.4 |
0.0 |
0.2 |
0.2 |
0.0 |
| 50 µM |
G1/G0/% |
56.1 |
51.0 |
54.5 |
52.4 |
47.2 |
42.9 |
42.9 |
42.0 |
| |
S/% |
23.7 |
23.2 |
26.7 |
26.2 |
24.0 |
27.1 |
26.2 |
25.7 |
| |
G2/M/% |
20.0 |
24.8 |
18.2 |
20.8 |
28.8 |
29.9 |
30.6 |
32.2 |
| 8 h |
Sub G1/% |
0.1 |
0.2 |
0.3 |
0.1 |
0.1 |
0.1 |
0.5 |
0.2 |
| 25 µM |
G1/G0/% |
54.3 |
54.3 |
51.8 |
51.1 |
48.6 |
50.5 |
48.8 |
47.1 |
| |
S/% |
23.6 |
21.3 |
26.2 |
26.8 |
26.3 |
25.2 |
24.4 |
25.1 |
| |
G2/M/% |
21.5 |
24.0 |
21.6 |
22.0 |
25.0 |
24.2 |
26.3 |
27.5 |
| 8 h |
Sub G1/% |
0.1 |
0.6 |
0.3 |
0.7 |
0.1 |
0.1 |
0.1 |
1.0 |
| 50 µM |
G1/G0/% |
55.3 |
52.8 |
54.0 |
53.1 |
45.9 |
51.6 |
48.7 |
40.4 |
| |
S/% |
23.2 |
21.9 |
25.2 |
27.2 |
24.7 |
22.5 |
22.6 |
26.3 |
| |
G2/M/% |
20.9 |
24.6 |
20.4 |
18.9 |
29.3 |
25.8 |
28.5 |
31.9 |
RNA sequencing
In order to analyze the molecular effects induced by the phthalates, RNA sequencing was performed. As BOP was measured with the lowest Kd, the highest ER activation after 8 h, and a proliferative effect in MCF-7 cells, gene expression following BOP treatment was analyzed by NGS. Upstream target analysis by IPA identified ESR1 as the top-most likely upstream regulator of the gene expression pattern. A total of 15 differentially expressed genes regulated by ERα were found (Fig. 4). Cytochrome P450 family 1 subfamily A member 1 (CYP1A1), DNA damage inducible transcript 4 (DDIT4), Kelch-like family member 24 (KLHL24), solute carrier family 7 member 11 (SLC7A11), CEA cell adhesion molecule 5 (CEACAM5), stanniocalcin 2 (STC2), solute carrier family 7 member 5 (SLC7A5) and immediate early response 3 (IER3) were upregulated, while KBP prolyl isomerase 4 (FKBP4), transcription factor AP-2 γ (TFAP2C), cyclin-dependent kinase (CDK1), cyclin A2 (CCNA2), progesterone receptor (PGR), splicing factor, proline- and glutamine-rich (SFPQ) and adenosine A1 receptor (ADORA1) were downregulated following treatment of the MCF-7 cells with BOP. Apart from the genes regulated by ESR1, several other genes were differentially expressed following treatment with BOP. Genes expressed with a fold change of at least (-)1 and unrelated to ESR1 regulation are listed in Table V. RNA-sequencing identified several differentially expressed genes induced by BOP in MCF-7 cells.
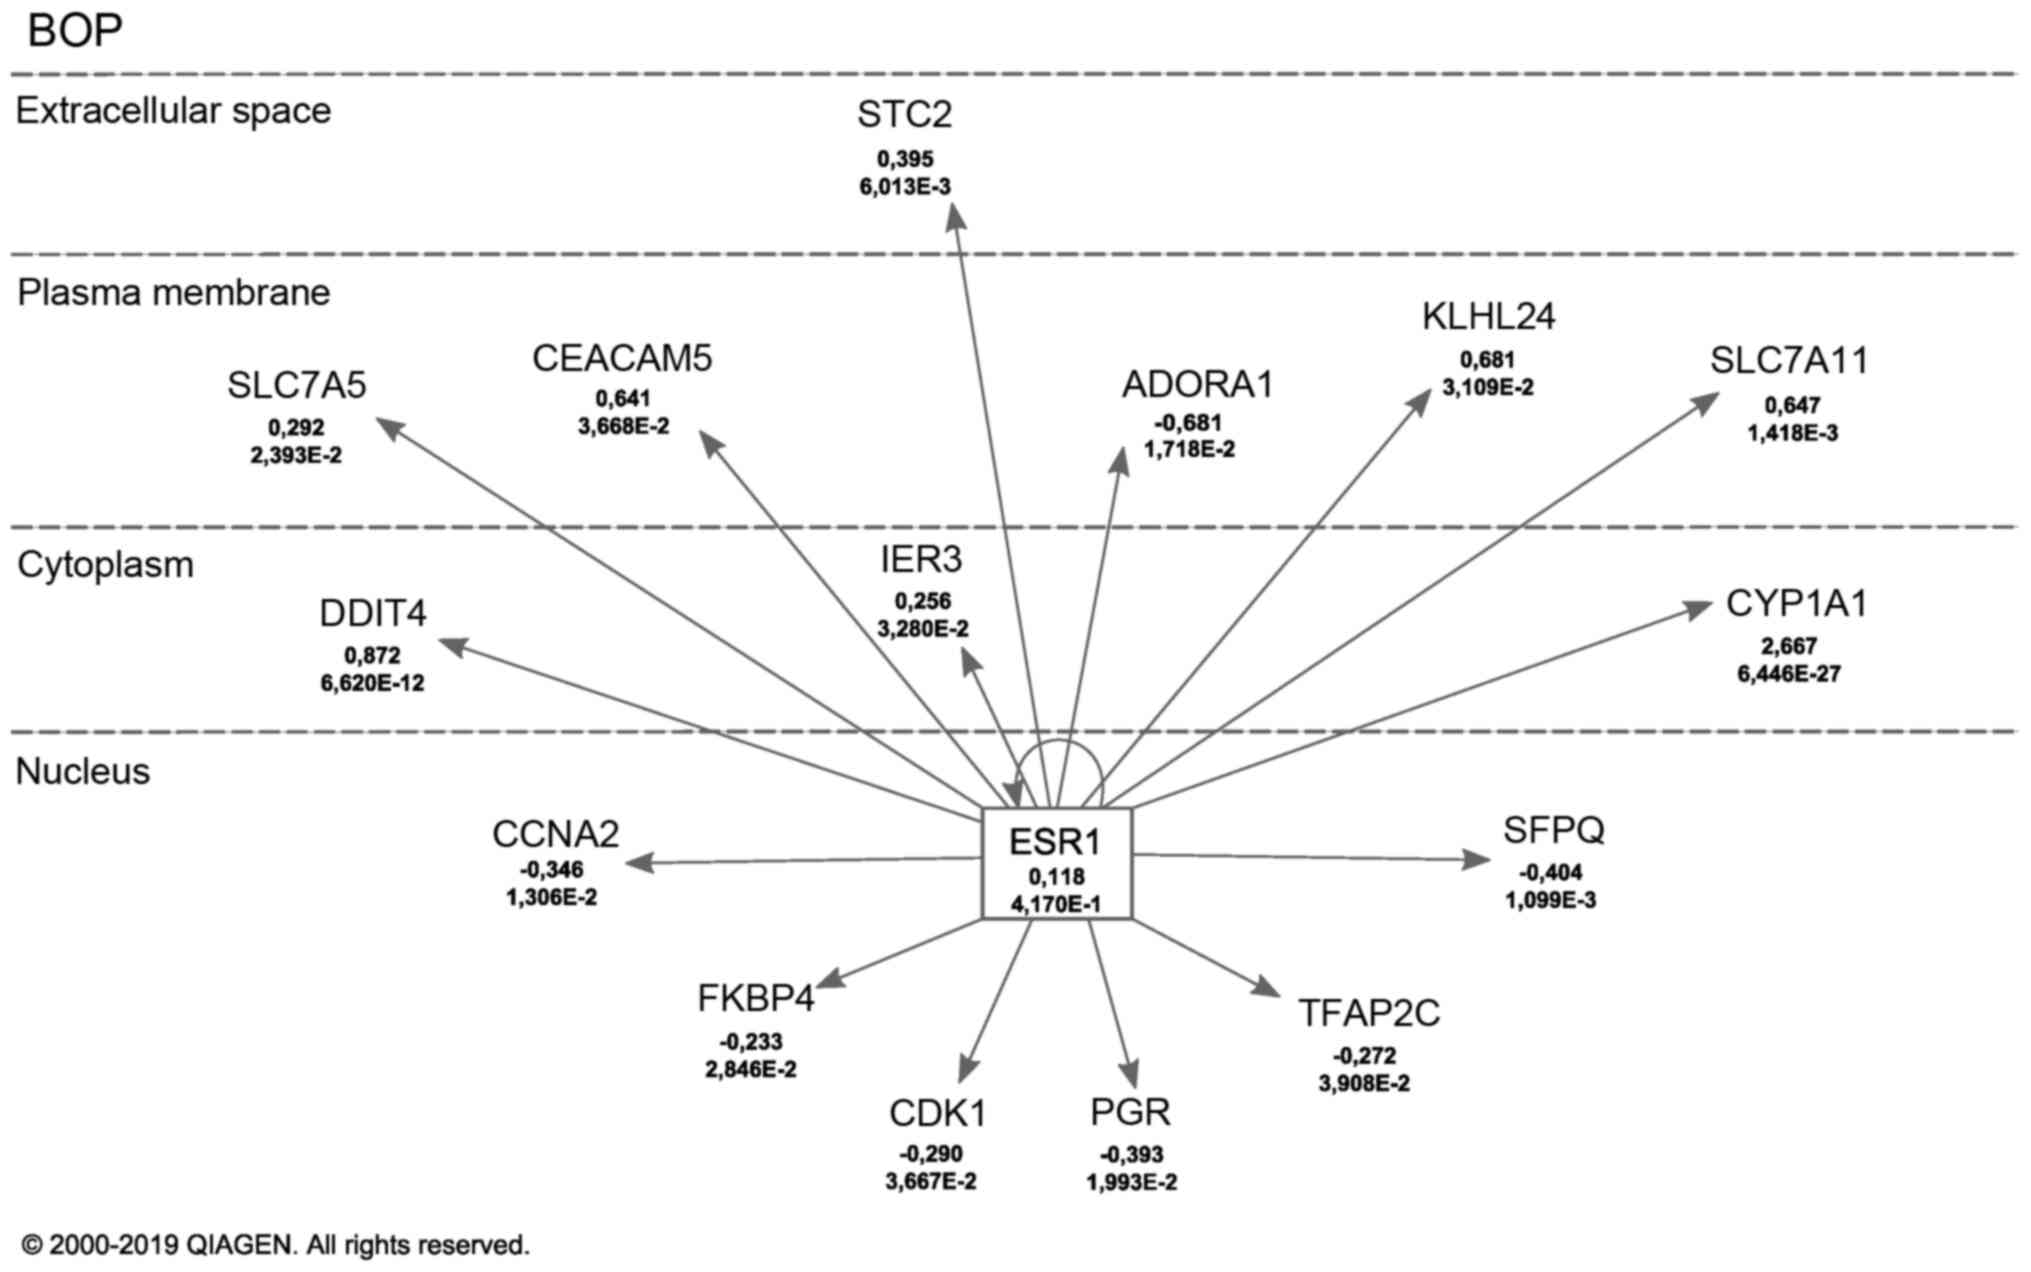 |
Figure 4
Upstream analysis with ingenuity pathway analysis software. Differentially expressed genes induced by BOP and in connection with ESR1 regulation are shown. For each gene the fold change and the P-value are given. Figure was modified based on the IPA Path Designer. BOP, butyl octyl phthalate; ESR1, estrogen receptor 1.
|
|
Table V
Specific gene expression by BOP.
|
Table V
Specific gene expression by BOP.
| ID |
 |
 |
P-value |
Entrez gene name |
| MAGED4 |
8.439 |
±1.547 |
4.93x10⁻⁸ |
MAGE family member D4B |
| FSBP |
5.990 |
±1.917 |
1.78x10⁻³ |
fibrinogen silencer binding protein |
| TRIM39-RPP21 |
5.782 |
±1.989 |
3.65x10⁻³ |
TRIM39-RPP21 readthrough |
| U2AF1L5 |
5.597 |
±1.693 |
9.45x10⁻⁴ |
U2 small nuclear RNA auxiliary factor 1 |
| JMJD7-PLA2G4B |
5.105 |
±2.533 |
4.38x10⁻² |
JMJD7-PLA2G4B readthrough |
| TIAF1 |
2.947 |
±1.485 |
4.72x10⁻² |
TGFB1-induced anti-apoptotic factor 1 |
| MMP19 |
2.310 |
±0.905 |
1.07x10⁻² |
Matrix metallopeptidase 19 |
| LOC102724093 |
1.909 |
±0.879 |
2.98x10⁻² |
Golgin subfamily A member 6-like protein 4 |
| IRAK1BP1 |
1.623 |
±0.813 |
4.59x10⁻² |
Interleukin 1 receptor associated kinase 1 binding protein 1 |
| FAHD2CP |
1.400 |
±0.711 |
4.90x10⁻² |
Fumarylacetoacetate hydrolase domain containing 2C, pseudogene |
| WDR97 |
1.253 |
±0.631 |
4.70x10⁻² |
WD repeat domain 97 |
| ZNF460 |
1.252 |
±0.600 |
3.68x10⁻² |
Zinc finger protein 460 |
| GPRASP2 |
1.169 |
±0.391 |
2.81x10⁻³ |
G protein-coupled receptor associated sorting protein 2 |
| GUCA1B |
1.112 |
±0.562 |
4.80x10⁻² |
Guanylate cyclase activator 1B |
| LACE1 |
-1.032 |
±0.481 |
3.20x10⁻² |
AFG1 like ATPase |
| TEX14 |
-1.245 |
±0.472 |
8.26x10⁻³ |
Testis expressed 14, intercellular bridge forming factor |
| KCNQ2 |
-1.542 |
±0.768 |
4.48x10⁻² |
Potassium voltage-gated channel subfamily Q member 2 |
| SENP3-EIF4A1 |
-2.148 |
±1.081 |
4.69x10⁻² |
SENP3-EIF4A1 readthrough (NMD candidate) |
| FAM72C |
-3.872 |
±1.286 |
2.61x10⁻³ |
Family with sequence similarity 72, member D |
| CD36 |
-4.538 |
±2.049 |
2.68x10⁻² |
CD36 molecule |
Gene expression confirmation by RT-qPCR
RT-qPCR was used to confirm the gene expression of selected genes measured by NGS. GAPDH was used as reference gene. The log2 fold change expression of the RT-qPCR experiment was plotted against the log2 fold change expression of the NGS experiment (Fig. 5). A linear fit was performed with a calculated R value of 0.90. The induced gene expression was confirmed.
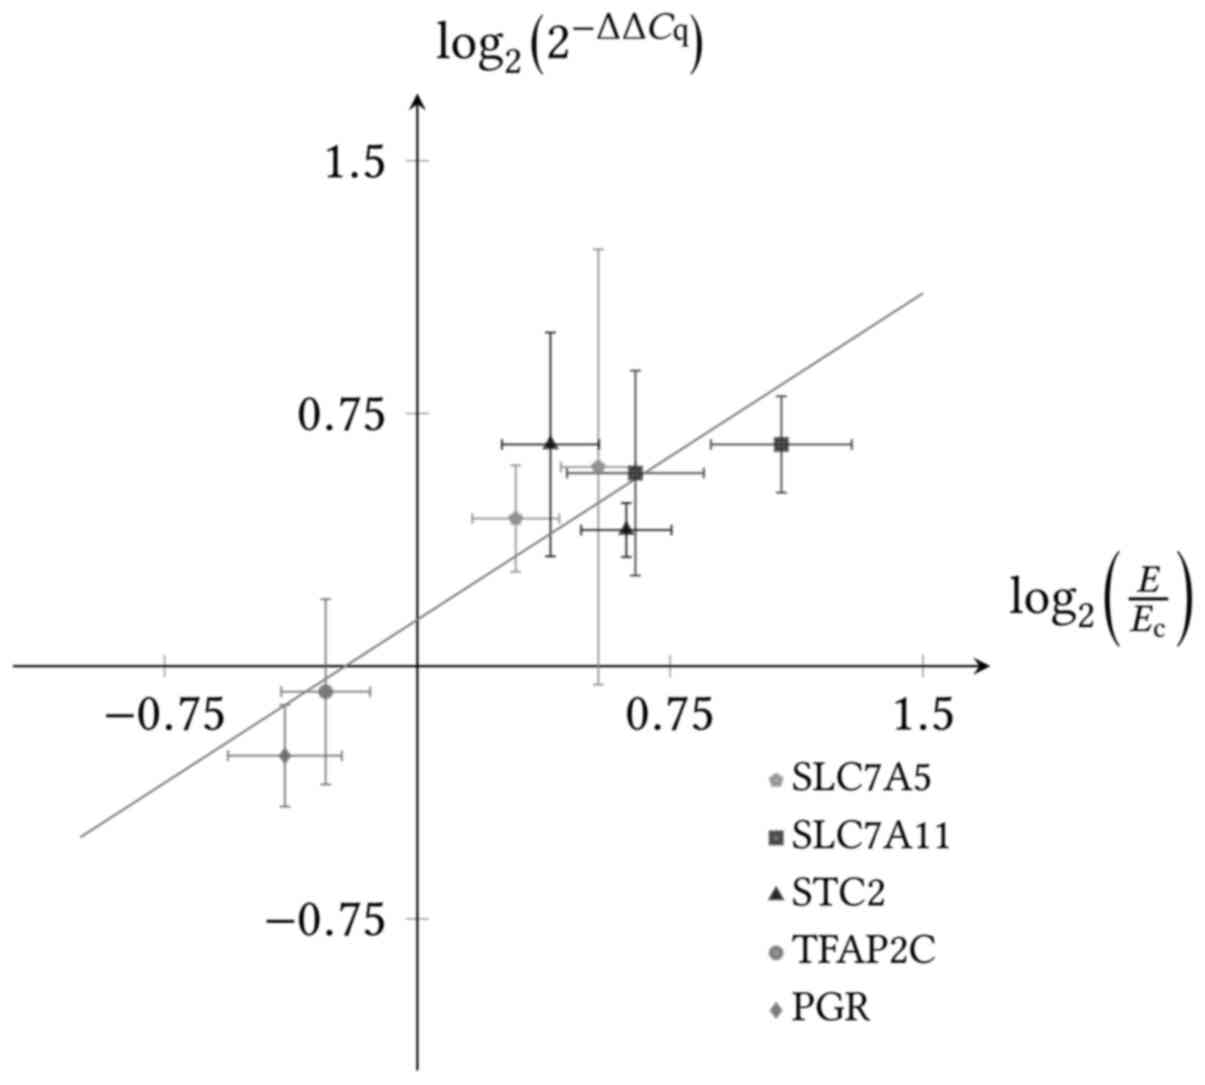 |
Figure 5
Association of gene expression levels obtained by NGS and RT-qPCR. The log2 (2-ΔΔCq) fold change based on the RT-qPCR results was plotted against the fold change based on the NGS results for the ligands E2 and BOP (dots). The log2 (2-ΔΔCq) was calculated with GAPDH as reference gene. A linear regression was calculated with Origin 7.5. The fit is shown in grey with a slope of 0.65 and an intercept of 0.14 and an R value of 0.90.
|
Discussion
In the present study, the effects of the three phthalate compounds, BBP, BCP and BOP, on ERα and the molecular effects of BOP on gene expression in MCF-7 cells were analyzed.
Verification of ERα binding, activation, and proliferative effects
The molecular docking results indicated the binding of BBP, BCP and BOP to ERα-LBD in silico. The calculated binding energy was higher compared to E2, indicating weaker binding (29). Whereas E2 is a rather rigid ligand, the phthalate compounds have far more freely rotatable bonds, resulting in more possibilities of the ligands to be placed in the binding pocket, which may not all be covered during the molecular docking process. The torsional degree of freedom was represented by the TORSDOF parameter, which further correlated with the amount of identified ligand cluster. Whereas all docking runs of E2 resulted in one cluster with a maximum difference between the single runs of 2.0 Å, the dockings with the phthalate ligands resulted in several clusters. Due to their higher flexibility, the molecular docking simulations of the phthalate compounds need to be considered more carefully. Nevertheless, binding to the protein in silico has been confirmed. The in vitro binding of all ligands to ERα was confirmed by MST. The dissociation constant indicated that BOP bound most stably to ERα, followed by BBP. BCP bound less stably to the receptor. The activation of the receptor was measured for all ligands. Treatment with BOP for 8 h resulted in the strongest activation, apart from E2. E2 is known to induce proliferative effects in cells (32). The proliferative effect of the three phthalate compounds on MCF-7 and HEK-ESR1 cells was measured by analyzing the cell cycle distribution. Although the results point to a proliferative effect, further research is required to understand the effect of the phthalates on the cell cycle progression. In summary, BBP, BCP, and BOP bound in silico and in vitro to ERα and were able to activate the receptor.
Gene expression by BOP
BOP induced the differential expression of 15 genes in the MCF-7 cells. The transcription factor, AP-2γ (TFAP2C), was negatively affected by BOP treatment. TFAP2C is expressed in breast cancer cells and plays a role in tumor progression (33,34). This transcription factor further downregulates the expression of p21, a cell cycle inhibitor (35). Other cell cycle-associated genes were downregulated as well, such as CDK1 and CCNA2. The gene expression pattern indicated BOP-mediated cell cycle disturbances in breast cancer cells. SFPQ is involved in transcription and pre-mRNA splicing (36) and was downregulated following BOP treatment. The downregulation of SFPQ was associated with a shorter overall survival of patients with colorectal cancer (37). In mice, SFPQ functions as a tumor suppressor by regulating cell proliferation and tumorigenesis (38). The immunophilin FK506-binding protein (FKBP4) is usually highly expressed in ERα-positive breast cancers (39,40). However, it was downregulated in the present study. In general, FKBP4 is associated with steroid receptors, altering receptor activity (39). One steroid receptor was downregulated as well, the progesterone receptor (PGR). PGR is associated with breast cancer progression and used, besides ERα and HER2, as prognostic marker (41). A negative PGR status is associated with a poorer survival (42).
Some genes coding for cytoplasmic proteins were upregulated following treatment with BOP. DDIT4 is activated by cellular stress and a known inhibitor of the mammalian target of rapamycin (mTOR). An elevated DDIT4 expression promotes tumorigenesis and is associated with a poorer survival in several cancer types (43-45). The IER3 gene is activated upon cellular stress (46) and was upregulated following BOP treatment. IER3 is involved in apoptosis and cell cycle arrest and has been identified as potential tumor suppressor in cervical carcinoma (47). Furthermore, the CYP1A1 gene was upregulated, coding for the cytochrome P450 family 1A1 enzyme. CYP1A1 metabolizes xenobiotics, such as polycyclic aromatic hydrocarbons, to epoxides and thereby contributing to the toxicity and carcinogenicity of these xenobiotics (48,49).
Two members of the solute carrier family 7, SLC7A5 and SLC7A11, were both upregulated upon BOP treatment. SLC7 are important membrane transporters for amino acid supply and are particularly required for rapidly growing tumor cells, ensuring a steady supply of nutrients (50). In particular, SLC7A5 and SLC7A11 are overexpressed in breast cancer and are associated with a worse therapeutic progress (51). ADORA1 is a target of E2-activated ERα and regulates the transcription of ERα, favoring proliferation (52). By contrast, treatment with BOP reduced the mRNA expression level of ADORA1, indicating an altered gene transcription. CEACAM5 is a cell adhesive protein and expressed in several cancer, such as gastrointestinal and breast cancer (53). CEACAM5 is used as a biomarker for prognosis in colorectal cancer (53,54). Its overexpression following treatment with the phthalate compound may result in an increased metastatic potential. The KLHL24 gene encodes the substrate receptor for a ubiquitin ligase (55). Mutations in the KLHL24 gene are discussed in the context of skin diseases (56). KLHL24 was overexpressed in MCF-7 cells following treatment with BOP. Finally, the glycoprotein STC2 was overexpressed as well. The glycoprotein is involved in the homeostasis of calcium and phosphate (57). STC2 has been reported to be upregulated in E2-treated MCF-7 cells (58), breast cancer (59) and is associated with proliferation in cancer (60,61). Apart from genes regulated by ESR1, treatment with BOP also induced the differential expression of ESR1-independent genes, indicating further side-effects in the cells.
In summary, treatment with BOP induced the differential expression of several ESR1-regulated genes. The gene expression pattern was associated with interference in the cell cycle, the increased tumorigenesis, proliferation, metastasis and poorer survival of cancer cells.
In conclusion, the present study demonstrated that all tested phthalate compounds bound to ERα in silico and in vitro. BBP, BCP and BOP all activated the receptor although less potently compared to the natural ligand E2. RNA sequencing revealed differentially expression of 15 genes in relation to ESR1-regulation: CYP1A1, DDIT4, KLHL24, SLC7A11, CEACAM5, STC2, SLC7A5, IER3, FKBP4, TFAP2C, CDK1, CCNA2, PGR, SFPQ and ADORA1 in MCF-7 cells. The identified gene expression pattern indicated an influence of BOP on the cell cycle, tumorigenesis, proliferation, metastasis and poorer survival in cancer. The results indicated an endocrine effect of BOP on MCF-7 cells mediated by ERα.
Acknowledgements
The authors gratefully acknowledge the computing time granted on the supercomputer Mogon at Johannes Gutenberg University Mainz (hpc.uni-mainz.de). The authors would like to thank Dr Christian Meesters (Data Processing Center, Johannes Gutenberg University Mainz) for his support in creating protocols to speed up the AutoDock and Vina program analyses. Cell sorting support by the IMB Flow Cytometry Core Facility is also gratefully acknowledged.
Funding
The present study was supported by the Deutsche Forschungsgemeinschaft (GRK 2015/2).
Availability of data and materials
All data generated or analyzed during this study are included in this published article or are available from the corresponding author on reasonable request.
Authors' contributions
MB performed the experiments and wrote the original draft. NWP and TE provided resources, were part of the funding acquisition, corrected and edited the original draft and designed the overall concept of the project. TE supervised the project and provided the laboratory facilities to MB to perform the experiments.
Ethics approval and consent to participate
Not applicable.
Patient consent for publication
Not applicable.
Competing interests
MB (Madeleine Söngen; nee Böckers) used the Kontrast software of Söngen & Blachnik GmbH, Ingelheim Germany. At the time point of the performance of the experiments, MB (Madeleine Söngen; nee Böckers) was not yet married. The other authors declare that they have no actual or potential competing interests.
References
|
1
|
Sharma S and Chatterjee S: Microplastic pollution, a threat to marine ecosystem and human health: A short review. Environ Sci Pollut Res Int. 24:21530–21547. 2017.PubMed/NCBI View Article : Google Scholar
|
|
2
|
Barboza LG, Dick Vethaak A, Lavorante B, Lundebye AK and Guilhermino L: Marine microplastic debris: An emerging issue for food security, food safety and human health. Mar Pollut Bull. 133:336–348. 2018.PubMed/NCBI View Article : Google Scholar
|
|
3
|
Rist S, Carney Almroth B, Hartmann NB and Karlsson TM: A critical perspective on early communications concerning human health aspects of microplastics. Sci Total Environ. 626:720–726. 2018.PubMed/NCBI View Article : Google Scholar
|
|
4
|
Smith M, Love DC, Rochman CM and Neff RA: Microplastics in seafood and the implications for human health. Curr Environ Health Rep. 5:375–386. 2018.PubMed/NCBI View Article : Google Scholar
|
|
5
|
Bocqué M, Voirin C, Lapinte V, Caillol S and Robin JJ: Petro-based and bio-based plasticizers: Chemical structures to plasticizing properties. J Polymer Sci Part A: Polymer Chem. 54:11–33. 2016.
|
|
6
|
Heudorf U, Mersch-Sundermann V and Angerer J: Phthalates: Toxicology and exposure. Int J Hyg Environ Health. 210:623–634. 2007.PubMed/NCBI View Article : Google Scholar
|
|
7
|
Köksal C, Nalbantsoy A and Karabay Yavasoglu NÜ: Cytotoxicity and genotoxicity of butyl cyclohexyl phthalate. Cytotechnology. 68:213–222. 2016.PubMed/NCBI View Article : Google Scholar
|
|
8
|
Paluselli A, Fauvelle V, Galgani F and Sempere R: Phthalate release from plastic fragments and degradation in seawater. Environ Sci Technol. 53:166–175. 2019.PubMed/NCBI View Article : Google Scholar
|
|
9
|
Schettler T: Human exposure to phthalates via consumer products. Int J Androl. 29:134–139. 2006.PubMed/NCBI View Article : Google Scholar : discussion 181-135.
|
|
10
|
Mankidy R, Wiseman S, Ma H and Giesy JP: Biological impact of phthalates. Toxicol Lett. 217:50–58. 2013.PubMed/NCBI View Article : Google Scholar
|
|
11
|
Herrero O, Planello R and Morcillo G: The plasticizer benzyl butyl phthalate (BBP) alters the ecdysone hormone pathway, the cellular response to stress, the energy metabolism, and several detoxication mechanisms in Chironomus riparius larvae. Chemosphere. 128:266–277. 2015.PubMed/NCBI View Article : Google Scholar
|
|
12
|
Cui S, Wang L, Zhao H, Lu F, Wang W and Yuan Z: Benzyl butyl phthalate (BBP) triggers the migration and invasion of hemangioma cells via upregulation of Zeb1. Toxicol In Vitro. 60:323–329. 2019.PubMed/NCBI View Article : Google Scholar
|
|
13
|
Yavasoglu NÜ, Köksal C, Dagdeviren M, Aktug H and Yavasoglu A: Induction of oxidative stress and histological changes in liver by subacute doses of butyl cyclohexyl phthalate. Environ Toxicol. 29:345–353. 2014.PubMed/NCBI View Article : Google Scholar
|
|
14
|
Lyche JL, Gutleb AC, Bergman A, Eriksen GS, Murk AT, Ropstad E, Saunders M and Skaare JU: Reproductive and developmental toxicity of phthalates. J Toxicol Environ Health B Crit Rev. 12:225–249. 2009.PubMed/NCBI View Article : Google Scholar
|
|
15
|
Moore NP: The oestrogenic potential of the phthalate esters. Reprod Toxicol. 14:183–192. 2000.PubMed/NCBI View Article : Google Scholar
|
|
16
|
Matsumoto M, Hirata-Koizumi M and Ema M: Potential adverse effects of phthalic acid esters on human health: A review of recent studies on reproduction. Regul Toxicol Pharmacol. 50:37–49. 2008.PubMed/NCBI View Article : Google Scholar
|
|
17
|
Shanle EK and Xu W: Endocrine disrupting chemicals targeting estrogen receptor signaling: Identification and mechanisms of action. Chem Res Toxicol. 24:6–19. 2011.PubMed/NCBI View Article : Google Scholar
|
|
18
|
Yang O, Kim HL, Weon JI and Seo YR: Endocrine-disrupting chemicals: Review of toxicological mechanisms using molecular pathway analysis. J Cancer Prev. 20:12–24. 2015.PubMed/NCBI View Article : Google Scholar
|
|
19
|
Paterni I, Granchi C, Katzenellenbogen JA and Minutolo F: Estrogen receptors alpha (ERα) and beta (ERβ): Subtype-selective ligands and clinical potential. Steroids. 90:13–29. 2014.PubMed/NCBI View Article : Google Scholar
|
|
20
|
Arnal JF, Lenfant F, Metivier R, Flouriot G, Henrion D, Adlanmerini M, Fontaine C, Gourdy P, Chambon P, Katzenellenbogen B and Katzenellenbogen J: Membrane and nuclear estrogen receptor alpha actions: From tissue specificity to medical implications. Physiol Rev. 97:1045–1087. 2017.PubMed/NCBI View Article : Google Scholar
|
|
21
|
Marino M, Galluzzo P and Ascenzi P: Estrogen signaling multiple pathways to impact gene transcription. Curr Genomics. 7:497–508. 2006.PubMed/NCBI View Article : Google Scholar
|
|
22
|
Jia M, Dahlman-Wright K and Gustafsson JA: Estrogen receptor alpha and beta in health and disease. Best Pract Res Clin Endocrinol Metab. 29:557–568. 2015.PubMed/NCBI View Article : Google Scholar
|
|
23
|
Kim S, Chen J, Cheng T, Gindulyte A, He J, He S, Li Q, Shoemaker BA, Thiessen PA, Yu B, et al: PubChem 2019 update: Improved access to chemical data. Nucleic Acids Res. 47:D1102–D1109. 2019.PubMed/NCBI View Article : Google Scholar
|
|
24
|
Berman HM, Westbrook J, Feng Z, Gilliland G, Bhat TN, Weissig H, Shindyalov IN and Bourne PE: The protein data bank. Nucleic Acids Res. 28:235–242. 2000.PubMed/NCBI View Article : Google Scholar
|
|
25
|
Stender JD, Nwachukwu JC, Kastrati I, Kim Y, Strid T, Yakir M, Srinivasan S, Nowak J, Izard T, Rangarajan ES, et al: Structural and molecular mechanisms of cytokine-mediated endocrine resistance in human breast cancer cells. Mol Cell. 65:1122–1135 e5. 2017.PubMed/NCBI View Article : Google Scholar
|
|
26
|
Morris GM, Huey R, Lindstrom W, Sanner MF, Belew RK, Goodsell DS and Olson AJ: AutoDock4 and autodocktools4: Automated docking with selective receptor flexibility. J Comput Chem. 30:2785–2791. 2009.PubMed/NCBI View Article : Google Scholar
|
|
27
|
Humphrey W, Dalke A and Schulten K: VMD: Visual molecular dynamics. J Mol Graph. 14:33–38, 27-28. 1996.PubMed/NCBI View Article : Google Scholar
|
|
28
|
Böckers M, Paul NW and Efferth T: Bisphenolic compounds alter gene expression in MCF-7 cells through interaction with estrogen receptor α. Toxicol Appl Pharmacol. 399(115030)2020.PubMed/NCBI View Article : Google Scholar
|
|
29
|
Böckers M, Paul NW and Efferth T: Organophosphate ester tri-o-cresyl phosphate interacts with estrogen receptor α in MCF-7 breast cancer cells promoting cancer growth. Toxicol Appl Pharmacol. 395(114977)2020.PubMed/NCBI View Article : Google Scholar
|
|
30
|
Böckers M, Paul NW and Efferth T: Indeno[1,2,3-cd]pyrene and picene mediate actions via estrogen receptor α signaling pathway in in vitro cell systems, altering gene expression. Toxicol Appl Pharmacol. 396(114995)2020.PubMed/NCBI View Article : Google Scholar
|
|
31
|
Livak KJ and Schmittgen TD: Analysis of relative gene expression data using real-time quantitiative PCR and the 2(-Delta Delta C(T)) method. Methods. 25:402–408. 2001.PubMed/NCBI View Article : Google Scholar
|
|
32
|
Castoria G, Migliaccio A, Giovannelli P and Auricchio F: Cell proliferation regulated by estradiol receptor: Therapeutic implications. Steroids. 75:524–527. 2010.PubMed/NCBI View Article : Google Scholar
|
|
33
|
Jäger R, Friedrichs N, Heim I, Büttner R and Schorle H: Dual role of AP-2γ in ErbB-2-induced mammary tumorigenesis. Breast Cancer Res Treat. 90:273–280. 2005.PubMed/NCBI View Article : Google Scholar
|
|
34
|
Pellikainen JM and Kosma VM: Activator protein-2 in carcinogenesis with a special reference to breast cancer-A mini review. Int J Cancer. 120:2061–2067. 2007.PubMed/NCBI View Article : Google Scholar
|
|
35
|
Wong PP, Miranda F, Chan KV, Berlato C, Hurst HC and Scibetta AG: Histone demethylase KDM5B collaborates with TFAP2C and Myc to repress the cell cycle inhibitor p21(cip) (CDKN1A). Mol Cell Biol. 32:1633–1644. 2012.PubMed/NCBI View Article : Google Scholar
|
|
36
|
Rosonina E, Ip JY, Calarco JA, Bakowski MA, Emili A, McCracken S, Tucker P, Ingles CJ and Blencowe BJ: Role for PSF in mediating transcriptional activator-dependent stimulation of pre-mRNA processing in vivo. Mol Cell Biol. 25:6734–6746. 2005.PubMed/NCBI View Article : Google Scholar
|
|
37
|
Tao Y, Ma C, Fan Q, Wang Y, Han T and Sun C: MicroRNA-1296 facilitates proliferation, migration and invasion of colorectal cancer cells by targeting SFPQ. J Cancer. 9:2317–2326. 2018.PubMed/NCBI View Article : Google Scholar
|
|
38
|
Wang G, Cui Y, Zhang G, Garen A and Song X: Regulation of proto-oncogene transcription, cell proliferation, and tumorigenesis in mice by PSF protein and a VL30 noncoding RNA. Proc Natl Acad Sci USA. 106:16794–16798. 2009.PubMed/NCBI View Article : Google Scholar
|
|
39
|
Ward BK, Mark PJ, Ingram DM, Minchin RF and Ratajczak T: Expression of the estrogen receptor-associated immunophilins, cyclophilin 40 and FKBP52, in breast cancer. Breast Cancer Res Treat. 58:267–280. 1999.PubMed/NCBI View Article : Google Scholar
|
|
40
|
Yang WS, Moon HG, Kim HS, Choi EJ, Yu MH, Noh DY and Lee C: Proteomic approach reveals FKBP4 and S100A9 as potential prediction markers of therapeutic response to neoadjuvant chemotherapy in patients with breast cancer. J Proteome Res. 11:1078–1088. 2012.PubMed/NCBI View Article : Google Scholar
|
|
41
|
Daniel AR, Hagan CR and Lange CA: Progesterone receptor action: Defining a role in breast cancer. Expert Rev Endocrinol Metab. 6:359–369. 2011.PubMed/NCBI View Article : Google Scholar
|
|
42
|
Boland MR, Ryan EJ, Dunne E, Aherne TM, Bhatt NR and Lowery AJ: Meta-analysis of the impact of progesterone receptor status on oncological outcomes in oestrogen receptor-positive breast cancer. Br J Surg. 107:33–43. 2020.PubMed/NCBI View Article : Google Scholar
|
|
43
|
Du F, Sun L, Chu Y, Li T, Lei C, Wang X, Jiang M, Min Y, Lu Y, Zhao X, et al: DDIT4 promotes gastric cancer proliferation and tumorigenesis through the p53 and MAPK pathways. Cancer Commun (Lond). 38(45)2018.PubMed/NCBI View Article : Google Scholar
|
|
44
|
Tirado-Hurtado I, Fajardo W and Pinto JA: DNA damage inducible transcript 4 gene: The switch of the metabolism as potential target in cancer. Front Oncol. 8(106)2018.PubMed/NCBI View Article : Google Scholar
|
|
45
|
Cheng Z, Dai Y, Pang Y, Jiao Y, Liu Y, Cui L, Quan L, Qian T, Zeng T, Si C, et al: Up-regulation of DDIT4 predicts poor prognosis in acute myeloid leukaemia. J Cell Mol Med. 24:1067–1075. 2020.PubMed/NCBI View Article : Google Scholar
|
|
46
|
Arlt A and Schäfer H: Role of the immediate early response 3 (IER3) gene in cellular stress response, inflammation and tumorigenesis. Eur J Cell Biol. 90:545–552. 2011.PubMed/NCBI View Article : Google Scholar
|
|
47
|
Jin H, Suh DS, Kim TH, Yeom JH, Lee K and Bae J: IER3 is a crucial mediator of TAp73β-induced apoptosis in cervical cancer and confers etoposide sensitivity. Sci Rep. 5(8367)2015.PubMed/NCBI View Article : Google Scholar
|
|
48
|
Nebert DW, Dalton TP, Okey AB and Gonzalez FJ: Role of aryl hydrocarbon receptor-mediated induction of the CYP1 enzymes in environmental toxicity and cancer. J Biol Chem. 279:23847–23850. 2004.PubMed/NCBI View Article : Google Scholar
|
|
49
|
Shimada T and Fujii-Kuriyama Y: Metabolic activation of polycyclic aromatic hydrocarbons to carcinogens by cytochromes P450 1A1 and 1B1. Cancer Sci. 95:1–6. 2004.PubMed/NCBI View Article : Google Scholar
|
|
50
|
Bhutia YD, Babu E, Ramachandran S and Ganapathy V: Amino acid transporters in cancer and their relevance to ‘glutamine addiction’: Novel targets for the design of a new class of anticancer drugs. Cancer Res. 75:1782–1788. 2015.PubMed/NCBI View Article : Google Scholar
|
|
51
|
Cha YJ, Kim ES and Koo JS: Amino acid transporters and glutamine metabolism in breast cancer. Int J Mol Sci. 19(907)2018.PubMed/NCBI View Article : Google Scholar
|
|
52
|
Lin Z, Yin P, Reierstad S, O'Halloran M, Coon VJS, Pearson EK, Mutlu GM and Bulun SE: Adenosine A1 receptor, a target and regulator of estrogen receptoralpha action, mediates the proliferative effects of estradiol in breast cancer. Oncogene. 29:1114–1122. 2010.PubMed/NCBI View Article : Google Scholar
|
|
53
|
Zhou J, Fan X, Chen N, Zhou F, Dong J, Nie Y and Fan D: Identification of CEACAM5 as a biomarker for prewarning and prognosis in gastric cancer. J Histochem Cytochem. 63:922–930. 2015.PubMed/NCBI View Article : Google Scholar
|
|
54
|
Duffy MJ: Carcinoembryonic antigen as a marker for colorectal cancer: Is it clinically useful? Clin Chem. 47:624–630. 2001.PubMed/NCBI
|
|
55
|
Lin Z, Li S, Feng C, Yang S, Wang H, Ma D, Zhang J, Gou M, Bu D, Zhang T, et al: Stabilizing mutations of KLHL24 ubiquitin ligase cause loss of keratin 14 and human skin fragility. Nat Genet. 48:1508–1516. 2016.PubMed/NCBI View Article : Google Scholar
|
|
56
|
Bolling MC and Jonkman MF: KLHL24: Beyond skin fragility. J Invest Dermatol. 139:22–24. 2019.PubMed/NCBI View Article : Google Scholar
|
|
57
|
Chu SJ, Zhang J, Zhang R, Lu WW and Zhu JS: Evolution and functions of stanniocalcins in cancer. Int J Immunopathol Pharmacol. 28:14–20. 2015.PubMed/NCBI View Article : Google Scholar
|
|
58
|
Bouras T, Southey MC, Chang AC, Reddel RR, Willhite D, Glynne R, Henderson MA, Armes JE and Venter DJ: Stanniocalcin 2 is an estrogen-responsive gene coexpressed with the estrogen receptor in human breast cancer. Cancer Res. 62:1289–1295. 2002.PubMed/NCBI
|
|
59
|
Esseghir S, Kennedy A, Seedhar P, Nerurkar A, Poulsom R, Reis-Filho JS and Isacke CM: Identification of NTN4, TRA1, and STC2 as prognostic markers in breast cancer in a screen for signal sequence encoding proteins. Clin Cancer Res. 13:3164–3173. 2007.PubMed/NCBI View Article : Google Scholar
|
|
60
|
Wang H, Wu K, Sun Y, Li Y, Wu M, Qiao Q, Wei Y, Han ZG and Cai B: STC2 is upregulated in hepatocellular carcinoma and promotes cell proliferation and migration in vitro. BMB Rep. 45:629–634. 2012.PubMed/NCBI View Article : Google Scholar
|
|
61
|
Wang Y, Gao Y, Cheng H, Yang G and Tan W: Stanniocalcin 2 promotes cell proliferation and cisplatin resistance in cervical cancer. Biochem Biophys Res Commun. 466:362–368. 2015.PubMed/NCBI View Article : Google Scholar
|