Introduction
DNA topoisomerases play crucial roles in cellular
processes by regulating the topological state of DNA (1). The inhibition of DNA topoisomerase
activities is an approach used for screening anticancer agents.
Agents that react to enzymes are predicted to inhibit the growth of
cancer cells. Therefore, the enzymes can be exploited as scientific
tools to rapidly screen novel inhibitors in vitro as
anticancer agents (2). The use of
multi-copy number gene strategies to express a large yield of
specific enzymes, e.g., human DNA topoisomerase I (hTopI),
increases the sensitivity of the host towards growth inhibitors. In
a number of cases, the expression found using single-copy gene
transformants has been disappointingly low. A strategy for
constructing multi-copy numbers of genes that produces tandem
inserts of a gene by ligation (in vitro strategy) has been
utilized, and this was found to be one of the most effective
strategies to increase gene expression (3). By contrast, a more popular in
vivo strategy, which utilizes hyper-resistance to an antibiotic
that allows users to screen the multi-copy inserts, conferring
resistance to the antibiotic, has not yet been used to express
hTopI. It is hypothesized that the transformation of Pichia
with multi-copy number genes may increase cell density, total
protein expression and enzyme activity in the host to increase the
sensitivity of the host to growth inhibitor screening.
Pichia pastoris is a methylotrophic yeast and
can be used as a more rapid and cost-effective eukaryotic protein
expression system than baculovirus or mammalian tissue culture
(3). The increasing popularity of
the Pichia expression system is due to the availability of
different strains commercially available as expression systems, the
simplicity of the techniques needed for molecular genetic
manipulation and the similarity to those of Saccharomyces
cerevisiae (S. cerevisiae). Pichia produces
intracellular and extracellular foreign proteins at high levels and
undergoes a number of eukaryotic post-translational modifications,
while being as easy to manipulate as Escherichia coli and
S. cerevisiae. The tightly regulated alcohol oxidase I
promoter and the robust respiratory growth of this system that
facilitates high cell densities (4) contributes to the rapid acceptance of
this system over other expression systems. Research using this
system may facilitate the discovery of more viable therapeutic
agents for cancer treatment from natural products with
bioavailable, safe, cost-effective and minimal side-effect
properties in the future. Thus, the present study aimed to employ
this system for the establishment of multi-copy gene constructs of
hTopI using the pPIC3.5K vector in Pichia.
Materials and methods
Production of a multi-copy number
insert in Pichia by an in vivo strategy
Pichia, which had a multi-copy number of
hTopI (target gene; insert), was first produced via an in
vivo strategy. Each copy of hTopI was carried by the pPIC3.5K
plasmid (9.0 kb; Invitrogen; Thermo Fisher Scientific, Inc.). In
the process, the complete nucleotide sequence encoded hTopI that
had been generated in a previous study (5) was excised from a pPICZα-A-hTopI
plasmid (Invitrogen; Thermo Fisher Scientific, Inc.) with the
restriction endonucleases EcoRI (Thermo Fisher Scientific,
Inc.) and NotI (Thermo Fisher Scientific, Inc.) in two
separate enzymatic reactions. The sequence was then inserted into
the pPIC3.5K plasmid at the EcoRI and NotI sites. The
construction of the recombinant plasmid was then viewed by agarose
gel electrophoresis and confirmed by sequencing (First BASE
Laboratories Sdn. Bhd.). The extracted recombinant pPIC3.5K-hTopI
plasmid was then linearized by digestion with restriction
endonuclease SalI (Thermo Fisher Scientific, Inc.) prior to
transformation into Pichia strain GS115 supplied by the
Multi-Copy Pichia Expression kit (cat. no. K1750-01;
Invitrogen; Thermo Fisher Scientific, Inc.). The yeast
transformants were then screened on agar plates containing various
concentrations of Geneticin® (Invitrogen; Thermo Fisher
Scientific, Inc.). The transformants that survive at a higher
concentration of Geneticin® are said to have more copies
of recombinant plasmids transferred into yeast cells. The yeast
colonies were subjected to copy number insert screening as
described below.
Screening the multi-copy number insert
Pichia transformants
The copies of recombinant plasmid in the yeast
transformants can be quantified using quantitative PCR (qPCR)
(3) or based on the ability of the
clone to survive on agar plates containing various
Geneticin® concentrations. As the yeast transformants
were first screened on agar plates containing various
concentrations of Geneticin®, agar plates containing
various concentrations of Geneticin® were used to avoid
any mismatch to screen the copy number insert of the transformants.
A 200 µl aliquot of sterile yeast extract peptone dextrose (YPD;
Merck KGaA) broth was added to each microtiter plate well using the
aseptic technique. Each well of the first microtiter plate was
inoculated with a single colony of the selected transformant (from
the above section) using sterile toothpicks to resuspend the cells.
The cell suspension in the microtiter plate was incubated at 30˚C
without shaking. After 2 days, 10 µl of each culture were added to
190 µl sterile YPD broth in a new microtiter plate with the
orientation marked as the first microtiter plate to keep track of
the wells. The microtiter plate was incubated again as above. The
process was repeated using the third microtiter plate to adjust the
culture to be approximately similar visually to ensure equivalent
numbers of cells were spotted on Geneticin® contained
YPD plates. Following overnight incubation, 10 µl cell suspension
from each well of the third microtiter plate was spotted on YPD
plates containing 0 (control), 0.25, 0.50, 0.75 and 1.00 mg/ml
Geneticin®. The cells were spotted on the agar in a
regular pattern with a grid underneath the plate to ensure that an
equal intensity of cells was spotted on the grid. The cell
suspension liquid was allowed to soak in the gel, and the plates
were then incubated at 30˚C for 2-5 days to allow the colonies of
Geneticin-resistant transformants to grow on the respective plates
in the grid. Single colonies that could survive at different
concentrations of Geneticin® were selected, followed by
re-streaking the selected colonies on respective YPD plates
containing Geneticin®.
Growth induction of the multi-copy
number insert Pichia transformants
A single antibiotic-resistant colony of
Pichia transformants (GS115-pPIC3.5K-hTopI) from each YPD
plate containing Geneticin® (as described above) was
inoculated in 5 ml YPD medium. The cells were grown at 30˚C
overnight with shaking at 200 rpm. In a 1-liter flask, 250 ml fresh
buffered glycerol complex medium (BMGY; Merck KGaA) was inoculated
with 250 µl of the overnight culture. The culture was grown again
overnight until the optical density (OD) at 600 nm reached 2.0. The
culture was harvested by centrifugation at 3,000 x g for 5 min at
room temperature. The sample supernatant was then removed, and the
cell pellet was resuspended in 10 ml buffered methanol-complex
medium (BMMY; Merck KGaA). The cell suspension was diluted with
BMMY to a final volume of 25 ml or until the culture reading at 600
nm reached 1.0. The cells were induced with 0.5% methanol every 24
h at 30˚C for 96 h. The cells were collected every 12 h to measure
the cell density using a Multiskan Spectrum Spectrophotometric
Plate Reader (Thermo Electron Co.) that represented growth. The
OD600 was adjusted to 2.0 at 0 h of cultivation. The
cells were also collected every 12 h on ice for total protein and
specific protein sample preparation.
Analysis of specific protein
expression in the Pichia transformants by western blot
analysis
For the cell pellets collected from each ml of
sample on ice (as described above), 100 µl breaking buffer and an
equal volume of acid-washed glass beads were added. The mixture was
vortexed for 30 sec and then incubated for a further 30 sec at room
temperature for a total of 10 cycles. The mixture was then
centrifuged at maximum speed (25x100 g) for 10 min at 4˚C. The
clear supernatant was transferred to a fresh microcentrifuge tube
for protein concentration analysis using the Pierce™ BCA Protein
Assay kit (Bio-Rad Laboratories, Inc.) or stored the supernatant at
-80˚C until use. The total protein concentration (mg/ml) for the
sample collected every 12 h was measured. As for the specific
protein, a total of 20 µg protein from each selected sample was
then used for analysis by 10% sodium dodecyl
sulphate-polyacrylamide gel electrophoresis (SDS-PAGE). Following
electrophoresis, the distributed proteins on the gel were
transferred onto a nitrocellulose membrane (GE Healthcare; Cytiva)
by the semidry transfer method using a Trans-blot SD Semidry
Transfer Cell (Bio-Rad Laboratories, Inc.). Following protein
transfer, non-specific proteins on the membrane were blocked with
5% blocking solution for 2 h on a shaker. The membrane was then
washed with TBST three times for 10 min each. The membrane was
incubated with purified mouse anti-hTopI antibody (1:5,000 dilution
in TBST; cat. no. 556597; BD Biosciences) at 4˚C overnight. The
following morning, the membrane was washed again with TBST as
described above. After washing, the membrane was incubated with
horseradish peroxidase-conjugated goat anti-mouse IgG
(1:10,000 dilution in TBST; cat. no. 554002; BD Biosciences) for 1
h on a shaker. The membrane was then washed again with TBST as
described above. The protein signal development process was carried
out in a dark room, whereby the membrane was first overlaid with
chemiluminescence substrate (Thermo Fisher Scientific, Inc.). Cling
wrap was then overlaid on the wet membrane, followed by X-ray film
(GE Healthcare; Cytiva) exposure for ~5 min. The film was then
immersed in developer solution (MilliporeSigma) for a few seconds,
rinsed with tap water and then fixed with fixer solution
(MilliporeSigma) for a few seconds. The developed film was then
air-dried, and the signals on the X-ray film were scanned using
ImageScanner III LabScan 6.0 (GE Healthcare; Cytiva).
Determination of recombinant enzyme
activity by DNA relaxation assay
The protein samples, as prepared above, were also
used for enzyme activity determination by DNA relaxation assay. The
assay was performed in a total volume of 20 µl of reaction mixture
containing 4 µl 5X hTopI reaction buffer, 1 µl 0.25 µg pBR322
plasmid DNA (Invitrogen; Thermo Fisher Scientific, Inc.) and 1 µl
of the protein sample (6). Water
was used instead of the protein sample in the reaction mixture for
the negative control. All reactions were incubated at 37˚C for 30
min. Subsequently 4 µl 6X hTopI stopping buffer [3% SDS (Bio-Basic
Inc.), 60 mM ethylenediaminetetraacetic acid (EDTA; Amresco), 50%
glycerol (Bio-Basic Inc.) and 0.25% bromophenol blue] was added to
the reaction mixture to stop the reactions. The reaction mixture
was then briefly centrifuged and electrophoresed on a 1% (w/v)
agarose gel in 0.5X TBE at 30 V for 200 min. The gel was then
stained with ethidium bromide for 30 min and de-stained by soaking
it in distilled water for a further 30 min. The gel was viewed
under ultraviolet (UV) light and photographed using an Alpha
Innotech Fluorchem FC2 (Thermo Fisher Scientific, Inc.). The enzyme
action is expressed as B/A x 106 Ul-1,
whereby A is an appropriate volume of supernatant added to the
reaction. By contrast, B is the dilution factor of the supernatant
required to complete the relaxation of 0.25 µg of pBR322 plasmid
DNA.
Statistical analysis
The data are presented as the mean ± SD of
triplicate determinations. The student's t-test was used to analyse
the enzyme activity to compare mean values between two datasets. By
contrast, GraphPad Prism version 9.4.0 one-way ANOVA with Tukey's
multiple comparisons test (GraphPad Software, Inc.) was used to
compare differences in the mean among groups of cell density and
total protein concentration. The level of significance was set at
α=0.05 (95% confidence interval), a value of P<0.05 was
considered to indicate a statistically significant difference.
Results
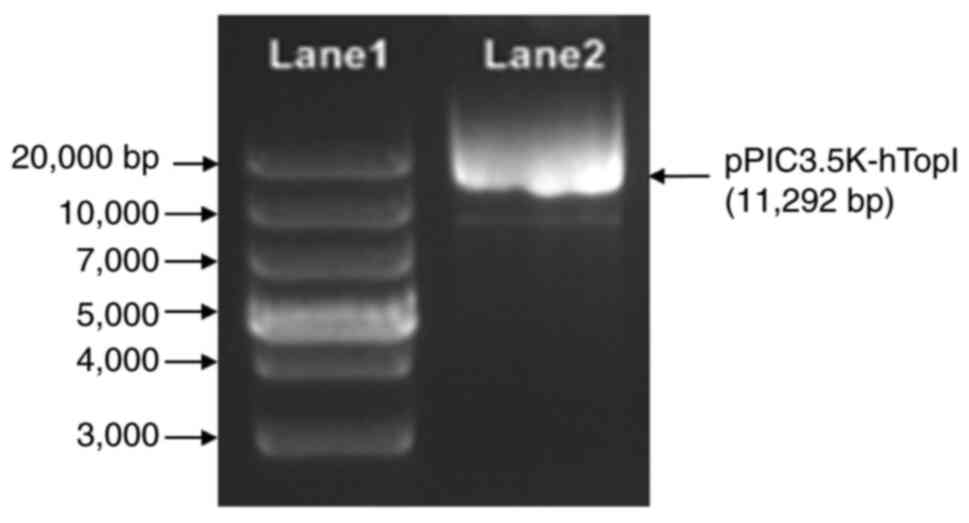
The constructed recombinant plasmid
for in vivo strategy yeast transformation
A single copy of the hTopI fragment (~2,717 bp) that
was ligated into the pPIC3.5K plasmid (~8,575 bp) at the
EcoRI and NotI sites, producing the pPIC3.5K plasmid
containing a single copy of hTopI (pPIC3.5K-hTopI) is illustrated
in Fig. 1. The recombinant
pPIC3.5K-hTopI plasmid, which was expected to be ~11,292 bp in
length, was then linearized with the SalI prior to the
transformation of Pichia via an in vivo strategy to
determine the effect of gene copy number on cell growth and total
protein expression in the yeast transformants. The pPIC3.5K-hTopI
plasmid was digested with EcoRI and NotI to confirm
that all extracted plasmids harbored the correct insert. The
extracted plasmid DNAs were also sent for sequencing to verify that
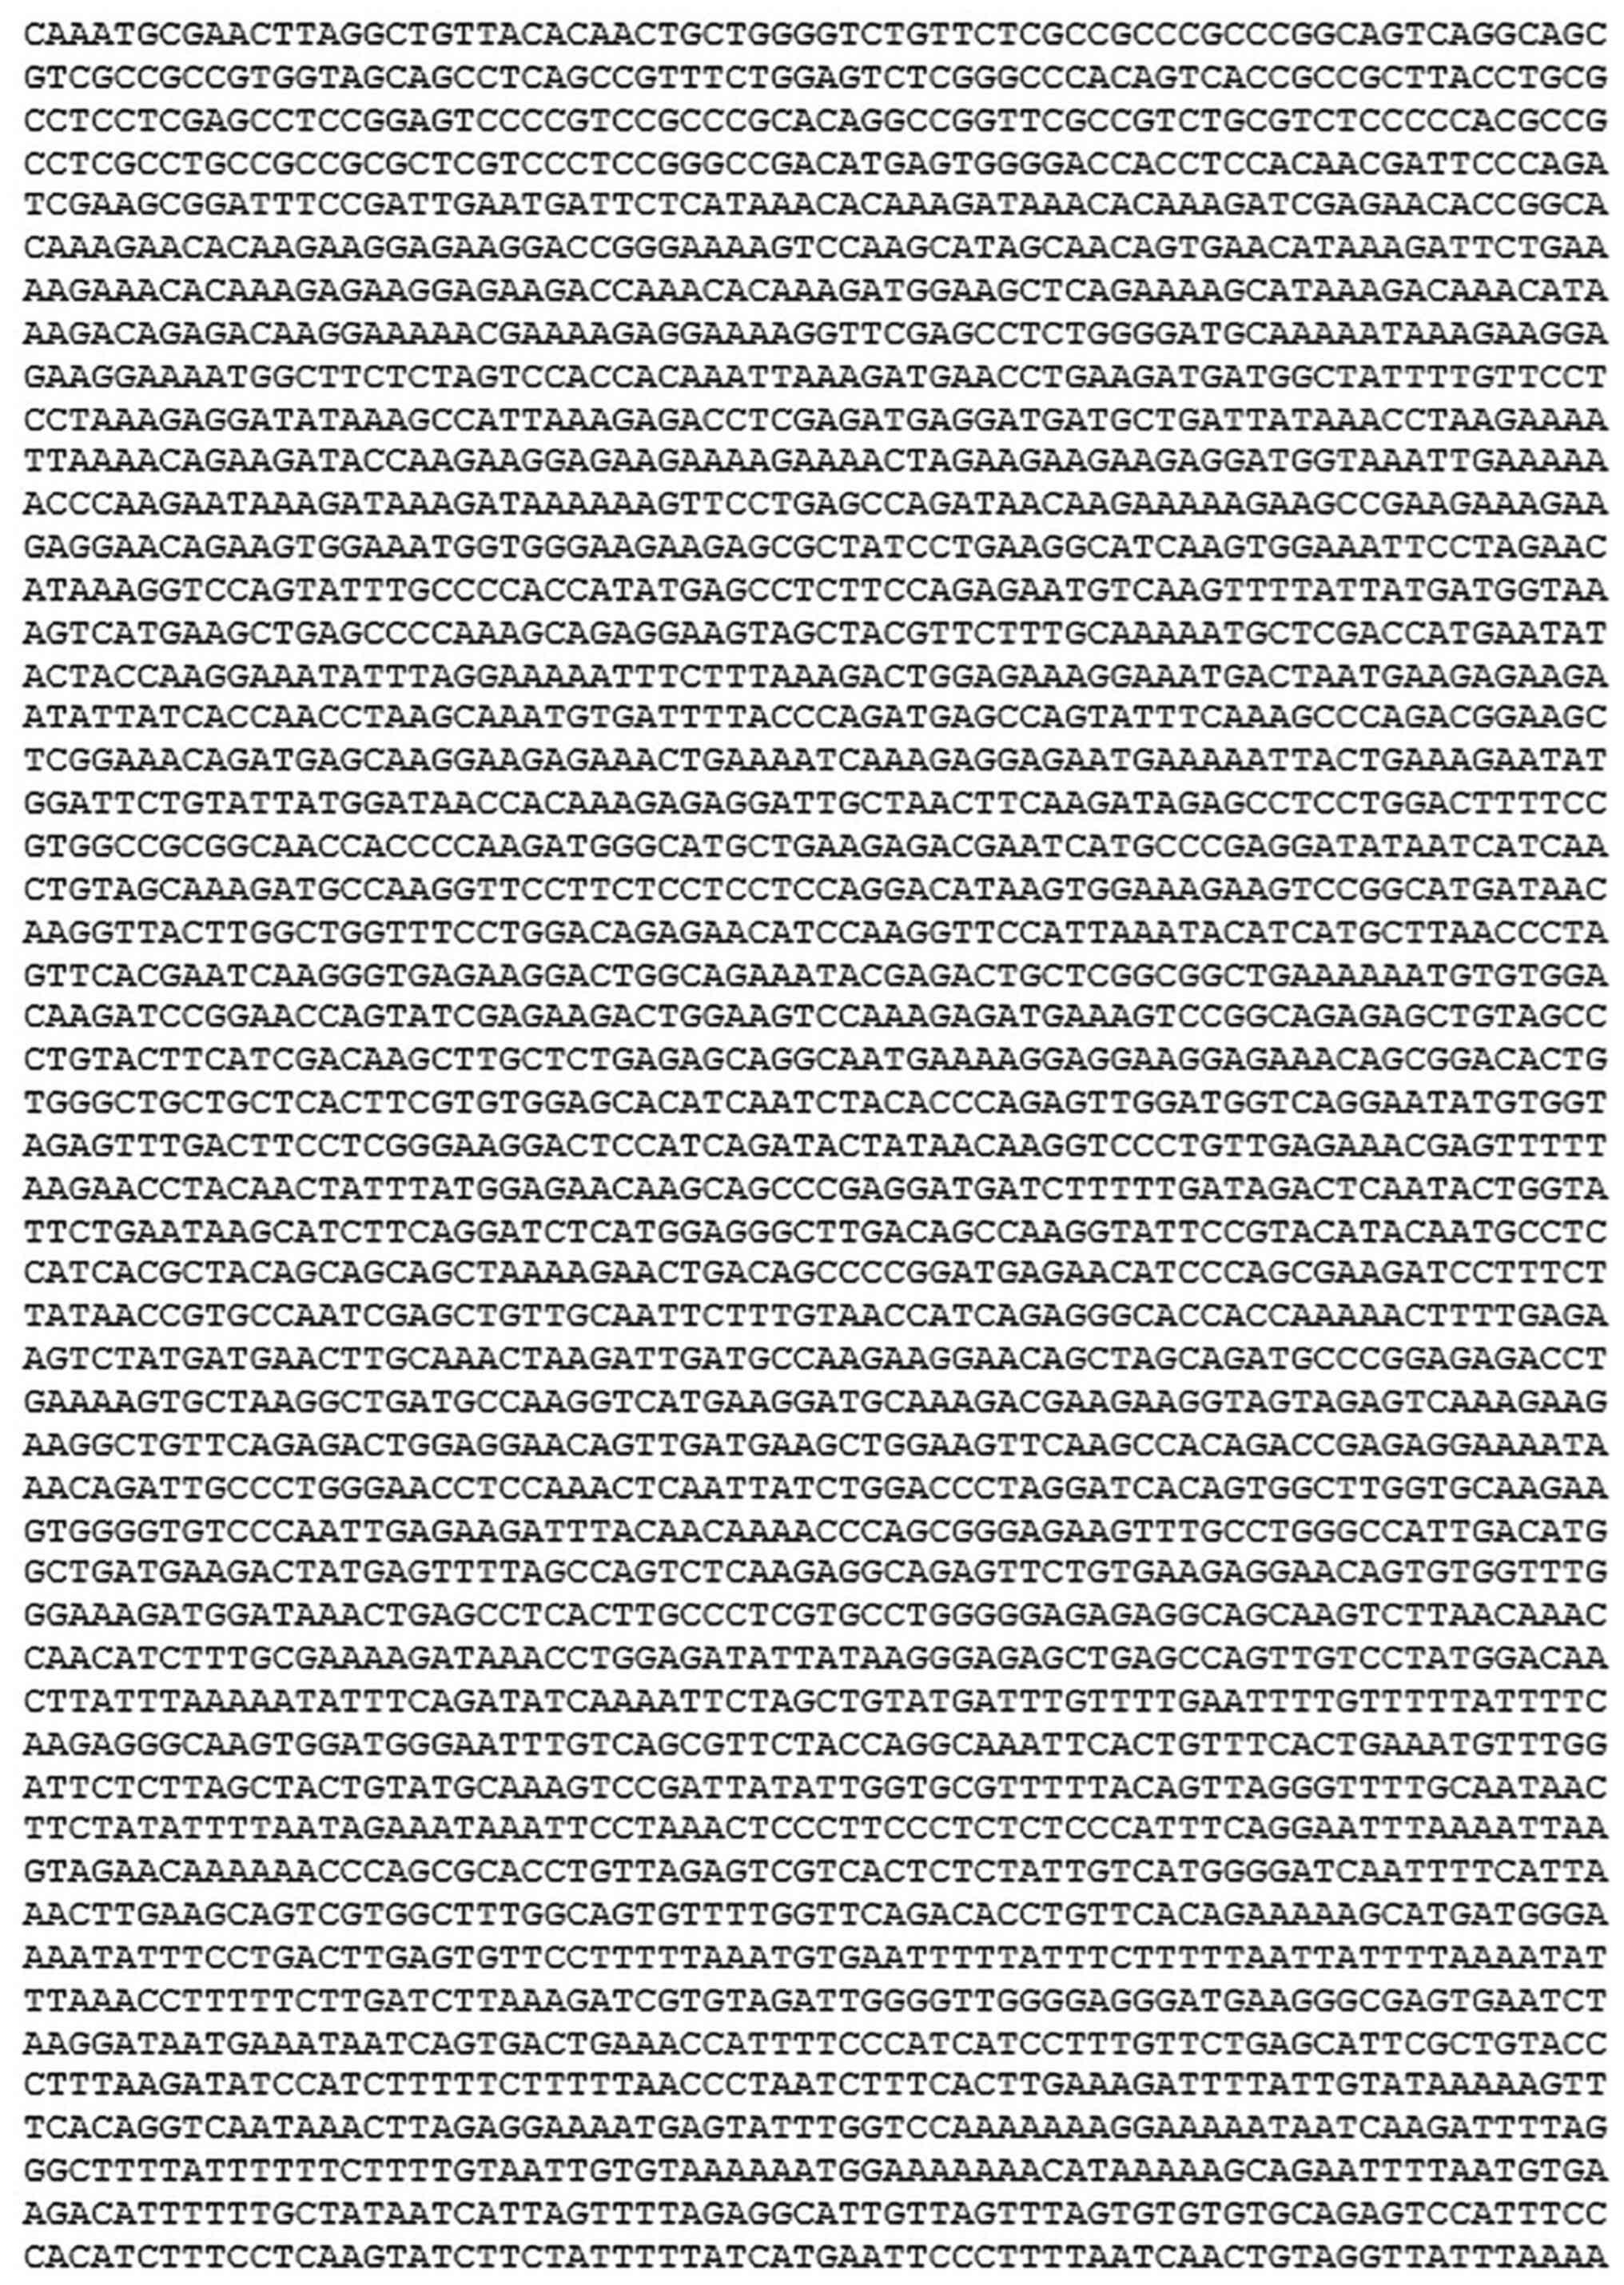
each correct insert of the plasmid was cloned. The nucleotide
sequence (GenBank: MW117125.1; https://www.ncbi.nlm.nih.gov/nuccore/MW117125) of the
insert in the plasmid is illustrated in Fig. 2. The results indicated that the
recombinant pPIC3.5K-hTopI plasmid was constructed.
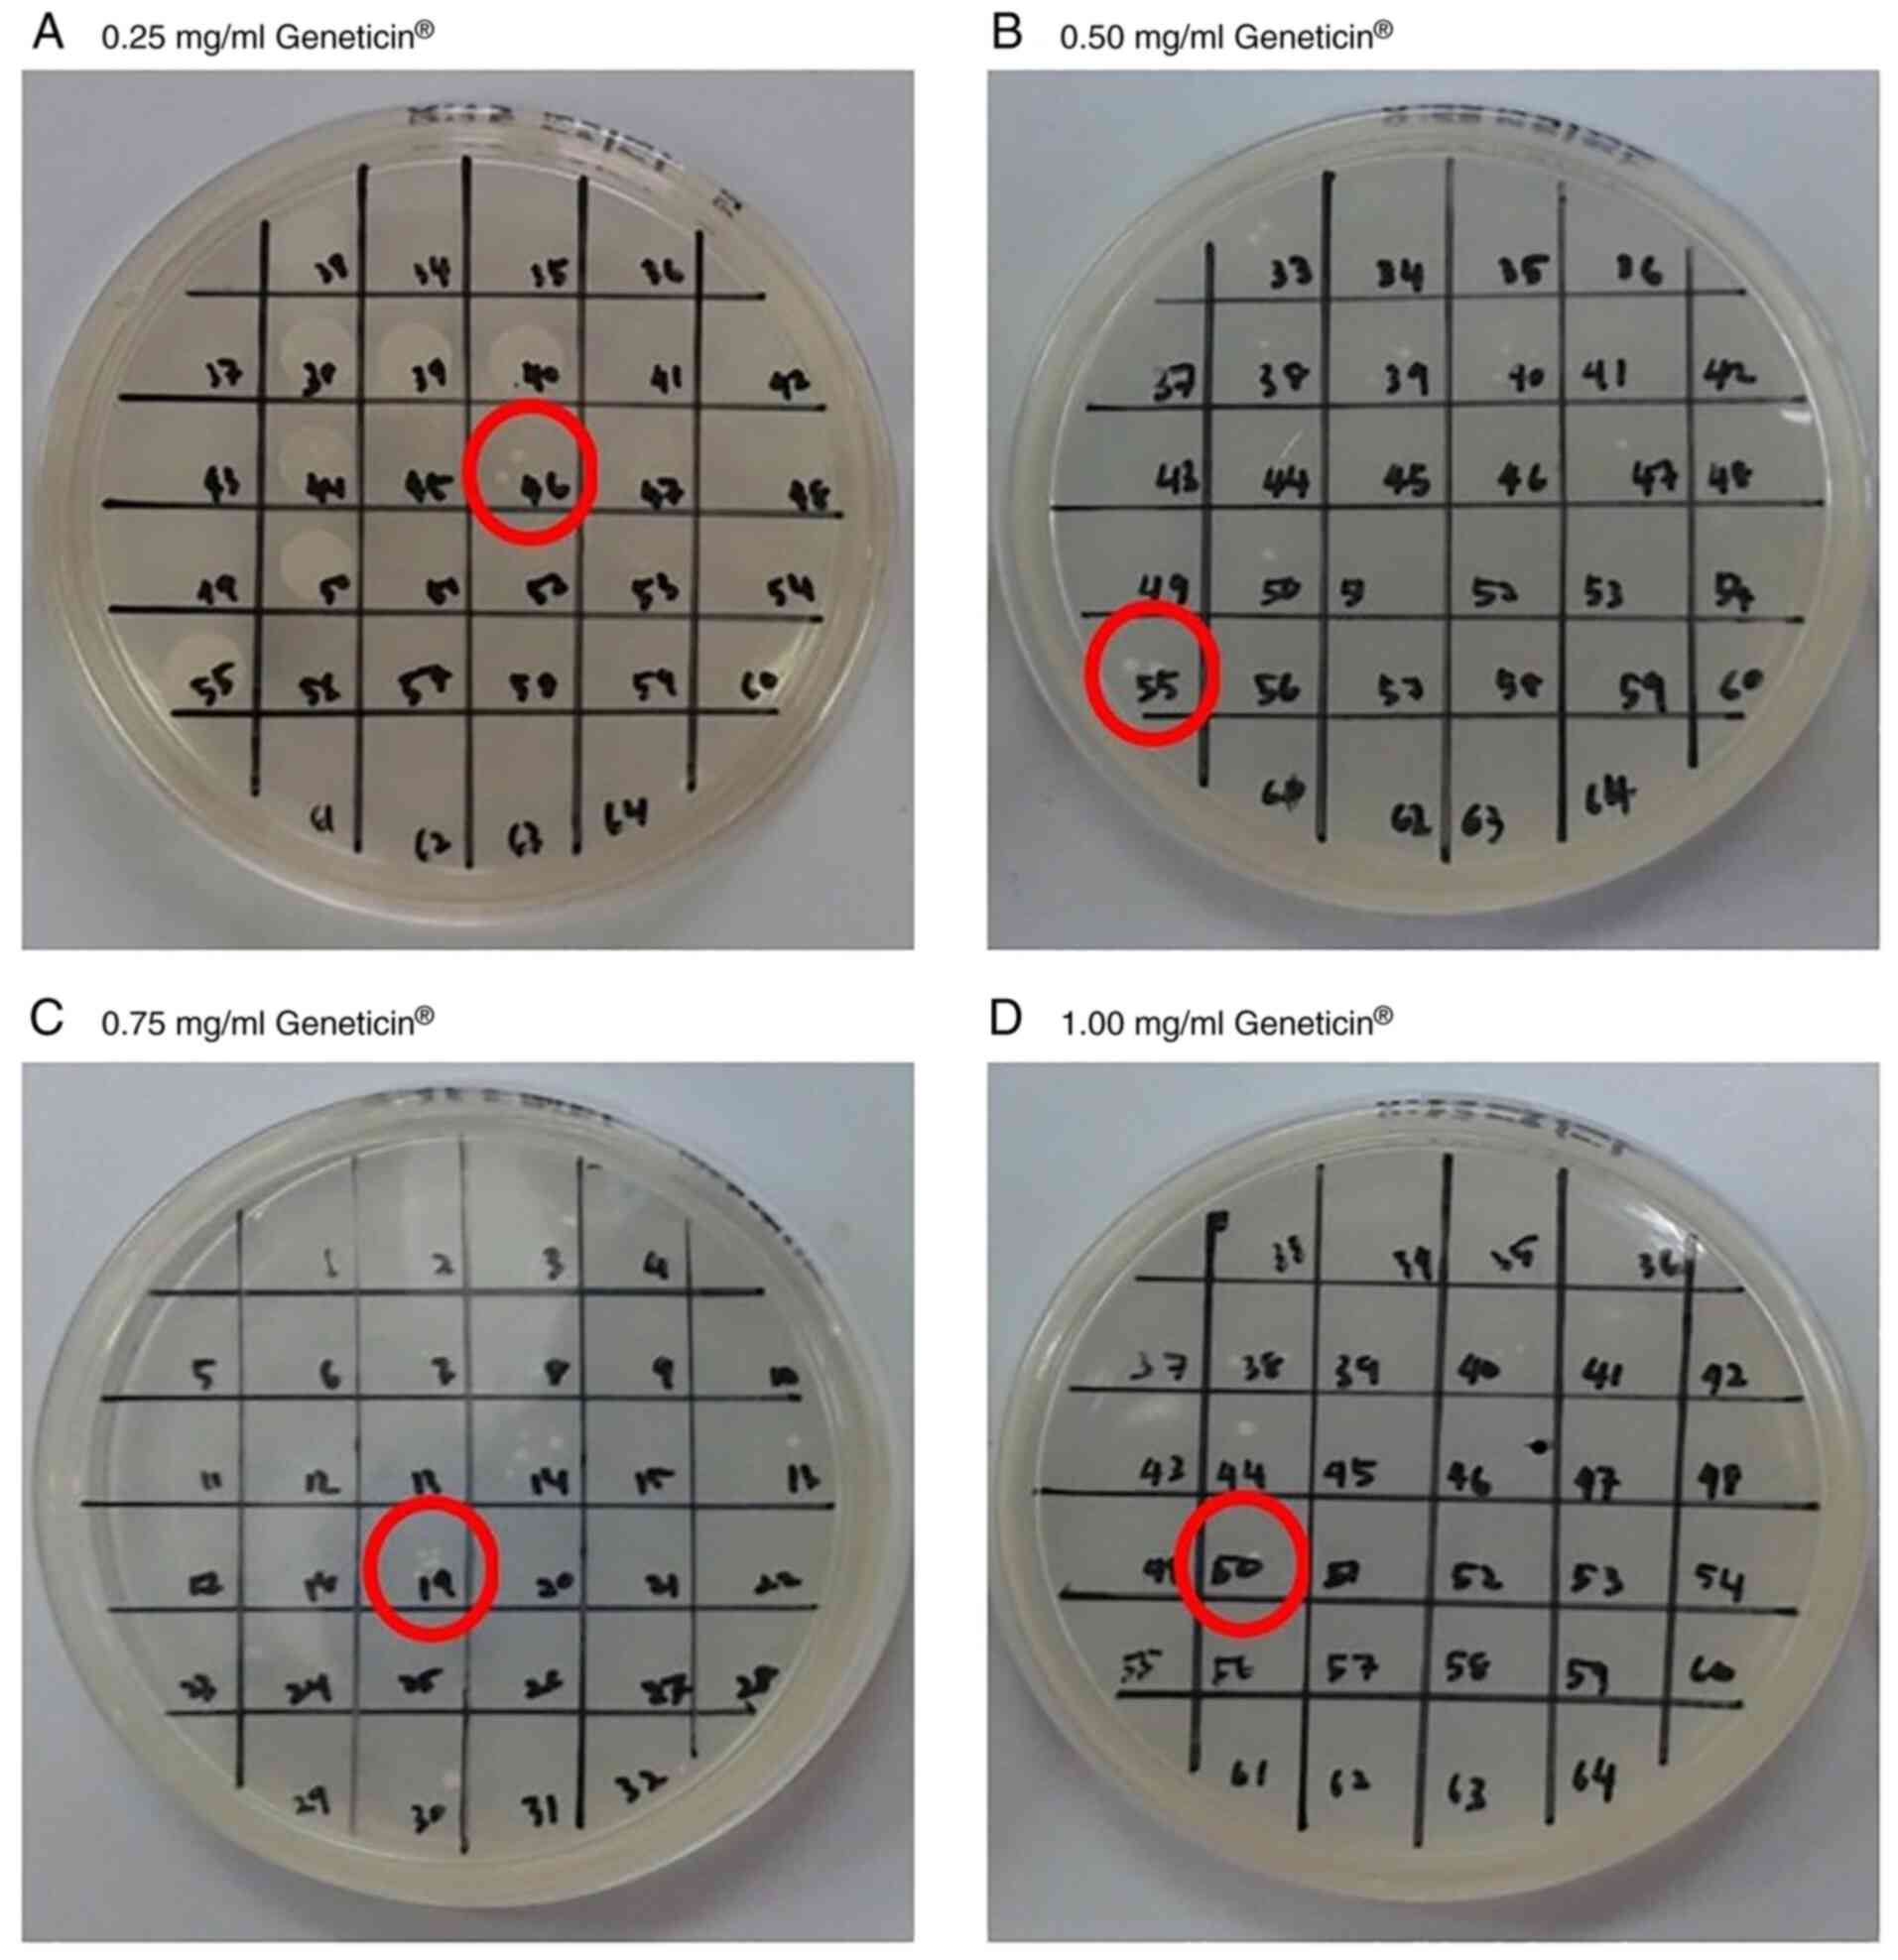
In vivo screening of multi-copy insert
transformants
The multi-copy inserts of His+
transformants were produced after the linearized pPIC3.5K-hTopI
plasmid DNA was transformed into the Pichia GS115 strain. As
many as 68 yeast transformants (GS115-pPIC3.5K-hTopI) were selected
for subculturing from the microtiter plate. From the observations,
clones 46, 55, 19 and 50 were selected from the plates that
contained 0.25, 0.50, 0.75 and 1.00 mg/ml Geneticin, respectively
(Fig. 3). The selection was based
on the ability of the clones to survive on agar plates containing
various antibiotic concentrations. The Pichia transformants
(GS115-pPIC3.5K-hTopI), which were constructed via an in
vivo strategy and resistant to various Geneticin
concentrations, were later subjected to cell growth (density) and
total protein expression analyses.
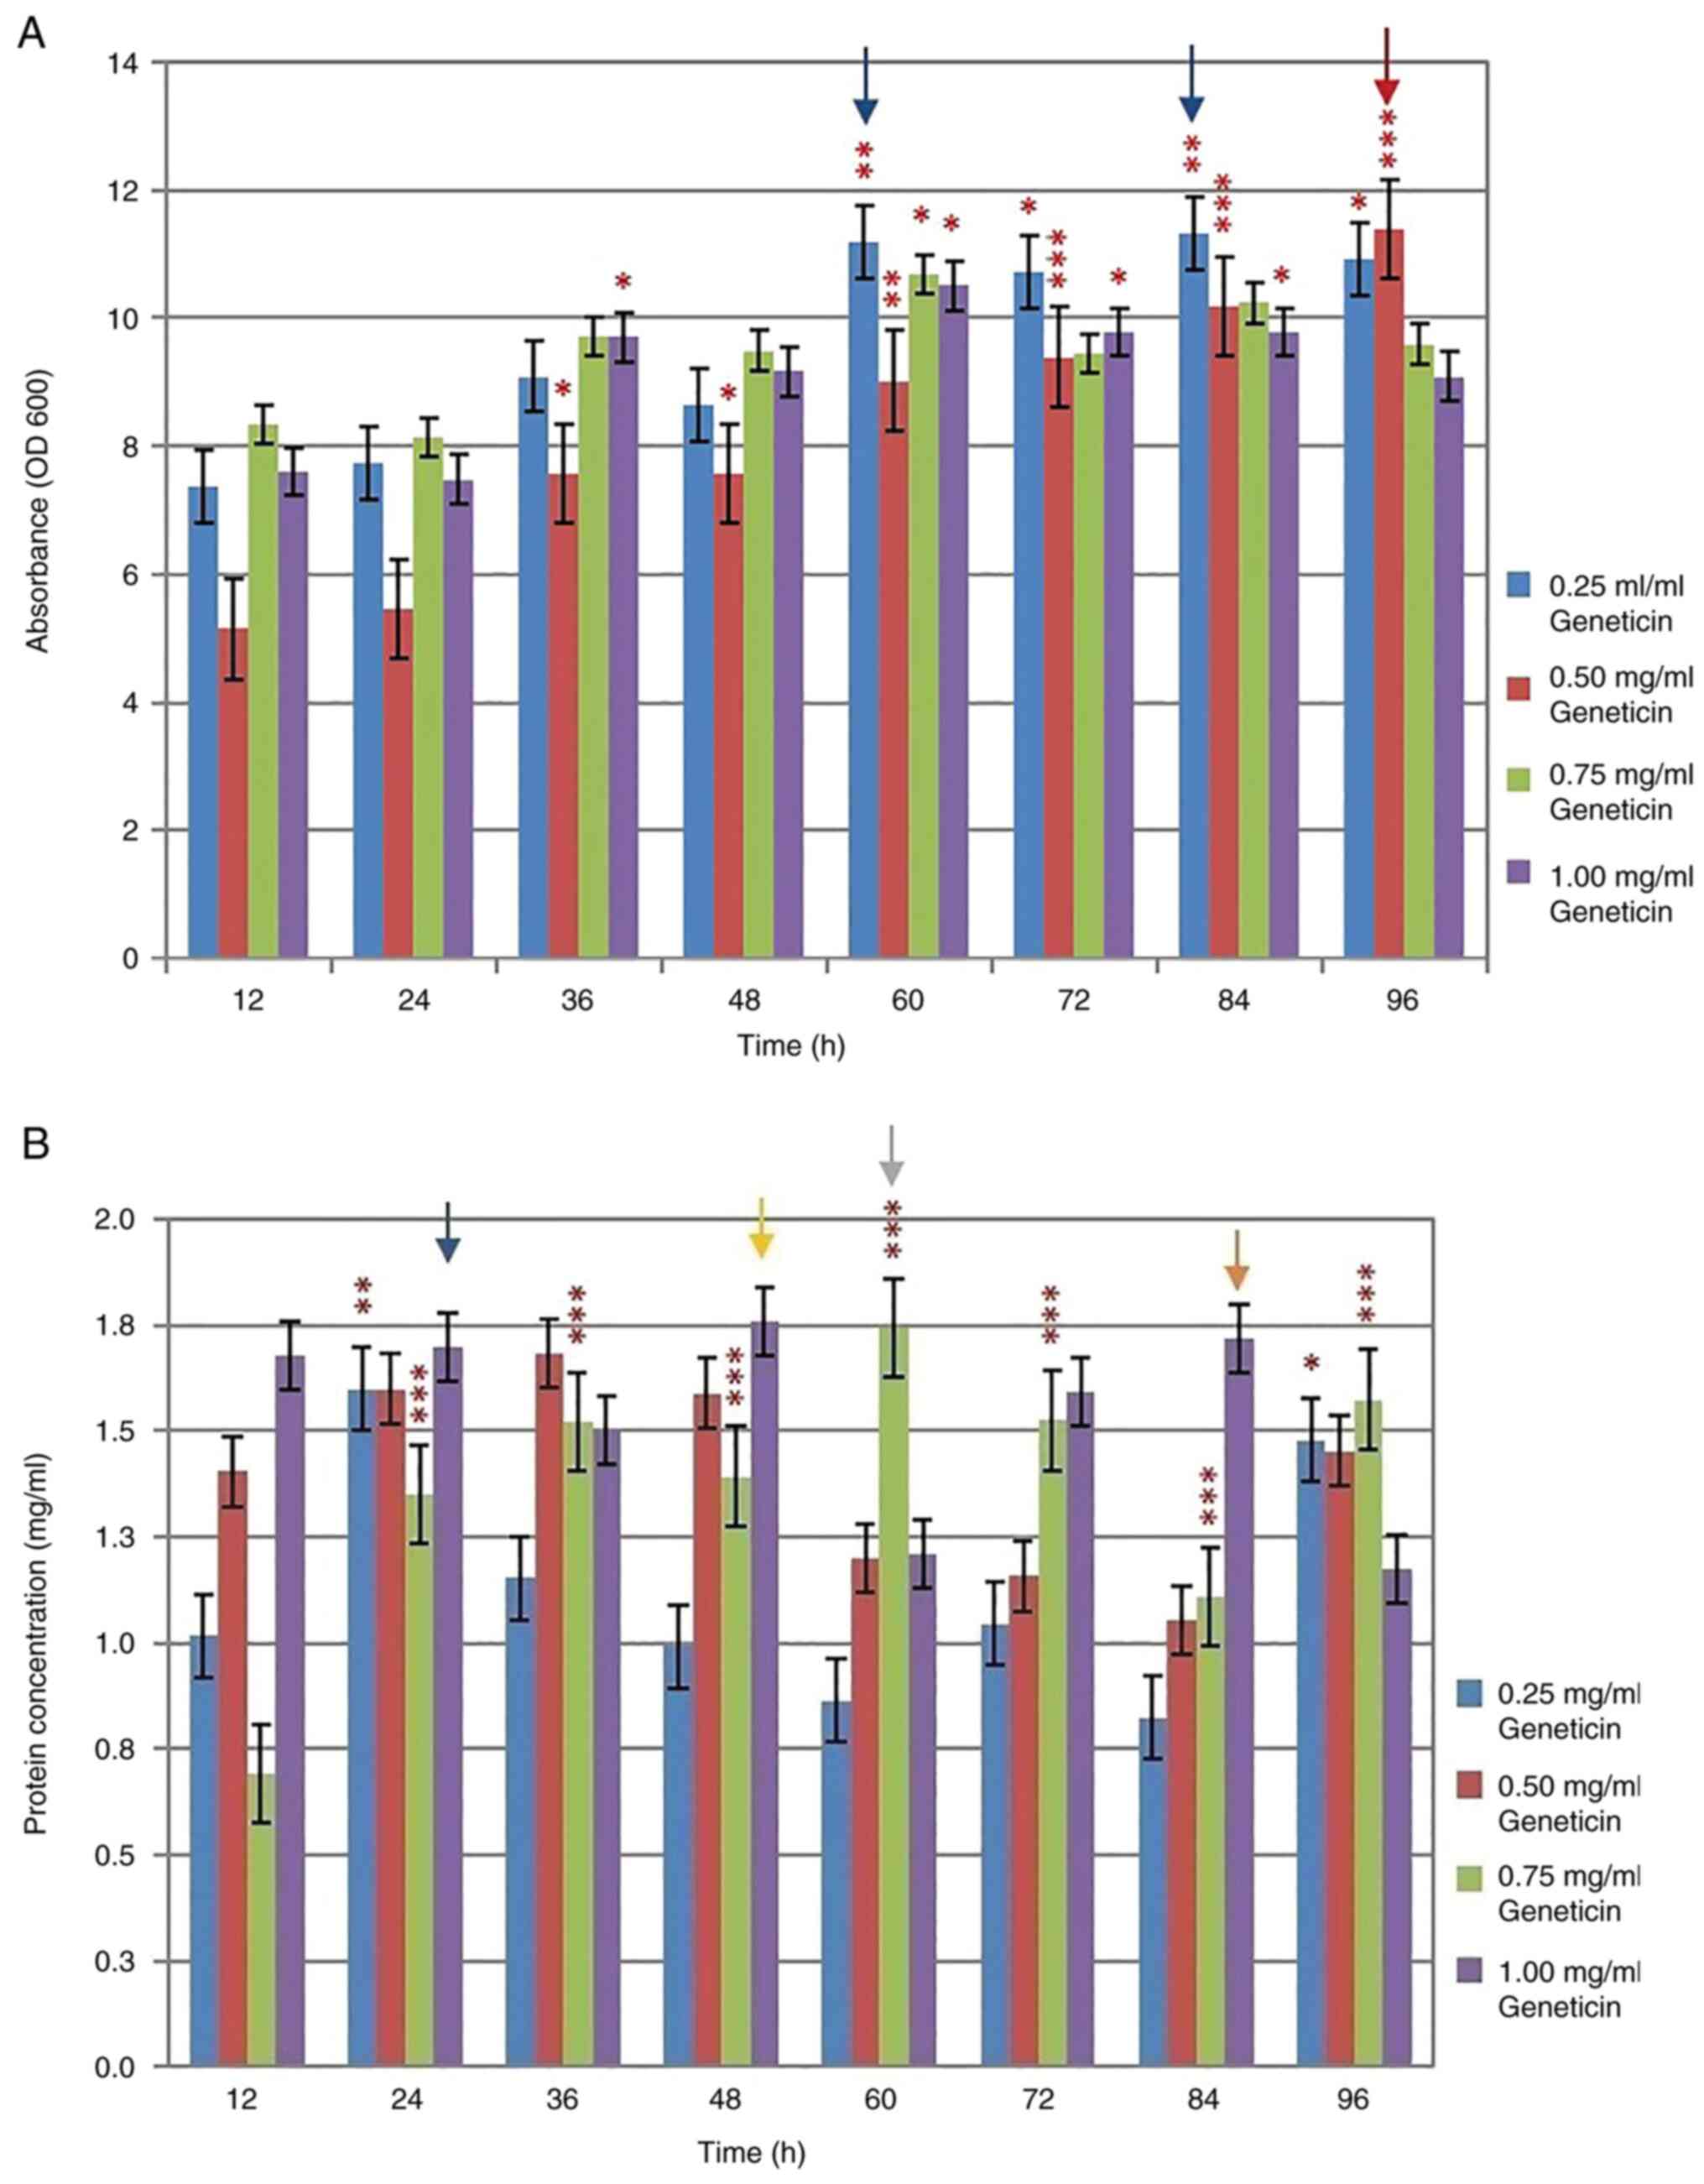
Cell growth and total protein
expression of the transformants
The cell density of the collected cultures was
measured every 12 h, whereby the cell density increased with the
incubation times (Fig. 4A). The
highest cell density was observed in GS115-pPIC3.5K-hTopI resistant
to 0.50 mg/ml Geneticin at 96 h of incubation. The absorbance of
the cell density of the His+ transformants at this time
point was 11.39 units (P<0.001) at OD600. However,
increasing the number of inserts and incubation time did not
increase the cell density of the transformants. The transformants
resistant to 0.25 mg/ml Geneticin at 60 and 84 h of incubation
exhibited similar cell densities: 11.19 units (P<0.01) and 11.33
units (P<0.01) at OD600, respectively. Conversely,
the increase in insert copy number and incubation time did increase
the expression level of total protein in the transformants. In
brief, the highest total protein expression was obtained in the
clone that was resistant to 1.00 mg/ml Geneticin at 48 h of
incubation and 0.75 mg/ml Geneticin at 60 h of incubation (Fig. 4B). The total protein expression
levels in these transformants were 1.76 and 1.75 mg/ml
(P<0.001), respectively. Other GS115-pPIC3.5K-hTopI strains that
exhibited similar total protein expression levels were also
observed in the transformants resistant to 1.00 mg/ml Geneticin at
24 h of incubation (1.70 mg/ml) and 1.00 mg/ml Geneticin at 84 h of
incubation (1.72 mg/ml). In summary, the level of total protein
expression in the clones of GS115-pPIC3.5K-hTopI, which were
resistant to various concentrations of Geneticin, indicated that
GS115-pPIC3.5K-hTopI exhibited the highest level of total protein
expression and resistance to 0.25 mg/ml Geneticin was the clone
collected at 24 h of incubation (1.60 mg/ml). The
GS115-pPIC3.5K-hTopI that exhibited the highest level of total
protein expression and resistance to 0.50 mg/ml Geneticin was the
clone collected at 36 h of incubation (1.68 mg/ml), the
GS115-pPIC3.5K-hTopI that exhibited the highest level of total
protein expression and resistance to 0.75 mg/ml Geneticin was the
clone collected at 60 h of incubation (1.75 mg/ml), and the
GS115-pPIC3.5K-hTopI that exhibited the highest level of total
protein expression and resistance to 1.00 mg/ml Geneticin was the
clone collected at 48 h of incubation (1.76 mg/ml) (Table I). These four clones were selected
for comparisons in subsequent experiments. Although the highest
expression level of total protein was found in the selected
transformants, the normalization of the increased total protein
expression level in all transformants with cell density per se did
not reveal any statistically significant differences.
 | Table ICell density and total protein
expression by GS115-pPIC3.5K-hTopI resistant to various Geneticin
concentrations. |
Table I
Cell density and total protein
expression by GS115-pPIC3.5K-hTopI resistant to various Geneticin
concentrations.
| Time point (h) | Geneticin®
concentration (mg/ml) | Cell density
(absorbance OD600) | Total protein
(mg/ml) | Total protein per
hour (mg/ml/h) | Total protein per
cell density (mg/ml/unit) |
|---|
| 12 | 0.25 mg/ml | 7.38 | 1.02 | 0.08 | 0.14 |
| | 0.50 mg/ml | 5.14 | 1.40 | 0.12 | 0.27 |
| | 0.75 mg/ml | 8.33 | 0.69 | 0.06 | 0.08 |
| | 1.00 mg/ml | 7.60 | 1.68 | 0.14 | 0.22 |
| 24 | 0.25 mg/ml | 7.75 | 1.60a | 0.07 | 0.21 |
| | 0.50 mg/ml | 5.45 | 1.60 | 0.07 | 0.29 |
| | 0.75 mg/ml | 8.15 | 1.35 | 0.06 | 0.17 |
| | 1.00 mg/ml | 7.48 | 1.70b | 0.07 | 0.23 |
| 36 | 0.25 mg/ml | 9.09 | 1.15 | 0.03 | 0.13 |
| | 0.50 mg/ml | 7.57 | 1.68a | 0.05 | 0.22 |
| | 0.75 mg/ml | 9.72 | 1.52 | 0.04 | 0.16 |
| | 1.00 mg/ml | 9.70 | 1.50 | 0.04 | 0.15 |
| 48 | 0.25 mg/ml | 8.65 | 0.99 | 0.02 | 0.11 |
| | 0.50 mg/ml | 7.56 | 1.59 | 0.03 | 0.21 |
| | 0.75 mg/ml | 9.49 | 1.39 | 0.03 | 0.15 |
| | 1.00 mg/ml | 9.16 | 1.76a,b | 0.04 | 0.19 |
| 60 | 0.25 mg/ml | 11.19b | 0.86 | 0.01 | 0.08 |
| | 0.50 mg/ml | 9.02 | 1.20 | 0.02 | 0.13 |
| | 0.75 mg/ml | 10.69 | 1.75a,b | 0.03 | 0.16 |
| | 1.00 mg/ml | 10.50 | 1.21 | 0.02 | 0.12 |
| 72 | 0.25 mg/ml | 10.72 | 1.04 | 0.01 | 0.10 |
| | 0.50 mg/ml | 9.39 | 1.16 | 0.02 | 0.12 |
| | 0.75 mg/ml | 9.44 | 1.53 | 0.02 | 0.16 |
| | 1.00 mg/ml | 9.78 | 1.59 | 0.02 | 0.16 |
| 84 | 0.25 mg/ml | 11.33b | 0.82 | 0.01 | 0.07 |
| | 0.50 mg/ml | 10.18 | 1.05 | 0.01 | 0.10 |
| | 0.75 mg/ml | 10.23 | 1.11 | 0.01 | 0.11 |
| | 1.00 mg/ml | 9.78 | 1.72b | 0.02 | 0.18 |
| 96 | 0.25 mg/ml | 10.93 | 1.48 | 0.02 | 0.14 |
| | 0.50 mg/ml | 11.39b | 1.45 | 0.02 | 0.13 |
| | 0.75 mg/ml | 9.59 | 1.57 | 0.02 | 0.16 |
| | 1.00 mg/ml | 9.08 | 1.18 | 0.01 | 0.13 |
Specific protein expression and enzyme
activity of hTopI on selected clones
The expression analysis revealed that a protein band
of ~91 kDa was observed in the total protein of all four selected
clones (Fig. 5A). The 91 kDa
protein was detected by the antibody purified from mouse anti-human
DNA TopI, indicating that the protein of interest was expressed in
the multi-copy gene of His+ transformants using the
in vivo strategy (Fig. 5B).
The clones of GS115-pPIC3.5K-hTopI resistant to 0.25 mg/ml
Geneticin and were collected at 24 h of incubation, those resistant
to 0.50 mg/ml Geneticin and were collected at 36 h of incubation,
those resistant to 0.75 mg/ml Geneticin and were collected at 60 h
of incubation, and those resistant to 1.00 mg/ml Geneticin and were
collected at 48 h of incubation; these were then subjected to the
determination of the activity of hTopI. The hTopI activity of the
clones was assayed based on the ability of hTopI to relax pBR322
supercoiled DNA. It was found that hTopI expressed by
GS115-pPIC3.5K-hTopI resistant to various Geneticin concentrations
could relax the pBR322 supercoiled DNA compared with the
supercoiled DNA in the reaction without hTopI (Fig. 5C). The supercoiled DNA migrated
more rapidly than the relaxed form of DNA due to the smaller size
of the DNA, and hence, the band of supercoiled DNA appeared lower
than the relaxed form of the DNA on the same agarose gel. The
enzyme activity of hTopI in GS115-pPIC3.5K-hTopI resistant to
various Geneticin concentrations is also summarized in Table II. The highest enzyme activity of
hTopI was observed in the culture expressed by GS115-pPIC3.5K-hTopI
resistant to 1.00 mg/ml Geneticin (19.7x10⁴
Ul/OD600). The enzyme activity was ~3-fold greater than
the enzyme activity of hTopI in GS115-pPIC3.5K-hTopI resistant to
0.25 mg/ml Geneticin (7.74x10⁴ Ul/OD600). The
enzyme activities of hTopI in GS115-pPIC3.5K-hTopI resistant to
0.50 and 0.75 mg/ml Geneticin were 10.6x10⁴
Ul/OD600 and 9.35x10⁴ Ul/OD600,
respectively (Table II). This
phenomenon demonstrated that the enzyme activity of hTop1 produced
in GS115-pPIC3.5K-hTopI was likely to be proportional to the level
of antibiotic resistance or increased with the target gene's
increment copy number in each clone.
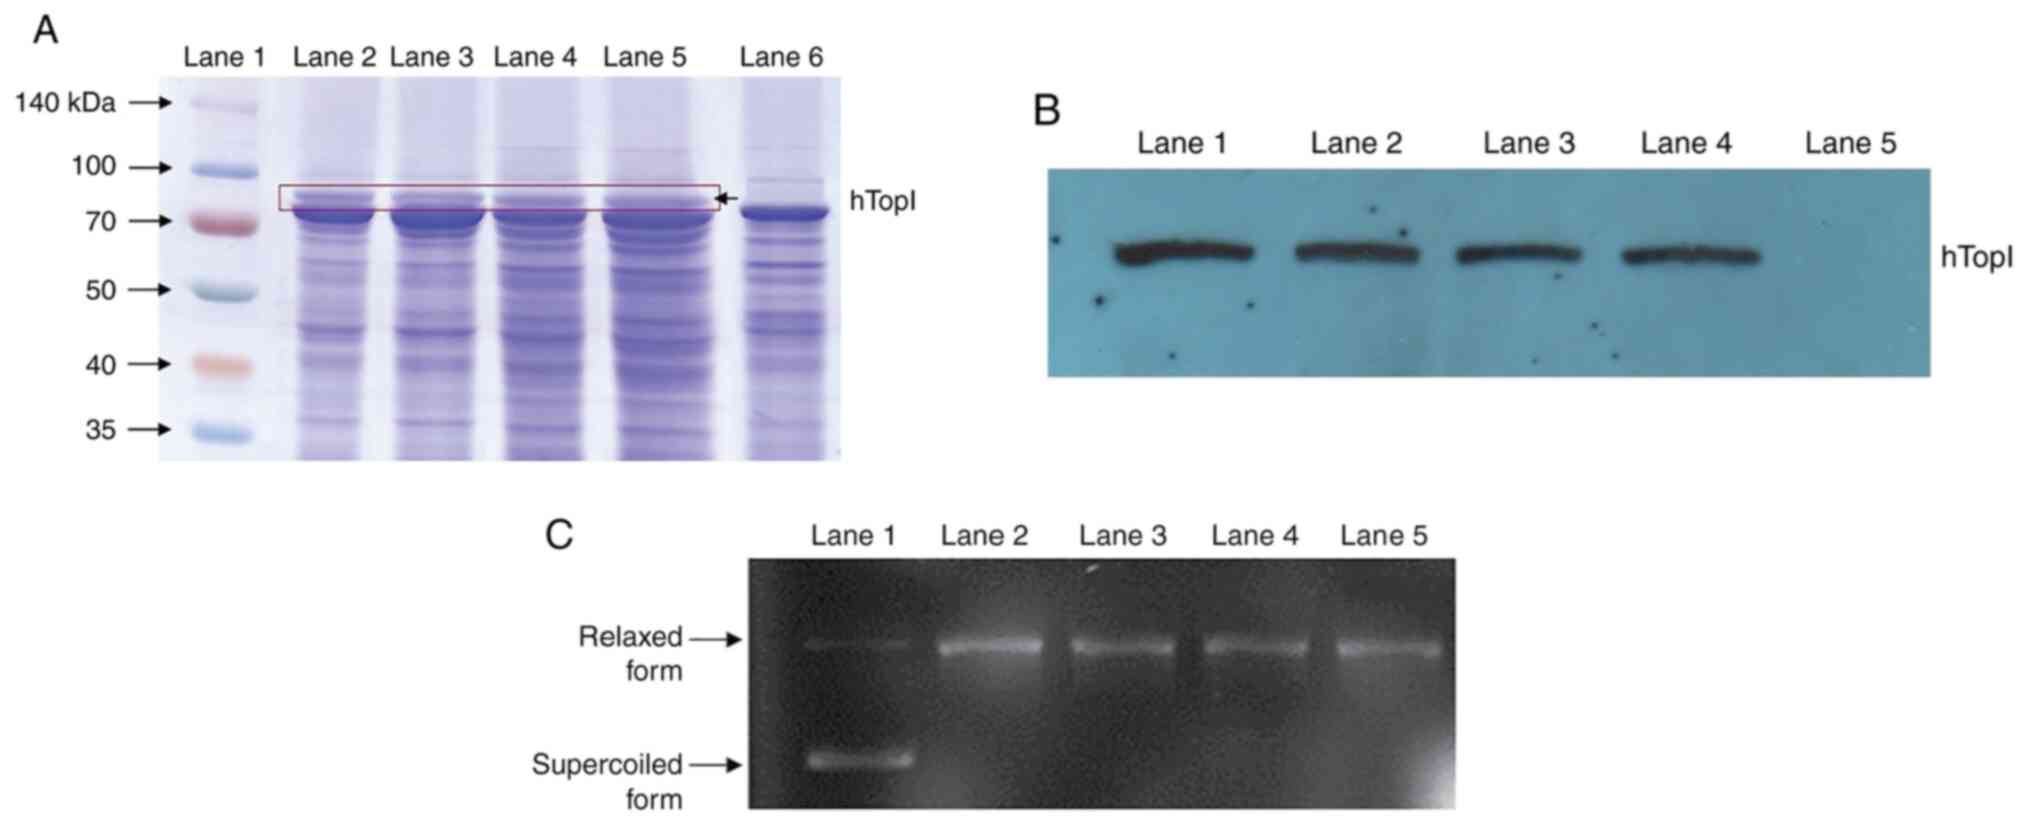 | Figure 5Specific protein expression for
selected clones. (A) SDS-PAGE of total protein extracted from
GS115-pPIC3.5K-hTopI resistant to various Geneticin concentrations
and collected at different incubation time points. Lane 1,
SpectraTM Multicolor Broad Range Protein Ladder (Thermo
Fisher Scientific, Inc.); lane 2, clone resistant to 1.00 mg/ml
Geneticin, collected at 24 h of incubation; lane 3, clone resistant
to 1.00 mg/ml Geneticin, collected at 48 h of incubation; lane 4,
clone resistant to 0.75 mg/ml Geneticin, collected at 60 h of
incubation; lane 5, clone resistant to 1.00 mg/ml Geneticin,
collected at 84 h of incubation; lane 6, negative control. The
marker was run on the same gels/blots. (B) Western blot analysis
for hTopI protein detection in GS115-pPIC3.5K-hTopI resistant to
various Geneticin concentrations and collected at different
incubation time points. Lane 1, clone resistant to 1.00 mg/ml
Geneticin, collected at 24 h of incubation; lane 2, clone resistant
to 1.00 mg/ml Geneticin, collected at 48 h of incubation; lane 3,
clone resistant to 0.75 mg/ml Geneticin, collected at 60 h of
incubation; lane 4, clone resistant to 1.00 mg/ml Geneticin,
collected at 84 h of incubation; lane 5, negative control. (C) A
1.0% agarose gel electrophoresis of the enzyme activity of hTopI in
the clones that were resistant to various Geneticin concentrations
and collected at different incubation time points. Lane 1,
supercoiled DNA of pBR322 incubated without hTopI (control); lane
2, supercoiled DNA of pBR322 incubated with hTopI from the clone
resistant to 0.25 mg/ml Geneticin (24 h); lane 3, supercoiled DNA
of pBR322 incubated with hTopI from the clone resistant to 0.50
mg/ml Geneticin (36 h); lane 4, supercoiled DNA of pBR322 incubated
with hTopI from the clone resistant to 0.75 mg/ml Geneticin (60 h);
lane 5, supercoiled DNA of pBR322 incubated with hTopI from the
clone resistant to 1.00 mg/ml Geneticin (48 h). The control was run
on the same gels/blots. |
| Table IIThe activity of hTopI in the clones
of GS115-pPIC3.5K-hTopI resistant to various Geneticin
concentrations. |
Table II
The activity of hTopI in the clones
of GS115-pPIC3.5K-hTopI resistant to various Geneticin
concentrations.
| Clone resistant to
Geneticin® (mg/ml) | OD600 of
culture | Intracellular
enzyme activity (Ul/OD600) | Total enzyme
activity (U/l) |
|---|
| 0.25 | 7.75 |
7.74x10⁴ |
3.02x10⁶ |
| 0.50 | 7.57 |
10.6x10⁴ |
4.02x10⁶ |
| 0.75 | 10.69 |
9.35x10⁴ |
5.02x10⁶ |
| 1.00 | 9.16 |
19.7x10⁴ |
9.04x10⁶a |
Discussion
In the present study, the recombinant pPIC3.5K-hTopI
plasmid, which contained a copy of the human DNA topoisomerase I
(hTopI), was constructed. The Pichia transformants or
recombinant yeast (GS115-pPIC3.5K-hTopI), which contained a
multi-copy number of hTopI, was also produced via an in vivo
strategy. The cell density of GS115-pPIC3.5K-hTopI was likely to be
unaffected by the copy number of hTopI. However, the total protein
expression and the target enzyme activity of the recombinant yeast
were increased in accordance with the increased copy number of
hTopI in the host, whereby the yeast that was able to survive at
the highest concentration of Geneticin expressed the highest level
of total protein and had the highest activity of the enzyme.
Pichia is a widely used host system for the
expression of heterologous proteins. In addition to the popularity
factors, this system also offers the strong and highly regulated
alcohol oxidase promoter, stable integration events in the host
chromosomal DNA and efficient techniques for high-density
cultivation to express the protein of interest. Therefore, the
present study utilized this yeast system to express hTopI, whereby
the gene encoding the protein of interest is ~2,298 bp. The
expression using recombinant yeast containing a single copy number
of the target gene was disappointingly low; indeed, the multi-copy
number of the gene expression cassette has been one of the most
effective strategies to increase the expression of the GOI
(3,7). The recombinant yeast was constructed
using the pPIC3.5K vector in the present study via the in
vivo strategy to determine the effects of gene copy number on
cell density, the expression of total protein and the target enzyme
activity in Pichia.
His+ Pichia transformants with
multi-copy inserts (recombinant yeast) resistant to various
concentrations of Geneticin were also selected in the present
study. The gene copy number can be quantified using qPCR (3) or it can be estimated based on the
ability of the clones to survive on agar plates containing various
antibiotic concentrations. As described in the study by Athmaram
et al, they selected a panel of Pichia clones
carrying increasing copies of the heterologous gene based on
Geneticin resistance and the SYBR-Green-based qPCR approach was
more or less matched (8). Overall,
the recombinant Pichia transformants carrying a maximum of
four to six copies of the transgene were identified using these
strategies. The association between the Geneticin resistance level
and PCR positivity for screening the Pichia transformants
revealed that the clones capable of surviving on agar plates
containing 0.25, 0.50 and 0.75 mg/ml Geneticin may contain 1, 2 and
4-6 gene copy numbers, respectively. From that, it can be estimated
that the clones capable of surviving on agar plates containing 1.00
mg/ml Geneticin may contain a gene copy number >4-6. However,
the cell density of the selected clones was likely not affected by
the copy number of the target gene in the host, which may be not be
affected by the downstream metabolic activity of the cells.
According to previous studies, gene expression induction results in
excessive plasmid replication that consequently increases the
plasmid copy number in the transformants (9,10).
However, this phenomenon also contributes to the host cell
metabolic burden (11). As a
result, the metabolic activity is strongly impaired in the cells,
indicated by the decelerated increase in biomass and OD. For the
effect of the in vivo strategy, the present study found the
highest expression level of total protein (as much as 1.76 mg/ml)
in GS115-pPIC3.5K-hTopI resistant to 1.00 mg/ml Geneticin at 48 h
of incubation. However, normalization of the total protein level
per hour and per cell density in each transformant was
statistically insignificant compared to the total protein level in
control. Therefore, the study is continued by investigating the
target enzyme activity, whereby the study found an increment in the
gene copy number to increase the enzyme activity of hTopI produced
in GS115-pPIC3.5K-hTopI.
A transformant or clone with two identical copies of
a gene under the control of an identical promoter, in theory,
should produce twice as much protein. However, increasing the gene
dosage does not necessarily increase protein expression. In some
cases, e.g., human trypsinogen (12) and Na-ASPI (13), increased the gene dosage reduced
the protein expression. Therefore, an optimal level rather than a
maximal copy number should be considered due to other possible
protein expression bottlenecks, e.g., protein translation,
secretion or degradation (12,14,15).
Furthermore, an increased copy number of foreign genes may result
in the alteration of normal metabolism in Pichia, leading to
a negative influence on the normal cell physiology of multiple-copy
recombinant yeast, particularly in the case of secretory
expression, which includes a reduction in methanol consumption
capacity and specific growth rate, decreased cell viability,
increased instability of integrated foreign genes or diminished
cell secretory ability (16). For
this reason, it is suggested to test the transformants with
increasing gene copy numbers and later identify the optimal gene
copy number for maximum protein production. Although the strategy
used in the present study did not significantly alter the
expression of total protein per cell density in each clone, the
ability of hTopI expressed by GS115-pPIC3.5K-hTopI resistant to
various Geneticin concentrations was increased as the resistance
towards Geneticin was increased. This event also further
demonstrated that the hTopI expression ability in the present study
was able to relax supercoiled DNA, and the enzyme activity
increased with increasing target gene copy number. It is
hypothesized that after several rounds of subcultures, the genes in
multiple copies may not be retained and therefore need to be
removed. Indeed, the gene copy number can be ascertained by
maintaining the clones on the agar plates containing respective
concentrations of Geneticin.
In conclusion, the present study provides
information on producing target protein from the recombinant
Pichia using only a shaker flask system, which can be
further developed as an in-house resource for screening potential
anticancer agents from various natural resources.
Acknowledgements
The first author would like to thank the Graduate
Assistant Scheme provided by the Institute of Postgraduate Studies,
USM and MyMaster scholarship by Kementerian Pendidikan
Malaysia.
Funding
Funding: The present study was funded by a USM Short-term Grant
Scheme (grant no. 304.CIPPM.6311095) and was partly supported by a
USM Postgraduate Research Grant Scheme (RU-PRGS, grant no.
1001.CIPPM.836021).
Availability of data and materials
The datasets used and/or analysed during the current
study, including the nucleotide sequence of hTopI in the
pPIC3.5K-hTopI plasmid that had been deposited in GenBank (GenBank:
MW117125.1; https://www.ncbi.nlm.nih.gov/nuccore/MW117125), are
available from the corresponding author upon reasonable
request.
Authors' contributions
KBY contributed to the conception and design of the
study. NAF and LSK performed the experiments under technical
support provided by CAL and KBY. In addition, KBY interpreted the
results, and drafted and revised the manuscript. CAL and KBY
confirm the authenticity of all the raw data. All authors have read
and agreed to the final version of this manuscript submitted for
publication.
Ethics approval and consent to
participate
Not applicable.
Patient consent for publication
Not applicable.
Competing interests
The authors declares that they have no competing
interests.
References
|
1
|
Bugreev DV and Nevinsky GA: Structure and
mechanism of action type IA DNA topoisomerases. Biochemistry
(Mosc). 74:1467–1481. 2009.PubMed/NCBI View Article : Google Scholar
|
|
2
|
Hurley LH: DNA and its associated
processes as targets for cancer therapy. Nat Rev Cancer. 2:188–200.
2002.PubMed/NCBI View
Article : Google Scholar
|
|
3
|
Zhu T, Guo M, Tang Z, Zhang M, Zhuang Y,
Chu J and Zhang S: Efficient generation of multi-copy strains for
optimizing secretory expression of porcine insulin precursor in
yeast Pichia pastoris. J Appl Microbiol. 107:954–963.
2009.PubMed/NCBI View Article : Google Scholar
|
|
4
|
Cereghino GP, Cereghino JL, Ilgen C and
Cregg JM: Production of recombinant proteins in fermenter cultures
of the yeast Pichia pastoris. Curr Opin Biotechnol. 13:329–332.
2002.PubMed/NCBI View Article : Google Scholar
|
|
5
|
Chan MK, Lim SK, Miswan N, Chew AL,
Noordin R and Khoo BY: Expression of stable and active human DNA
topoisomerase I in Pichia pastoris. Protein Expr Purif. 141:52–62.
2018.PubMed/NCBI View Article : Google Scholar
|
|
6
|
Yang G, Zhou H, Lu Y, Lin Y and Zhou S:
Comparing expression of different forms of human DNA topoisomerase
I in Pichia pastoris. Enzyme Microb Technol. 34:139–146. 2004.
|
|
7
|
Khan MA, Hassan N, Ahmad N, Khan MI, Zafar
AU, Khan F and Husnain T: Studies to analyse the relationship
between IFNα2b gene dosage and its expression, using a Pichia
pastoris-based expression system. Yeast. 31:13–28. 2014.PubMed/NCBI View
Article : Google Scholar
|
|
8
|
Athmaram TN, Saraswat S, Singh AK, Rao MK,
Gopalan N, Suryanarayana VV and Rao PV: Influence of copy number on
the expression levels of pandemic influenza hemagglutinin
recombinant protein in methylotrophic yeast Pichia pastoris. Virus
Genes. 45:440–451. 2012.PubMed/NCBI View Article : Google Scholar
|
|
9
|
Rahmen N, Schlupp CD, Mitsunaga H, Fulton
A, Aryani T, Esch L, Schaffrath U, Fukuzaki E, Jaeger KE and Büchs
J: A particular silent codon exchange in a recombinant gene greatly
influences host cell metabolic activity. Microb Cell Fact.
14(156)2015.PubMed/NCBI View Article : Google Scholar
|
|
10
|
Rahmen N, Fulton A, Ihling N, Magni M,
Jaeger KE and Büchs J: Exchange of single amino acids at different
positions of a recombinant protein affects metabolic burden in
Escherichia coli. Microb Cell Fact. 14(10)2015.PubMed/NCBI View Article : Google Scholar
|
|
11
|
Palomares LA, Estrada-Mondaca S and
Ramirez OT: Production of recombinant proteins recombinant gene
expression. In: Recombinant Gene Expression. Balbas P and Lorence A
(eds). Humana Press, Totowa, NJ, pp15-51, 2004.
|
|
12
|
Hohenblum H, Gasser B, Maurer M, Borth N
and Mattanovich D: Effects of gene dosage, promoters and substrates
on unfolded protein stress of recombinant Pichia pastoris.
Biotechnol Bioeng. 85:367–375. 2004.PubMed/NCBI View Article : Google Scholar
|
|
13
|
Inan M, Asryasomayajula D, Sinha J and
Meagher MM: Enhancement of protein secretion in Pichia pastoris by
overexpression of protein disulfide isomerase. Biotechnol Bioeng.
93:771–778. 2006.PubMed/NCBI View Article : Google Scholar
|
|
14
|
Cos O, Serrano A, Montesinos JL, Ferrer P,
Cregg JM and Valero F: Combined effect of the methanol utilization
(Mut) phenotype and gene dosage on recombinant protein production
in Pichia pastoris fed-batch cultures. J Biotechnol. 116:321–335.
2005.PubMed/NCBI View Article : Google Scholar
|
|
15
|
Liu H, Qin Y, Huang Y, Chen Y, Cong P and
He Z: Direct evaluation of the effect of gene dosage on secretion
of protein from yeast Pichia pastoris by expression EGFP. J
Microbiol Biotechnol. 24:144–151. 2014.PubMed/NCBI View Article : Google Scholar
|
|
16
|
Zhu T, Guo M, Zhuang Y, Chu J and Zhang S:
Understanding the effect of foreign gene dosage on the physiology
of Pichia pastoris by transcriptional analysis of key genes. Appl
Microbiol Biotechnol. 89:1127–1135. 2011.PubMed/NCBI View Article : Google Scholar
|