Introduction
A significant number of cancer-related deaths
worldwide are associated with malignant tumours of the upper
gastrointestinal (GI) tract, such as the stomach, oesophagus,
oesophagogastric junction (OGJ) (1)
and pancreas. The Global Burden of Disease study undertaken in 2015
identified these types of cancer to have a very poor prognosis,
with gastric and oesophageal cancers contributing to 10.3 and 5.4%,
respectively, of all cancer deaths globally, with both exhibiting a
male preponderance (2). Pancreatic
cancer is associated with a dismal 5-year survival rate of 3% and
its incidence appears to be increasing annually (3,4). This has
led to the development of various therapeutic strategies to prolong
survival, which have had limited success, including improved
surgical techniques, anti-angiogenesis therapies and
adjuvant/neoadjuvant chemoradiotherapy (5,6).
Pancreatic cancer cases in particular are usually diagnosed at an
advanced stage and, therefore, the possibility of a non-invasive
intervention to halt tumour progression is greatly reduced.
Therefore, it is crucial to devise methodologies to not only
pharmacologically treat, but also to diagnose this type of cancer
at an early stage.
The most successful and widely used cancer assays to
date are based on the detection and quantification of glycans in
the serum using antibodies against CA19.9(7) or CA125(8),
a pan-cancer marker that targets carbohydrate-associated epitopes
of immunoglobulin heavy chains (9).
CA19.9, with a reported sensitivity of 90-100% and specificity of
70-98% for pancreatic cancer detection (10), is the best biomarker assay currently
in clinical use. However, the positive predictive value of CA19.9
for detecting pancreatic cancer is only 0.9% in the asymptomatic
population due to a dependency of blood-group markers where CA19.9
can be used (11). It is also
associated with biliary obstruction (12) and has been proven unable to
distinguish pancreatic cancer from matched controls in larger
studies, highlighting its poor clinical utility as a tumour marker
(13).
Other potential cancer protein biomarkers have been
identified by antibody arrays, such as H2B histone using the IPO-38
antibody to define gastric cancer (14), M2 pyruvate kinase in faeces as a GI
cancer marker (15) and
tumour-associated trypsin inhibitor as a marker of liver metastasis
and colorectal cancer (16), and by
mass spectrometry, such as S100A9 for upper GI cancer (17), as well as S100A6 for a wide array of
tissue cancers, including thyroid (18), gastric (19), ovarian (20), hepatocellular (21), bowel (22), breast (23) and upper GI (17) cancers.
Numerous potential biomarkers were also identified
by gene array screens of diseased tissue (24-27) and by microRNA
array screens of circulating biofluids (28), in the most frequent cancers affecting
the GI tract (29,30). The latter is considered as a promising
source of clinically relevant biomarkers, when compared with tissue
gene array screens, since the use of biopsies as a predictive
diagnostic tool remains unrealistic for use in the clinical
setting. Additionally, prediction of several cancer types based on
serum metabolic profiles is also feasible (31). Concomitantly, collaborative efforts
have been made to promote the detection of plasma-derived
metabolite markers for pancreatic cancer diagnosis (32,33).
There is a clear need to simplify the medium to be
screened due to genetic variations and population heterogeneity in
order to define reliable disease markers. A substantially less
complex system, such as the urine, which contains ~5,000 proteins
(34), would be a preferred medium to
screen for protein or peptide biomarkers. This has a number of
advantages, including non-invasive sampling for patients, ease of
sampling, and unrestricted availability under normal conditions
(35). Urine itself is also
relatively stable in terms of protein and peptide composition and
fragmentation state compared with other body fluids, such as the
serum, where proteolytic degradation by endogenous proteases has
been shown to occur during or after sample collection (36).
In the present study, surface-enhanced laser
desorption/ionization-time-of-flight mass spectrometry
(SELDI-TOF-MS) was used to screen human urine samples from patients
with upper GI tumours to establish biomarker patterns using the
CM10 and IMAC30 chip types, as well as independent LC-MS/MS mass
spectrometry screening and a combined bioinformatics data analysis,
in order to present a potentially useful approach to diagnosing
upper GI tissue type-specific cancers in humans using novel
potential biomarkers.
Materials and methods
Materials
All buffers, gels and SELDI chips were purchased
from Bio-Rad Laboratories Ltd. (Hemel Hempstead, UK), and all other
chemicals were obtained from Sigma-Aldrich; Merck KGaA (Gillingham,
UK), unless stated otherwise in the text.
Sample collection
Urine samples were obtained from 83 patients with
upper GI cancers undergoing potentially curative resection. The
participant demographics are summarised in Table I and provided in detail in Table SI. The participants' age ranged
between 43 and 83 years. Fasting urine samples were obtained at
induction of anaesthesia. One-third of the patients had pancreatic
tumours, one-third had oesophageal cancer, approximately one-sixth
had malignancies of the OGJ and one-sixth suffered from gastric
cancer. All procedures were approved by the local research ethics
committee and written informed consent was obtained from the
patients. The study conformed to the standards set by the
Declaration of Helsinki. All urine samples were stored at -40˚C.
Long-term storage of samples (>1 month) was at -80˚C.
 | Table I.Demographics of the cohort used in
this study (n=83). |
Table I.
Demographics of the cohort used in
this study (n=83).
| Cancer
typea | Oesophagus | Pancreas | OGJ | Gastric | Total |
|---|
| No. of
patients | 27 | 28 | 13 | 15 | 83 |
| Mean
ageb (years) | 66.5 (10.8) | 63.5 (9.1) | 61.5 (8.1) | 70(7) | 65.3 (9.5) |
| Male | 22 | 16 | 12 | 9 | 59 |
| Female | 5 | 12 | 1 | 6 | 24 |
SELDI-TOF-MS
SELDI chips (CM10 and IMAC30) were prepared for
sample application according to the manufacturer's recommendations.
Briefly, IMAC30 chips were loaded with 0.1 M CuSO4,
washed with water, neutralised with 0.1 M NaHAc (pH 4.0) and again
washed with water, followed by two washes with 0.1 M
NaHPO4 and 0.5 M NaCl; CM10 chips were washed twice with
0.1 M NaHPO4 (pH 4.0). All chips were processed in a
bioprocessor assembly by incubating 0.1 ml urine and 0.1 ml binding
buffer [IMAC30: 0.1 M NaHPO4, 0.5 M NaCl; CM10: 0.1 M
NaHPO4 (pH4.0)] for 1 h at room temperature with
vigorous shaking, followed by three washes with 0.2 ml binding
buffer for 5 min each at room temperature with vigorous shaking and
two washes with 0.2 ml water at room temperature with vigorous
shaking. All chips were removed from the bioprocessor assembly,
air-dried and 1 µl energy-absorbing matrix [a saturated solution of
sinapinic acid in 50% acetonitrile (ACN) and 0.5% trifluoroacetic
acid] was added twice. Air-dried chips were analysed in a PCS4000
SELDI-TOF instrument (Bio-Rad Laboratories, Ltd.) by measuring the
1,000-25,000 Da range with a low laser setting of 2.5 µJ, and
spectra were exported as ‘.xml’ files. The SELDI instrument was
calibrated using the ProteinChip All-In-one peptide standard
(Bio-Rad Laboratories, Ltd.). The source voltage was 25,000 V and
the detector voltage was 2,946 V. Quality control and consistency
were ensured by using one random pool of urine samples on one spot
per chip each. Spectra of the full analysis were recorded in two
large batches to minimize instrument variability and drift.
Spectral alignments of all quality controls ensured consistency of
all spectra.
SELDI-TOF-MS data processing
ProteinChip Data Manager Software version 4.1 with
integrated Biomarker Wizard cluster analysis (Bio-Rad Laboratories,
Ltd.) was used for analysis. SELDI-TOF-MS traces were split into
the four cancer type groups. The baseline was subtracted from
individual m/z traces and the profiles were normalised using total
ion current, followed by identification of peak clusters using the
cluster analysis tool. Peaks were selected in the first pass with a
signal-to-noise (S/N) ratio of >5 and a valley depth of at least
3, and in the second pass with a S/N of 2 and a valley depth of 2.
The cluster mass window was set to 0.2% of the mass. Clustered
peaks were only included if they occurred in at least 10% of all
spectra. The resulting P-values, mean and median m/z values, and
the intensities of the clustered peaks were exported and saved as
‘.csv’ files. A two-sample t-test was used to compare mean
normalized intensities between the groups. The P-value was set at
0.05 to indicate statistically significant differences. Clustered
peak lists were analysed with the Biomarker Pattern Software
(Bio-Rad Laboratories, Ltd.) and m/z vs. intensity matrices were
analysed using decision tree analysis, selecting the standard error
rule of minimum-cost tree regardless of size, and using the Gini
method. V-fold testing was set to 1,000. All samples from one
cancer type were used to build exploratory networks by using all
other cancer samples as ‘negative’ controls. Tree model building
was performed using a selected m/z peak as the only deciding factor
to obtain sensitivity and specificity values. Sensitivity was
defined as the probability of predicting specific cancer cases, and
specificity was defined as the probability of predicting other
cancers.
Peak isolation and identification by
LC-MS/MS and Mascot searching
Peaks observed in the CM10 and IMAC30 chip types
(Table SIII) that exhibited marked
expression differences between tissue-specific cancer samples, and
statistical significance in the cluster analyses with P<0.05,
were further investigated. Urine (0.5 ml) from positive or negative
samples in relation to specific peaks was added to 30 µl CM10 or
IMAC30 (Cu2+-complexed) spin column resin (Bio-Rad
Laboratories, Ltd.) and 0.75 ml binding buffer [0.1 M
NaHPO4 (pH 4.0) for CM10 resins, and 0.1 M
NaHPO4 (pH 7.0) including 0.5 M NaCl for IMAC30 resins]
and incubated for 1 h at room temperature under constant agitation.
Unbound material was removed and the resin was washed four times
with 0.3 ml binding buffer. Bound material was separated by
electrophoresis on a 16.5% Tris-Tricine gel (Bio-Rad Laboratories,
Ltd.), and gel bands in the region of 2-10 kDa were excised
following Coomassie staining (BioSafe Coomassie; Bio-Rad
Laboratories, Ltd.). Positive and negative samples were both
selected on the presence and absence of a specific m/z peak to be
identified based on SELDI-TOF-MS analysis. Proteins and peptides
from gel bands were digested in situ with trypsin, the
resulting peptides eluted with ACN, and analysed by LC-MS/MS as
described previously (17).
Data-dependent acquisition was controlled by Xcalibur software and
fragmentation spectra were then processed by Xcalibur and BioWorks
software (Thermo Fisher Scientific, Inc., Loughborough, UK) and
submitted to the Mascot search engine (Matrix Science, London, UK)
using UniProt/SwissProt (release July 2010, Homo sapiens,
18055 sequences) as the reference database. The Mascot search
parameters were as follows: Enzyme specificity, trypsin; maximum
missed cleavage, 1; fixed modifications, cysteine
carbamidomethylation; variable modification, methionine oxidation;
precursor mass tolerance, ±3 Da; and fragment ion mass tolerance,
±0.4 Da. Only Mascot hits with a false discovery rate of
#x003C;0.05 were taken into consideration.
Mascot-SELDI matrix matching
Observed proteins with at least two peptide matches
from the LC-MS/MS analysis were then further analysed by pattern
matching based on SELDI-TOF-MS measured expression levels of peaks
of interest (expected abundance in selected samples). This was
performed using software written in-house, which compares observed
protein expression patterns in a pre-defined set of samples
(LC-MS/MS results) against a matrix of peak patterns (SELDI-TOF
clustered peak intensities, where estimated peaks are set to null)
in the same set of samples. The scoring is based on sensitivity
(percent observed over expected) and specificity (percent not
observed over not expected), and the results are presented in
descending order of cumulative scores.
Western blotting and validation of
Mascot search results
Cross-validation of identified peaks was performed
by western blotting of raw urine samples for anti-cathepsin B
(CTSB) and anti-cystatin B (CSTB) blots (20 µl per sample) using
standard protocols (37). The
antibodies used were rabbit anti-human CTSB (G-60; 1:1,000; cat.
no. 3373; Cell Signaling Technology, Danvers, MA, USA), rabbit
anti-human serum albumin (1:1,000; cat. no. A3293; Sigma-Aldrich;
Merck KGaA), mouse anti-human CSTB (1:400; cat. no. sc-101510;
Santa Cruz Biotechnology, Santa Cruz, CA, USA), and the
peroxidase-coupled secondary antibodies were from Upstate (Lake
Placid, NY, USA), used at a dilution of 1:5,000. Detection of
signals was performed by chemiluminescence using ECL western
blotting reagents (Thermo Fisher Scientific, Inc., Cramlington,
UK).
Results
Urinary screening via SELDI-TOF-MS
analysis
Urine samples from 83 patients diagnosed with
various types of upper GI cancer were analysed in the course of
this study (Table I). A full
demographic with additional clinical data is provided in Table SI. The mean age of the participants
was 65 years, 34% of the cohort suffered from pancreatic cancer,
33% from oesophageal cancer, 18% from gastric tumours and 15% from
cancer of the OGJ. SELDI-TOF-MS analysis was selected to screen the
samples mentioned above based on our previous study, where we
described global specific markers for upper GI cancer (20). We found that both the metal chelator
resin IMAC30 (Cu2+-chelated) and the weak cation
exchanger CM10 yielded the best and most reproducible results. All
samples were measured by SELDI-TOF-MS to obtain a peak pattern of
identified molecular constituents, allowing us to stratify tissue
type-specific cancers. We selected to compare only samples from
cancer patients against each other to circumvent the issue of
accidentally tracking lead markers that may be associated with
additional underlying conditions, such as inflammatory responses,
which are commonly observed in cancer patients.
SELDI analysis of the CM10 chip type-based screen of
the 83 cancer urine samples resulted in 9,379 peaks, and the IMAC30
chip analysis provided a cumulative peak list of 3,346 features
(Table SII). Clustering of observed
peaks using the thresholds described in Materials and methods
resulted in 328 cluster peaks for the CM10 chips, and the IMAC30
chip type gave yield to 92 common peak clusters above the set
thresholds (Table SIII). Both
analyses were performed by omitting estimated peaks in order to
restrict and raise the specificity of potential marker peaks and,
therefore, only included well-defined and separated individual
peaks from all spectra. Statistical analysis revealed that 8 peak
clusters are potentially associated with the various cancer types,
namely m/z 2444 and 2557 for pancreatic cancer in the IMAC30 set,
and m/z 2447 and 9618 in the CM10 chip-based set for the same
cancer type, m/z 5511 and 4908 for OGJ cancer and m/z 4639 for
gastric cancer in the IMAC30 chips, and m/z 4141 for oesophageal
cancer in the CM10 chip set (Fig. 1;
Table II). All potential markers
have P<0.05 and exhibit upregulation in the associated disease.
It is noteworthy to mention that any given peak cluster can
comprise more than one molecular entities. Therefore, it is
possible that both the 2444 and 2447 m/z peaks share an overlap in
their molecular constituents; however, they include other peptides
or proteins which are unique in this specific peak cluster based on
the sensitivity and specificity distribution. The frequency
distribution analysis of those 8 peaks shows that the m/z 9618
cluster from the CM10 chip screen displays the best stratifier for
pancreatic cancer (Fig. 1D), with a
sensitivity of 61% and a specificity of 82% in upper GI cancer
cases. Comparison of all 8 peaks in non-cancer control cases
measured in our previous study (17)
also demonstrated that the m/z 9618 peak cluster exhibits the same
frequency distribution in both non-cancer and non-pancreatic cancer
cases of ~30%, whereas this frequency is doubled in pancreatic
cancer for this peak cluster. The best predictor, based on a low
frequency in non-cancer cases, was the m/z 2577 cluster in
pancreatic cancer (Fig. 1B), with a
79% frequency in this cancer type, a 62% frequency in other
cancers, and a 10% occurrence in non-cancer patient urine, with a
sensitivity of 86% and a specificity of 44%. The elevated amount of
the observed m/z 4141 peak cluster associated with oesophageal
cancer (Fig. 1H) demonstrates the
best specificity of 100%, but exhibits a relatively poor
sensitivity of only 19% due to the relatively low frequency of one
in four samples where this peak can be measured. Low frequency
values were also observed for the OGJ cancer-associated elevated
peak cluster at m/z 4908 (Fig. 1F),
with good sensitivity and specificity values of 92% and 66%,
respectively. A more pronounced potential OGJ marker in terms of
quantitative changes was measured at m/z 5511 (Fig. 1E) with a high specificity (94%), but a
relatively low sensitivity (38%).
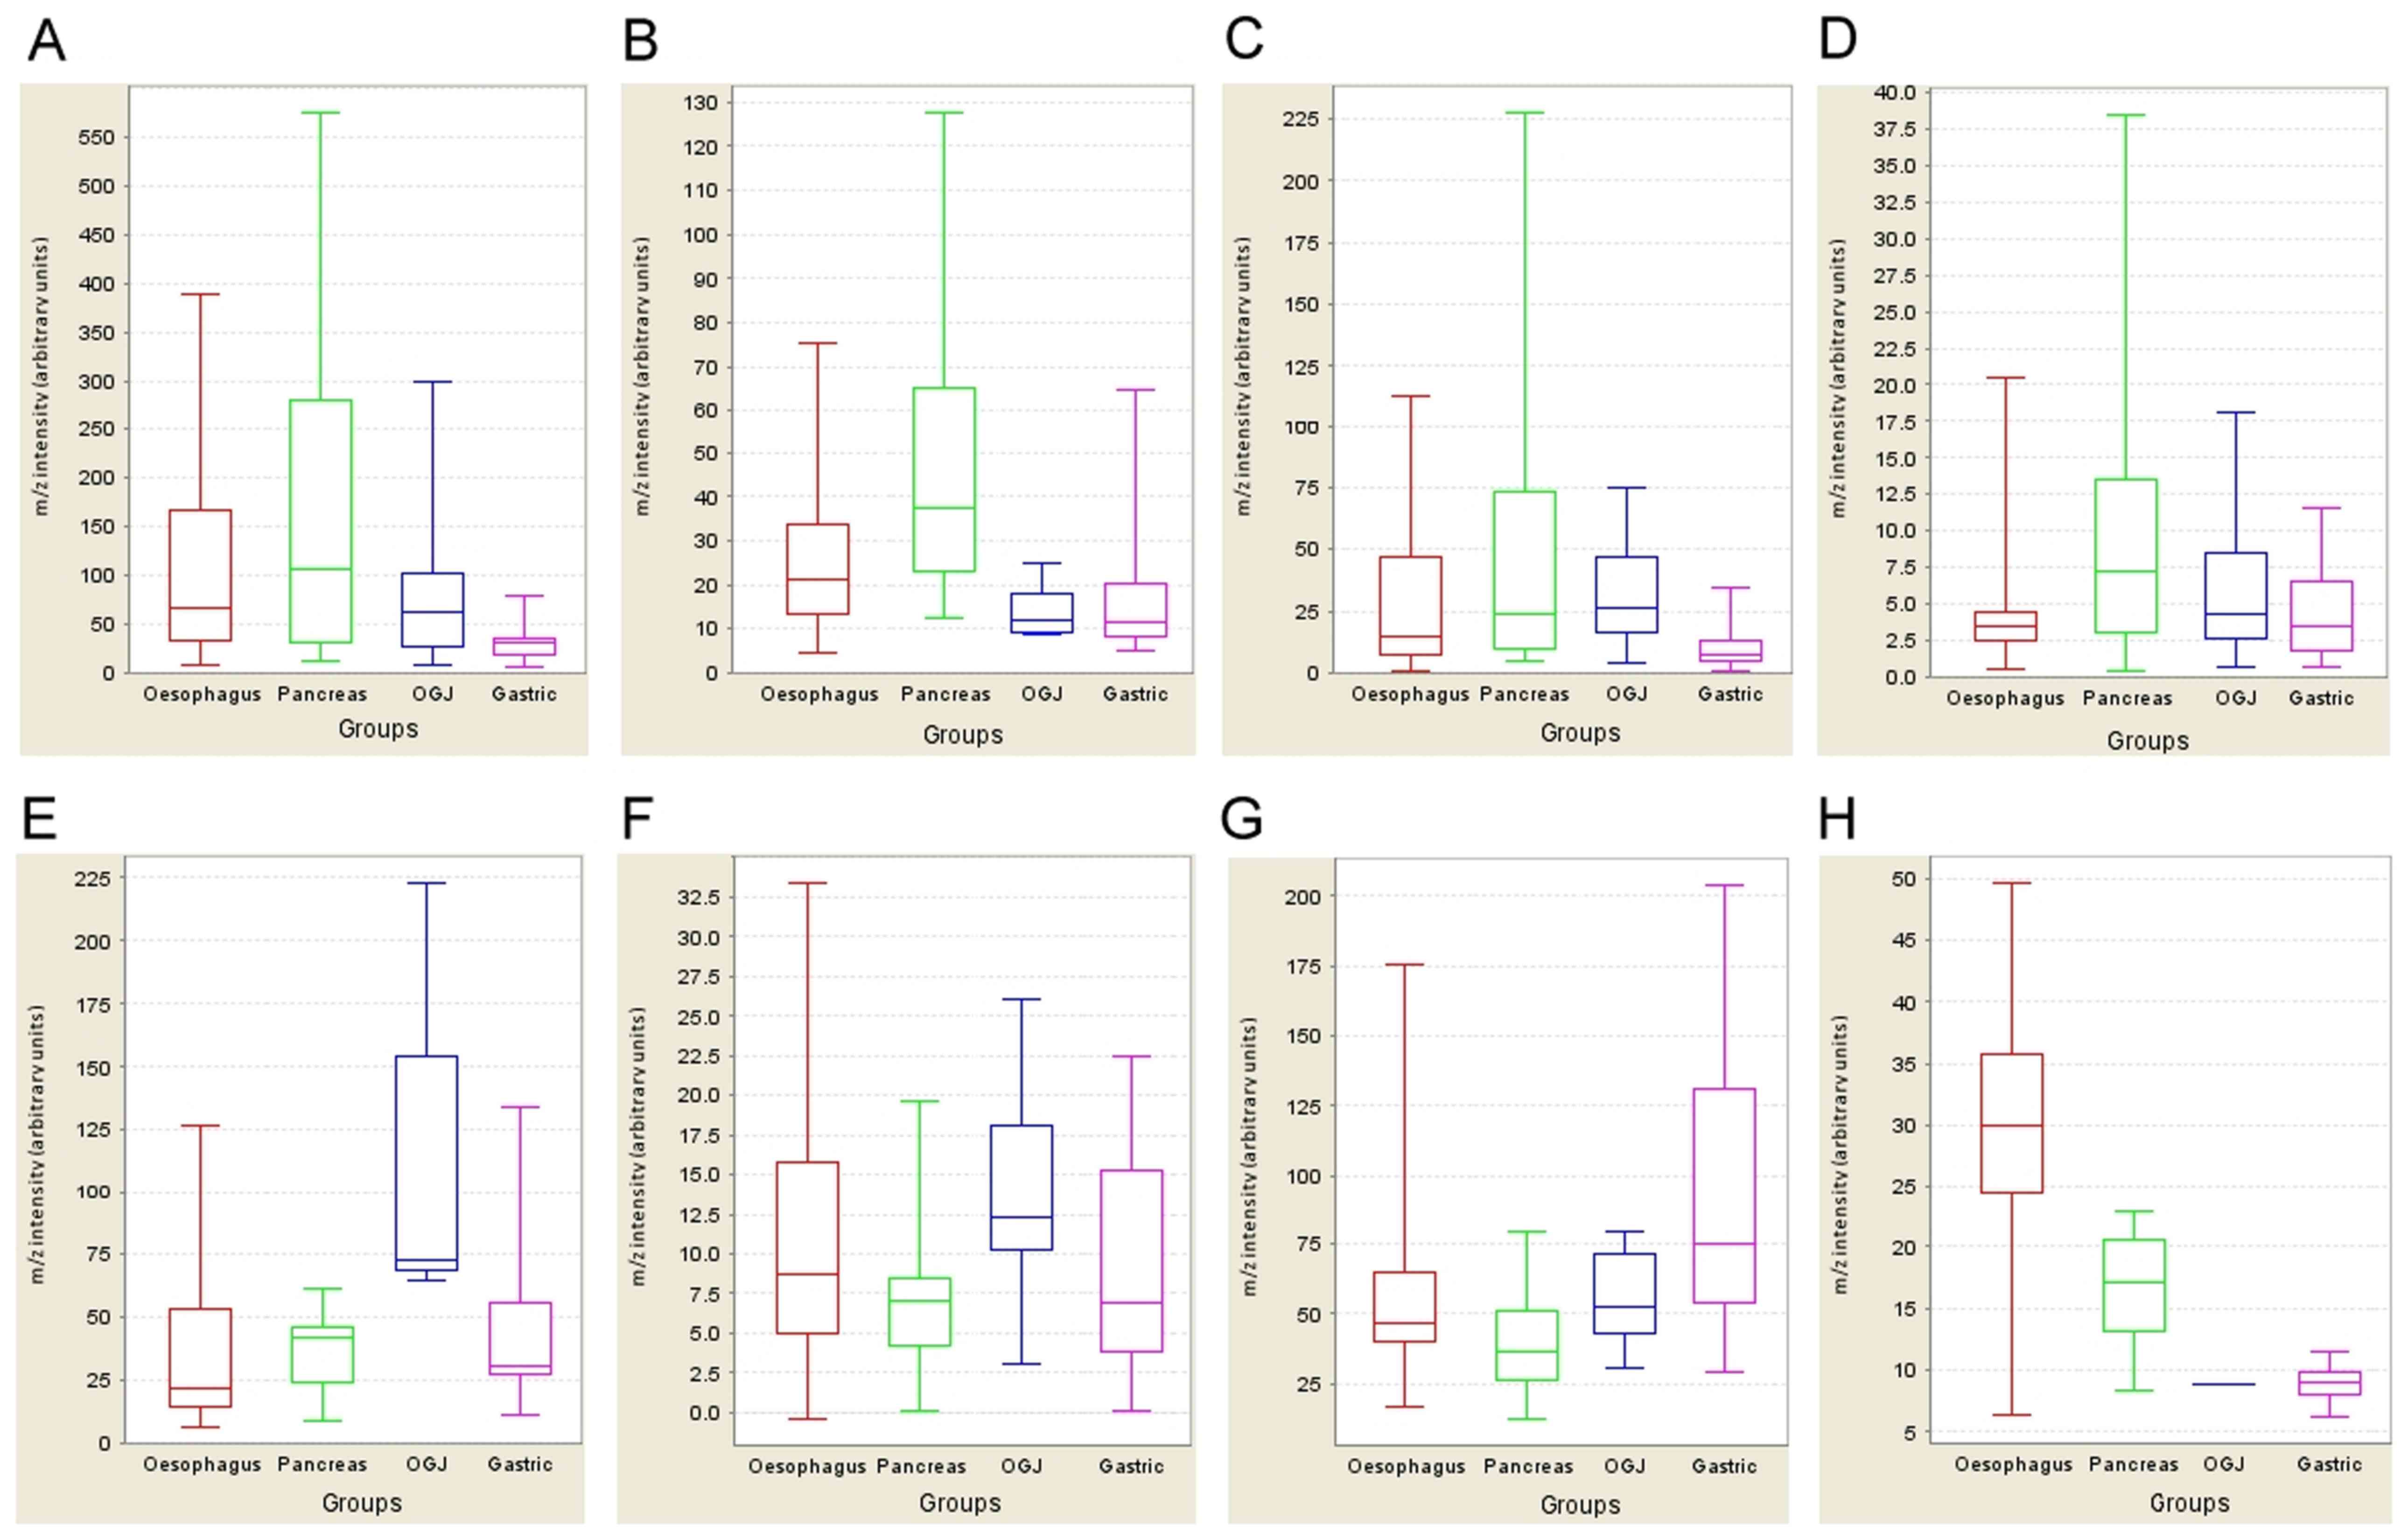 | Figure 1.Expression profiling of potential
biomarkers. The expression profiles of six potential markers
specific for the four cancer types are displayed as whisker plots
(median, lower and upper quartile and upper and lower extreme
values). The x-axis contains the categorical variable representing
four cancer types [oesophageal (red), pancreas (green), OGJ (blue)
and gastric (pink)], while the y-axis shows the normalised m/z
intensity (arbitrary units). [(A) (m/z 2444), (B) (m/z 2577), (E)
(m/z 5511), (G) (m/z 4639)] are derived from the IMAC30 chip type,
and [(C) (m/z 2447), (D) (m/z 9618), (F) (m/z 4908), (H) (m/z
4141)] from the CM10 chip type (see Table II for m/z and
fold-change descriptions for panels A-H). (A-D) Potential
pancreatic tumour markers; (E and F) OGJ marker; (G) gastric cancer
marker; (H) oesophageal cancer marker. OGJ, oesophagogastric
junction. |
| Table II.Summary of potential lead candidates
for specific cancer types. |
Table II.
Summary of potential lead candidates
for specific cancer types.
| Figure 1 panel | Chip | m/z | Cancer | P-value | Fold-change | Sensitivity | Specificity | SELDI normalized
intensity cut-off value | Frequency % found
in a specific cancer | Frequency % found
in other cancers | Frequency % found
in non-cancer controls |
|---|
| A | IMAC | 2444 | Pancreatic | 0.04 | 1.5 | 54 | 76 | 80.262 | 93 | 84 | 78 |
| B | IMAC | 2577 | Pancreatic | 0.0007 | 1.9 | 86 | 44 | 22.277 | 79 | 62 | 10 |
| C | CM | 2447 | Pancreatic | 0.01 | 2.1 | 100 | 15 | 4.832 | 82 | 71 | 70 |
| D | CM | 9618 | Pancreatic | 0.029 | 1.5 | 61 | 82 | 5.970 | 61 | 29 | 31 |
| E | IMAC | 5511 | OGJ | 0.01 | 2.5 | 38 | 94 | 63.169 | 38 | 54 | 23 |
| F | CM | 4908 | OGJ | 0.027 | 1.2 | 92 | 66 | 9.943 | 15 | 21 | 19 |
| G | IMAC | 4639 | Gastric | 0.02 | 1.5 | 87 | 54 | 52.876 | 67 | 82 | 32 |
| H | CM | 4141 | Oesophageal | 0.02 | 1.8 | 19 | 100 | 25.806 | 26 | 29 | 24 |
We then endeavoured to identify the molecular
identity of the m/z 2447 peak, since it showed the highest
sensitivity of 100% in the detection of pancreatic cancer. This was
performed by selecting 8 samples, of which 4 either contained the
cluster peak at m/z 2447, or did not show the peak according to the
SELDI-TOF scans. The samples were individually batch-absorbed on CM
resin; bands in the 2-4 kDa range were excised after peptide gel
electrophoresis and processed as described previously (17). The molecular cluster of interest was
shown to consist of fragments from CTSB, α-1-antichymotrypsin
precursor and immunoglobulin γ and κ chains (Table III). The same
result was obtained using an independent approach, as described
below.
We then analysed the molecular constituents of human
cancer patient urine in the 2-10 kDa molecular weight range using
chromatographic protein and peptide enrichment on CM10 and IMAC30
resins, followed by gel separation, trypsin digestion and LC-MS/MS
fragmentation, as before. Samples were selected based on the
SELDI-TOF analysis results to either contain the 8 m/z peaks of
interest (50% of samples per subset) or not in subsets of groups of
16 samples each. This resulted in the analysis of 145 urine
samples, including repeats, from 62 upper GI cancer patients, of
which 42 unique patient urines were enriched on CM10, and 40 unique
patient samples on IMAC30 chromatography resins. 950 non-redundant
proteins were identified in the CM10 resin-based approach by Mascot
searching, and 600 unique proteins could be observed in the
IMAC30-based enrichment, totalling 1,228 unique and non-redundant
proteins in the combined datasets (Table SIV). Protein expression pattern
matching (i.e., molecules identified by LC-MS/MS and Mascot
searching, and matching to peak expression patterns observed by
SELDI-MS) was performed by using an automated computer program
written in-house based on the filtered Mascot dataset, where each
individual identification was based on Mascot scores >16 and
consisting of at least 2 peptides each. All proteins were
identified in at least three independent samples. Table III lists all found by this approach,
including a list of publications describing the relevance of these
molecules in tumour growth. A fully detailed list of these
molecules, including peptide sequences, is supplied in Table SV.
| Table III.List of potential biomarkers
associated with specific cancer types. |
Table III.
List of potential biomarkers
associated with specific cancer types.
| m/z peak | Chip type | Cancer type | Protein ID | Protein name | Mass (kDa) | Mascot score | Mean number of
peptides | Mean emPAI | % sequence
coverage | Expected % sequence
coverage | PMID | Pattern
matching | Mascot-SELDI
pattern matching score |
|---|
| 2444 | IMAC30 | Pancreatic | AACT_HUMAN |
α-1-antichymotrypsin precursor | 48 | 145 | 8.4 | 0.26 | 13.4 | 11.5 | 16212428,
15709178 | A | 56/75 |
| 2577 | IMAC30 | Pancreatic | CYTB_HUMAN | Cystatin-B | 11 | 77 | 7.4 | 1.57 | 41.7 | 50.0 | 18754876 | A | 50/100 |
| 2447 | CM10 | Pancreatic | CATB_HUMAN | Cathepsin B
precursor | 39 | 44 | 3.7 | 0.1 | 6.1 | 14.1 | 15367886,
11185708 | A, M | 50/100 |
| | | | IGHG1_HUMAN | Ig γ-1 chain C
region | 37 | 140 | 10.4 | 0.49 | 19.9 | 14.9 | 18615426,
20571237 | A, M | 50/100 |
| | | | KV203_HUMAN | Ig κ chain V-II
region MIL | 12 | 56 | 3.8 | 0.54 | 15.1 | 45.8 | 18615426,
20571237 | A, M | 50/100 |
| | | | AACT_HUMAN |
α-1-antichymotrypsin precursor | 48 | 56 | 8.4 | 0.26 | 13.4 | 11.5 | 16212428,
15709178 | A, M | 50/100 |
| 9618 | CM10 | Pancreatic | KV304_HUMAN | Ig κ chain V-III
region Ti | 12 | 117 | 5.7 | 0.83 | 38.9 | 45.8 | 18615426,
20571237 | A | 61/63 |
| 5511 | IMAC30 | OGJ | PDC6I_HUMAN | Programmed cell
death 6-interacting protein | 97 | 29 | 31 | 0.04 | 6 | 5.7 | 11683497 | A | 75/100 |
| 4908 | CM10 | OGJ | VMO1_HUMAN | Vitelline membrane
outer layer protein 1 homolog precursor | 22 | 101 | 5.6 | 0.39 | 21.4 | 25.0 | | A | 71/82 |
| | | | TPIS_HUMAN | Triosephosphate
isomerase | 27 | 222 | 9.2 | 0.86 | 24.1 | 20.4 | 18813785,
17884789 | A | 71/76 |
| 4639 | IMAC30 | Gastric | AACT_HUMAN |
α-1-antichymotrypsin precursor | 48 | 145 | 8.4 | 0.26 | 13.4 | 11.5 | 12094386 | A | 57/66 |
| 4141 | CM10 | Oesophageal | CO4A_HUMAN | Complement C4-A
precursor | 194 | 81 | 6.3 | 0.05 | 3.0 | 2.8 | 20116351 | A | 71/84 |
| | | | PPAP_HUMAN | Prostatic acid
phosphatase precursor | 45 | 44 | 3.3 | 0.08 | 7.1 | 12.2 | 20645695 | A | 42/100 |
| | | | CAP7_HUMAN | Azurocidin
precursor | 27 | 43 | 2.7 | 0.14 | 10 | 20.4 | 15473694 | A | 42/96 |
| | | | H12_HUMAN,
H13_HUMAN, H14_HUMAN | Histone H1.2, H1.3,
H1.4 | 22 | 54 | 8.4 | 0.38 | 18.5 | 25.0 | 18166788 | A | 42/96 |
The m/z 2444 peak observed in pancreatic cancer
using the IMAC30 chromatography resin, as well as the pancreatic
cancer-associated m/z 2447 peak in the CM10 dataset, matched the
expression pattern of α-1-antichymotrypsin (SERPINA3 or AACT). The
same molecule, although a different proteolytic fragment of m/z
4639, could also be a potential biomarker for gastric cancer. A
fragment of CSTB matched the observed pancreatic marker of m/z 2577
in the IMAC30 resin type-derived dataset, and other potential
pancreatic markers of m/z 2477 and 9618 matched the presence of
peptides from immunoglobulins. The m/z 2477 cluster distribution
pattern also coincides with the measured expression pattern of
CTSB.
Potential biomarkers for OGJ tumours include
programmed cell death 6-interacting protein (PDCD6IP), matching the
observed pattern of m/z 5511 in the IMAC30 resin dataset, vitelline
membrane outer layer protein 1 homolog (VMO1) and triosephosphate
isomerase (TPI1), which matched the m/z 4908 peak pattern in
SELDI-TOF-MS measurements. The m/z 4141 clustered peak in the CM10
enriched dataset, which may be indicative of oesophageal cancer,
matched the LC-MS/MS observed expression pattern of several
molecules, namely complement C4-A (C4A), prostatic acid phosphatase
(ACPP), azurocidin (AZU1) and histone H1.2, H1.3 or H1.4.
Both CTSB and CSTB were also cross-validated by
western blot analysis (Fig. 2), and
both molecules exhibited a very good correlation to the expected
cluster-peak pattern observed by SELDI analysis, thereby validating
both the predictor model and the Mascot identification, as well as
the SELDI peak clustering of these molecules, and may represent
viable prognostic biomarkers for pancreatic cancer.
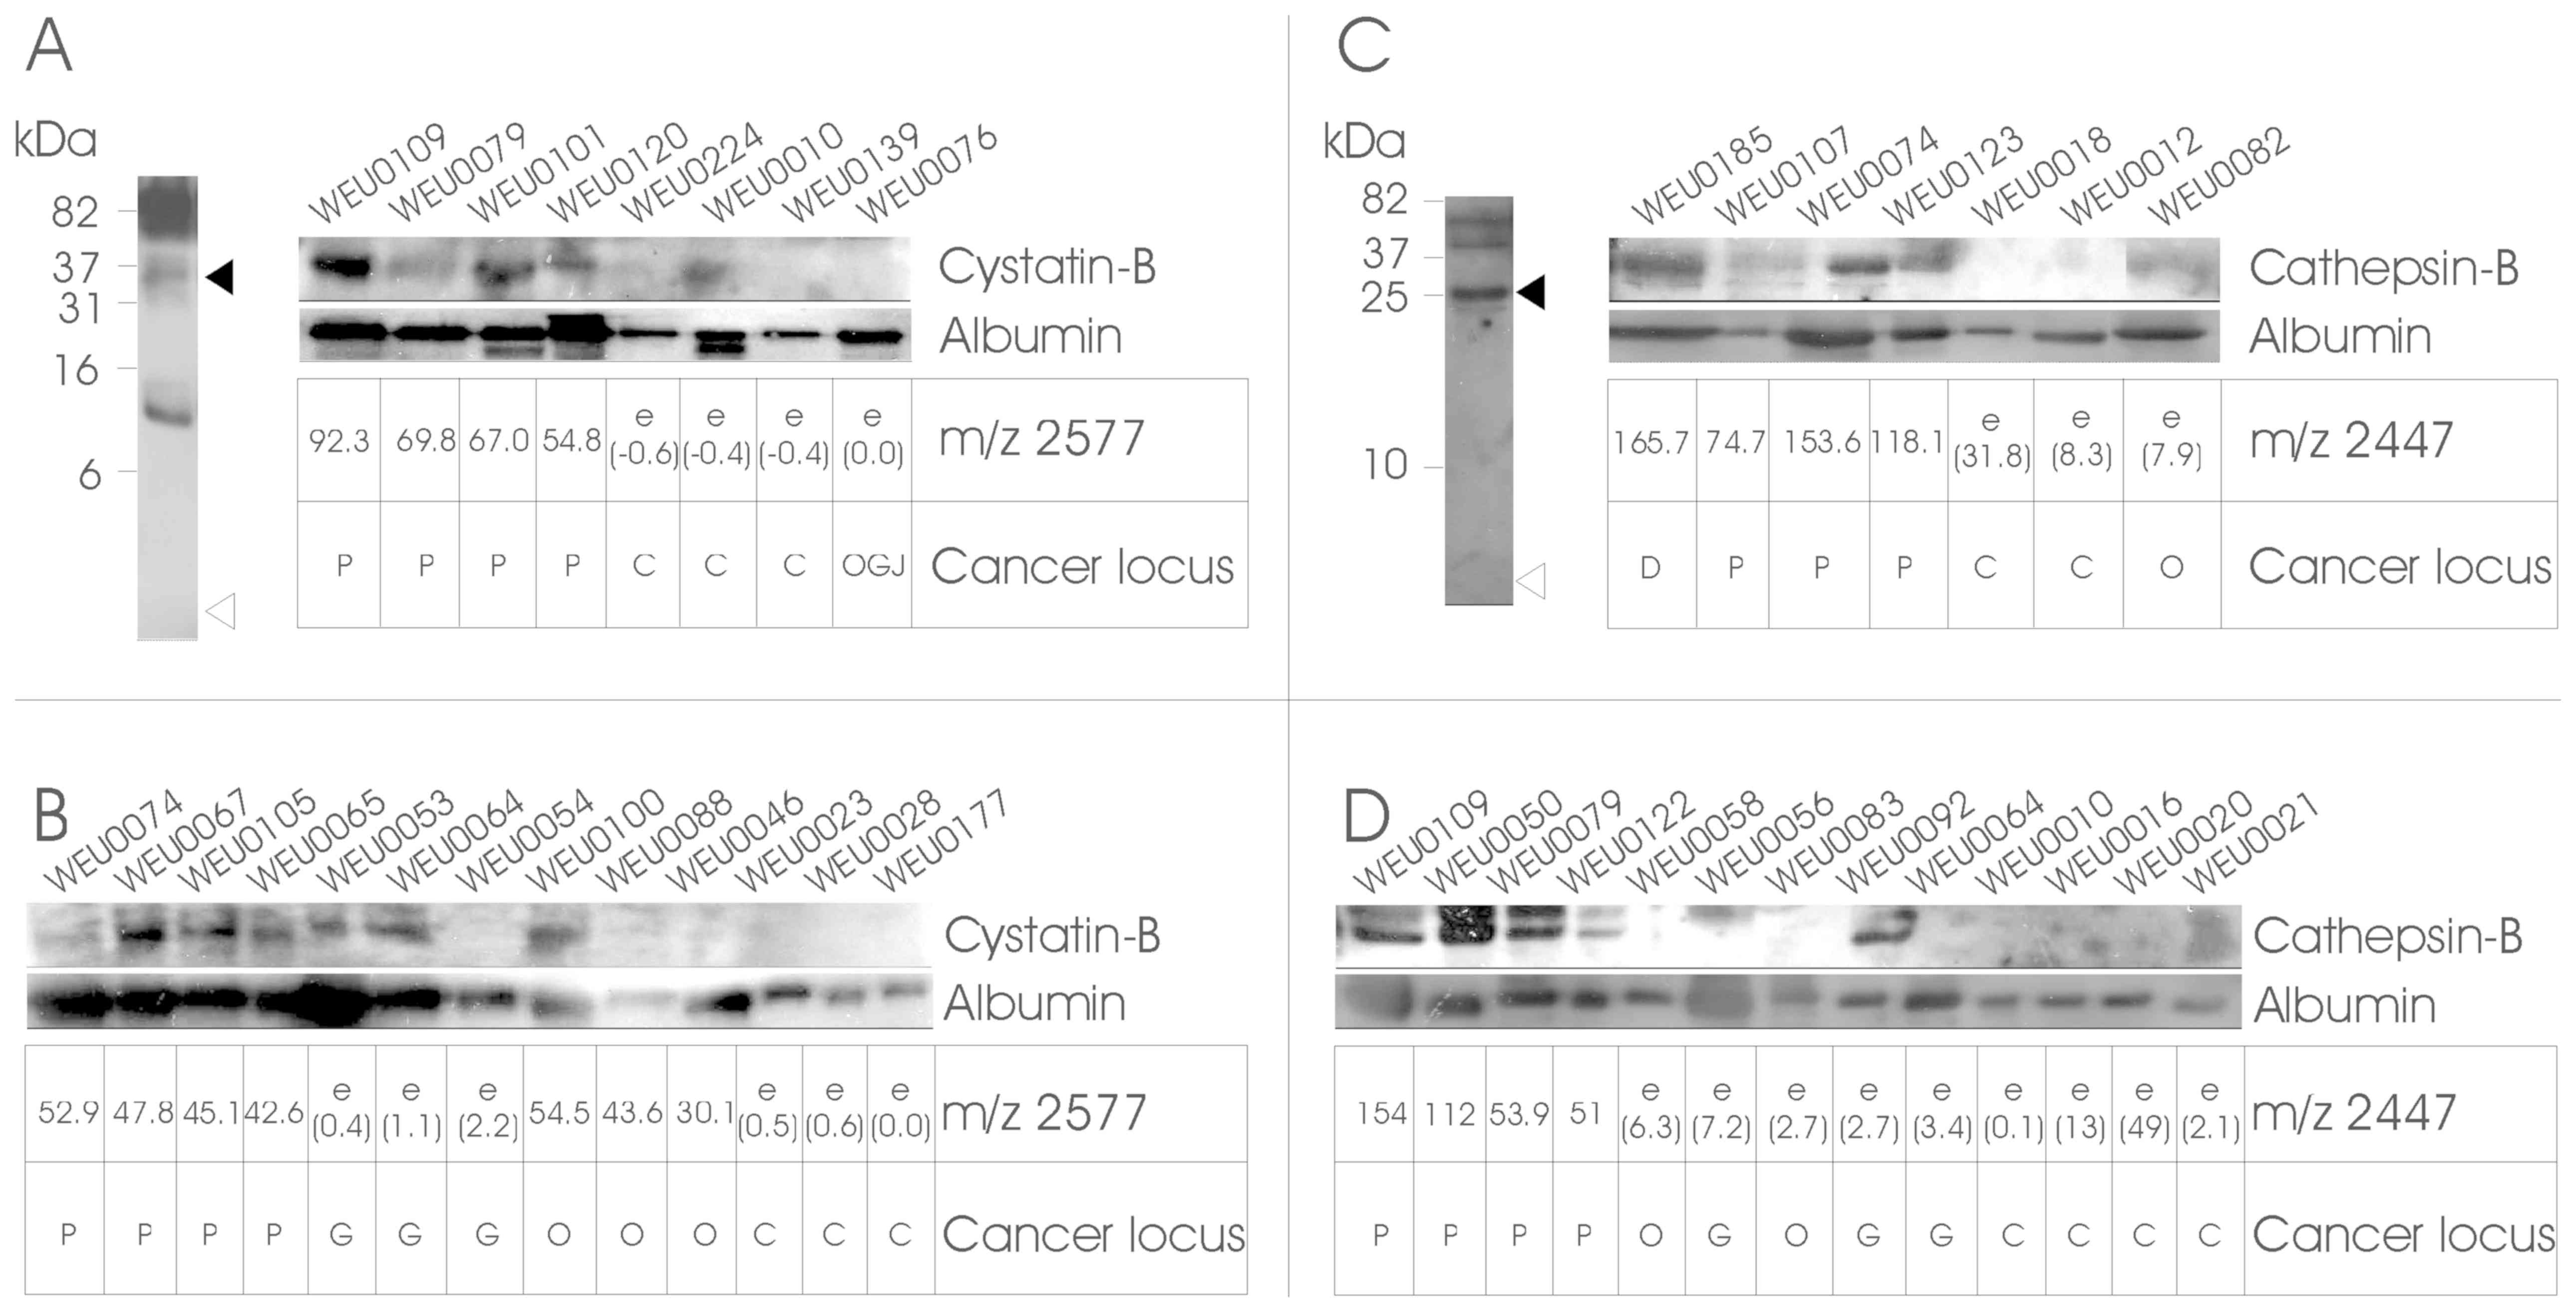 | Figure 2.Validation of identified proteins by
western blotting. Urine samples were separated by 20% SDS-PAGE and
analysed by western blotting using antibodies specific against
CSTB, CTSB and albumin. Panels (A) and (C) (left) show the western
blotting results of combined urine samples in the 1-100-kDa range.
The samples were tested initially for the presence of fragments of
CSTB and CTSB in the region of the measured m/z (open triangles),
as well as full-length molecules (filled triangles) or other
breakdown products. Reliable signals in the 35-kDa range for CSTB
and 25-kDa for CTSB were then further analysed. Validation and
confirmation of LC-MS/MS and Mascot results are shown in the
strip-blots in panels (A) and (C), which show the results of (A) 8
or (C) 7 urine samples that were used in LC-MS/MS and subsequent
Mascot searches, together with the cluster peak intensity matrices
derived from the SELDI analysis (underneath the individual blots).
Panels (B) and (D) depict the analysis of four random cancer and
four control samples. The samples were selected based on the IMAC30
SELDI analysis for the presence of a peak cluster at m/z 2577 for
CSTB, and on the CM10 SELDI peak pattern at m/z 2447 for CTSB
(cancer samples) or the absence of these m/z peaks (healthy
controls). ‘e’ corresponds to an estimated value (in brackets),
where no peak at the m/z point could be detected above the S/N
ratio. Qualitative loading control was performed by probing against
the common urinary molecule serum albumin. Molecular weight
indicators are depicted on the left, and the target proteins on the
right of the blots. The cancer locus is the histologically assessed
cancer site of duodenum (D), pancreas (P), oesophagogstric junction
(OGJ), oesophagus (O), or non-cancerous control (C). CTSB,
cathepsin-B; CSTB, cystatin-B; SELDI, surface-enhanced laser
desorption/ionization; MS, mass spectrometry; S/N, signal-to-noise
ratio. |
Development of a cancer profiling
database
Over the last decade, the emergence of
high-throughput screening platforms opened the possibility to
mechanistically characterize at the molecular level disease
phenotypes, disease subtypes, assess disease progression and
monitor response to therapy. However, despite a crescendo in the
availability of these large-scale multi-omics data for numerous
conditions, no apparent or adequate effort has been made to curate
and integrate those data resources.
Therefore, large-scale multi-omics data handling
differential expression of several molecular entities, for example,
microRNA, gene, protein and metabolite across multiple tissues and
biological fluids in several cancer types (with special emphasis on
GI neoplasms) were collected from the literature and general scope
databases, and subjected to extensive manual curation and
annotation. This effort yielded a cancer profiling database: the
Multi-Omics Cancer database MoCadb (www.padb.org/mocadb), a database module of the
Pan-Omics Analysis Database (PADB) (www.PADB.org) which
ensures a long-term lifecycle of the created repository, along with
providing the appropriate framework that encloses curated
resources, in order to assist in the development of integrative
-omics disease models, straightforward translation of findings from
experimental animal models using established ortholog maps,
creation of cellular regulatory networks based on the association
of miRNAs and transcription factors to targets, protein-protein and
gene-gene interactions, enzymatic reactions, delineation of
pathways and drug interactions.
MoCadb aims to incorporate existing molecular
information and clinical metadata, ultimately holding the potential
to unravel and allow an in-depth understanding of the regulation of
key molecules modulating pathophysiology and progression in several
cancer types.
Discussion
The identification of potential novel biomarkers for
ailments such as pancreatic cancer is of utmost importance,
particularly in light of the shortcomings of the markers currently
used in the clinical setting for diagnosis and disease progression
monitoring. As an example, in a retrospective study, cohort
screening using a bead-based antibody array of a multi-parametric
signature of three serum biomarkers, namely CA19.9, intercellular
adhesion molecules 1 and osteoprotegerin, were able to distinguish
patients with pancreatic ductal adenocarcinoma (PDAC) from healthy
subjects, with a sensitivity/specificity of 88/90% and an area
under the curve (AUC) of 0.93(38).
However, in a follow-up study using a larger prospective cohort,
the latter biomarker panel and the respective AUCs associated with
the biomarker model were not statistically different, thereby
failing to distinguish PDAC cases from matched controls (39). This highlights the current issues and
challenges associated with biomarker research in pre-diagnostic
risk assessment of pancreatic cancer.
We selected an MS-based proteomic screening of urine
from upper GI cancer patients for prospective biomarkers for the
four most prominent cancer types associated with the upper GI to
establish a proteomic fingerprint pattern, as well as defined
molecular markers, which can potentially be used in clinical
diagnostics. In the clinical setting, urine is an optimal sample
source, as it is easy to obtain, the collection is non-invasive,
and is relatively stable in terms of sample integrity. A
substantial number of previous studies have found the SELDI-TOF-MS
technique ideally suited for urine analysis, with a combination of
high throughput, speed and relatively low cost (40-42).
However, a main drawback of this technique is the comparatively
medium resolution of the spectra obtained, but this is adequate to
resolve peaks in the 1-25-kDa range from spectra with #x003C;500
peaks. We have previously demonstrated that both IMAC30 and CM10
are useful chip types for the analysis of human urine (17), and we were able to generate a
decision-tree model for upper GI cancer with an overall sensitivity
of 98% and a specificity of 87%. In the present study, we
identified 8 peak clusters by SELDI-TOF-MS for the four cancer
types studied and, using expression pattern matching, we were able
to assign several proteins identified in the urine to our proposed
biomarkers.
An elevated amount of SERPINA3 may be associated
with both gastric and pancreatic cancer, and has also been reported
as a potential urinary biomarker in non-small-cell lung cancer
(43). SERPINA3 is a protease
inhibitor that can modulate cathepsin G (44), and its glycosylated form is directly
associated with colorectal cancer (45). This protein was already known to be
associated with pancreatic cancer and could be detected in higher
levels in the plasma (46,47). Furthermore, this marker was
specifically negatively correlated with survival in patients with
advanced pancreatic cancer (48).
However, it is also worth noting that several different fragments
from the same molecule were observed in our SELDI-TOF experiments,
namely m/z 2444, 2447 and 4639, of which the latter is specific for
gastric cancer. Additionally, we also identified the same molecule
in our upper GI cancer screen (17)
as m/z 8803. It is possible that a specific proteolytic fragment of
SERPINA3 is associated with and generated in a specific type of
cancer, where the m/z 8803 fragment may be generic for upper GI
cancer and the small fragments specific to pancreatic cancer. This
is further substantiated by our observation that the protease CTSB
is also a potential biomarker for pancreatic cancer. Additionally,
CTSB was validated as a potential urinary biomarker in pancreatic
carcinoma by western blotting. Furthermore, CTSB was reported to be
a prognostic marker in pancreatic adenocarcinoma (49), which confirms our findings for this
molecule and its potential as a lead marker in pancreatic cancer
diagnostics. Another promising candidate as a pancreatic cancer
biomarker was identified and verified as CSTB. The cysteine
protease inhibitor CSTB was described as a protein that is able to
stimulate cancer cell growth in vitro and in vivo
(50). Other potential pancreatic
cancer markers identified in this study comprise fragments of
immunoglobulins. The occurrence of specific fragments of antibodies
may be associated with the increased amounts of CTSB, or may be due
to a host response to pancreatic tumour growth. Antibodies are also
well-described and used in the clinical setting to assess various
cancer types (e.g., CA19-9 in pancreatic cancer) (9,10).
Stratification of OGJ cancer cases by SELDI-TOF-MS
revealed two potential m/z peak clusters, m/z 4908 and 5511. The
latter peak cluster was identified to be a fragment of PDCD6IP
(also referred to as AIP1 or ALIX), which has been described to
participate in programmed cell death, and it was reported that its
overexpression can block apoptosis (51). The m/z 4908 peak cluster consists of
fragments from VMO1 and TPI. No role of VMO1 has been implicated in
cancer, and this may be a novel target for OGJ cancer, whereas TPI
was described in the literature to be upregulated in oesophageal
cancer (52), as well as in
hepatocellular carcinoma (53).
The oesophageal cancer marker of m/z 4141 appears to
contain several molecular constituents, namely C4A, ACPP, AZU1 and
fragments from Histone H1. C4A is an important component in the
activation of the classical pathway of the complement system and
proteolytic breakdown products of C4-A have been suggested as
biomarkers in breast cancer (54),
although a specific proteolytic product, C4a anaphylatoxin, is a
mediator of local inflammatory processes (55). This protein is therefore potentially
unsuitable as a diagnostic marker in oesophageal cancer. ACPP, a
non-specific tyrosine phosphatase, is well-described to be
associated with prostate cancer (56), and is used clinically as a diagnostic
marker. AZU1, an antibacterial and monocyte- and
fibroblast-specific chemotactic glycoprotein, which acts in
conjunction with cathepsin G in host-defense mechanisms (57), was hypothesized to be a potential
pancreatic cancer biomarker in the pancreatic juice (58). Histones H1 have been reported to be
involved in the survival of breast cancer cells (59), and H1.2 specifically was identified as
an apoptogenic factor (60).
In conclusion, the approach of using SELDI-MS to
identify potential lead candidates as biomarkers associated with
specific upper GI cancers is a useful tool that enabled us to
identify potential global upper GI cancer markers, as well as
potentially specific markers for individual cancer types, such as
gastric, pancreatic, OGJ and oesophageal cancer. CSTB and CTSB, in
particular, appear to be promising lead candidates, since these
molecules are not commonly found in the urine, and have already
been associated with pancreatic cancer in situ in the
literature (61-63).
Other potential lead markers may require further validation, such
as western blotting and, ultimately, exact determination of the
sensitivity/specificity values of our novel proposed markers
associated with specific disease states and their usefulness in a
more general setting. Further studies, including an extended
cohort, will help determine the validity of our findings, and
specific assays monitoring the expression levels of our proposed
biomarkers will help to translate our findings into the clinical
setting. One of the main hurdles to overcome is a
methodological/technical dependency, such as the use of the SELDI
technology, which is not straightforward to translate into a
clinical environment. A more appropriate approach would rely on
techniques that are commonly in use, such as specific protein
detection methods. Additional investigations are needed to explain
the biological involvement of the proposed biomarkers in tissue
type-specific cancers and their presence in the urine. To aid in
this task, and to add a higher level of contextualisation of
individual markers or a panel of biomolecules, information held in
our MoCadb database, and in other databases within the PADB
initiative, can guide the biomarker identification process. Future
expansion of this resource, by also incorporating large-scale
datasets derived from other cancer tissue type studies, will allow
us to not only investigate the biological relevance, importance and
usefulness of individual biomolecules, but also to identify
potential intervention points or markers of high
prognostic/diagnostic value prior to evaluation and validation in
patient cohorts. Potential applications of such findings will most
likely include the use of multiplexed platforms, since it was shown
that integrating various molecule types, such as proteins and miRs,
can exert a beneficial effect on overall sensitivity and
specificity of a bioassay for pancreatic cancer (64). However, this also emphasises that
further study is required to use novel approaches and may lead to
better outcomes in patient stratification and disease
treatment.
Supplementary Material
Demographics
Peak list
clustered peaks
LC-MSMS identified proteins
protein matches
Acknowledgements
The authors would like to thank N.A. Stephens for
patient recruitment and J. Black for technical assistance in
western blotting.
Funding
The present study was supported by the University of
Edinburgh and the European Union's Seventh Framework Programme
FP7/2007-2013 under grant agreement FP7-PEOPLE-2013-ITN-608332.
Authors' contributions
HH performed the sample preparations, SELDI
measurements, data analysis, Mascot searches, software design and
coding, and wrote the manuscript; ADC performed the LC-MS/MS
measurements; MF co-wrote the manuscript and developed MoCadb; RJS
and JM co-wrote the manuscript; JAR and KCHF supervised the
research.
Availability of data and materials
All the datasets generated and analysed in the
present study are included in this published manuscript.
Ethics approval and consent to
participate
All procedures were approved by the local research
ethics committee and written informed consent was obtained from the
patients. The study conformed to the standards set by the
Declaration of Helsinki.
Patient consent for publication
Not applicable.
Competing interests
The authors declare that they have no competing
interests.
References
|
1
|
Ajani JA, D'Amico TA, Almhanna K, Bentrem
DJ, Besh S, Chao J, Das P, Denlinger C, Fanta P, Fuchs CS, et al:
National comprehensive cancer network: Esophageal and
esophagogastric junction cancers, version 1.2015. J Natl Compr Canc
Netw. 13:194–227. 2015.PubMed/NCBI View Article : Google Scholar
|
|
2
|
Fitzmaurice C, Dicker D, Pain A, Hamavid
H, Moradi-Lakeh M, MacIntyre MF, Allen C, Hansen G, Woodbrook R,
Wolfe C, et al: Global Burden of Disease Cancer Collaboration: The
Global Burden of Cancer 2013. JAMA Oncol. 1:505–527.
2015.PubMed/NCBI View Article : Google Scholar
|
|
3
|
De Angelis R, Sant M, Coleman MP,
Francisci S, Baili P, Pierannunzio D, Trama A, Visser O, Brenner H,
Ardanaz E, et al: EUROCARE-5 Working Group: Cancer survival in
Europe 1999-2007 by country and age: Results of EUROCARE--5-a
population-based study. Lancet Oncol. 15:23–34. 2014.PubMed/NCBI View Article : Google Scholar
|
|
4
|
Lagergren J, Smyth E, Cunningham D and
Lagergren P: Oesophageal cancer. Lancet. 390:2383–2396.
2017.PubMed/NCBI View Article : Google Scholar
|
|
5
|
Kamisawa T, Wood LD, Itoi T and Takaori K:
Pancreatic cancer. Lancet. 388:73–85. 2016.PubMed/NCBI View Article : Google Scholar
|
|
6
|
Kim MI: Surprised by tears. Christ Nurse
Int. 5:6–7. 1989.PubMed/NCBI
|
|
7
|
Grote T, Siwak DR, Fritsche HA, Joy C,
Mills GB, Simeone D, Whitcomb DC and Logsdon CD: Validation of
reverse phase protein array for practical screening of potential
biomarkers in serum and plasma: Accurate detection of CA19-9 levels
in pancreatic cancer. Proteomics. 8:3051–3060. 2008.PubMed/NCBI View Article : Google Scholar
|
|
8
|
Lee G, Ge B, Huang TK, Zheng G, Duan J and
Wang IH: Positive identification of CA215 pan cancer biomarker from
serum specimens of cancer patients. Cancer Biomark. 6:111–117.
2010.PubMed/NCBI View Article : Google Scholar
|
|
9
|
Lee G, Laflamme E, Chien CH and Ting HH:
Molecular identity of a pan cancer marker, CA215. Cancer Biol Ther.
7:2007–2014. 2008.PubMed/NCBI
|
|
10
|
Zhang S, Wang YM, Sun CD, Lu Y and Wu LQ:
Clinical value of serum CA19-9 levels in evaluating resectability
of pancreatic carcinoma. World J Gastroenterol. 14:3750–3753.
2008.PubMed/NCBI View Article : Google Scholar
|
|
11
|
Kim JE, Lee KT, Lee JK, Paik SW, Rhee JC
and Choi KW: Clinical usefulness of carbohydrate antigen 19-9 as a
screening test for pancreatic cancer in an asymptomatic population.
J Gastroenterol Hepatol. 19:182–186. 2004.PubMed/NCBI View Article : Google Scholar
|
|
12
|
Singh S, Tang SJ, Sreenarasimhaiah J, Lara
LF and Siddiqui A: The clinical utility and limitations of serum
carbohydrate antigen (CA19-9) as a diagnostic tool for pancreatic
cancer and cholangiocarcinoma. Dig Dis Sci. 56:2491–2496.
2011.PubMed/NCBI View Article : Google Scholar
|
|
13
|
Lee G: Cancer cell-expressed
immunoglobulins: CA215 as a pan cancer marker and its diagnostic
applications. Cancer Biomark. 5:137–142. 2009.PubMed/NCBI View Article : Google Scholar
|
|
14
|
Hao Y, Yu Y, Wang L, Yan M, Ji J, Qu Y,
Zhang J, Liu B and Zhu Z: IPO-38 is identified as a novel serum
biomarker of gastric cancer based on clinical proteomics
technology. J Proteome Res. 7:3668–3677. 2008.PubMed/NCBI View Article : Google Scholar
|
|
15
|
Hardt PD and Ewald N: Tumor M2 pyruvate
kinase: A tumor marker and its clinical application in
gastrointestinal malignancy. Expert Rev Mol Diagn. 8:579–585.
2008.PubMed/NCBI View Article : Google Scholar
|
|
16
|
Gaber A, Johansson M, Stenman UH,
Hotakainen K, Pontén F, Glimelius B, Bjartell A, Jirström K and
Birgisson H: High expression of tumour-associated trypsin inhibitor
correlates with liver metastasis and poor prognosis in colorectal
cancer. Br J Cancer. 100:1540–1548. 2009.PubMed/NCBI View Article : Google Scholar
|
|
17
|
Husi H, Stephens N, Cronshaw A, MacDonald
A, Gallagher I, Greig C, Fearon KC and Ross JA: Proteomic analysis
of urinary upper gastrointestinal cancer markers. Proteomics Clin
Appl. 5:289–299. 2011.PubMed/NCBI View Article : Google Scholar
|
|
18
|
Sofiadis A, Dinets A, Orre LM, Branca RM,
Juhlin CC, Foukakis T, Wallin G, Höög A, Hulchiy M, Zedenius J,
Larsson C and Lehtiö J: Proteomic study of thyroid tumors reveals
frequent up-regulation of the Ca2+ -binding protein
S100A6 in papillary thyroid carcinoma. Thyroid. 20:1067–1076.
2010.PubMed/NCBI View Article : Google Scholar
|
|
19
|
Wang XH, Zhang LH, Zhong XY, Xing XF, Liu
YQ, Niu ZJ, Peng Y, Du H, Zhang GG, Hu Y, et al: S100A6
overexpression is associated with poor prognosis and is
epigenetically up-regulated in gastric cancer. Am J Pathol.
177:586–597. 2010.PubMed/NCBI View Article : Google Scholar
|
|
20
|
Wei BR, Hoover SB, Ross MM, Zhou W, Meani
F, Edwards JB, Spehalski EI, Risinger JI, Alvord WG, Quiñones OA,
et al: Serum S100A6 concentration predicts peritoneal tumor burden
in mice with epithelial ovarian cancer and is associated with
advanced stage in patients. PLoS One. 4(e7670)2009.PubMed/NCBI View Article : Google Scholar
|
|
21
|
Hua Z, Chen J, Sun B, Zhao G, Zhang Y,
Fong Y, Jia Z and Yao L: Specific expression of osteopontin and
S100A6 in hepatocellular carcinoma. Surgery. 149:783–791.
2011.PubMed/NCBI View Article : Google Scholar
|
|
22
|
Komatsu K, Andoh A, Ishiguro S, Suzuki N,
Hunai H, Kobune-Fujiwara Y, Kameyama M, Miyoshi J, Akedo H and
Nakamura H: Increased expression of S100A6 (calcyclin), a
calcium-binding protein of the S100 family, in human colorectal
adenocarcinomas. Clin Cancer Res. 6:172–177. 2000.PubMed/NCBI
|
|
23
|
Sanders ME, Dias EC, Xu BJ, Mobley JA,
Billheimer D, Roder H, Grigorieva J, Dowsett M, Arteaga CL and
Caprioli RM: Differentiating proteomic biomarkers in breast cancer
by laser capture microdissection and MALDI MS. J Proteome Res.
7:1500–1507. 2008.PubMed/NCBI View Article : Google Scholar
|
|
24
|
Loos M, Bergmann F, Bauer A, Hoheisel JD,
Esposito I, Kleeff J, Schirmacher P, Büchler MW, Klöppel G and
Friess H: Solid type clear cell carcinoma of the pancreas:
differential diagnosis of an unusual case and review of the
literature. Virchows Archiv. 450:719–726. 2007.PubMed/NCBI View Article : Google Scholar
|
|
25
|
Fry LC, Mönkemüller K and Malfertheiner P:
Molecular markers of pancreatic cancer: Development and clinical
relevance. Langenbecks Arch Surg. 393:883–890. 2008.PubMed/NCBI View Article : Google Scholar
|
|
26
|
Ljungberg B: Prognostic markers in renal
cell carcinoma. Curr Opin Urol. 17:303–308. 2007.PubMed/NCBI View Article : Google Scholar
|
|
27
|
Higgins JP: Gene array studies in renal
neoplasia. ScientificWorldJournal. 6:502–511. 2006.PubMed/NCBI View Article : Google Scholar
|
|
28
|
Wang J, Chen J and Sen S: MicroRNA as
Biomarkers and Diagnostics. J Cell Physiol. 231:25–30.
2016.PubMed/NCBI View Article : Google Scholar
|
|
29
|
Lindner K, Haier J, Wang Z, Watson DI,
Hussey DJ and Hummel R: Circulating microRNAs: emerging biomarkers
for diagnosis and prognosis in patients with gastrointestinal
cancers. Clin Sci (Lond). 128:1–15. 2015.PubMed/NCBI View Article : Google Scholar
|
|
30
|
Schultz NA, Dehlendorff C, Jensen BV,
Bjerregaard JK, Nielsen KR, Bojesen SE, Calatayud D, Nielsen SE,
Yilmaz M, Holländer NH, et al: MicroRNA biomarkers in whole blood
for detection of pancreatic cancer. JAMA. 311:392–404.
2014.PubMed/NCBI View Article : Google Scholar
|
|
31
|
Bosco C, Wulaningsih W, Melvin J,
Santaolalla A, De Piano M, Arthur R and Van Hemelrijck M: Metabolic
serum biomarkers for the prediction of cancer: A follow-up of the
studies conducted in the Swedish AMORIS study.
Ecancermedicalscience. 9(555)2015.PubMed/NCBI View Article : Google Scholar
|
|
32
|
Xie G, Lu L, Qiu Y, Ni Q, Zhang W, Gao YT,
Risch HA, Yu H and Jia W: Plasma metabolite biomarkers for the
detection of pancreatic cancer. J Proteome Res. 14:1195–1202.
2015.PubMed/NCBI View Article : Google Scholar
|
|
33
|
Hirata Y, Kobayashi T, Nishiumi S,
Yamanaka K, Nakagawa T, Fujigaki S, Iemoto T, Kobayashi M, Okusaka
T, Nakamori S, et al: Identification of highly sensitive biomarkers
that can aid the early detection of pancreatic cancer using
GC/MS/MS-based targeted metabolomics. Clin Chim Acta. 468:98–104.
2017.PubMed/NCBI View Article : Google Scholar
|
|
34
|
Husi H, Skipworth RJ, Cronshaw A, Fearon
KC and Ross JA: Proteomic identification of potential cancer
markers in human urine using subtractive analysis. Int J Oncol.
48:1921–1932. 2016.PubMed/NCBI View Article : Google Scholar
|
|
35
|
Kalantari S, Jafari A, Moradpoor R,
Ghasemi E and Khalkhal E: Human Urine Proteomics: Analytical
Techniques and Clinical Applications in Renal Diseases. Int J
Proteomics. 2015(782798)2015.PubMed/NCBI View Article : Google Scholar
|
|
36
|
Wu J, Chen YD and Gu W: Urinary proteomics
as a novel tool for biomarker discovery in kidney diseases. J
Zhejiang Univ Sci B. 11:227–237. 2010.PubMed/NCBI View Article : Google Scholar
|
|
37
|
Husi H, Ward MA, Choudhary JS, Blackstock
WP and Grant SG: Proteomic analysis of NMDA receptor-adhesion
protein signaling complexes. Nat Neurosci. 3:661–669.
2000.PubMed/NCBI View
Article : Google Scholar
|
|
38
|
Brand RE, Nolen BM, Zeh HJ Allen PJ,
Eloubeidi MA, Goldberg M, Elton E, Arnoletti JP, Christein JD,
Vickers SM, et al: Serum biomarker panels for the detection of
pancreatic cancer. Clin Cancer Research. 17:805–816.
2011.PubMed/NCBI View Article : Google Scholar
|
|
39
|
Nolen BM, Brand RE, Prosser D,
Velikokhatnaya L, Allen PJ, Zeh HJ, Grizzle WE, Huang Y, Lomakin A
and Lokshin AE: Prediagnostic serum biomarkers as early detection
tools for pancreatic cancer in a large prospective cohort study.
PLoS One. 9(e94928)2014.PubMed/NCBI View Article : Google Scholar
|
|
40
|
Caffrey RE: A review of experimental
design best practices for proteomics based biomarker discovery:
Focus on SELDI-TOF. Methods Mol Biol. 641:167–183. 2010.PubMed/NCBI View Article : Google Scholar
|
|
41
|
Okamoto A, Yamamoto H, Imai A, Hatakeyama
S, Iwabuchi I, Yoneyama T, Hashimoto Y, Koie T, Kamimura N, Mori K,
et al: Protein profiling of post-prostatic massage urine specimens
by surface-enhanced laser desorption/ionization time-of-flight mass
spectrometry to discriminate between prostate cancer and benign
lesions. Oncol Rep. 21:73–79. 2009.PubMed/NCBI View Article : Google Scholar
|
|
42
|
Gagnon A, Shi Q and Ye B: Surface-enhanced
laser desorption/ionization mass spectrometry for protein and
Peptide profiling of body fluids. Methods Mol Biol. 441:41–56.
2008.PubMed/NCBI View Article : Google Scholar
|
|
43
|
Zhang Y, Li Y, Qiu F and Qiu Z:
Comparative analysis of the human urinary proteome by 1D SDS-PAGE
and chip-HPLC-MS/MS identification of the AACT putative urinary
biomarker. J Chromatogr B Analyt Technol Biomed Life Sci.
878:3395–3401. 2010.PubMed/NCBI View Article : Google Scholar
|
|
44
|
Rubin H, Wang ZM, Nickbarg EB, McLarney S,
Naidoo N, Schoenberger OL, Johnson JL and Cooperman BS: Cloning,
expression, purification, and biological activity of recombinant
native and variant human alpha 1-antichymotrypsins. J Biol Chem.
265:1199–1207. 1990.PubMed/NCBI
|
|
45
|
Pinczower GD, Williams RP, Gianello RD,
Robinson HC, Preston BN and Linnane AW: Characterisation of the
tumour-associated carbohydrate epitope recognised by monoclonal
antibody 4D3. Int J Cancer. 66:636–644. 1996.PubMed/NCBI View Article : Google Scholar
|
|
46
|
Koomen JM, Shih LN, Coombes KR, Li D, Xiao
LC, Fidler IJ, Abbruzzese JL and Kobayashi R: Plasma protein
profiling for diagnosis of pancreatic cancer reveals the presence
of host response proteins. Clin Cancer Res. 11:1110–1118.
2005.PubMed/NCBI
|
|
47
|
Yu KH, Rustgi AK and Blair IA:
Characterization of proteins in human pancreatic cancer serum using
differential gel electrophoresis and tandem mass spectrometry. J
Proteome Res. 4:1742–1751. 2005.PubMed/NCBI View Article : Google Scholar
|
|
48
|
Roberts AS, Campa MJ, Gottlin EB, Jiang C,
Owzar K, Kindler HL, Venook AP, Goldberg RM, O'Reilly EM and Patz
EF Jr: Identification of potential prognostic biomarkers in
patients with untreated, advanced pancreatic cancer from a phase 3
trial (Cancer and Leukemia Group B 80303). Cancer. 118:571–578.
2012.PubMed/NCBI View Article : Google Scholar
|
|
49
|
Niedergethmann M, Wostbrock B, Sturm JW,
Willeke F, Post S and Hildenbrand R: Prognostic impact of cysteine
proteases cathepsin B and cathepsin L in pancreatic adenocarcinoma.
Pancreas. 29:204–211. 2004.PubMed/NCBI
|
|
50
|
Hosokawa M, Kashiwaya K, Eguchi H,
Ohigashi H, Ishikawa O, Furihata M, Shinomura Y, Imai K, Nakamura Y
and Nakagawa H: Over-expression of cysteine proteinase inhibitor
cystatin 6 promotes pancreatic cancer growth. Cancer Sci.
99:1626–1632. 2008.PubMed/NCBI View Article : Google Scholar
|
|
51
|
Wu Y, Pan S, Che S, He G, Nelman-Gonzalez
M, Weil MM and Kuang J: Overexpression of Hp95 induces G1 phase
arrest in confluent HeLa cells. Differentiation. 67:139–153.
2001.PubMed/NCBI View Article : Google Scholar
|
|
52
|
Huang ZY, Xiong G, Zhang J and Wang WJ:
[Screening of differentially expressed proteins from human
esophageal cancer and esophageal tissues by two-dimensional
difference gel electrophoresis and mass spectrometry]. Nan Fang Yi
Ke Da Xue Xue Bao. 27:1406–1409. 2007.(In Chinese). PubMed/NCBI
|
|
53
|
Hamaguchi T, Iizuka N, Tsunedomi R,
Hamamoto Y, Miyamoto T, Iida M, Tokuhisa Y, Sakamoto K, Takashima
M, Tamesa T and Oka M: Glycolysis module activated by
hypoxia-inducible factor 1alpha is related to the aggressive
phenotype of hepatocellular carcinoma. Int J Oncol. 33:725–731.
2008.PubMed/NCBI View Article : Google Scholar
|
|
54
|
van den Broek I, Sparidans RW, Schellens
JH and Beijnen JH: Quantitative assay for six potential breast
cancer biomarker peptides in human serum by liquid chromatography
coupled to tandem mass spectrometry. J Chromatogr B Analyt Technol
Biomed Life Sci. 878:590–602. 2010.PubMed/NCBI View Article : Google Scholar
|
|
55
|
Hack CE, Nuijens JH, Felt-Bersma RJ,
Schreuder WO, Eerenberg-Belmer AJ, Paardekooper J, Bronsveld W and
Thijs LG: Elevated plasma levels of the anaphylatoxins C3a and C4a
are associated with a fatal outcome in sepsis. Am J Med. 86:20–26.
1989.PubMed/NCBI View Article : Google Scholar
|
|
56
|
Hassan MI, Aijaz A and Ahmad F: Structural
and functional analysis of human prostatic acid phosphatase. Expert
Rev Anticancer Ther. 10:1055–1068. 2010.PubMed/NCBI View Article : Google Scholar
|
|
57
|
Miyasaki KT and Bodeau AL: Human
neutrophil azurocidin synergizes with leukocyte elastase and
cathepsin G in the killing of Capnocytophaga sputigena. Infect
Immun. 60:4973–4975. 1992.PubMed/NCBI
|
|
58
|
Grønborg M, Bunkenborg J, Kristiansen TZ,
Jensen ON, Yeo CJ, Hruban RH, Maitra A, Goggins MG and Pandey A:
Comprehensive proteomic analysis of human pancreatic juice. J
Proteome Res. 3:1042–1055. 2004.PubMed/NCBI View Article : Google Scholar
|
|
59
|
Sancho M, Diani E, Beato M and Jordan A:
Depletion of human histone H1 variants uncovers specific roles in
gene expression and cell growth. PLoS Genet.
4(e1000227)2008.PubMed/NCBI View Article : Google Scholar
|
|
60
|
Zong WX: Histone, H1.2: Another
housekeeping protein that kills. Cancer Biol Ther. 3:42–43.
2004.PubMed/NCBI
|
|
61
|
Chen S, Dong H, Yang S and Guo H:
Cathepsins in digestive cancers. Oncotarget. 8:41690–41700.
2017.PubMed/NCBI View Article : Google Scholar
|
|
62
|
Aggarwal N and Sloane BF: Cathepsin B:
Multiple roles in cancer. Proteomics Clin Appl. 8:427–437.
2014.PubMed/NCBI View Article : Google Scholar
|
|
63
|
Gondi CS and Rao JS: Cathepsin B as a
cancer target. Expert Opin Ther Targets. 17:281–291.
2013.PubMed/NCBI View Article : Google Scholar
|
|
64
|
Madhavan B, Yue S, Galli U, Rana S, Gross
W, Müller M, Giese NA, Kalthoff H, Becker T, Büchler MW and Zöller
M: Combined evaluation of a panel of protein and miRNA
serum-exosome biomarkers for pancreatic cancer diagnosis increases
sensitivity and specificity. Int J Cancer. 136:2616–2627.
2015.PubMed/NCBI View Article : Google Scholar
|


