Introduction
Iron, which is one of the most important essential
elements for the human organism, has a role as a co-factor in
several vital metabolic reactions. Iron deficiency is the most
commonly observed metabolic dysfunction, as iron is not only
associated with haemoglobin and myoglobin functions, but
simultaneously acts in various stages correlated with protection
and obtaining energy (1).
As well as iron deficiency, excessive iron in the
body is a base for metabolic impairments. The accumulation of iron
in tissues and organs throughout treatment in myelodysplastic
syndrome, and β thalassemia patients who require regular blood
transfusions, causes tissue damage (2). The iron accumulation observed in the
liver, myocardium, the pancreas, hypophysis and joints, is often
together with loss of organ function in advanced stages and leads
to life-threatening complications (3).
Various tests are currently used to show the amount
of body iron content, including invasive laboratory tests. As they
can be applied in the majority of centres and are relatively cheap,
the total blood count, serum iron concentration, total iron-binding
capacity (TIBC), transferrin saturation percentage (TS) and serum
ferritin level form the basis of these tests. Although their
clinical use remains limited, advanced tests showing iron
deficiency at a cellular level and serum-free transferrin receptor
level, which is not affected by the acute phase response, are used
for research. The best clinical test showing iron status is the
invasive method of bone marrow aspiration stained with Prussian
blue. In addition, there are other tests, including magnetic
resonance imaging and organ needle biopsy, which are used to show
iron accumulation in the organs (4).
Previous studies have shown that hair mineral
analysis can be used as a good marker of body mineral levels.
However, there are extremely limited studies associated with hair
iron concentration used as a marker of body iron content. The
limited number of studies has not shown a clear association and
have emphasized the requirement for more research.
In the present study, whether or not hair iron
concentration can be used as a marker of body iron content was
investigated. In this context, it was aimed to define the possible
association between blood parameters and hair iron concentration in
patient groups with different body iron contents.
Materials and methods
Study subjects
The study population comprised patients with iron
deficiency anaemia and transfusion-related anaemia that showed a
difference in body iron content, who were being followed up in the
Haematology Department of Internal Medicine at Erciyes University
Medical Faculty and Kayseri Training and Research Hospital
(Kayseri, Turkey) between September 2010 and October 2011. The
control group was formed of age and gender-matched subjects with no
history of underlying disease. The transfusion-related anaemia
group, with an excessive amount of body iron, comprised of 20
patients diagnosed with myelodysplastic syndrome or β thalassemia
from erythrocyte suspension of ≥30 units. The iron deficiency
anaemia group comprised of 25 patients and the control group
comprised of 21 healthy subjects were evaluated as within the
reference values of TS and ferritin levels. Any cases who were
pregnant; had a history of acute or chronic inflammatory disease,
malignant disease, infection or renal failure; had any underlying
disease, such as malabsorption syndrome, which affected serum iron
and ferritin levels; or any disease associated with the hair or
scalp that affected the hair iron concentration, were excluded from
the study.
Serum iron, TIBC, TS, ferritin and hair iron
concentration were examined in all the cases together with
haemoglobin, haematocrit and erythrocyte markers, such as mean
erythrocyte volume (MCV), mean erythrocyte haemoglobin (MCH), MCH
concentration (MCHC) and erythrocyte distribution width (RDW). TS
was calculated using the formula of serum iron / iron-binding
capacity × 100. The diagnosis of iron deficiency anaemia was made
according to the World Health Organization criteria (5). Haemoglobin was accepted as <13 g/dl in
males and <12 g/dl in females. Iron deficiency anaemia cases
were classified according to reference intervals, as serum iron
low, TIBC high; transferrin saturation <15% and serum ferritin
<15 ng/dl.
Blood sampling
Fasting blood samples were taken in the morning.
Full blood count was assayed using an automatic electronic full
blood count analyser (Siemens Advia 2120; Siemens Healthcare
Diagnostics, Deerfield, IL, USA), serum iron and iron-binding
capacity using a biochemical analyser (Siemens Advia 1800 Chemistry
System; Siemens Healthcare Diagnostics) and ferritin using a
hormone analyser ADVIA Centaur XP (Siemens Healthcare Diagnostics,
Deerfield, IL, USA).
Hair sampling
Prior to the hair sampling process, no history of
cosmetic hair application, such as lightening, dyeing or perm, was
found in any of the cases. The hair samples in the patient and
control groups were obtained with stainless steel scissors from the
occipital area as far as the proximal section. Each sample
collected was stored in an autosealable polythene bag and washed
sequentially with acetone, deionized water and acetone, using three
successive portions. Subsequently, the samples were dried in an
oven at 80˚C. Each hair sample, weighing 250 mg, was transferred
into a digestion vessel of 10 ml capacity and concentrated nitric
acid (5 ml) was pipetted into the vessel. The samples were diluted
with 65 % (v/v) nitric oxide in a microwave oven (Berghof
Speedwave, Eningen, Germany). Analytic techniques were applied with
Agilent 7500a Inductively Coupled Mass Spectrometer (Agilent
Technologies, Tokyo, Japan). Digestion solutions were diluted and
analyzed on an Agilent 7500a series ICP/MS. For the quality
control, the concentration of internal standards 200 ppb
(9Be,45Sc,103Rh,208Bi) and reference materials were run together
with the samples and before the analyses tune parameters were
cotrolled. To obtain the detection limit of each element the axis
cut point of the calibration line was used. It was also important
to ensure the linear rank of the methodology analyzing different
standards with low and high known concentrations of each element
(0, 1, 5, 10, 20, 30, 40 and 50 ppb). At least five different
reference materials covering all the elements in the study were
used. Duplicate samples were also used in order to determine
precision of the analysis. For the iron element a minimum of three
standards were used to cover the analytical working range of the
instrument. Ultrapure water was used to prepare calibration
standards and blanks, and three replicate determinations were
performed for each sample. From all the sample results, a reagent
blank was subtracted. Detection limits were calculated as three
times the standard deviation for the reagent blanks. LODs value (in
microgram per milliliter) was 0.0008 (Fe). Hair concentrations were
evaluated as micrograms per gram.
Statistical analysis
Data were analysed using SPSS v20 software
statistical program (IBM Corp, Armonk, NY, USA). In the evaluation
of statistical differences between groups of numerical values with
normal distribution, one-way analysis of variance was used. In the
statistical evaluation between groups of parameters such as age,
haemoglobin, MCV, MCH, MCHC, RDW, serum iron, hair iron levels and
TS, which did not return to normal distribution despite logarithmic
transformation, the Kruskal-Wallis test was used. In all the
statistical tests, a value of P<0.05 was considered to indicate
a statistically significant difference.
Results
Patient characteristics
The mean age was 33 (range, 14–48 years) in the iron
deficiency anaemia group, 22 (range, 15–75 years) in the
transfusion-related anaemia group and 28 (range, 13–42 years) in
the control group. The degree of statistical significance of these
findings together with the haematological and biochemical findings
of the cases is shown in Table I.
According to this, a statistically significant difference was found
between the groups in all parameters except for age (Table I).
 | Table I.Results of hair iron concentration and
laboratory tests of the groups. |
Table I.
Results of hair iron concentration and
laboratory tests of the groups.
| Parameters | Control | Iron deficiency
anaemia | Transfusion-related
anaemia | P-value |
|---|
| Age, years
(range)a | 28 (23–30) | 33 (23.5–42) | 22 (19–31) | 0.215 |
| Haemoglobin,
g/dla |
13.61±1.15b |
8.08±1.55c |
9.39±0.89d | <0.001 |
| Haematocrit,
%e |
38.95±3.57b |
27.17±3.71c |
28.81±2.60c | <0.001 |
| MCH, pga |
28.87±4.07b |
18.97±3.27c |
27.83±2.53b | <0.001 |
| MCHC,
g/dla |
34.31±1.93b |
29.67±2.52c |
32.58±1.49d | <0.001 |
| MCV, fla (range) | 86.7b (83.5–88.5) | 64.5c (57.7–71.7) | 84.5b (82.5–86.4) | <0.001 |
| RDW, %a (range) | 13.1b (12.4–14.3) | 17.1c (16.5–17.4) | 18.4c (16–22.6) | <0.001 |
| Serum iron,
μg/dla (range) | 87b (46–99) | 9c (7–13.7) | 189d (159–251) | <0.001 |
| TIBC,
μmol/la (range) | 300b (263–343) | 449c (441–467) | 88.5d (53.5–193.5) | <0.001 |
| TS, %a (range) | 27.2b (0.14–0.32) | 1.96c (0.01–0.03) | 279.5d (0.9–4.1) | <0.001 |
| Ferritin,
ng/mla (range) | 32.8b (25.3–44.2) | 3.45c (1.8–5.9) | 1598d (1162–2508) | <0.001 |
| Hair iron
56Fe, μg/ga
(range) | 12.01b (4.24–16.17) | 5.08c (0.77–10.87 | 28.88d (21.45–89.41) | <0.001 |
| Hair iron
57Fe, μg/ga
(range) | 17.62b (10.28–26.80) | 6.03c (1.26–9.65) | 29.44d (20.69–69.33) | <0.001 |
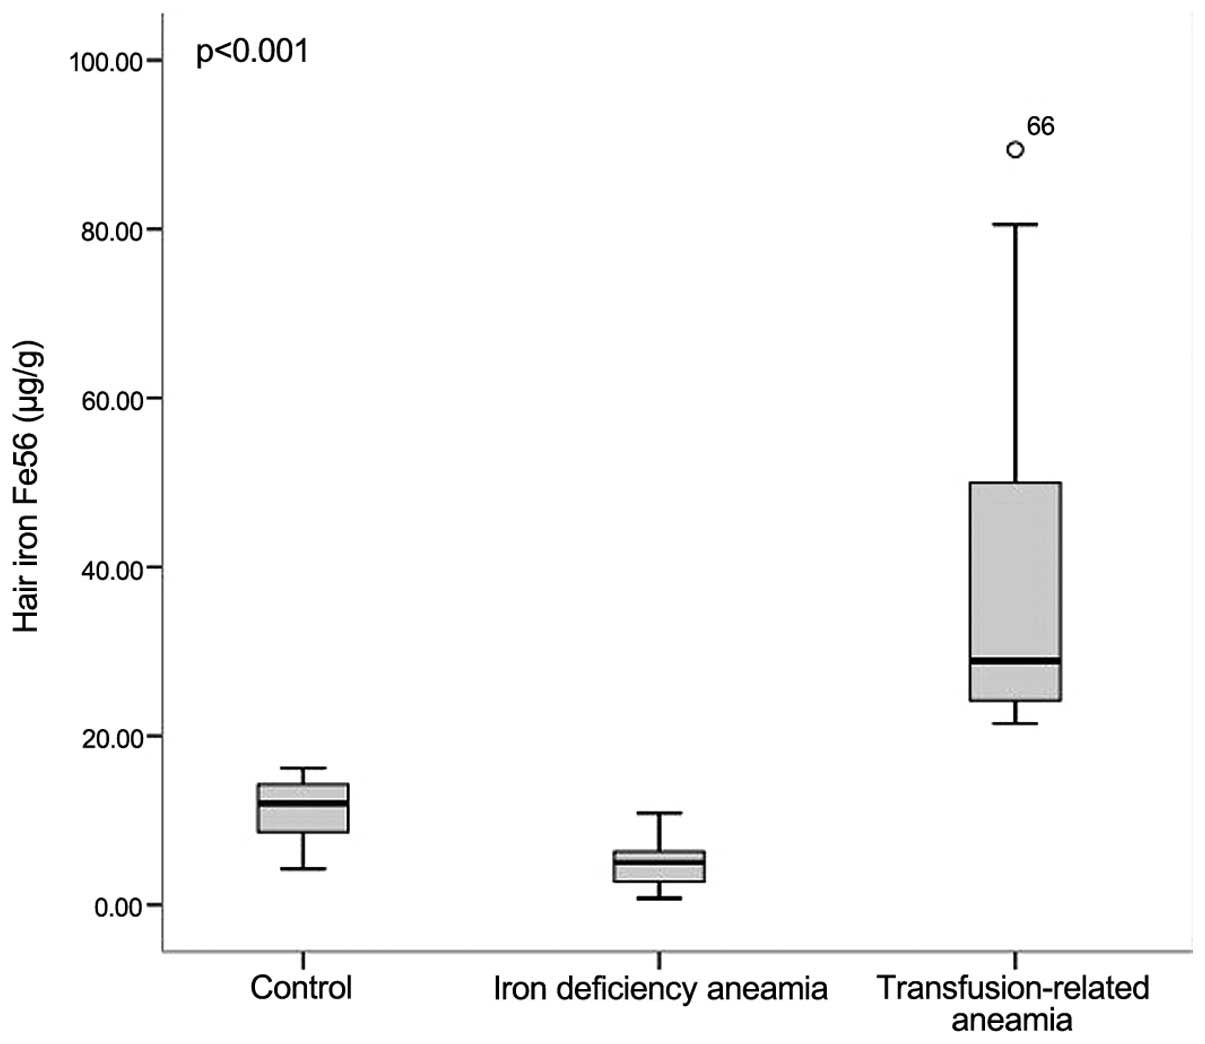
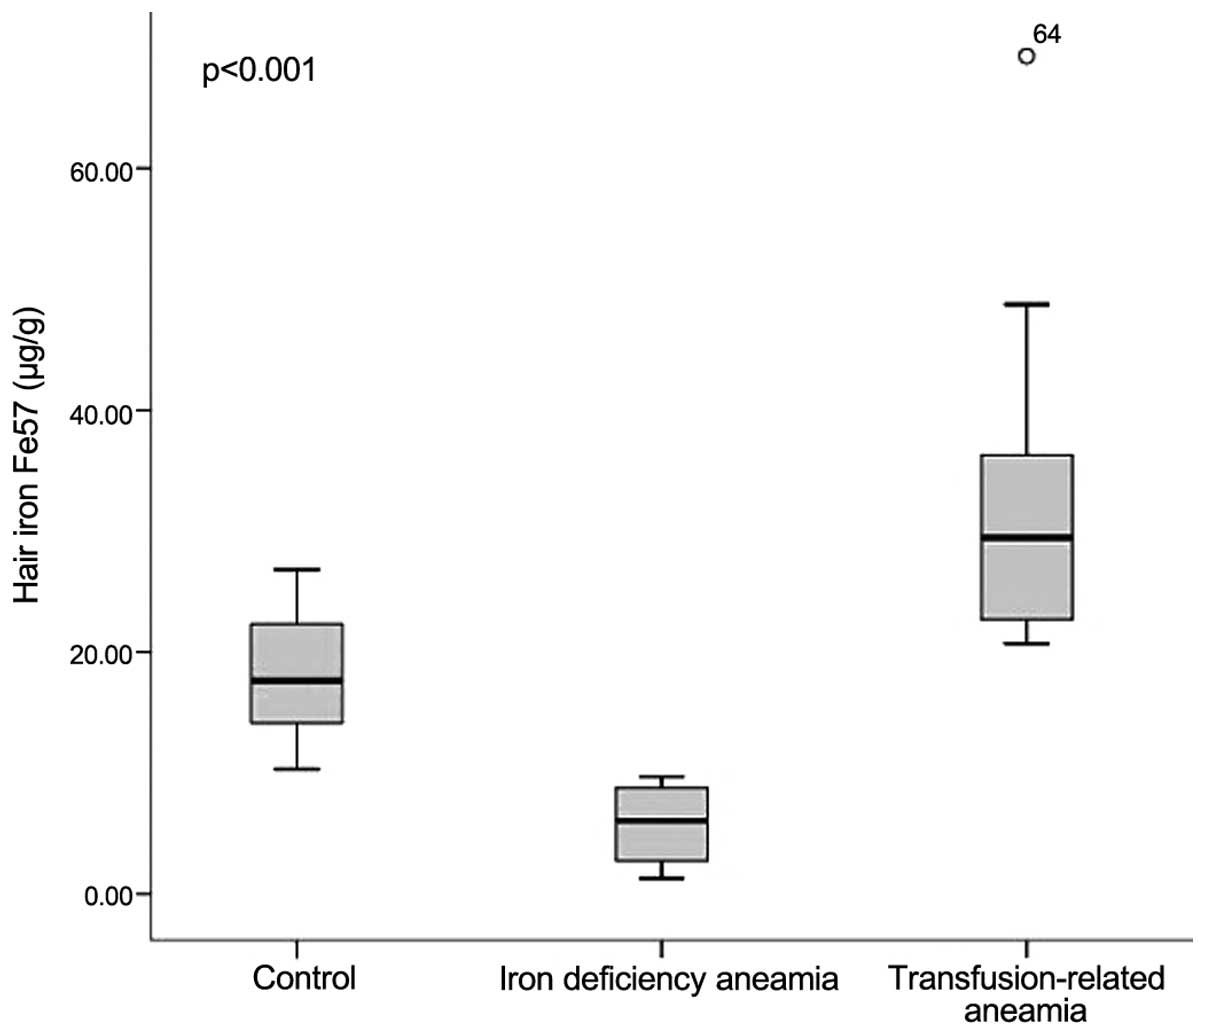
Hair iron concentration
The mean hair iron 56Fe and
57Fe concentrations of the iron deficiency group were
measured as 5.08 and 6.03 µg/g, respectively, and in the
transfusion-related anaemia group these values were 28.88 and 29.44
µg/g, respectively. In the control group, the mean hair iron
56Fe and 57Fe concentrations were measured as
12.01 and 17.62 µg/g, respectively. The highest hair iron
concentration of the ferritin value (89.41 µg/g) was observed in
transfusion-related anaemia patients, whereas the lowest hair iron
concentration (0.77 µg/g) was determined in the iron deficiency
anaemia group. The differences between the three groups with
respect to hair iron 56Fe and 57Fe
concentrations were found to be statistically significant (Figs. 1 and 2).
Statistical analysis
Correlation analysis applied to the parameters
showed a strong positive correlation between hair iron
56Fe and 57Fe (r=0.776, P<0.001). A
statistically significant positive correlation was determined
between hair iron 56Fe and 57Fe
concentrations and serum iron, ferritin level, transferrin
saturation, MCV and MCH values. A statistically significant
negative correlation was determined between hair iron
56Fe and 57Fe concentratons and TIBC. The
results of the correlation analysis are shown in Table II.
| Table II.Results of the correlation analysis
between the parameters. |
Table II.
Results of the correlation analysis
between the parameters.
| Parameters | 1 | 2 | 3 | 4 | 5 | 6 | 7 | 8 | 9 | 10 | 11 | 12 |
|---|
| 1. Hair
56Fe, ppm | 1 | 0.776 | -0.041 | -0.092 | 0.378 | 0.165 | 0.464 | 0.305 | 0.622 | -0.703 | 0.507 | 0.505 |
|
P-value |
|
<0.001a | 0.754 | 0.482 | 0.003a | 0.207 |
<0.001a | 0.018a |
<0.001a |
<0.001a |
<0.001a |
<0.001a |
| 2. Hair
57Fe, ppm |
| 1 | 0.177 | 0.102 | 0.522 | 0.371 | 0.571 | 0.170 | 0.642 | -0.759 | 0.473 | 0.494 |
|
P-value |
|
| 0.176 | 0.437 |
<0.001a | 0.005a |
<0.001a | 0.193 |
<0.001a |
<0.001a |
<0.001a |
<0.001a |
| 3. Haemoglobin |
|
| 1 | 0.969 | 0.705 | 0.754 | 0.615 | -0.304 | 0.069 | -0.160 | -0.112 | -0.127 |
|
P-value |
|
|
| <0.001 | <0.001 | <0.001 | <0.001 | 0.018 | 0.599 | 0.223 | 0.395 | 0.332 |
| 4. Haematocrit |
|
|
| 1 | 0.612 | 0.631 | 0.537 | -0.278 | -0.015 | -0.066 | -0.184 | -0.210 |
|
P-value |
|
|
|
| <0.001 | <0.001 | <0.001 | 0.031 | 0.911 | 0.617 | 0.159 | 0.108 |
| 5. MCH |
|
|
|
| 1 | 0.862 | 0.950 | -0.203 | 0.409 | -0.570 | 0.321 | 0.340 |
|
P-value |
|
|
|
|
| <0.001 | <0.001 | 0.120 | 0.001 | <0.001 | 0.015 | 0.008 |
| 6. MCHC |
|
|
|
|
| 1 | 0.675 | -0.280 | 0.300 | -0.356 | 0.160 | 0.185 |
|
P-value |
|
|
|
|
|
| <0.001 | 0.030 | 0.020 | 0.005 | 0.221 | 0.158 |
| 7. MCV |
|
|
|
|
|
| 1 | -0.129 | 0.444 | -0.649 | 0.371 | 0.394 |
|
P-value |
|
|
|
|
|
|
| 0.325 | <0.001 | <0.001 | 0.003 | 0.002 |
| 8. RDW |
|
|
|
|
|
|
| 1 | 0.224 | -0.228 | 0.310 | 0.261 |
|
P-value |
|
|
|
|
|
|
|
| 0.086 | 0.080 | 0.016 | 0.044 |
| 9. Serum iron |
|
|
|
|
|
|
|
| 1 | .0.779 | 0.753 | 0.669 |
|
P-value |
|
|
|
|
|
|
|
|
| <0.001 | <0.001 | <0.001 |
| 10. TIBC |
|
|
|
|
|
|
|
|
| 1 | .0.812 | .0.687 |
|
P-value |
|
|
|
|
|
|
|
|
|
| <0.001 | <0.001 |
| 11. TS |
|
|
|
|
|
|
|
|
|
| 1 | 0.606 |
|
P-value |
|
|
|
|
|
|
|
|
|
|
| <0.001 |
| 12. Ferritin |
|
|
|
|
|
|
|
|
|
|
| 1 |
Discussion
Various tests are in current use, including invasive
laboratory tests, to show the status of body iron, which has a role
in numerous vital functions. In the most widely-used test of serum
ferritin level, the body iron status may not be accurately
reflected due to various conditions, including pregnancy, acute or
chronic inflammatory disease, malignancy, infection, renal failure
or malabsorption syndrome.
The hair appears to function as a potential depot
for trace elements entering the body. Hair mineral levels are
significant in terms of showing the basic composition of minerals
accumulated over a long time period. Therefore, hair is a good
biopsy material for the accurate evaluation of trace elements.
Previous studies have shown that there is a significant correlation
between basic elements found in the body and the hair, and in this
context hair mineral analysis can be used as a good marker of body
mineral levels (5,6). In comparison with other methods
investigating body mineral levels, hair mineral analysis has
long-term stability and is not immediately affected by changes in
mineral intake (7). This is important
with respect to being able to accurately reflect the body iron
status in several different circumstances. However, the
specifications of hair iron concentration necessitate a strict
sampling regime and as this is not practical, clinical use is
limited.
There are extremely few data associated with the use
of hair iron concentration to define body iron status. In a study
by Duffield and Green (8) in 1956, it
was concluded that hair iron concentration may not provide
sufficient information regarding total body iron. In 1971, Lovric
and Pepper (9) conducted a study
measuring the iron content of various hair segments of children
with iron deficiency and iron overload and concluded that there was
no significant association between the groups with respect to hair
iron concentration. However, in the following years, Bisse et
al (1) proposed that hair iron
concentration may be useful in the evaluation of body iron status
and stated that further studies were required on this subject
(1).
In the present study, the difference in body iron
content shown between the iron deficiency anaemia group and the
transfusion-related anaemia group showed a significant difference
with respect to hair iron concentrations. The highest hair iron
concentration (89.41 µg/g) of the highest ferritin value was
observed in the transfusion-related anaemia patient group and the
lowest hair iron concentration (0.77 µg/g) was determined in the
iron deficiency anaemia group (P<0.001). In addition, a positive
correlation was determined between hair iron 56Fe and
57Fe concentrations and serum iron, ferritin level,
transferrin saturation, MCV and MCH values, which are the most
important parameters showing body iron content. A statistically
significant negative correlation was determined with TIBC.
The factors that can restrict the measurement of
hair iron include the diversity shown in scalp and hair samples,
different lengths of hair samples that may affect results, the
possibility of environmental contamination and that hair iron
concentration reference intervals have not been clearly defined.
Other factors limiting the clinical application of hair iron
measurement are that the measurement requires a strict sampling
regime and non-invasive magnetic resonance imaging is mainly able
to evaluate mineral density in solid tissue. However, it is
important that the results of the present study have shown a
significant association between body iron content laboratory
markers and hair iron concentrations, and thus demonstrate that
hair sampling can be used as a marker of body iron content.
As it is not known what type of association there is
between the iron content of solid organs and hair iron
concentration in cases of increased iron accumulation, there is a
requirement for future studies to show how hair iron is affected
and what the association is between hair iron concentration and
iron levels in other solid organs when ferritin acts as an acute
phase reactant.
In conclusion, the present study has shown that
patient groups with different body iron content showed a
significant difference in hair iron concentration and these values
were correlated with laboratory markers of body iron content. These
results support the view that hair sampling can be used as a marker
of body iron content.
Acknowledgements
The authors would like to thank Erciyes University
for their contribution.
References
|
1
|
Bisse E, Renner F, Sussmann S, Scholmerich
J and Wieland H: Hair iron content: possible marker to complement
monitoring therapy of iron deficiency in patients with chronic
inflammatory bowel diseases? Clin Chem. 42:1270–1274.
1996.PubMed/NCBI
|
|
2
|
El Sayed SM, Abou-Taleb A, Mahmoud HS,
Baghdadi H, Maria RA, Ahmed NS and Nabo MM: Percutaneous excretion
of iron and ferritin (through Al-hijamah) as a novel treatment for
iron overload in beta-thalassemia major, hemochromatosis and
sideroblastic anemia. Med Hypotheses. 83:238–246. 2014. View Article : Google Scholar : PubMed/NCBI
|
|
3
|
Vichinsky E, Butensky E, Fung E, Hudes M,
Theil E, Ferrell L, Williams R, Louie L, Lee PD and Harmatz P:
Comparison of organ dysfunction in transfused patients with SCD or
beta thalassemia. Am J Hematol. 80:70–74. 2005. View Article : Google Scholar : PubMed/NCBI
|
|
4
|
Angelucci E, Brittenham GM, McLaren CE,
Ripalti M, Baronciani D, Giardini C, Galimberti M, Polchi P and
Lucarelli G: Hepatic iron concentration and total body iron stores
in thalassemia major. N Engl J Med. 343:327–331. 2000. View Article : Google Scholar : PubMed/NCBI
|
|
5
|
Kedzierska E: Concentrations of selected
bioelements and toxic metals and their influence on health status
of children and youth residing in Szczecin. Ann Acad Med Stetin.
49:131–143. 2003.(In Polish). PubMed/NCBI
|
|
6
|
Lakshmi Priya MD and Geetha A: Level of
trace elements (copper, zinc, magnesium and selenium) and toxic
elements (lead and mercury) in the hair and nail of children with
autism. Biol Trace Elem Res. 142:148–158. 2011. View Article : Google Scholar : PubMed/NCBI
|
|
7
|
Ayodele J and Bayero A: Lead and zinc
concentrations in hair and nail of some Kano inhabitants. Afr J Env
Sci Tech. 3:164–170. 2009.
|
|
8
|
Duffield J and Green PT: The iron content
of human hair. II. Individuals with disturbed iron metabolism. Can
Serv Med J. 12:987–996. 1956.PubMed/NCBI
|
|
9
|
Lovric VA and Pepper R: Iron content of
hair in children in various states of iron balance. Pathology.
3:251–256. 1971. View Article : Google Scholar
|