Introduction
Multiple sclerosis (MS) is a disease characterized
by immunopathological damage to the structures of the central
nervous system (CNS) and neurodegenerative changes in the brain
(1). MS typically presents at a
younger age, between the 20th and 40th years of life. The first
neurological signs, which are suspected to increase the risk of
developing clinically definite MS (CDMS), are termed clinically
isolated syndrome (CIS) and consist of episodes of inflammation in
one or more parts of the CNS for at least 24 h (2). The characteristics of CIS include typical
symptoms of MS outbreaks over hours or days, magnetic resonance
imaging (MRI) findings compatible with the diagnosis of MS,
remission periods lasting a few weeks, and radiological progression
of lesions compatible with demyelination (3). The diagnosis of the disease is based on
clinical examinations including MRI of the brain and spinal cord,
supported by the examination of cerebrospinal fluid (CSF) (4–8).
The results of clinical studies and research
confirmed that the early diagnosis and treatment of MS during the
initial stages of the disease can significantly retard its
progression, preserve long-term performance and prevent permanent
damage to the nervous structures (9).
The benefits of early long-term treatment initiation for MS are
based on the data published by Miller in 2004, showing that
patients started to be treated later did not experience the same
benefits of treatment compared to those who started treatment in
the early stages of the disease (10).
As a result, there has been an intense effort in the search for new
disease markers to enable early diagnosis and treatment with the
aim of retarding disease progression. Previous proteomics analyses
of the CSF have detected a number dysregulated proteins, which were
altered in MS patients (11–13). Moreover, several published proteomic
studies compared various MS subgroups to control groups and
revealed candidate biomarkers for MS (14–16). These
studies identified a large number of potential biomarkers, likely
due to different proteomics approaches and the high heterogeneity
of MS.
The aim of this study was to identify changes in the
CSF proteome in patients with RR MS and CIS who are at a high risk
of developing MS (case) compared to healthy population
(control).
Materials and methods
Materials
Subjects (patients and healthy controls) enrolled in
the present study provided written informed consent for the
collection of CSF samples.
The CSF samples were collected using a standard
lumbar puncture technique with a single-use atraumatic needle
(Pajunk, Geisingen, Germany). Chemicals were purchased from
Sigma-Aldrich (St. Louis, MO, USA) and were of the highest grade
available, unless otherwise indicated.
Sample preparation and tryptic
digestion
The protein concentrations of each of the 11 cases
and 15 control samples were determined using a bicinchoninic acid
assay (BCA) (Sigma-Aldrich). An equal amount of 50 µg of protein
was taken from each sample for subsequent steps. The pH was
adjusted using triethylammonium bicarbonate buffer (Sigma-Aldrich),
pH 8.5 to a final concentration of 200 mM. Sodium deoxycholate
(SDC) at a final concentration of 1% was used for protein
solubilization and digestion enhancement.
The proteins were reduced using 5 mM Tris
(2-carboxyethyl) phosphine hydrochloride for 1 h at 60°C and thiol
groups were blocked in 10 mM methyl methanethiosulfonate for 30 min
at a room temperature of 24°C. Proteins were digested using a
combined LysC/trypsin strategy. First, the samples were digested
with LysC (Promega, Madison, WI, USA) at a 1:50 enzyme to protein
ratio (w/w) for 4 h at 37°C. Trypsin (Promega) was then added at
the same ratio, followed by overnight incubation at 37°C.
Digestion was terminated by the addition of
trifluoroacetic acid (TFA) to a final concentration of 1% and SDC
was removed by a liquid-liquid extraction using water-saturated
ethyl acetate (5X 200 µl). The organic phase was discarded, and the
remaining ethyl acetate traces in the aqueous phase were removed in
speed-vac. The samples were desalinated using Empore C18-SD SPE
cartridges (3M, St. Paul, MN, USA).
Nano liquid chromatography-tandem mass
spectrometry (LC-MS/MS) analysis
The samples were redissolved in loading phase A (2%
AcN, 0.1% TFA) at a concentration of 0.5 µg/µl and subjected to a
nanoLC-MS/MS analysis. An UltiMate 3000 RSLCnano system (Thermo
Scientific, Bremen, Germany) was used for chromatography
separation. The trap-column configuration consisted of a PepMap100
C18, 3 µm, 100 Å, 75 µm × 20 mm trap column and a PepMap RSLC C18,
2 µm, 100 Å, 75 µm × 500 mm analytical column (all from Thermo
Scientific). The samples were loaded onto the trap column at 8
µl/min of loading phase A for 3 min. Peptides were separated by a
linear gradient formed by mobile phase A (2% AcN, 0.1% FA) and
mobile phase B (80% AcN, 0.1% FA), running from 2 to 40% of mobile
phase B in 240 min at a flow rate of 200 nl/min.
Eluted peptides were electrosprayed into a
Q-Exactive Plus mass spectrometer using a Nanospray Flex Ion Source
(both from Thermo Scientific) at 1.8 kV. A full MS/Top10
experimental setup was used. Positive ion full scan MS spectra (m/z
400–1,600) were obtained using a 3×10⁶ AGC target in the
Orbitrap at 70,000 resolution with a maximum ion time of 100 msec.
A lock mass of m/z 445.12003
([(C2H6SiO)6+H]+) was used for internal
calibration of mass spectra.
Precursor ion charge state of ≥2>8 and threshold
intensity of 1.7×10⁴ counts, corresponding to 1%
‘underfill ratio’, were selected for HCD fragmentation, with an
exclusion window of 15 sec. The isolation window of 2 m/z and
normalized collision energy of 28 were used. Each product ion
spectrum was obtained in the Orbitrap at 17,500 resolution, with a
1×10⁵ AGC target and a maximum injection time of 60
msec.
LC-MS/MS data analysis
Raw LC-MS/MS files were processed in the MaxQuant
software (version 1.5.2.8) (17).
MS/MS spectra were searched using the built-in search engine
Andromeda against a reviewed SwissProt human protein database
containing 20,204 entries downloaded from UniProt.org
in March 2015 (18). Trypsin/P was set
as a protease with up to two missed cleavages allowed. The maximum
mass deviation tolerance in MS mode was set to 20 ppm for the
initial search and 6 ppm for the main search, whereas the maximum
deviation tolerance in MS/MS mode was set to 20 ppm.
Thiomethylation of cysteine residues was set as fixed modification,
while oxidation of methionine and N-terminal protein acetylation
were selected as variable modifications. The false discovery rate
(FDR), determined by reverse database searching, was set to 0.01
for the peptides and proteins. Label-free quantification was
performed using the MaxLFQ engine integrated in MaxQuant (19).
Bioinformatics analysis
Proteomics data were processed using the Perseus
software suite (http://www.perseus-framework.org/) and R (20). First, data were transformed [log2(x)]
and filtered so that for each protein, at least one group
(case/control) contained a minimum of 50% valid values. The
remaining missing values were imputed by random numbers drawn from
a normal distribution in Perseus (19). The data were then normalized in R using
locally weighted scatterplot smoothing (LOWESS) algorithm (21). Subsequent steps were then performed in
Perseus. A two-tailed, two-sample t-test and was used to compare
protein levels between the case and control groups (22). The results were filtered using the
Benjamini-Hochberg procedure for FDR correction (FDR<0.05).
Statistical significance for t-test was then standardized at an α
level of P<0.002.
Results
LFQ intensities
An MS-based quantitative proteomics strategy was
used in the present study to perform a proteome-wide comparison
between 15 samples from the healthy population (control group) and
11 samples from RR MS and CIS patients (case group). The 26 samples
were analysed using label-free high-resolution shotgun proteomics
in technical duplicates. The 52 result files obtained were
subsequently processed using the MaxQuant software and the
Andromeda search engine. The ‘match between runs’ algorithm in
MaxQuant was applied, which enabled peptide identifications to be
matched and transferred between runs at an FDR <1%. This initial
dataset contained 9,089 peptides corresponding to 965 protein
groups.
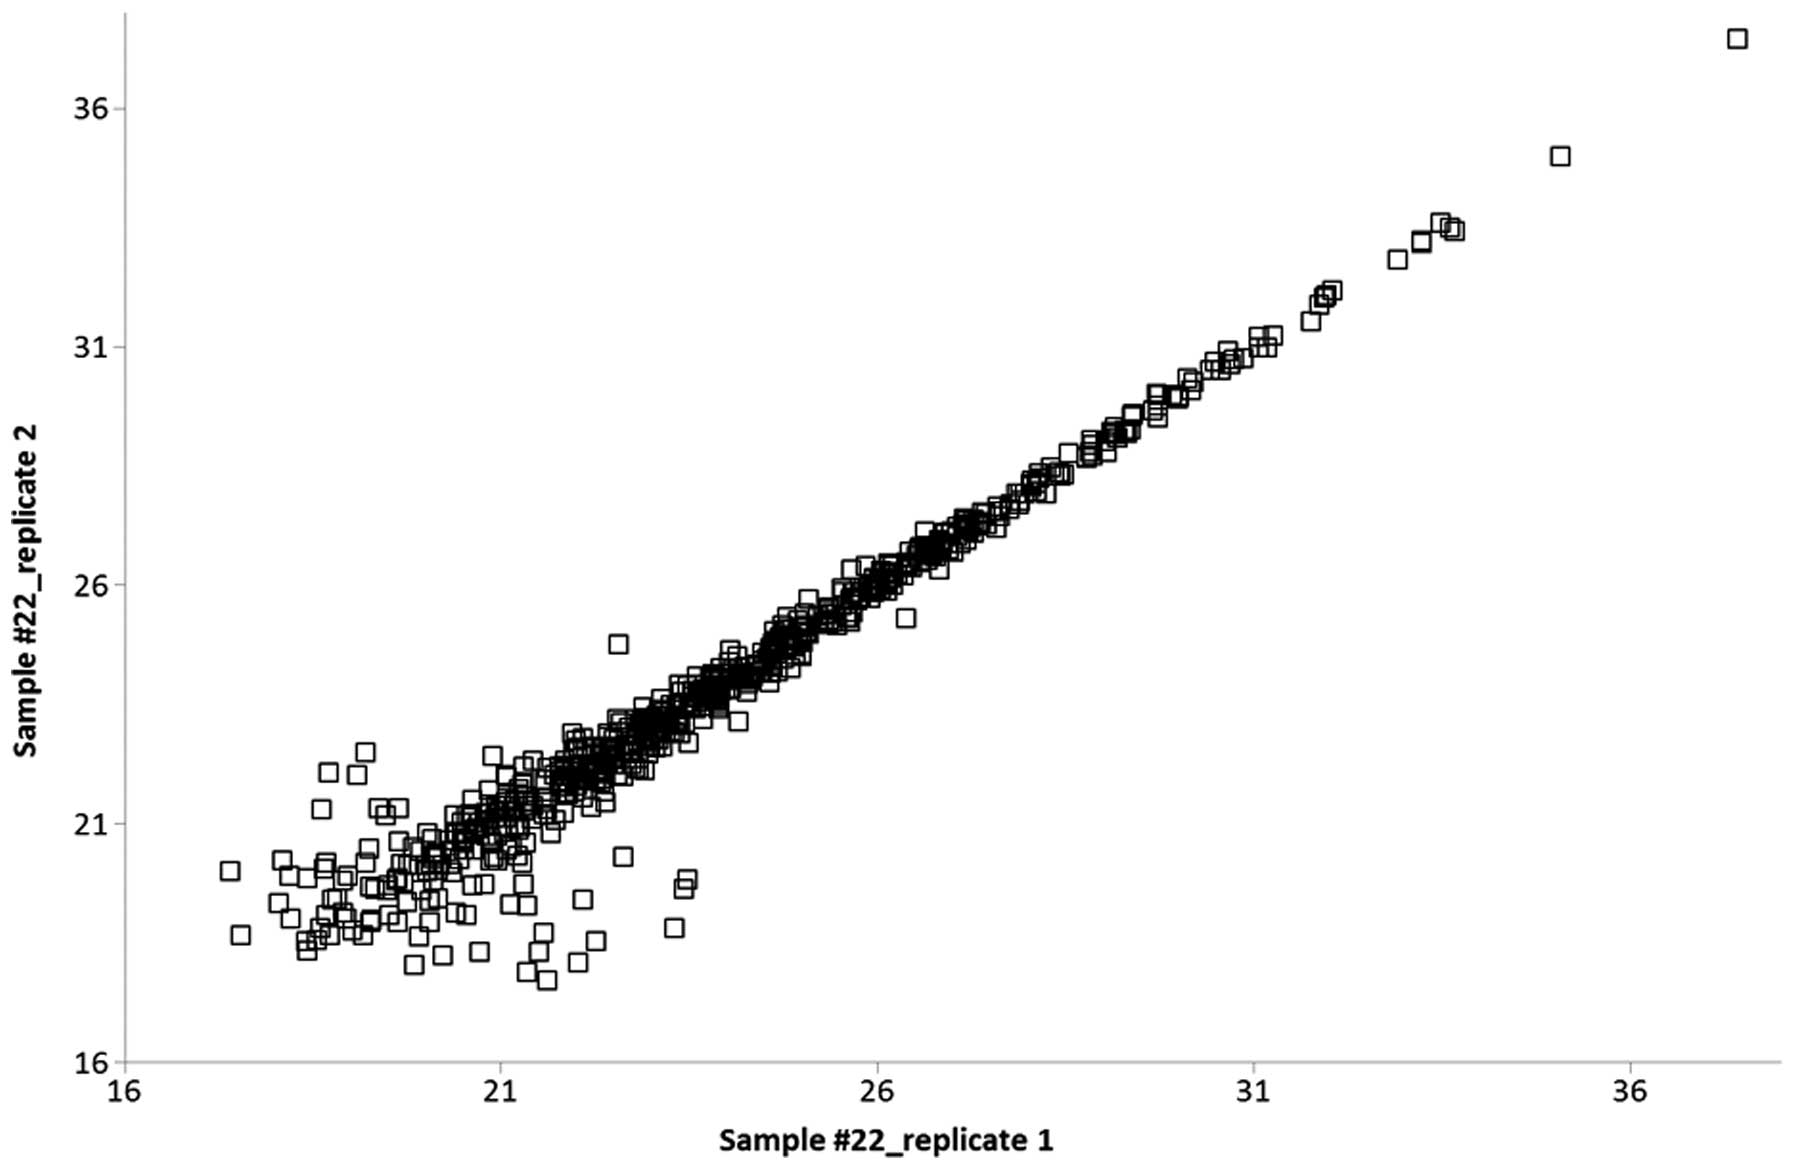
Protein quantification was performed using the
MaxQuant label-free algorithm (LFQ) with unique and razor peptides
for protein quantification, and ≥2 ratio counts were required for a
protein quantification to be considered valid. Technical replicates
were compared with each other, and the Pearson correlation was
calculated. High values of R (0.90–0.98) represented a highly
reproducible, relative label-free quantification between technical
replicates (Fig. 1).
Label-free quantitative approaches are often
accompanied by an absence of data on particular proteins/peptides.
This feature of missing values can occur due to a low abundance of
proteins/peptides as well as to post-translational modifications or
even because of technical reasons (23). The filtering of missing values in the
initial dataset of 922 protein groups with the subsequent
imputation of remaining absent values was performed with respect to
the above reasons to avoid the incorrect rejection of potential
marker candidates. The initial data were filtered in order that a
valid LFQ value for a given protein was present in ≥50% of samples
in at least one cohort (case/control). Using this strategy, even if
a protein was present in one cohort and absent in the other, it
would not be rejected due to missing LFQ information. The remaining
missing values were subsequently imputed as described above. The
final dataset for bioinformatics evaluation contained 627
identified protein groups in each sample.
Dysregulation of 26 protein
groups
To determine significant differences in protein
abundance between the case and control samples, the LFQ intensities
of each protein group were compared using the t-test corrected with
the Benjamini-Hochberg FDR (P<0.05) method. We found 26 protein
groups to be significantly (P<0.002) dysregulated in the case
samples compared to the controls (Table
I).
 | Table I.A list of 26 protein groups
significantly (P<0.002) dysregulated in the case samples
compared to the controls.a |
Table I.
A list of 26 protein groups
significantly (P<0.002) dysregulated in the case samples
compared to the controls.a
| Uniprot accession
no. | Protein names | LFQ median value,
case group | LFQ median value,
control group | Case vs. control, LFQ
ratio |
|---|
| Q9NZK5 | Adenosine deaminase
CECR1 | 1957797.34 | 935384.50 | 2.09 |
| P55285 | Cadherin-6 | 3489043.13 | 4004248.28 | 0.87 |
| Q9BQT9 | Calsyntenin-3 | 5017718.13 | 8042429.76 | 0.62 |
| Q15782 | Chitinase-3-like
protein 2 | 2199432.66 | 1077159.16 | 2.04 |
| P81605 | Dermcidin | 4688516.24 | 17917922.03 | 0.26 |
| P35555; P35556 | Fibrillin-1 | 3553230.87 | 1303085.21 | 2.73 |
| Q99880 | Histone H2B | 8827050.37 | 2170205.15 | 4.07 |
| P62805 | Histone H4 | 20150328.18 | 4724728.50 | 4.26 |
| P01857 | Ig γ-1 chain C
region | 18124221796.09 | 8578034664.42 | 2.11 |
| P01825 | Ig heavy chain V–II
region NEWM | 113679746.37 | 17005522.52 | 6.68 |
| P01766; P01777 | Ig heavy chain
V–III region BRO | 210800054.64 | 108040726.11 | 1.95 |
| P01781; P01782 | Ig heavy chain
V–III region GAL | 59278269.66 | 29245270.55 | 2.03 |
| P01763 | Ig heavy chain
V–III region WEA | 7991860.67 | 1210020.45 | 6.60 |
| P01834 | Ig κ chain C
region | 7421686935.61 | 4036338437.24 | 1.84 |
| P01605 | Ig κ chain V–I
region Lay | 41600571.15 | 10707363.87 | 3.89 |
| P01617; P06309 | Ig κ chain V–II
region TEW; Ig κ chain V–II region GM607 | 55362279.11 | 19775351.47 | 2.80 |
| P01620; P01623 | Ig κ chain V–III
region SIE; Ig κ chain V–III region WOL | 659546894.77 | 339679756.20 | 1.94 |
| P01591 | Immunoglobulin J
chain | 25385476.42 | 4918885.36 | 5.16 |
| P48740 | Mannan-binding
lectin serine protease 1 | 7385683.45 | 4596167.68 | 1.61 |
| P01033 | Metalloproteinase
inhibitor 1 | 53788707.99 | 39003493.11 | 1.38 |
| Q7Z7M0 | Multiple epidermal
growth factor-like domains protein 8 | 31947506.55 | 51970874.53 | 0.61 |
| Q9P2E7 |
Protocadherin-10 | 632760.49 | 976797.51 | 0.65 |
| P23468 | Receptor-type
tyrosine-protein phosphatase δ | 20936254.05 | 27150962.38 | 0.77 |
| P23470 | Receptor-type
tyrosine-protein phosphatase γ | 11604652.61 | 16665947.45 | 0.70 |
| Q9BZR6 | Reticulon-4
receptor | 32256800.25 | 53751437.42 | 0.60 |
| Q9ULF5 | Zinc transporter
ZIP10 | 2903174.78 | 4387902.38 | 0.66 |
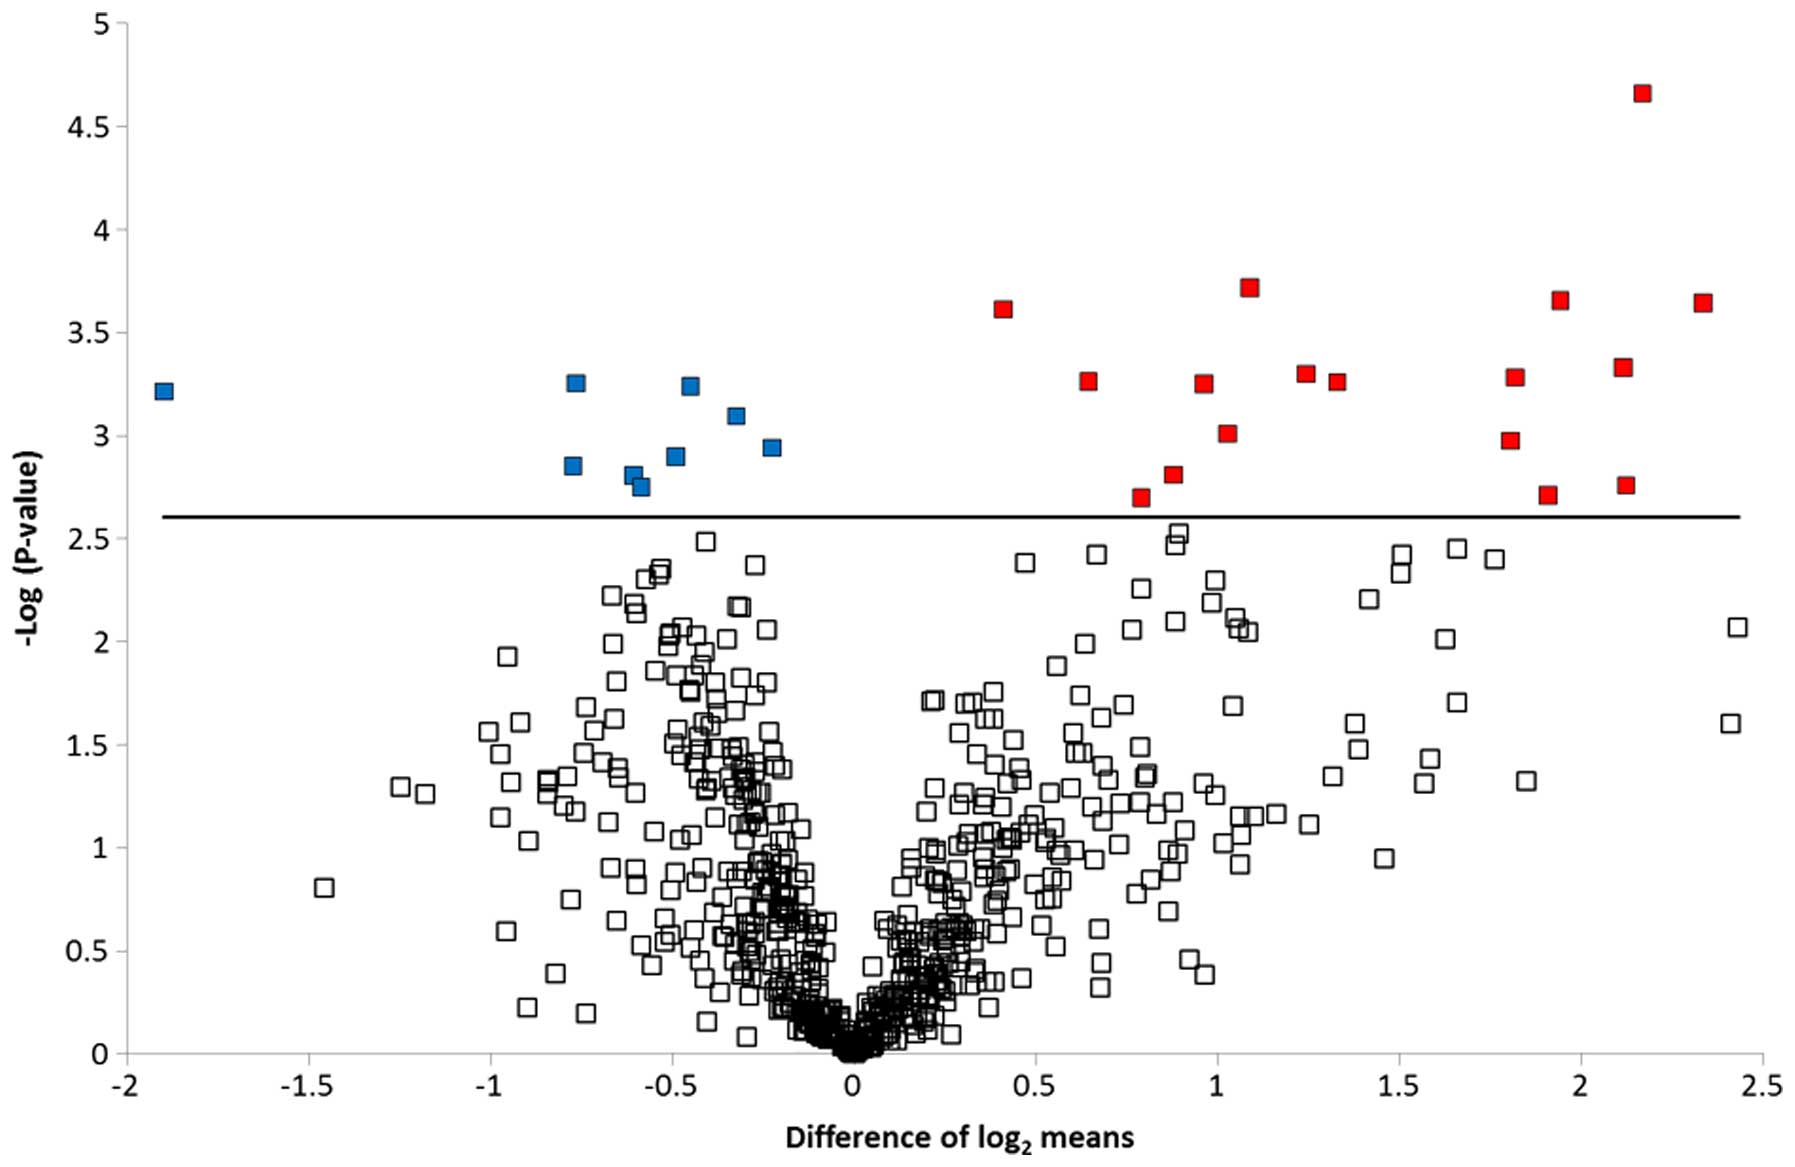
Volcano plot and boxplot graph
To graphically represent the t-test data, a volcano
plot was created (Fig. 2). Points
above the non-axial horizontal line are proteins with significantly
different abundances in the case and control samples. The
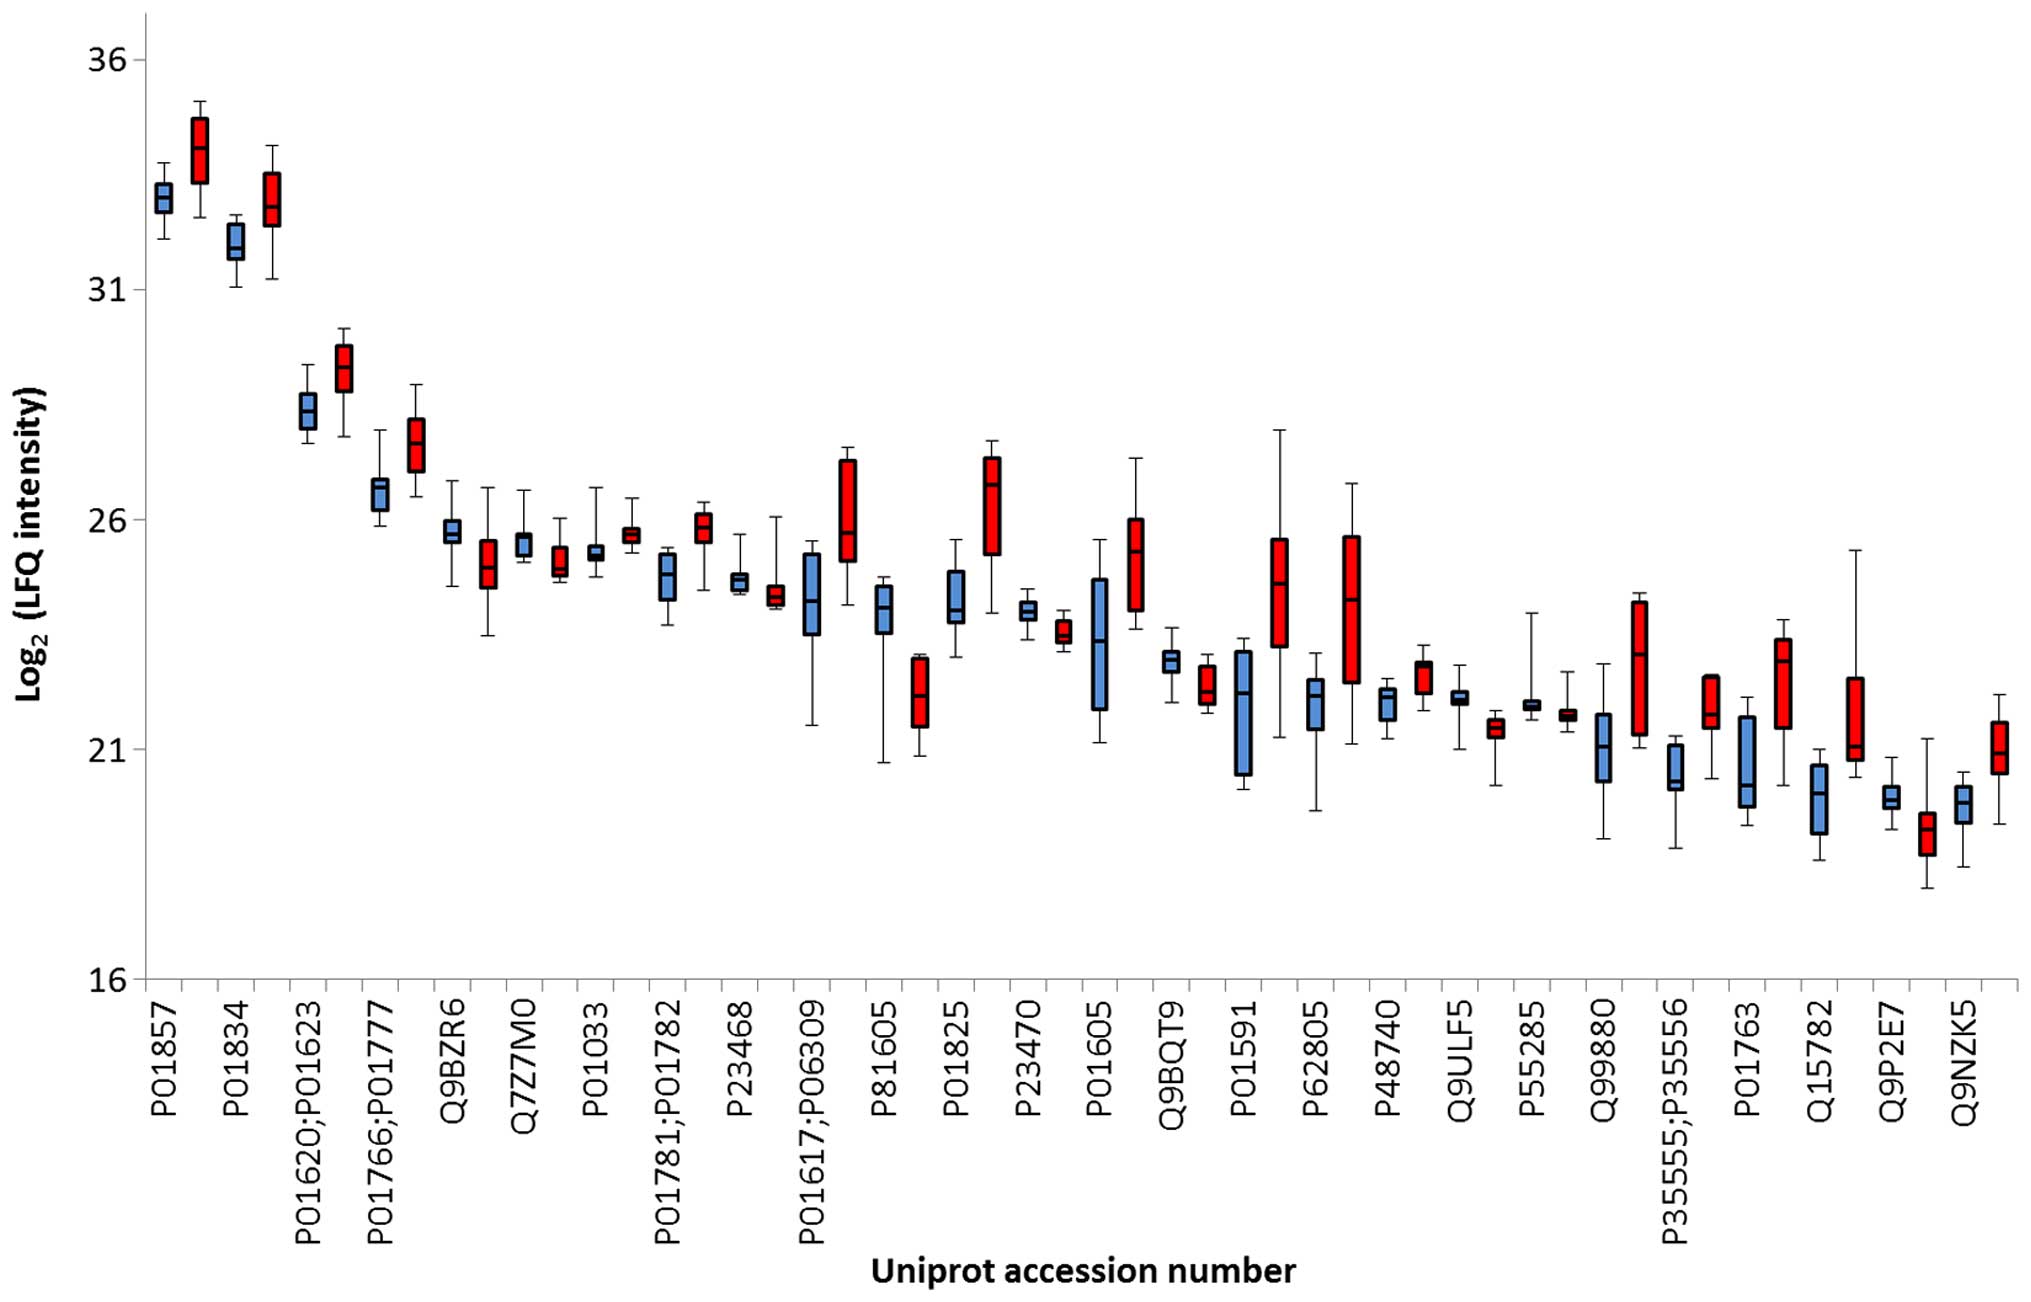
differences in case vs controls for each of the dysregulated
proteins is shown in Fig. 3. Nine
proteins were found to be significantly less abundant in the case
samples, while the abundance of 17 proteins was significantly
increased in the case samples compared to the controls.
Differentially abundant proteins were classified according to the
Gene Ontology Biological Process categories. Less abundant proteins
were preferentially involved in biological adhesion, cell killing,
transmembrane transport, anatomical structure development and
morphogenesis, whereas the more abundant proteins were associated
with the immune system, metabolic processes and homeostatic
processes.
Discussion
A number of studies have examined risk factors in
patients with CIS in relation to the development of CDMS (24–30). The RR
form of MS develops in approximately 60–80% of patients. The
factors predicting a lower risk of early conversion to CDMS include
monofocal CIS, disability afferents (isolated syndrome sensitive),
and normal or non-specific findings on MRI. Similarly, the factors
predicting a higher risk of early conversion to CDMS can include
multifocal CIS, disability efferent pathways, and abnormal findings
on MRI with multifocal lesions (25).
One crucial factor in determining the risk of conversion to CDMS
CIS is the primary finding by MRI, with the initial lesion load,
i.e., the number and volume of T2-weighted lesions, showing
prognostic importance (26,27). Atrophy of the brain was also found to
play an important role, as patients who developed a second attack
showed greater total brain atrophy and atrophy of grey matter than
patients in whom the second attack did not occur (28). Another risk factor in the development
of CDMS is considered to be the presence of oligoclonal bands
(OCBs) (29–31). Thus, each of the above factors may
predict the progression of CIS to CDMS.
Three of the 26 dysregulated proteins identified in
the present study were also identified in the reports of Kroksveen
et al in patients with RR MS, including immunoglobulin (Ig)
γ-1 chain C region, Ig heavy chain V–III region BRO and Ig κ chain
C region. These proteins share a common role in initial complement
triggering (11).
Complement activation occurs due to a cascade of
proteolytic steps performed by serine proteases. Ingram et
al performed an immunohistochemical study and identified a set
of complement proteins, activation products and regulators in the
brain and spinal cord tissue of patients with progressive MS
(32). Active, chronic active and
chronic inactive MS plaques, as well as non-plaque areas, were
examined, and MS plaques were consistently positive for complement
proteins (C3, factor B and C1q), activation products (C3b, iC3b,
C4d and terminal complement complex), and regulators (factor H,
C1-inhibitor and clusterin), suggesting continued local complement
synthesis, activation and regulation despite the absence of other
evidence of on-going inflammation (32).
Similarly, the data presented by Ekdahl et al
showed that MS patients suffering from acute RR MS have more
prominent systemic complement activation than MS patients who
respond to interferon-β treatment. In particular, an increased
systemic C3a/C3 ratio may serve as a biomarker to distinguish more
acute RR MS at an earlier stage of MS pathogenesis (33).
Our prior understanding of the immunology of MS and
the knowledge gained from animal studies indicate that complement
does not initiate disease but instead propagates on-going disease,
with an increased contribution over the course of the disease
(34). As a result, some of these
proteins were considered risk factors for earlier conversion from
CIS to RR MS or secondary progressive (SP) MS during the natural
course of the disease.
Chitinase 3-like protein 2 was also identified as a
risk factor for MS progression (35).
This protein is thought to play a role in the process of
inflammation and tissue remodelling.
Diffusion survival evasion protein (DSEP) is encoded
in the genomes of humans, primates and rats and has known
cytoprotective effects when produced during cell stress. When this
molecule is degraded, the N-terminal peptides preserve this
function, in contrast to the antimicrobial functions of the
C-terminal peptides (Dermcidin). In vitro administration of
the N-terminal peptides was shown to promote the formation of
monomeric forms of heat shock protein 70 (Hsp70) from oligomeric
forms, thereby activating its ATPase activity and resulting in its
association with the peptide and Hsp40 to produce an active
multimolecular complex, which provides cytoprotection against
anoxic and inflammatory insults. The anti-inflammatory effects of
these peptides include the inhibition of pro-inflammatory cytokines
(TNF-α and IL-6), the inhibition of secretory phospholipase A2,
reduced phagocytosis, and the induction of IL-10 secretion
(36).
In conclusion, in the present study, we identified
three proteins that occurred only in patients with RR MS and these
proteins may serve as prognostic biomarkers for identifying
patients at a high risk of developing RR MS.
Acknowledgements
The present study was supported by the MH CZ-DRO
(UHHK, 00179906).
References
|
1.
|
Krejsek J: News in the pathogenesis of
multiple sclerosis. What is hidden behind the disability of MS
patients. Remedia. 2014:S2–S4. 2014.(In Czech).
|
|
2.
|
Cree B and Vollmer TL: Clinically isolated
syndrome: Evaluation, risk stratification, and treatment decisions.
Adv Stud Med. 8:257–265. 2008.
|
|
3.
|
Garcea O, Villa A, Cáceres F, Adoni T,
Alegría M, Barbosa Thomaz R, Buzo R, Llamas López L and Rivera
Kindel M: Early treatment of multiple sclerosis: A Latin American
experts meeting. Mult Scler. 15(Suppl 3): S1–S12. 2009. View Article : Google Scholar : PubMed/NCBI
|
|
4.
|
Schumacher GA, Beebe G, Kibler RF, Kurland
LT, Kurtzke JF, McDowell F, Nagler B, Sibley WA, Tourtellotte WW
and Willmon TL: Problems of experimental trials of therapy in
multiple sclerosis: report by the panel on the evaluation of
experimental trials of therapy in multiple sclerosis. Ann N Y Acad
Sci. 122:552–568. 1965. View Article : Google Scholar : PubMed/NCBI
|
|
5.
|
Poser CM, Paty DW, Scheinberg L, McDonald
WI, Davis FA, Ebers GC, Johnson KP, Sibley WA, Silberberg DH and
Tourtellotte WW: New diagnostic criteria for multiple sclerosis:
Guidelines for research protocols. Ann Neurol. 13:227–231. 1983.
View Article : Google Scholar : PubMed/NCBI
|
|
6.
|
McDonald WI, Compston A, Edan G, Goodkin
D, Hartung HP, Lublin FD, McFarland HF, Paty DW, Polman CH,
Reingold SC, et al: Recommended diagnostic criteria for multiple
sclerosis: guidelines from the International Panel on the diagnosis
of multiple sclerosis. Ann Neurol. 50:121–127. 2001. View Article : Google Scholar : PubMed/NCBI
|
|
7.
|
Polman CH, Reingold SC, Edan G, Filippi M,
Hartung HP, Kappos L, Lublin FD, Metz LM, McFarland HF, O'Connor
PW, et al: Diagnostic criteria for multiple sclerosis: 2005
revisions to the ‘McDonald Criteria’. Ann Neurol. 58:840–846. 2005.
View Article : Google Scholar : PubMed/NCBI
|
|
8.
|
Polman CH, Reingold SC, Banwell B, Clanet
M, Cohen JA, Filippi M, Fujihara K, Havrdova E, Hutchinson M,
Kappos L, et al: Diagnostic criteria for multiple sclerosis: 2010
revisions to the McDonald criteria. Ann Neurol. 69:292–302. 2011.
View Article : Google Scholar : PubMed/NCBI
|
|
9.
|
Tintoré M: Rationale for early
intervention with immunomodulatory treatments. J Neurol. 255(Suppl
1): 37–43. 2008. View Article : Google Scholar
|
|
10.
|
Miller JR: The importace of early
diagnosis of multiple sclerosis. J Manag Care Pharm. 10:S4–S11.
2004.PubMed/NCBI
|
|
11.
|
Kroksveen AC, Guldbrandsen A, Vedeler C,
Myhr KM, Opsahl JA and Berven FS: Cerebrospinal fluid proteome
comparison between multiple sclerosis patients and controls. Acta
Neurol Scand Suppl. 195:90–96. 2012. View Article : Google Scholar : PubMed/NCBI
|
|
12.
|
Kroksveen AC, Opsahl JA, Aye TT, Ulvik RJ
and Berven FS: Proteomics of human cerebrospinal fluid: discovery
and verification of biomarker candidates in neurodegenerative
diseases using quantitative proteomics. J Proteomics. 74:371–388.
2011. View Article : Google Scholar : PubMed/NCBI
|
|
13.
|
Ottervald J, Franzén B, Nilsson K,
Andersson LI, Khademi M, Eriksson B, Kjellström S, Marko-Varga G,
Végvári A, Harris RA, et al: Multiple sclerosis: identification and
clinical evaluation of novel CSF biomarkers. J Proteomics.
73:1117–1132. 2010. View Article : Google Scholar : PubMed/NCBI
|
|
14.
|
Kroksveen AC, Aasebø E, Vethe H, Van Pesch
V, Franciotta D, Teunissen CE, Ulvik RJ, Vedeler C, Myhr KM,
Barsnes H, et al: Discovery and initial verification of
differentially abundant proteins between multiple sclerosis
patients and controls using iTRAQ and SID-SRM. J Proteomics.
78:312–325. 2013. View Article : Google Scholar : PubMed/NCBI
|
|
15.
|
Comabella M, Fernández M, Martin R,
Rivera-Vallvé S, Borrás E, Chiva C, Julià E, Rovira A, Cantó E,
Alvarez-Cermeño JC, et al: Cerebrospinal fluid chitinase 3-like 1
levels are associated with conversion to multiple sclerosis. Brain.
133:1082–1093. 2010. View Article : Google Scholar : PubMed/NCBI
|
|
16.
|
Stoop MP, Singh V, Dekker LJ, Titulaer MK,
Stingl C, Burgers PC, Sillevis Smitt PA, Hintzen RQ and Luider TM:
Proteomics comparison of cerebrospinal fluid of relapsing remitting
and primary progressive multiple sclerosis. PLoS One. 5:e124422010.
View Article : Google Scholar : PubMed/NCBI
|
|
17.
|
Cox J and Mann M: MaxQuant enables high
peptide identification rates, individualized p.p.b.-range mass
accuracies and proteome-wide protein quantification. Nat
Biotechnol. 26:1367–1372. 2008. View
Article : Google Scholar : PubMed/NCBI
|
|
18.
|
Cox J, Neuhauser N, Michalski A, Scheltema
RA, Olsen JV and Mann M: Andromeda: a peptide search engine
integrated into the MaxQuant environment. J Proteome Res.
10:1794–1805. 2011. View Article : Google Scholar : PubMed/NCBI
|
|
19.
|
Cox J, Hein MY, Luber CA, Paron I, Nagaraj
N and Mann M: Accurate proteome-wide label-free quantification by
delayed normalization and maximal peptide ratio extraction, termed
MaxLFQ. Mol Cell Proteomics. 13:2513–2526. 2014. View Article : Google Scholar : PubMed/NCBI
|
|
20.
|
Gautier L, Cope L, Bolstad BM and Irizarry
RA: affy - analysis of Affymetrix GeneChip data at the probe level.
Bioinformatics. 20:307–315. 2004. View Article : Google Scholar : PubMed/NCBI
|
|
21.
|
Yang YH, Dudoit S, Luu P, Lin DM, Peng V,
Ngai J and Speed TP: Normalization for cDNA microarray data: a
robust composite method addressing single and multiple slide
systematic variation. Nucleic Acids Res. 30:e152002. View Article : Google Scholar : PubMed/NCBI
|
|
22.
|
Christin C, Hoefsloot HC, Smilde AK,
Hoekman B, Suits F, Bischoff R and Horvatovich P: A critical
assessment of feature selection methods for biomarker discovery in
clinical proteomics. Mol Cell Proteomics. 12:263–276. 2013.
View Article : Google Scholar : PubMed/NCBI
|
|
23.
|
Clough T, Thaminy S, Ragg S, Aebersold R
and Vitek O: Statistical protein quantification and significance
analysis in label-free LC-MS experiments with complex designs. BMC
Bioinformatics. 13(Suppl 16): S62012. View Article : Google Scholar : PubMed/NCBI
|
|
24.
|
Lipsy RJ, Schapiro RT and Prostko CR:
Current and future directions in MS management: key considerations
for managed care pharmacists. J Manag Care Pharm. 15(Suppl A):
S2–S15; quiz S16–S17. 2009.PubMed/NCBI
|
|
25.
|
Mareš J: Early treatment of multiple
sclerosis - treatment of clinically isolated syndrome, conditions
of early diagnosis and treatment of multiple sclerosis. Remedia.
2011.S5–S6, (In Czech).
|
|
26.
|
Tintoré M, Rovira A, Río J, Nos C, Grivé
E, Téllez N, Pelayo R, Comabella M, Sastre-Garriga J and Montalban
X: Baseline MRI predicts future attacks and disability in
clinically isolated syndromes. Neurology. 67:968–972. 2006.
View Article : Google Scholar : PubMed/NCBI
|
|
27.
|
Fisniku LK, Brex PA, Altmann DR, Miszkiel
KA, Benton CE, Lanyon R, Thompson AJ and Miller DH: Disability and
T2 MRI lesions: a 20-year follow-up of patients with relapse onset
of multiple sclerosis. Brain. 131:808–817. 2008. View Article : Google Scholar : PubMed/NCBI
|
|
28.
|
Pérez-Miralles F, Sastre-Garriga J,
Tintoré M, Arrambide G, Nos C, Perkal H, Río J, Edo MC, Horga A,
Castilló J, et al: Clinical impact of early brain atrophy in
clinically isolated syndromes. Mult Scler. 19:1878–1886. 2013.
View Article : Google Scholar : PubMed/NCBI
|
|
29.
|
Sastre-Garriga J, Tintoré M, Rovira A,
Grivé E, Pericot I, Comabella M, Thompson AJ and Montalban X:
Conversion to multiple sclerosis after a clinically isolated
syndrome of the brainstem: cranial magnetic resonance imaging,
cerebrospinal fluid and neurophysiological findings. Mult Scler.
9:39–43. 2003. View Article : Google Scholar : PubMed/NCBI
|
|
30.
|
Neuteboom RF, Boon M, Catsman Berrevoets
CE, Vles JS, Gooskens RH, Stroink H, Vermeulen RJ, Rotteveel JJ,
Ketelslegers IA, Peeters E, et al: Prognostic factors after a first
attack of inflammatory CNS demyelination in children. Neurology.
71:967–973. 2008. View Article : Google Scholar : PubMed/NCBI
|
|
31.
|
Tintoré M, Rovira A, Río J, Tur C, Pelayo
R, Nos C, Téllez N, Perkal H, Comabella M, Sastre-Garriga J, et al:
Do oligoclonal bands add information to MRI in first attacks of
multiple sclerosis? Neurology. 70:1079–1083. 2008. View Article : Google Scholar : PubMed/NCBI
|
|
32.
|
Ingram G, Loveless S, Howell OW, Hakobyan
S, Dancey B, Harris CL, Robertson NP, Neal JW and Morgan BP:
Complement activation in multiple sclerosis plaques: an
immunohistochemical analysis. Acta Neuropathol Commun. 2:532014.
View Article : Google Scholar : PubMed/NCBI
|
|
33.
|
Ekdahl NK, Blomberg C, Henningsson JA,
Dahle C, Håkanssone I, Sandholm K and Ernerudh J: Systemic and
intrathecal complement activation in multiple sclerosis and
Guillan-Barré syndrome. Mol Immunol. 46:28482009. View Article : Google Scholar
|
|
34.
|
Ingram G, Hakobyan S, Robertson NP and
Morgan BP: Complement in multiple sclerosis: its role in disease
and potential as a biomarker. Clin Exp Immunol. 155:128–139. 2009.
View Article : Google Scholar : PubMed/NCBI
|
|
35.
|
Hinsinger G, Galéotti N, Nabholz N, Urbach
S, Rigau V, Demattei C, Lehmann S, Camu W, Labauge P, Castelnovo G,
et al: Chitinase 3-like proteins as diagnostic and prognostic
biomarkers of multiple sclerosis. Mult Scler. 21:1251–1261. 2015.
View Article : Google Scholar : PubMed/NCBI
|
|
36.
|
Greenstein J and Cunningham T:
Neuroprotective, anti-inflammatory and immune Tolerizing properties
of peptides derived from diffusion survival Evasion protein
(DSEP)/Dermcidin. Neurology. 82:P1.1752014.
|