Introduction
The liver performs numerous functions associated
with glucose metabolism. Glucose uptake by the liver depends on
circulating blood glucose (BG) concentration and contributes to the
maintenance of glucose homeostasis. Glucose uptake by the liver is
decreased in patients with liver cirrhosis (LC) because of a
portal-systemic shunt and a decrease in viable hepatocytes,
resulting in post-prandial hyperglycemia (1). Indeed, 80% of patients with LC also
exhibit abnormal glucose tolerance and 25% have been diagnosed with
diabetes (2). Glycated hemoglobin A1c
(HbA1c), which reflects average plasma glucose concentrations over
the preceding 1–2 months, is generally used as a marker of recent
control of plasma glucose (3). HbA1c
concentration is also regarded as a treatment marker in patients
with diabetes. Indeed, guidelines formulated by an international
expert committee composed of members of the European Association
for the Study of Diabetes and the International Diabetes Federation
and the American Diabetes Association have set a target HbA1c as
7%, as higher levels are associated with increased risks of
cardiovascular disease and diabetic nephropathy, neuropathy and
retinopathy (4).
Glycated albumin (GA) is another indicator of
glucose metabolism. Due to fact that the half-life of albumin (ALB)
(17 days) is shorter compared with that of hemoglobin (30 days), GA
is a better marker of short-term BG levels (5). As glycosylation of ALB takes around 9
min, and is faster than that of HbA1c, GA is regarded as a more
suitable marker of average glucose level in patients with greater
fluctuations of glucose, including patients with acute and
transient increases in postprandial BG level and night time
hypoglycemia (6).
HbA1c or GA measurements have limitations in
particular diseases, including chronic liver diseases and LC.
Hypersplenism in patients with LC results in a shorter half-life of
erythrocytes, resulting in the underestimation of HbA1c (7). In addition, since ALB concentrations are
lower in patients with LC, a compensatory mechanism can extend the
half-life of ALB in these patients, resulting in an overestimation
of GA (7,8). Therefore, HbA1c and GA have been regarded
as inadequate indicators of average BG concentrations in patients
with LC (7). However, these results
derived from studies in which patients performed 7–8
self-monitoring blood glucose (SMBG) tests per day, with average
glucose levels determined from individual, discontinuous glucose
concentrations. Therefore, it remains unclear whether HbA1c and GA
are inappropriate indicators of average glucose levels in patients
with LC.
Continuous glucose monitoring systems (CGMS)
continuously measure glucose concentrations from glucose-oxidase
reactions in the interstitial space and sensors placed in
subcutaneous tissue. Glucose concentrations in the interstitial
space are converted to BG levels based on four daily calibrations
with SMBG. Sensors in CGMS measure glucose concentration every 10
sec and record average values every 5 min, resulting in more
accurate average BG levels over 24 h (9). Significant positive correlations between
HbA1c and average glucose levels, as determined by CGMS, have been
observed in patients with diabetes (10). To date, however, correlations between
HbA1c, GA and CGMS-determined average glucose levels remain to be
evaluated in patients with LC.
The present study evaluated whether HbA1c and GA
correlated with CGMS-determined average plasma glucose level, and
assessed whether HbA1c and GA can be predictors of glucose
metabolism in patients with LC.
Materials and methods
Patients
Patients diagnosed with LC at Saga Medical School
Hospital (Saga, Japan) between 2011 and 2013 were included in the
present study. The diagnosis of LC was based on liver biopsy
findings and/or platelet counts <5×10⁴/µl. Each
patient underwent a general medical check-up, including physical
and physiological examinations, and a screening blood test.
Patients with decompensated LC, defined as a Child-Pugh score ≥10;
patients with liver neoplasm; and patients using any agents for the
treatment of diabetes were excluded. Patients with severe anemia
(hemoglobin, <8 g/dl) and with proteinuria (positive urine
protein in qualitative test) were also excluded. Finally, a total
of 30 patients (16 males and 14 females) with LC were enrolled.
All subjects provided written informed consent for
the use of their data. The study design was approved by the
Institutional Review Board of Saga University Hospital (no.
2009-09-09). The study was performed in conformity with the ethical
guidelines of the 7th revision of the Declaration of Helsinki
(October, 2008).
Physical examination, serum
biochemistry and liver histology
Body mass index was calculated as the weight (kg)
divided by height (m2). Venous blood samples were
obtained from all patients following a 12 h overnight fast, and
blood cell counts, prothrombin time (PT), and concentrations of
ALB, total-bilirubin (T-BIL), aspartate aminotransferase,
γ-glutamyl trans-peptidase (GGT), hemoglobin A1c (HbA1c) and GA
were measured using standard techniques. One day after admission,
HbA1c was determined by high-performance liquid chromatography
(Arcray Inc., Kyoto, Japan) and serum GA was measured enzymatically
using an ALB-specific protease, ketoamine oxidase, and an ALB assay
reagent (Lucica GA-L; Asahi Kasei Pharma, Tokyo, Japan).
Liver biopsy specimens were fixed in 10% formalin,
embedded in paraffin, sectioned and stained with hematoxylin and
eosin, and Azan for histological evaluation. A single experienced
pathologist who was unaware of the clinical conditions of the
patients evaluated all liver biopsy specimens. Liver histology of
patients infected with hepatitis C virus (HCV) and hepatitis B
virus (HBV) were evaluated according to the METAVIR scoring system
(11), with LC diagnosed as METAVIR
stage 4 (F4). Liver fibrosis in patients with non-alcoholic
steatohepatitis (NASH) and alcoholic steatohepatitis was evaluated
using Brunt's classification, with LC diagnosed as Brunt's stage 4
(12).
CGMS
Patients were equipped with a CGMS device (Medtronic
miniMed, Northridge, CA, USA) and monitored for 72 h. Each CGMS
device was calibrated with SMBG four times per day. After the 72 h
monitoring period, all recorded data were downloaded onto a
personal computer. Glucose profiles and glucose excursion
parameters were evaluated with MiniMedSolutions software version
3.0 (MiniMed, Symar, CA, USA). Parameters analyzed included
average, maximum and minimum BG concentrations, and the standard
deviation of glucose concentration.
Predictive average BG with HbA1c and
GA
Predictive average BG was calculated from HbA1c
using the conversion formulas for patients with type 2 diabetes
(10) and the conversion formula
between HbA1c and GA (13): Average BG
(mg/dl)=28.7 × HbA1c (%) - 46.7 and average BG (mg/dl)=6.2 × GA (%)
+ 38.8. After converting HbA1c to GA using the conversion formula,
the correlation between GA and average BG was confirmed.
Statistical analysis
Continuous variables were reported as the mean ±
standard deviation and categorical variables as frequencies. Simple
correlation analyses were performed using the Spearman correlation
coefficient. The average BG obtained by CGMS and estimated average
BG were compared using Student's t-test. All analyses were
performed using EZR (Saitama Medical Center, Jichi Medical
University, Saitama, Japan), a graphical user interface for R (The
R Foundation for Statistical Computing, Vienna, Austria) (14). P<0.05 was considered to indicate a
statistically significant difference.
Results
Patient characteristics
The demographic and clinical characteristics of the
30 patients and their glycemic parameters obtained with CGMS are
summarized in Table I. Since all
patients had LC, their mean PLT counts (9.93±4.98 ×
104/µl), PT (79.3±14.8%) and Alb concentration
(3.24±0.54 mg/dl) were abnormally low. Their mean HbA1c and GA was
5.54±1.12% and 19.6±4.98%, respectively. HbA1c was >6.5% in 5
patients and GA was >20 mg/dl in 11 patients. CGMS was
successfully performed in all patients, and the average, maximum
and minimum BGs were obtained for 72 h. The average BG was >126
mg/dl in 19 patients and the maximum BG was >200 mg/dl in 13
patients. The mean minimum BG was 85.1±25.4 mg/dl, with 9 patients
having a minimum BG <70 mg/dl and were considered hypoglycemic.
Child-Pugh scores ranged between 5 and 8. LC was most frequently
caused by HCV infection, observed in 19 patients.
 | Table I.Baseline demographic and clinical
characteristics of the 30 patients. |
Table I.
Baseline demographic and clinical
characteristics of the 30 patients.
| Characteristic | Demographics |
|---|
| Males, n (%) | 16 (53.3) |
| Age, years | 70.1±10.7 |
| BMI | 24.4±4.42 |
| WBC (/µl) | 4,346.7±1,515.8 |
| Hb (g/dl) | 12.4±2.02 |
| PLT (x104
/µl) | 9.93±4.98 |
| PT (%) | 79.3±14.8 |
| ALB (g/dl) | 3.24±0.54 |
| T-BIL (mg/dl) | 1.14±0.5 |
| AST (U/l) | 58.8±36.0 |
| ALT (U/l) | 32.6±38.7 |
| GGT (U/l) | 53.6±39.6 |
| FPG (mg/dl) | 107.9±25.1 |
| Insulin (units) | 17.3±22.2 |
| HbA1c (%) | 5.54±1.12 |
| GA (%) | 19.6±4.98 |
| 1,5-AG (µg/ml) | 18.8±9.8 |
| Glycemic parameters
obtained from CGMS |
|
| Average
BG (mg/dl) | 142±38.7 |
| Maximum
BG (mg/dl) | 209.3±65.7 |
| Minimum
BG (mg/dl) | 85.1±25.4 |
| Child-Pugh score, n
(%) |
|
| 5 | 10 (33.3) |
| 6 | 8 (26.7) |
| 7 | 7 (23.3) |
| 8 | 5 (16.7) |
| Etiology, n
(%) |
|
HBV | 3 (10) |
|
HCV | 19 (63.3) |
|
NASH | 5 (16.7) |
|
Alcohol | 2 (6.7) |
|
Unknown | 1 (3.3) |
Diagnostic ability of HbA1c and
fasting plasma glucose (FPG) for hyperglycemia
HbA1c level and FPG level are commonly used for a
diagnosis of diabetes. In order to investigate the diagnostic
ability of HbA1c and FPG in the patients with LC, the present study
analyzed the frequency of the patients who potentially fulfilled
the diagnostic criteria of diabetes (HbA1c ≥6.5% and/or FPG ≥126
mg/dl), according to the average BG measured by CGMS (Table II). As expected, only 9.1% of the
patients with average BG ≥140 mg/dl, 11.1% of the patients with
average BG ≥150 mg/dl and 0% of the patients with average BG ≥ 200
mg/dl met the diagnostic criteria of diabetes (HbA1c ≥6.5% and FPG
≥126 mg/dl).
| Table II.HbA1c and fasting plasma glucose
level in the liver cirrhosis patients with hyperglycemia determined
by CGMS. |
Table II.
HbA1c and fasting plasma glucose
level in the liver cirrhosis patients with hyperglycemia determined
by CGMS.
|
| Average blood
glucose (CGMS) |
|---|
|
|
|
|---|
| Characteristic | ≥140 mg/dl (n=11,
%) | ≥150 mg/dl (n=9,
%) | ≥200 mg/d (n=3,
%) |
|---|
| HbA1c ≥6.5 | 5 (45.5) | 5 (55.6) | 2 (66.7) |
| FPG ≥126 | 3 (27.2) | 3 (33.3) | 1 (33.3) |
| HbA1c ≥6.5 and FPG
≥126 | 1 (9.1) | 1 (11.1) | 0 (0) |
| HbA1c ≥6.5 or FPG
≥126 | 7 (63.6) | 7 (77.8) | 3 (100) |
Correlation between glycemic
parameters and CGMS parameters
The present study evaluated the correlations of
HbA1c, GA and 1,5-anhydroglucitol (1,5-AG) concentrations with CGMS
parameters (Table III). HbA1c
concentration was significantly correlated with the average BG
(r=0.45, P=0.015), maximum BG (r=0.52, P=0.004) and the standard
deviation of BG (r=0.49, P=0.008). GA was also significantly
correlated with average BG (r=0.69, P<0.01), maximum BG (r=0.65,
P<0.01) and the standard deviation of BG (r=0.73, P<0.01).
FPGs also exhibited significant correlations with average BG
(r=0.55, P=0.002), maximum BG (r=0.51, P=0.004) and the standard
deviation of BG (r=0.43, P=0.018). No glycemic marker exhibited a
significant correlation with minimum BG.
| Table III.Correlation between glycemic
parameters and continuous glucose monitoring system in patients
with LC. |
Table III.
Correlation between glycemic
parameters and continuous glucose monitoring system in patients
with LC.
|
| Average BG | Maximum BG | Minimum BG | Standard
deviation |
|---|
|
|
|
|
|
|
|---|
| Characteristic | r-value | P-value | r-value | P-value | r-value | P-value | r-value | P-value |
|---|
| HbA1c |
0.447 |
0.015 |
0.523 |
0.004 |
0.143 |
0.460 |
0.485 |
0.008 |
| GA |
0.687 | <0.001 |
0.648 | <0.001 |
0.071 |
0.725 |
0.732 | <0.001 |
| 1,5-AG | −0.403 |
0.041 | −0.588 |
0.002 | −0.101 |
0.624 | −0.534 |
0.005 |
| FPG |
0.545 |
0.002 |
0.511 |
0.004 | −0.014 |
0.941 |
0.428 |
0.018 |
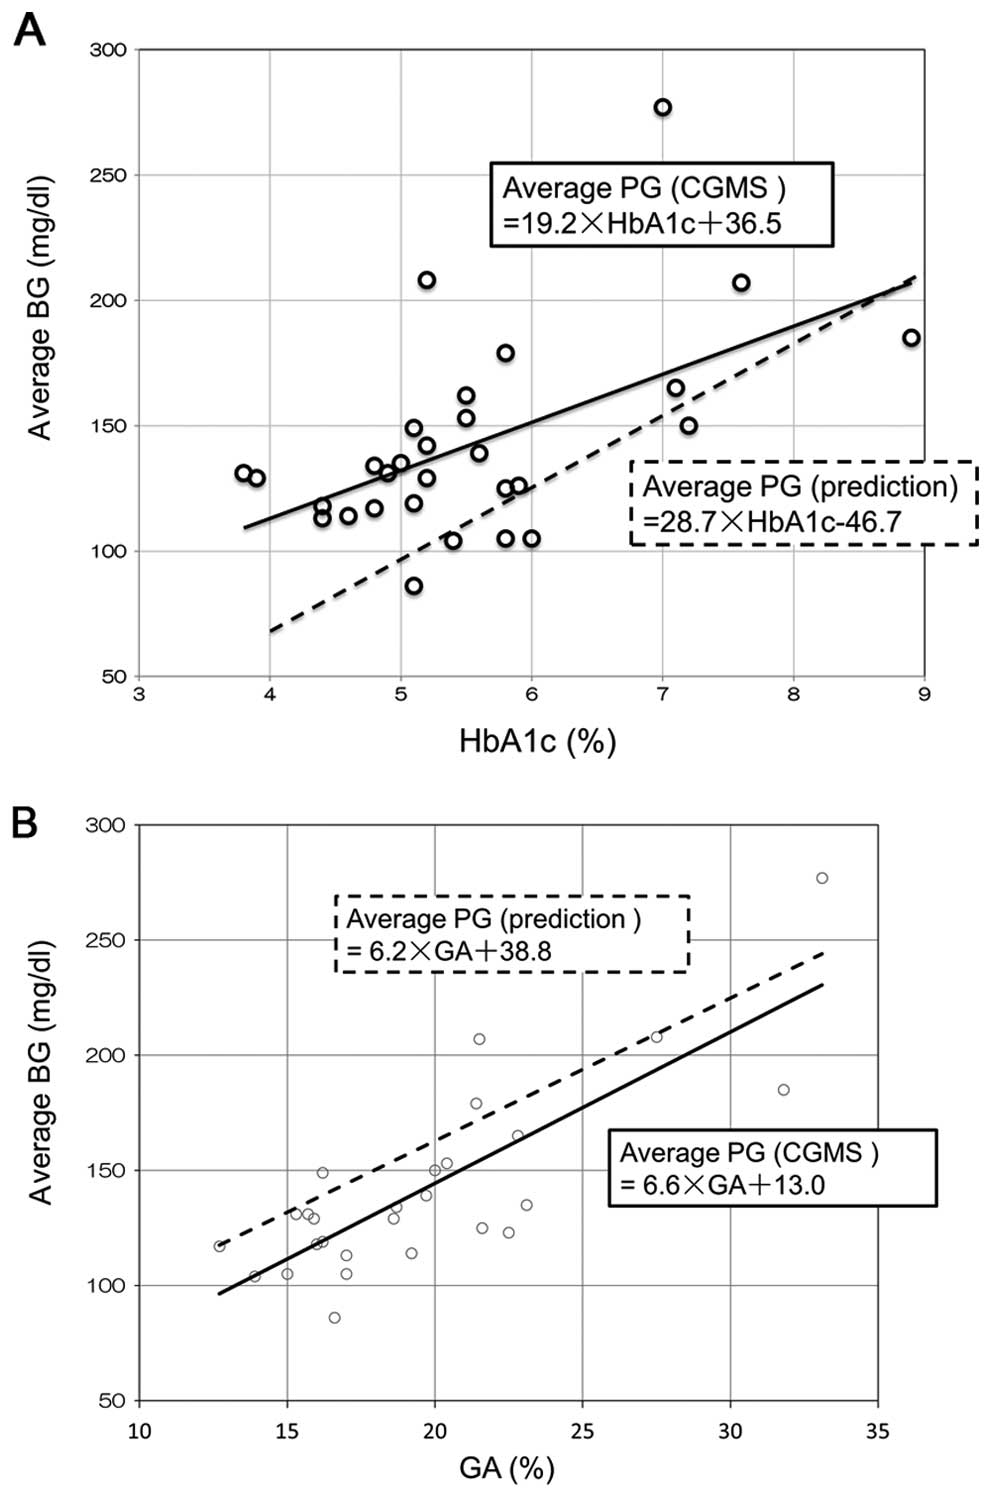
Based on the correlations of the distributions of
HbA1c and GA relative to average BG, the average BG could be
predicted from HbA1c and GA concentrations: Average BG=19.2 × HbA1c
(%)+36.5 (Fig. 1A) and average BG=6.6
× GA (%)+13.0 (Fig. 1B). Two outliers
were identified in the correlation distribution (patients 16 and
18) for HbA1c and average BG, which deviated from the predicted
formula and lay outside the 95% confidential interval. As expected,
both patients exhibited anemia; hemoglobin concentrations were 9.9
g/dl and 9.7 g/dl in patients 16 and 18, respectively. In the
correlation distribution of GA and average BG, however, these two
patients were not outliers and lay within the 95% confidential
interval (Fig. 1B).
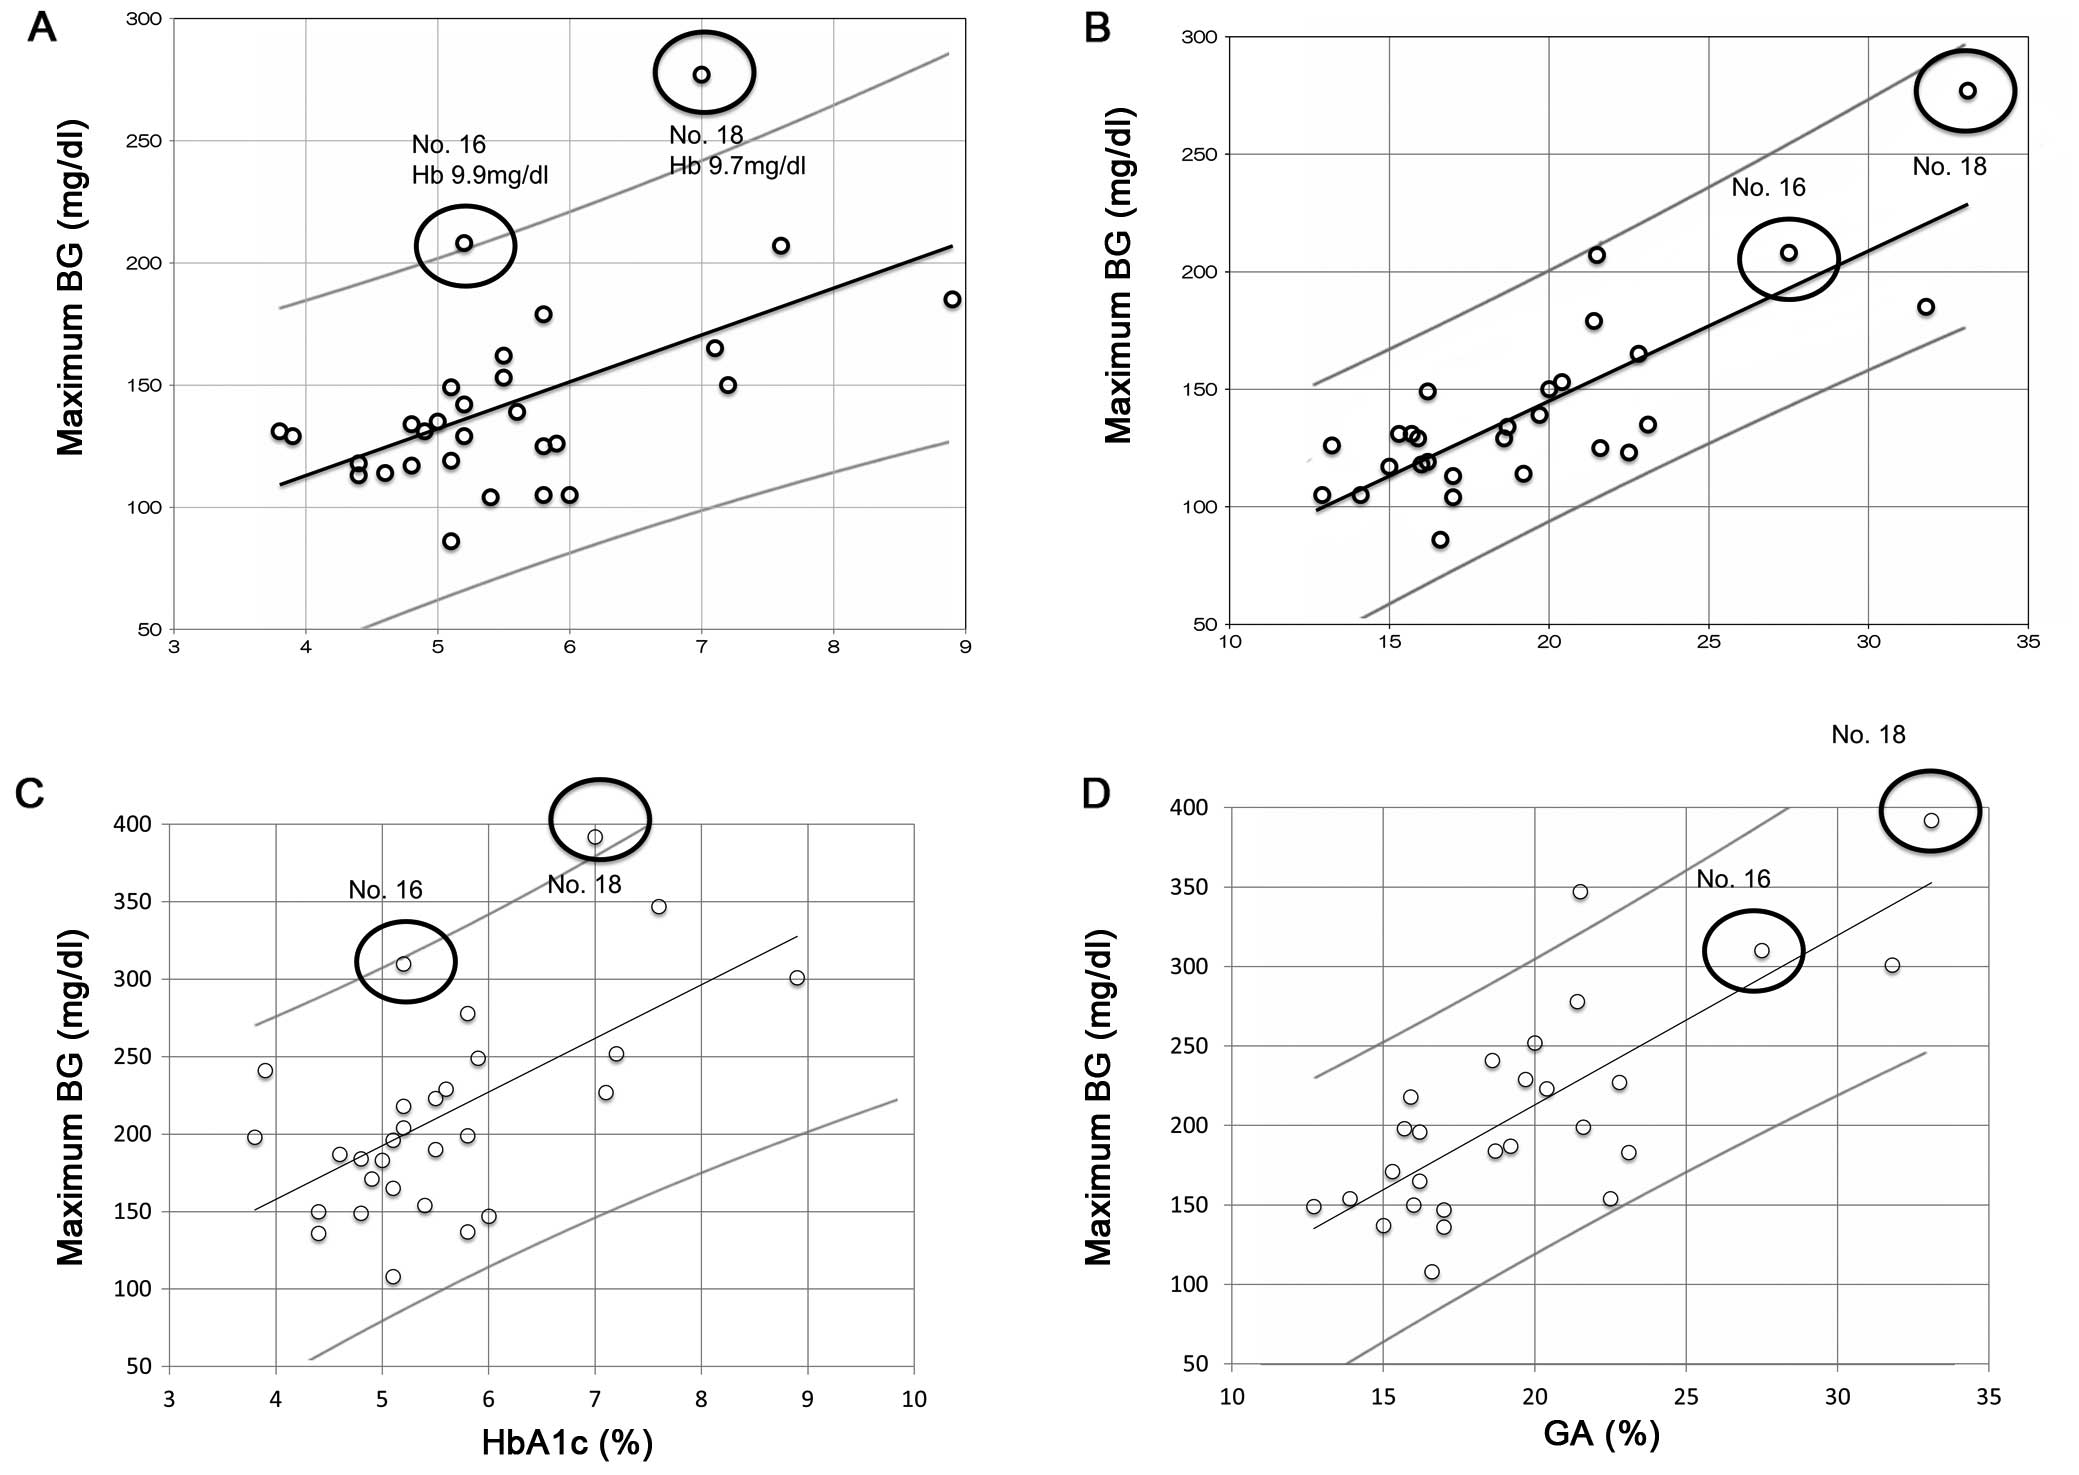 | Figure 1.Correlations between average BG and
(A) HbA1c (r=0.447, P=0.015) and (B) GA (r=0.687, P<0.001)
concentrations, and between maximum BG and (C) HbA1c (r=0.523,
P=0.004) and (D) GA (r=0.648, P<0.001) concentrations. Open dots
indicate each individual, black lines show the correlation
regression line and gray lines indicate 95% confidential intervals.
The two black circles in (A) indicate outliers with severe anemia.
Hb concentrations were 9.9 g/dl in patient 16 and 9.7 g/dl in
p-atient 18. BG, blood glucose; HbA1c, glycated hemoglobin; GA,
glycated albumin; Hb, hemoglobin. |
The correlations of HbA1c and GA with maximum BG are
shown in Fig. 1C and D, respectively.
Both HbA1c (r=0.523, P=0.004) and GA (r=0.648, P=0.001)
concentrations revealed significant positive correlations with
maximum BG. One outlier in the correlation between HbA1c and
average BG (patient 18) was also an outlier in the correlation
between HbA1c and maximum BG (Fig.
1C), however, not in the correlation between GA and maximum BG
(Fig. 1D).
Comparison between average BG obtained
from CGMS and prediction formula
The present study also compared the average BG
calculated from HbA1c and GA using the formulas derived from
patients with type 2 diabetes (10,13) and the
average BG obtained from CGMS. The regression line between HbA1c
and average BG, obtained from CGMS, was above the regression line
between HbA1c and average BG calculated using the formula derived
from patients with type 2 diabetes (Fig.
2A). By contrast, the regression line between GA and average BG
obtained from CGMS was below the regression line obtained between
GA and average BG calculated using the above formula (Fig. 2B). These findings suggested that HbA1c
significantly underestimated (112.3±32.2 mg/dl) and GA
significantly overestimated (160.3±30.9 mg/dl) average BG in
patients with LC relative to the BG determined with CGMS
(142.0±38.7 mg/dl). Differences between the average BG obtained
with CGMS and the average BG calculated from HbA1c and GA are shown
in Table IV. It was revealed that the
modified formulas were better able to predict average BG from HbA1c
and GA in patients with LC.
| Table IV.Comparison between average BG
measured on CGMS and calculated from HbA1c and GA. |
Table IV.
Comparison between average BG
measured on CGMS and calculated from HbA1c and GA.
| CGMS measured | Factor used in
prediction | Prediction
formula | Modified prediction
formula |
|---|
| 142±38.7 | HbA1c |
112.3±32.2a | 142.8±21.6 |
|
| GA |
160.3±30.9a | 141.8±32.7 |
Discussion
CGMS can monitor glucose metabolism continuously and
more precisely than SMBG. Indeed, CGMS in the 30 patients included
in the present study revealed that 19 patients had average BG
>126 mg/dl and 13 exhibited a maximum BG >200 mg/dl. By
contrast, only three patients had fasting glucose >126 mg/dl,
only four had HbA1c >6.5% and 11 had GA >20%, indicating that
CGMS is more sensitive compared with these other, fixed in
detecting disorders of glucose metabolism in patients with LC.
Using CGMS to evaluate glycemic parameters, the present study
tested our hypothesis that HbA1c and GA may predict abnormal
glucose tolerance in patients with LC. As expected, HbA1c and GA
correlated significantly with average BG, as determined by CGMS,
with GA showing a more significant correlation with average BG
compared with other glycemic parameters, including HbA1c, 1,5-AG
and FPG. In addition, anemia, which caused outliers in the
correlation between HbA1c and average BG, had no effect on the
correlation between GA and average BG.
Despite these significant correlations of GA and
HbA1c with average BG measured on CGMS, there were differences
between the latter and average BG calculated from formulas based on
HbA1c and GA. Specifically, the formula based on HbA1c tended to
underestimate and the formula based on GA tended to overestimate
average BG relative to that determined by CGMS. These formulas,
however, were derived from patients with type 2 diabetes and may be
appropriate for patients with LC, in whom the half-life of
erythrocytes is shorter and the half-life of ALB longer compared
with that in non-LC patients (10).
Since CGMS is impractical in all patients with LC, due to its
invasiveness, costs and limited quality of life during monitoring,
formulas are required to more accurately calculate average BG from
HbA1c and GA concentrations. Based on the CGMS data, the present
study determined more accurate formulas for calculating average BG
from HbA1c [average BG=19.2 × HbA1c (%)+36.5] and GA [average
BG=6.6 × GA (%)+13.0] concentrations.
Viable hepatocytes store glucose as glycogen and
prevent rapid increase of postprandial BG level. A reduction in the
number of viable hepatocytes, as in LC, reduces glycogen capacity
in the liver, increasing circulating glucose concentrations and
postprandial hyperglycemia. Gluconeogenesis in the liver is also
reduced, resulting in hypoglycemia while fasting. Hypoglycemia with
lack of glycogen causes the catabolism of fat and skeletal muscle
and can lead to sarcopenia (15,16).
Since cirrhotic patients have the shunt from the
portal vein to the systemic circulation, glucose and insulin in the
portal vein flow into the systemic circulation, bypassing liver
cells. This leads to hyperglycemia and hyperinsulinemia after
meals. Hyperinsulinemia downregulates the expression of insulin
receptors in peripheral tissues, inducing insulin resistance
(17–22). Therefore, glucose homeostasis in
patients with LC differs greatly from that in healthy individuals.
Specific management of glucose tolerance is therefore required in
individuals with LC.
Abnormal glucose tolerance has been reported to
affect the pathogenesis and prognosis of LC. Diabetes increases the
risk of hepatocellular failure and the mortality rate in patients
with LC (23–25). Diabetes in LC also increases the risk
of complications of LC, including hepatic enteropathy, spontaneous
bacterial peritonitis and rupture of esophageal varices (26–29).
Diabetes and glucose intolerance in individuals with LC must
therefore be controlled more carefully. The findings presented in
the present study may assist with improving the pathogenesis and
prognosis of LC.
Previous reports have investigated glucose
metabolism in chronic liver diseases with CGMS (30–32).
Kawaguchi et al revealed that 50% of the patients with
compensate LC exhibited nocturnal hypoglycemia concomitant with
higher serum-free fatty acid level compared with the patients
without nocturnal hypoglycemia (30).
In the patients with biopsy-proven NASH, it was determined by CGMS
that median glucose levels, standard deviation of glucose levels
and maximum glucose levels were significantly higher in the
patients with advanced liver fibrosis (31). CGMS enables us to analyze a specific
and unusual glucose homeostasis of chronic liver disease, as well
as diabetes and various disease states (32).
The limitations of the present study included the
performance of CGMS in patients while hospitalized. Measurements of
HbA1c and GA indicated glycemic control in these patients prior to
hospitalization, indicating that patient lifestyle differed greatly
prior to and following hospitalization, an important limitation
when comparing glycemic markers with CGMS parameters.
Another limitation was the differences in etiology
of LC in this patient cohort, particularly since HCV and NASH cause
impaired glucose tolerance without liver fibrosis. Due to the
limited number of patients in the present study, it was difficult
to compare differences in glucose intolerance among the subgroups
of patients with different etiologies of LC.
In conclusion, HbA1c and GA exhibited good
correlation with the average BG and maximum BG, as evaluated by
CGMS. The modified prediction formulas developed revealed improved
accuracy compared with previous formulas in estimating average BG
from HbA1c and GA in patients with LC. The use of these formulas
may contribute to control of glycemia in patients with LC.
Acknowledgements
The authors would like to thank the hospital staff
for their valuable assistance in data collection. The authors would
also like to thank Professor Kyuichi Tanikawa (International
Institute for Liver Research) and the entire medical staff at Saga
University Hospital and Eguchi Hospital (Japan) for their excellent
advice. The present study was funded by a Grant-in-Aid from the
Ministry of Education, Culture, Sports, Science and Technology (no.
22590741).
Glossary
Abbreviations
Abbreviations:
|
HbA1c
|
hemoglobin A1c
|
|
GA
|
glycated albumin
|
|
LC
|
liver cirrhosis
|
|
CGMS
|
continuous glucose monitoring
system
|
|
BH
|
blood glucose
|
|
SMBG
|
self-monitoring of blood glucose
|
References
|
1
|
Kruszynska YT, Home PD and McIntyre N:
Relationship between insulin sensitivity, insulin secretion and
glucose tolerance in cirrhosis. Hepatology. 14:103–111. 1991.
View Article : Google Scholar : PubMed/NCBI
|
|
2
|
Megyesi C, Samols E and Marks V: Glucose
tolerance and diabetes in chronic liver disease. Lancet.
2:1051–1056. 1967. View Article : Google Scholar : PubMed/NCBI
|
|
3
|
Gillett MJ: International Expert Committee
report on the role of the A1c assay in the diagnosis of diabetes:
Diabetes Care 2009; 32(7): 1327–1334. Clin Biochem Rev. 30:197–200.
2009.PubMed/NCBI
|
|
4
|
Seino Y, Nanjo K, Tajima N, Kadowaki T,
Kashiwagi A, Araki E, Ito C, Inagaki N, Iwamoto Y, Kasuga M, et al:
Committee of the Japan Diabetes Society on the Diagnostic Criteria
of Diabetes Mellitus: Report of the committee on the classification
and diagnostic criteria of diabetes mellitus. J Diabetes Investig.
1:212–228. 2010. View Article : Google Scholar : PubMed/NCBI
|
|
5
|
Garlick RL and Mazer JS: The principal
site of nonenzymatic glycosylation of human serum albumin in vivo.
J Biol Chem. 258:6142–6146. 1983.PubMed/NCBI
|
|
6
|
Day JF, Ingebretsen CG, Ingebretsen WR Jr,
Baynes JW and Thorpe SR: Nonenzymatic glucosylation of serum
proteins and hemoglobin: Response to changes in blood glucose
levels in diabetic rats. Diabetes. 29:524–527. 1980. View Article : Google Scholar : PubMed/NCBI
|
|
7
|
Koga M, Kasayama S, Kanehara H and Bando
Y: CLD (chronic liver diseases)-HbA1C as a suitable indicator for
estimation of mean plasma glucose in patients with chronic liver
diseases. Diabetes Res Clin Pract. 81:258–262. 2008. View Article : Google Scholar : PubMed/NCBI
|
|
8
|
Sterling K: The turnover rate of serum
albumin in man as measured by I131-tagged albumin. J Clin Invest.
30:1228–1237. 1951. View Article : Google Scholar : PubMed/NCBI
|
|
9
|
Boyne MS, Silver DM, Kaplan J and Saudek
CD: Timing of changes in interstitial and venous blood glucose
measured with a continuous subcutaneous glucose sensor. Diabetes.
52:2790–2794. 2003. View Article : Google Scholar : PubMed/NCBI
|
|
10
|
Nathan DM, Kuenen J, Borg R, Zheng H,
Schoenfeld D and Heine RJ: Alc-Derived Average Glucose Study Group:
Translating the A1C assay into estimated average glucose values.
Diabetes Care. 31:1473–1478. 2008. View Article : Google Scholar : PubMed/NCBI
|
|
11
|
Bedossa P: The French METAVIR Cooperative
Study Group: Intraobserver and interobserver variations in liver
biopsy interpretation in patients with chronic hepatitis C.
Hepatology. 20:15–20. 1994. View Article : Google Scholar : PubMed/NCBI
|
|
12
|
Brunt EM, Janney CG, Di Bisceglie AM,
Neuschwander-Tetri BA and Bacon BR: Nonalcoholic steatohepatitis: A
proposal for grading and staging the histological lesions. Am J
Gastroenterol. 94:2467–2474. 1999. View Article : Google Scholar : PubMed/NCBI
|
|
13
|
Inoue K, Tsujimoto T, Yamamoto-Honda R,
Goto A, Kishimoto M, Noto H, Kajio H, Doi S, Miyazaki S, Terauchi
Y, et al: A newer conversion equation for the correlation between
HbA1c and glycated albumin. Endocr J. 61:553–560. 2014. View Article : Google Scholar : PubMed/NCBI
|
|
14
|
Kanda Y: Investigation of the freely
available easy-to-use software ‘EZR’ for medical statistics. Bone
Marrow Transplant. 48:452–458. 2013. View Article : Google Scholar : PubMed/NCBI
|
|
15
|
Petersen KF, Krssak M, Navarro V,
Chandramouli V, Hundal R, Schumann WC, Landau BR and Shulman GI:
Contributions of net hepatic glycogenolysis and gluconeogenesis to
glucose production in cirrhosis. Am J Physiol. 276:E529–E535.
1999.PubMed/NCBI
|
|
16
|
Tajika M, Kato M, Mohri H, Miwa Y, Kato T,
Ohnishi H and Moriwaki H: Prognostic value of energy metabolism in
patients with viral liver cirrhosis. Nutrition. 18:229–234. 2002.
View Article : Google Scholar : PubMed/NCBI
|
|
17
|
Imano E, Kanda T, Nakatani Y, Motomura M,
Arai K, Matsuhisa M, Yamasaki Y and Hori M: Impaired splanchnic and
peripheral glucose uptake in liver cirrhosis. J Hepatol.
31:469–473. 1999. View Article : Google Scholar : PubMed/NCBI
|
|
18
|
Nielsen MF, Caumo A, Aagaard NK,
Chandramouli V, Schumann WC, Landau BR, Schmitz O and Vilstrup H:
Contribution of defects in glucose uptake to carbohydrate
intolerance in liver cirrhosis: Assessment during physiological
glucose and insulin concentrations. Am J Physiol Gastrointest Liver
Physiol. 288:G1135–G1143. 2005. View Article : Google Scholar : PubMed/NCBI
|
|
19
|
Petrides AS, Stanley T, Matthews DE, Vogt
C, Bush AJ and Lambeth H: Insulin resistance in cirrhosis:
Prolonged reduction of hyperinsulinemia normalizes insulin
sensitivity. Hepatology. 28:141–149. 1998. View Article : Google Scholar : PubMed/NCBI
|
|
20
|
Cusin I, Terrettaz J, Rohner-Jeanrenaud F
and Jeanrenaud B: Metabolic consequences of hyperinsulinaemia
imposed on normal rats on glucose handling by white adipose tissue,
muscles and liver. Biochem J. 267:99–103. 1990. View Article : Google Scholar : PubMed/NCBI
|
|
21
|
Heaton JH and Gelehrter TD:
Desensitization of hepatoma cells to insulin action. Evidence for a
post-receptor mechanism. J Biol Chem. 256:12257–12262.
1981.PubMed/NCBI
|
|
22
|
Wardzala LJ, Hirshman M, Pofcher E, Horton
ED, Mead PM, Cushman SW and Horton ES: Regulation of glucose
utilization in adipose cells and muscle after long-term
experimental hyperinsulinemia in rats. J Clin Invest. 76:460–469.
1985. View Article : Google Scholar : PubMed/NCBI
|
|
23
|
Bianchi G, Marchesini G, Zoli M, Bugianesi
E, Fabbri A and Pisi E: Prognostic significance of diabetes in
patients with cirrhosis. Hepatology. 20:119–125. 1994. View Article : Google Scholar : PubMed/NCBI
|
|
24
|
Nishida T, Tsuji S, Tsujii M, Arimitsu S,
Haruna Y, Imano E, Suzuki M, Kanda T, Kawano S, Hiramatsu N, et al:
Oral glucose tolerance test predicts prognosis of patients with
liver cirrhosis. Am J Gastroenterol. 101:70–75. 2006. View Article : Google Scholar : PubMed/NCBI
|
|
25
|
Moreau R, Delègue P, Pessione F, Hillaire
S, Durand F, Lebrec D and Valla DC: Clinical characteristics and
outcome of patients with cirrhosis and refractory ascites. Liver
Int. 24:457–464. 2004. View Article : Google Scholar : PubMed/NCBI
|
|
26
|
Jepsen P, Watson H, Andersen PK and
Vilstrup H: Diabetes as a risk factor for hepatic encephalopathy in
cirrhosis patients. J Hepatol. 63:1133–1138. 2015. View Article : Google Scholar : PubMed/NCBI
|
|
27
|
Wlazlo N, van Greevenbroek MM, Curvers J,
Schoon EJ, Friederich P, Twisk JW, Bravenboer B and Stehouwer CD:
Diabetes mellitus at the time of diagnosis of cirrhosis is
associated with higher incidence of spontaneous bacterial
peritonitis, but not with increased mortality. Clin Sci (Lond).
125:341–348. 2013. View Article : Google Scholar : PubMed/NCBI
|
|
28
|
Ariza X, Castellote J, Lora-Tamayo J,
Girbau A, Salord S, Rota R, Ariza J and Xiol X: Risk factors for
resistance to ceftriaxone and its impact on mortality in community,
healthcare and nosocomial spontaneous bacterial peritonitis. J
Hepatol. 56:825–832. 2012. View Article : Google Scholar : PubMed/NCBI
|
|
29
|
Cheruvattath R and Balan V: Infections in
patients with end-stage liver disease. J Clin Gastroenterol.
41:403–411. 2007. View Article : Google Scholar : PubMed/NCBI
|
|
30
|
Kawaguchi T, Itou M, Taniguchi E, Sakata
M, Abe M, Koga H, Oriishi T, Imamura Y, Kato T, Yamada K, et al:
Serum level of free fatty acids is associated with nocturnal
hypoglycemia in cirrhotic patients with HCV infection: A pilot
study. Hepatogastroenterology. 58:103–108. 2011.PubMed/NCBI
|
|
31
|
Hashiba M, Ono M, Hyogo H, Ikeda Y, Masuda
K, Yoshioka R, Ishikawa Y, Nagata Y, Munekage K, Ochi T, et al:
Glycemic variability is an independent predictive factor for
development of hepatic fibrosis in nonalcoholic fatty liver
disease. PLoS One. 8:e761612013. View Article : Google Scholar : PubMed/NCBI
|
|
32
|
Kishimoto M and Noda M: Verification of
glycemic profiles using continuous glucose monitoring: Cases with
steroid use, liver cirrhosis, enteral nutrition, or late dumping
syndrome. J Med Invest. 62:1–10. 2015. View
Article : Google Scholar : PubMed/NCBI
|